Proton Content and Nature in Perovskite Ceramic Membranes for Medium Temperature Fuel Cells and Electrolysers


Abstract
:1. Introduction
2. Results and Discussion
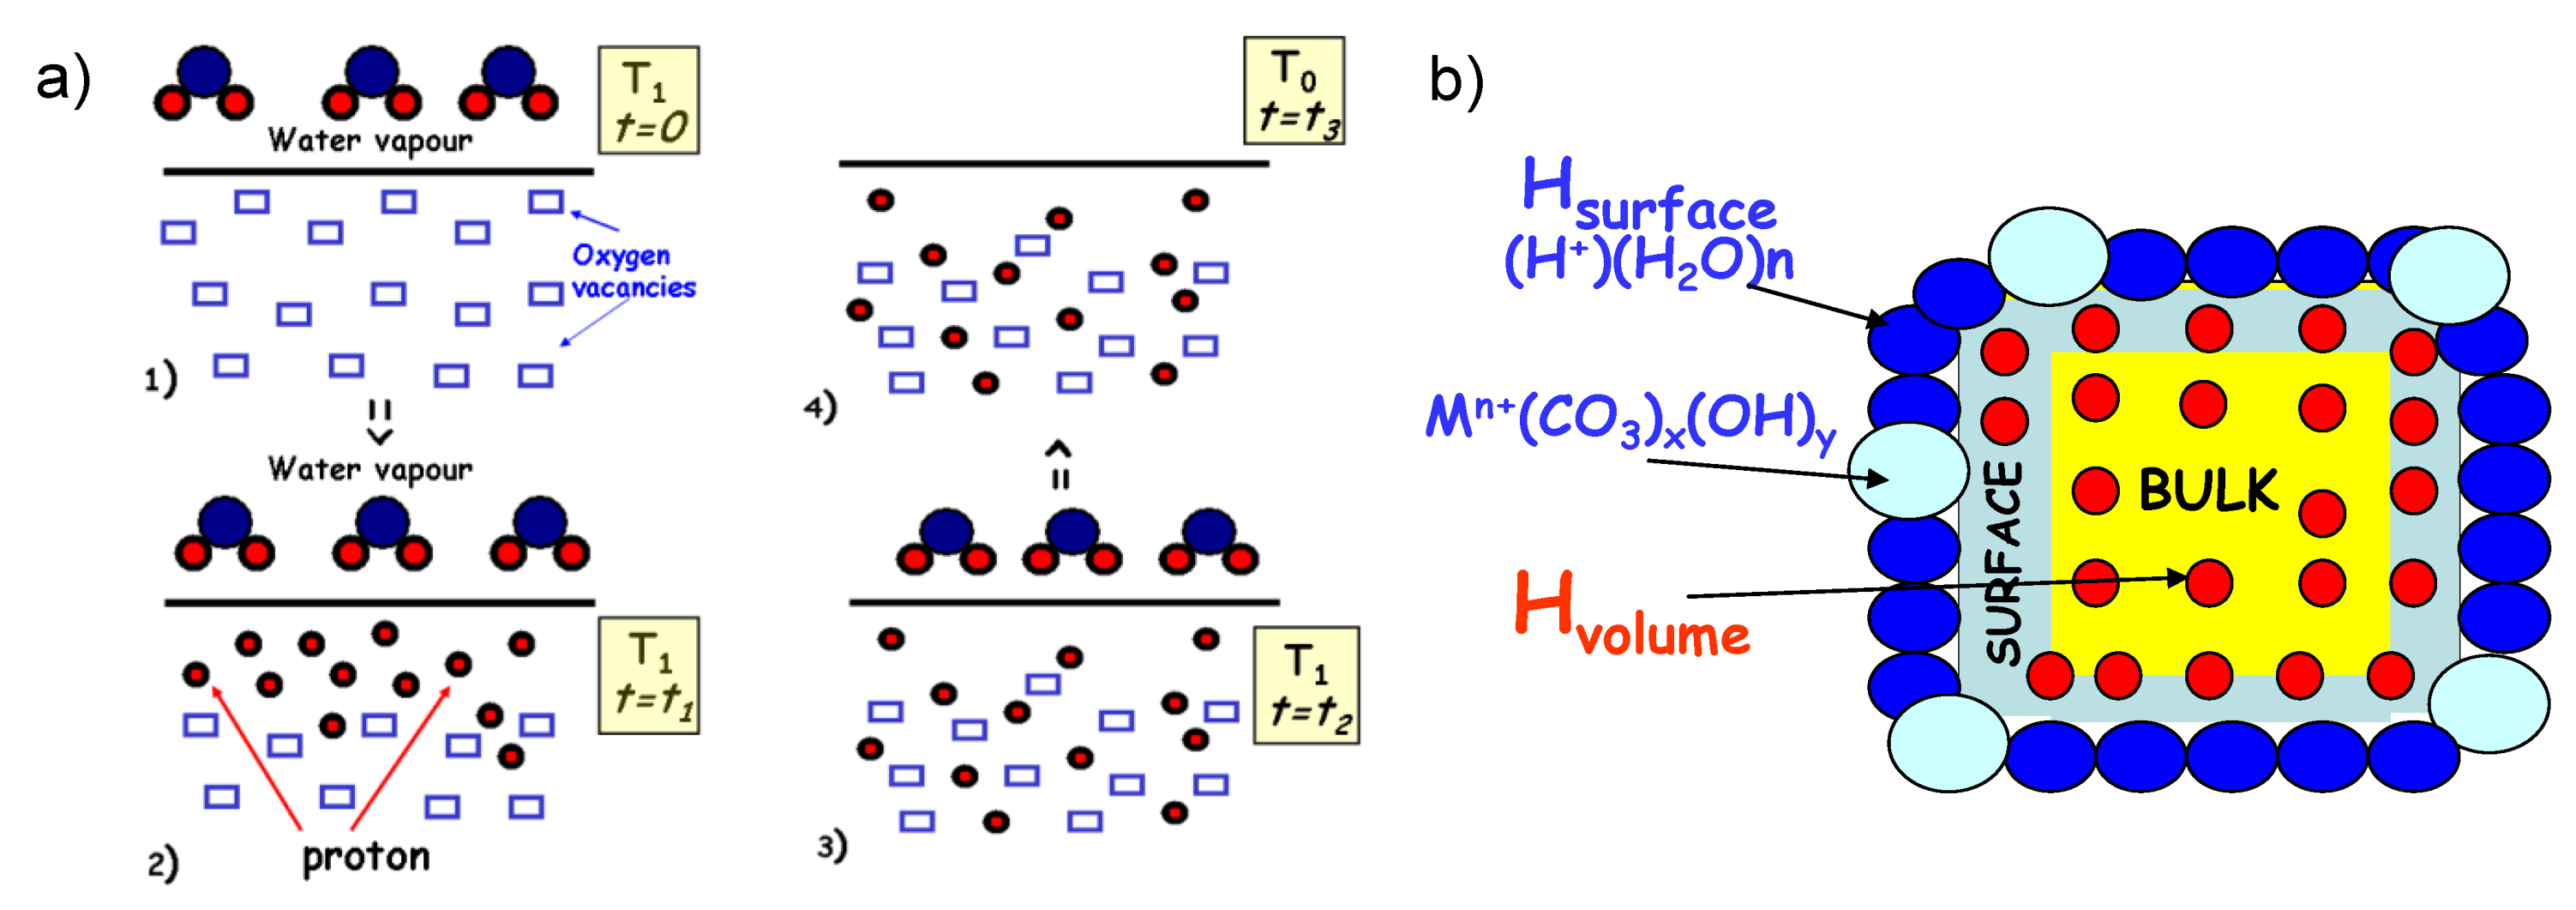
2.1. Towards Understanding of the Protonation Process

| Ceramic | BZI | SZYb | SZYb | SZYb | BZYb | BZYb |
|---|---|---|---|---|---|---|
| density | < 90% | ~ 99% | ~ 94% | ~ 99% | ~ 98% | ~ 98% |
| Phase | Traces of 2nd phases | pure | pure | pure | pure | pure |
| Water type | decarbonated | decarbonated | decarbonated | Non-decarbonated | decarbonated | Non-decarbonated |
| Protonationconditions | 300 °C | 500 °C | 200 °C | 200 °C | 250 °C | 200 °C |
| 80 bar pH2O | 80 bar pH2O | 15 bar pH2O | 15 bar pH2O | 40 bar pH2O | 15 bar pH2O | |
| 96 h | 96 h | 96 h | 200 h | 72 h | 550 h | |
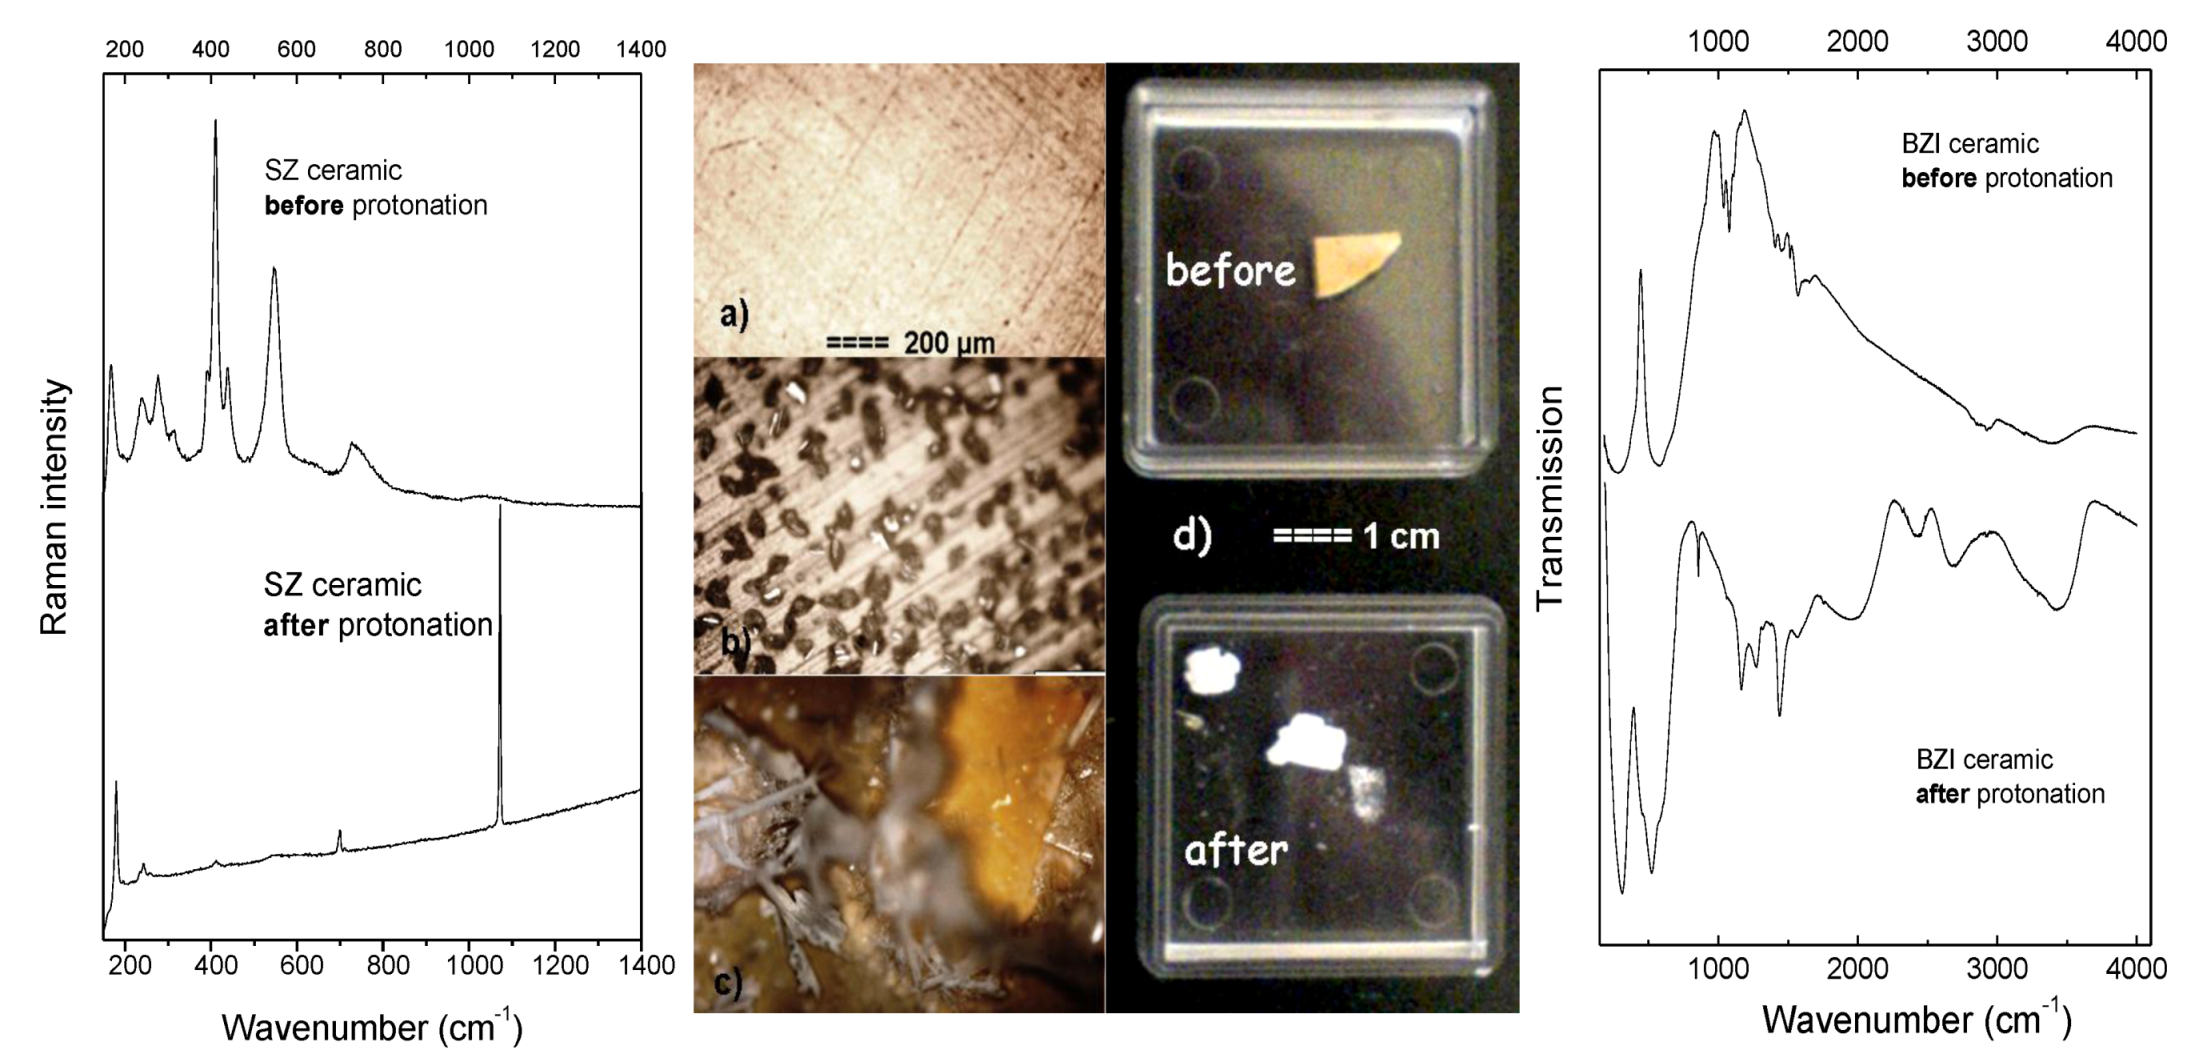
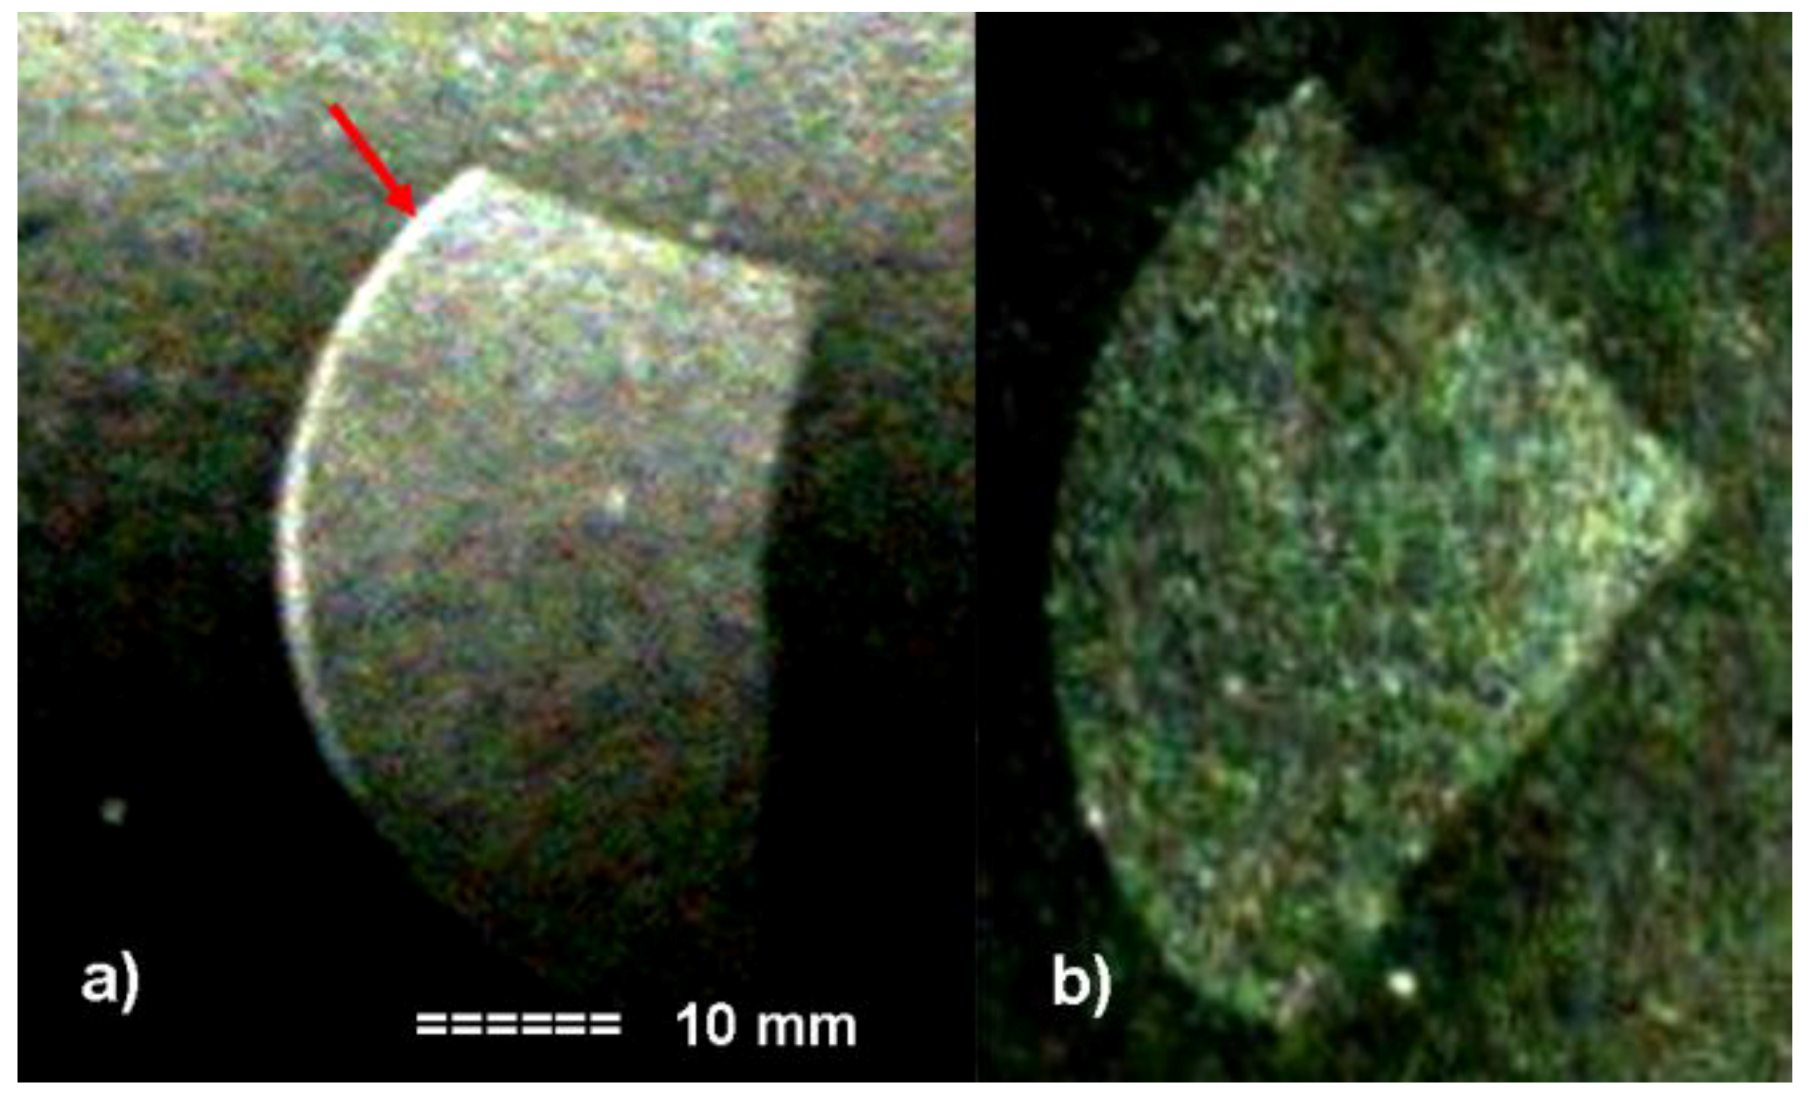
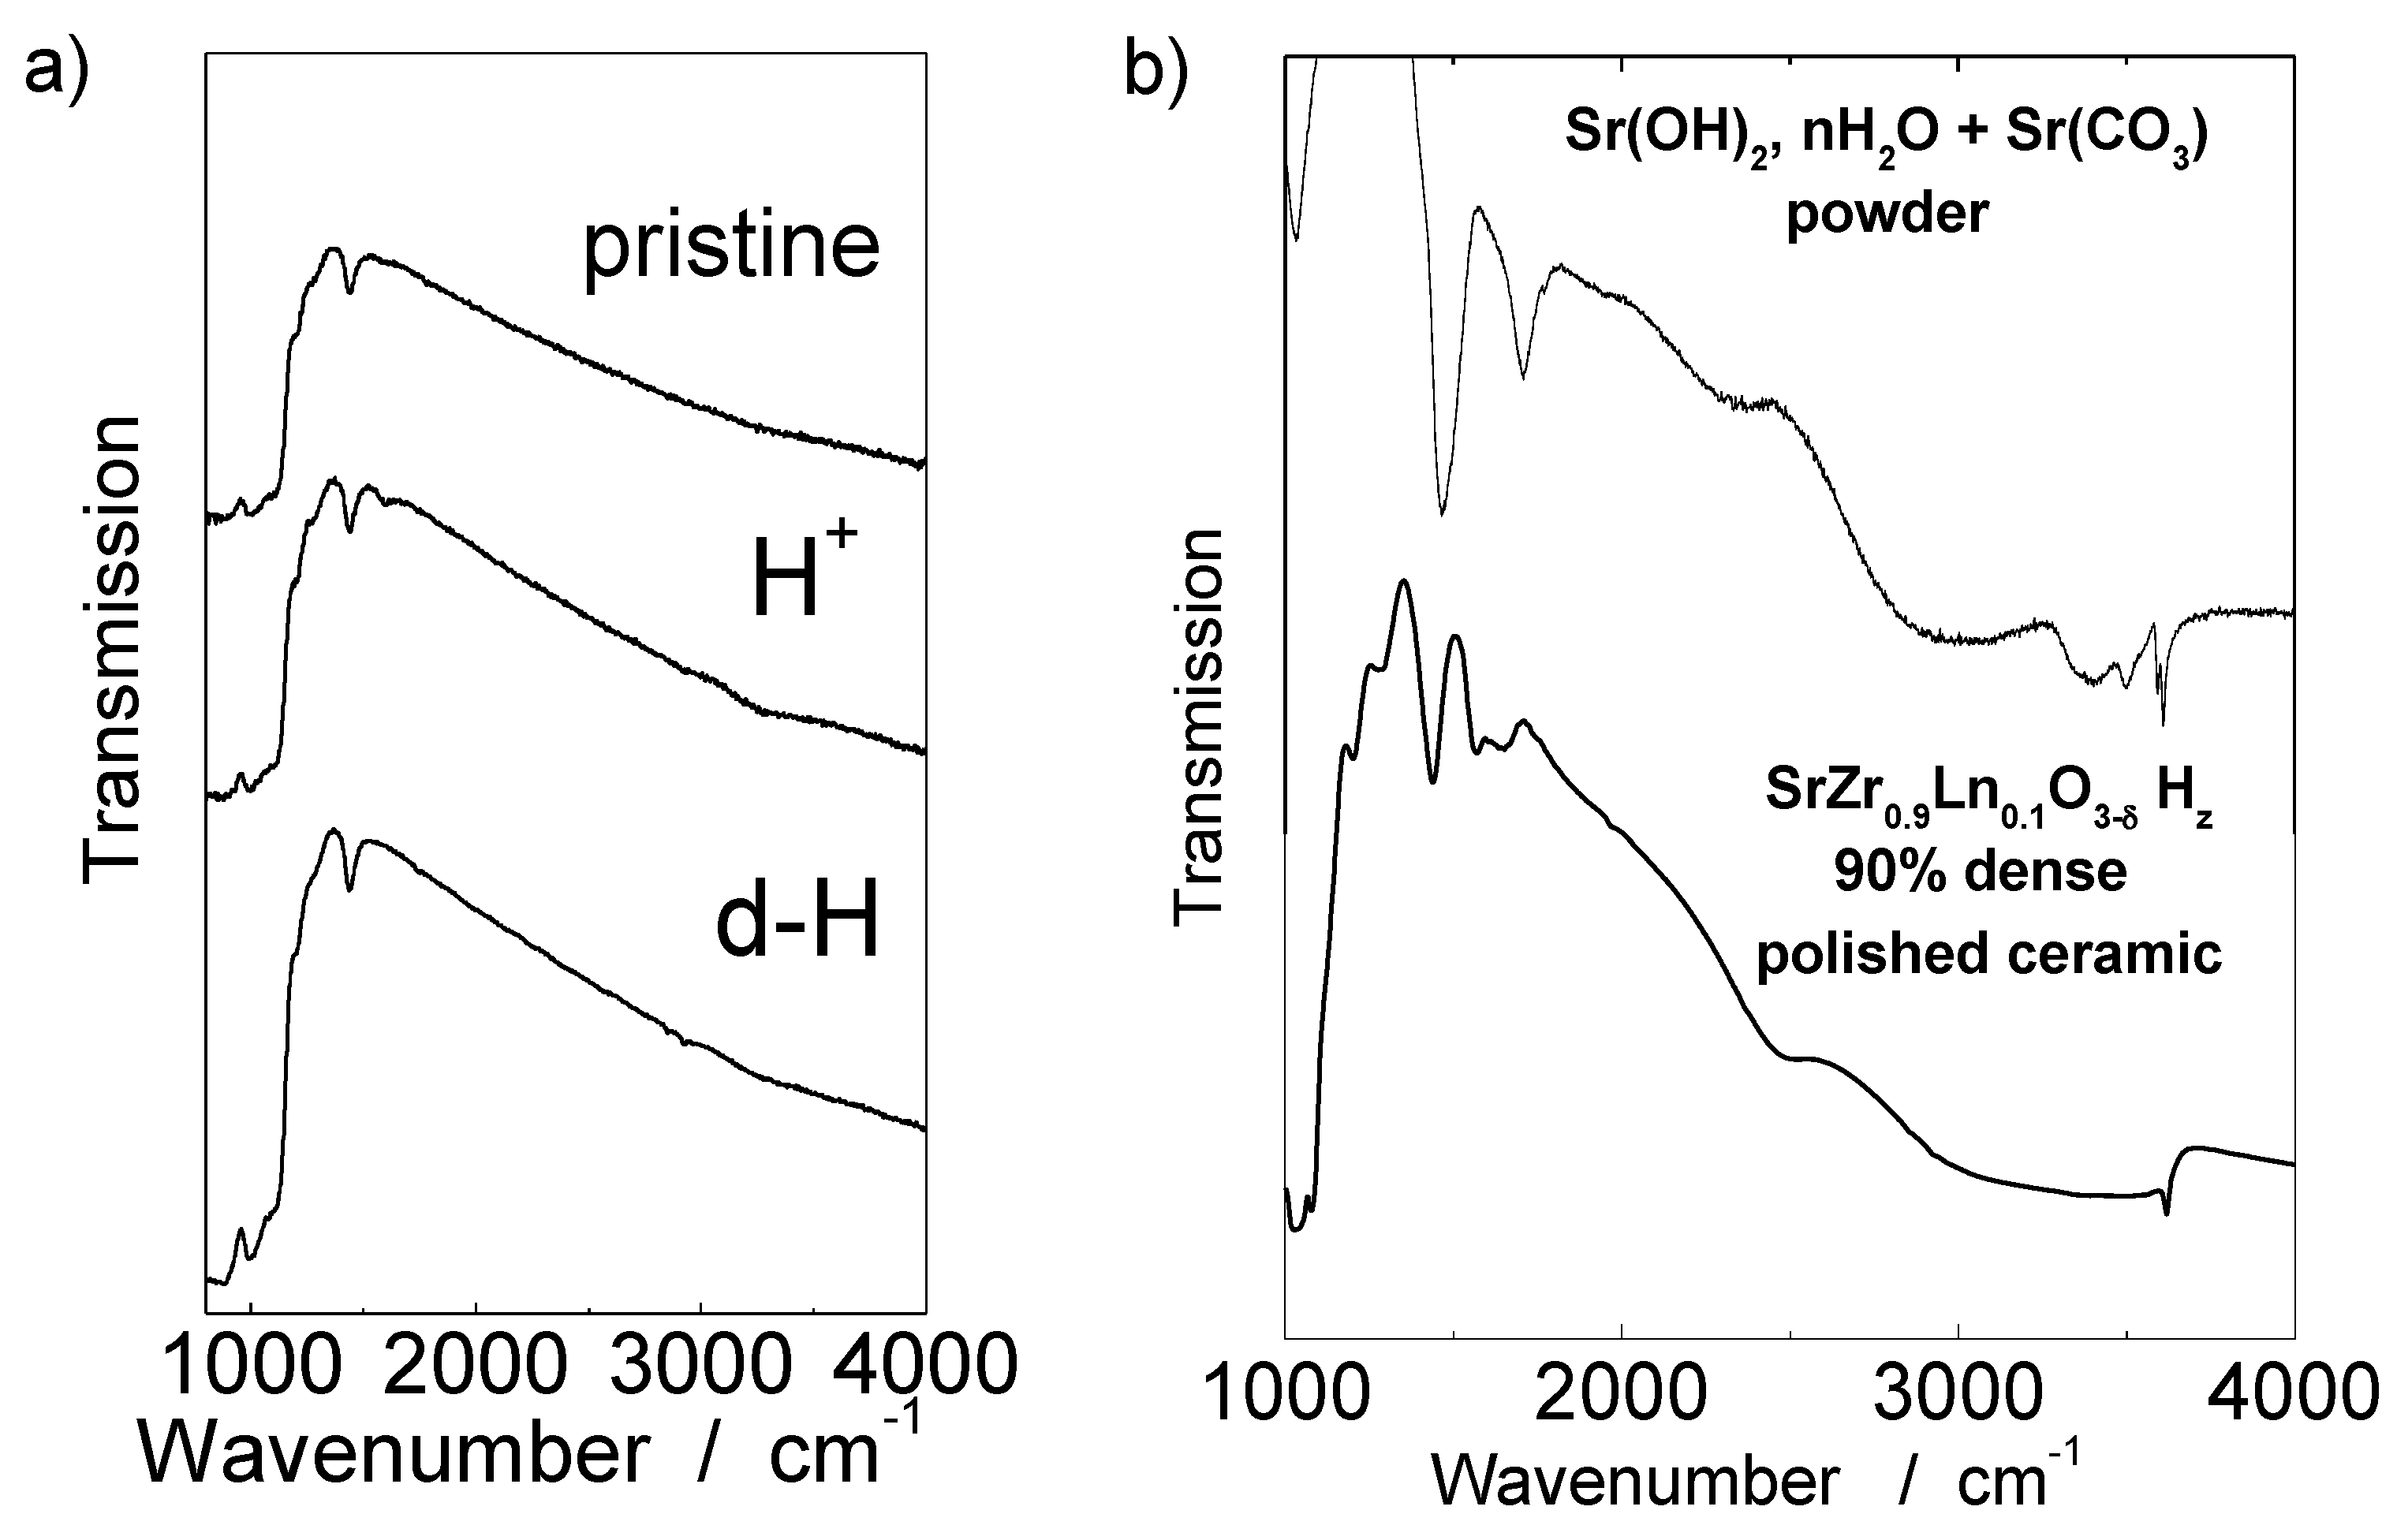
| Remark | Crumbling (Figure 2d) | Homogeneous surface-core proton distribution (Figure 5b) | IR spectrum (Figure 7b) | SrCO3 crystals on surface (Figure 2b) | Protons near surface (Figure 5a) | SrCO3 crystals and hydroxides on surface (Figure 2c) |
| IR spectrum (Figure 7a) | ||||||
| Proton content Surface & bulk | – | SrZr0.9Yb0.1O3-δ H0.005, 0.0008H2O | SrZr0.9Yb0.1O3-δ H0.002, 005H2O | – | – | – |
| Compound | Raman (R) and IR vibrational signature (cm−1) | ||
|---|---|---|---|
| Lattice & deformation modes | νCO3 modes | νOH modes | |
| SrCO3 | R 106, 148, 181, 244, 697 | 1071, 1450 | – |
| IR 700, 857 | 1071, 1480 | – | |
| Sr(OH)2 | R | – | 3592, 3606 |
| IR | – | 3592, 3606 | |
| Sr(OH)2 0.3H2O | R | – | 3488, 3500, 3592, 3618 |
| IR | – | 1710,2345,2940, 3500, 3592 | |
| Sr(OH)2 1H2O | R | – | 3297, 3488, 3594, 3610 |
| IR | – | 1710,2370,3005, 3297, 3398, 3488, 3592 | |
2.2. The Content and Distribution of Bulk Protons
| Technique | Sample | Reference |
|---|---|---|
| QNS (quasielastic neutron scattering) | SrCe0.95Yb0.05O2.985 | [33,34] |
| BaZr0.9Yb0.1O2.995 | [22] | |
| SrZr0.9Yb0.1O2.995 | [25] | |
| RBS(Rutherford backscattering spectrometry) | beta alumina | [35] |
| ERD (elastic recoil detection) | BaCe1−xYxO3−δ | [36] |
| SrCe1−xYxO3−δ | ||
| ERCS (elastic recoil coincidence spectroscopy) | BaCe0.9Y0.1O3−δ | [37] |

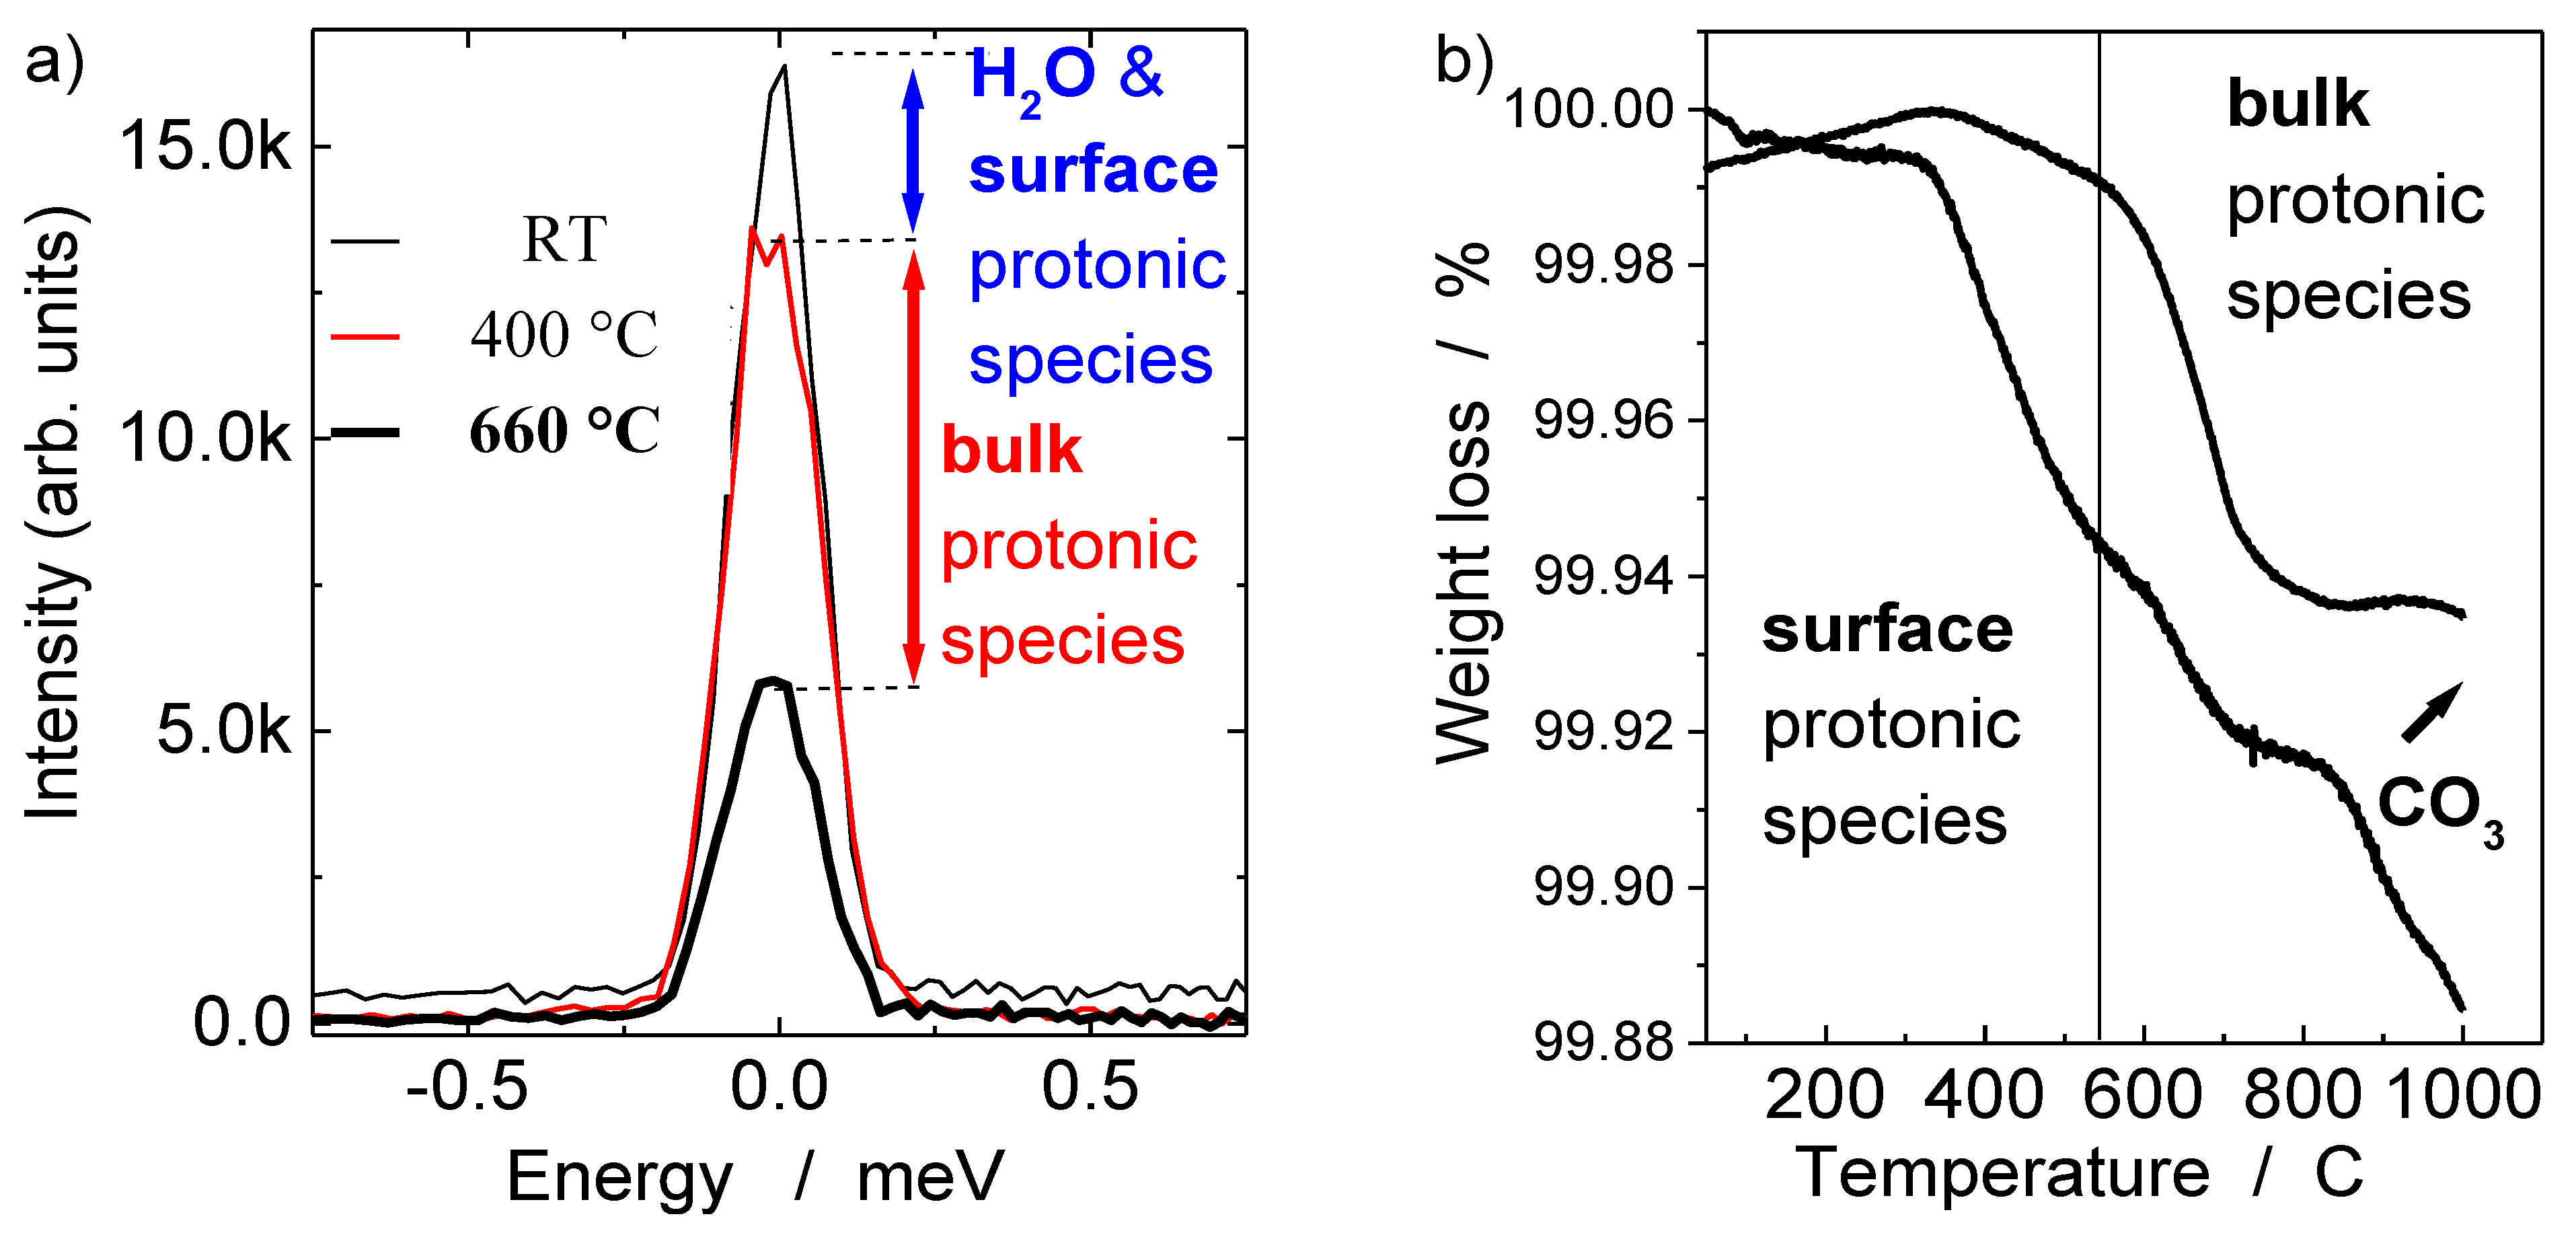
2.2.1. Bulk Proton Content by Quasi-Elastic Neutron Scattering
2.2.2. Bulk Proton Content by Thermogravimetric Analysis
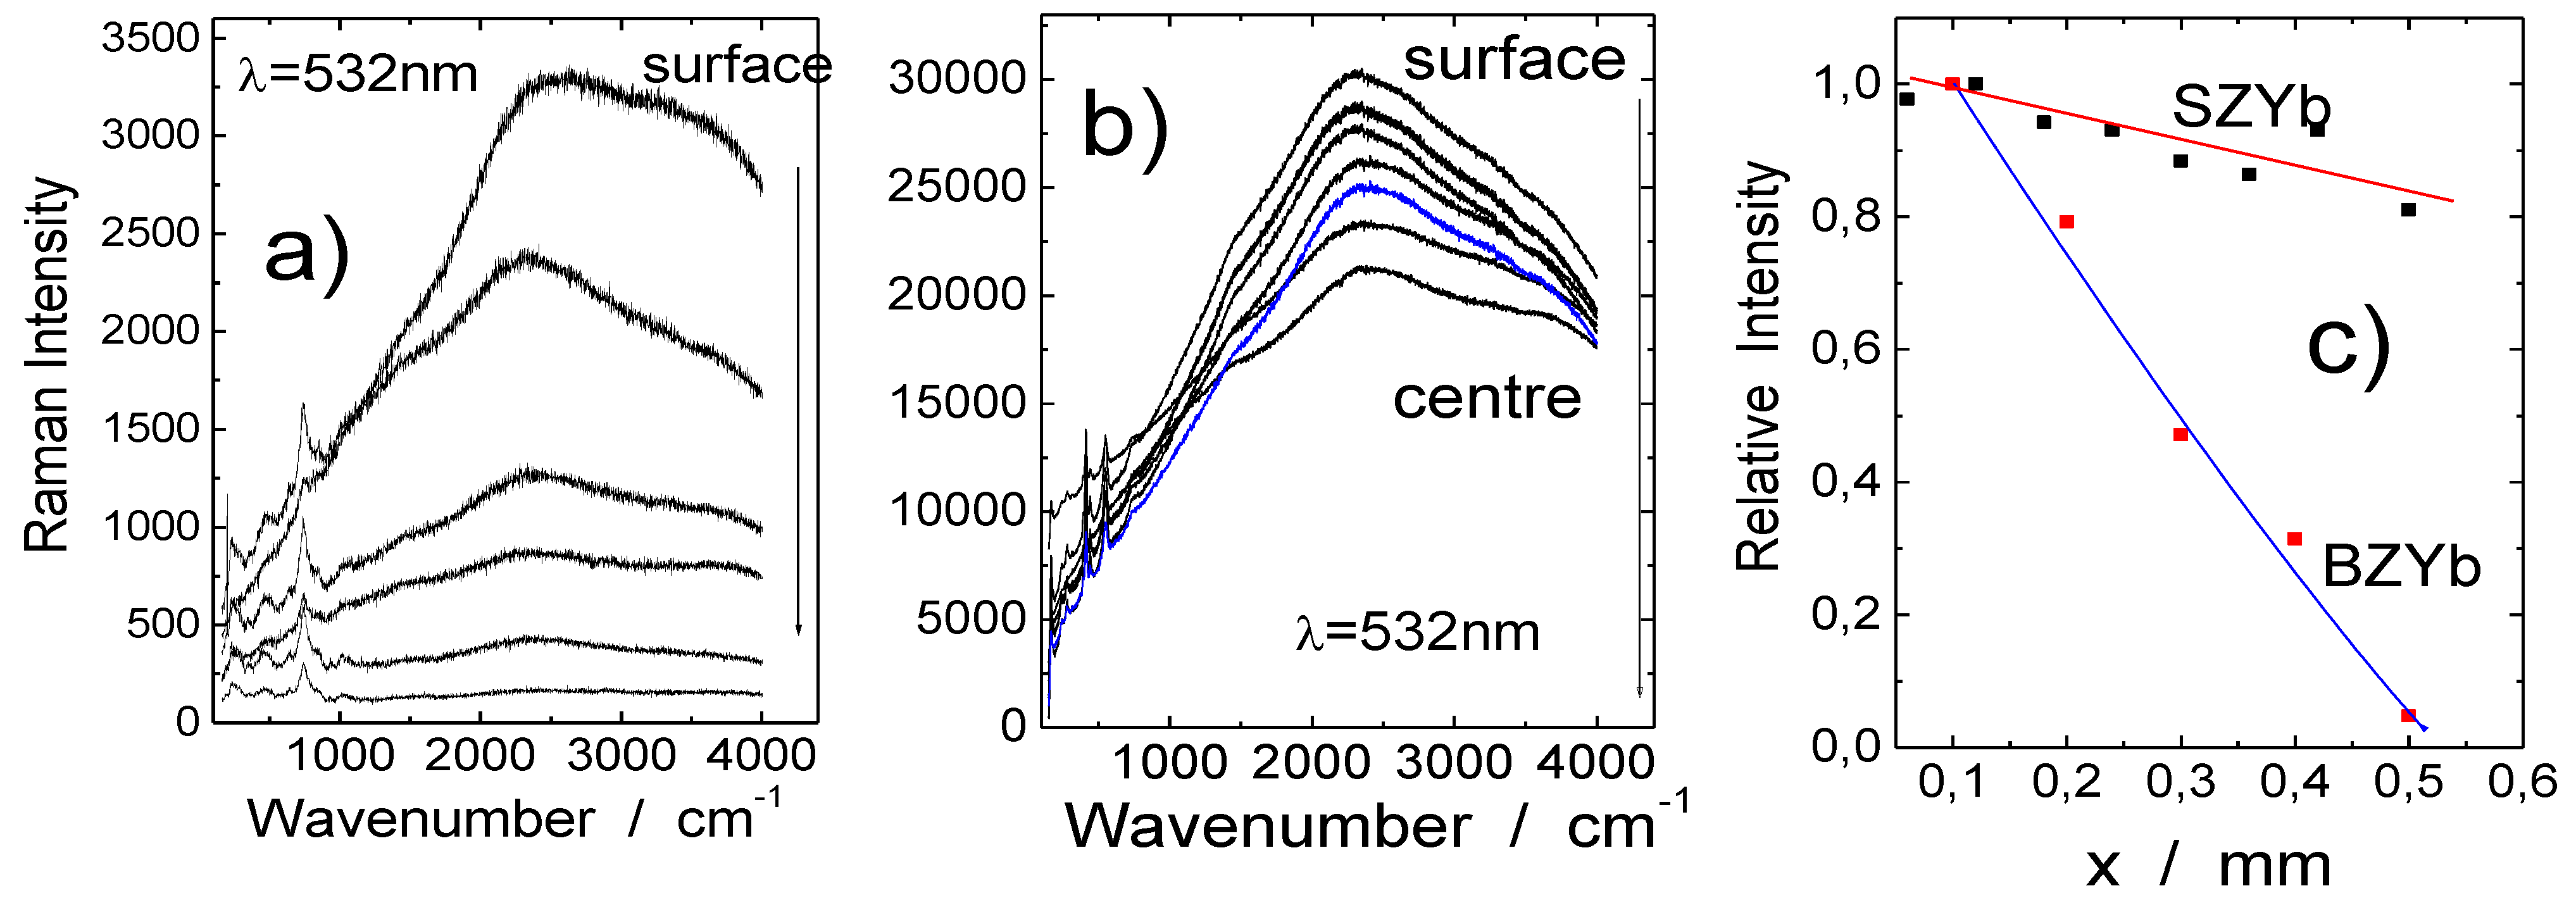
2.2.3. Distribution of Protonic Species: Raman Profilometry and Neutronography


2.3. Bulk and Surface Protonic Species—Importance of Differentiation
2.3.1. Proton Conductivity
2.3.2. Proton Site
2.3.3. What Is The True Nature of Bulk Proton?

3. Experimental Section
4. Conclusions
Acknowledgments
References
- Forrat, F.; Dauge, G.; Trevoux, P.; Danner, G.; Christan, M. Electrolyte solide a base de aila03 application aux piles a combustible (in French). Acad. Sci. Paris 1964, 259, 2813–2816. [Google Scholar]
- Iwahara, H.; Esaka, T.; Uchida, H.; Maeda, N. Proton conduction in sintered oxides and its application to steam electrolysis for hydrogen production. Solid State Ion. 1981, 3–4, 359–363. [Google Scholar] [CrossRef]
- Colomban, P. Proton Conductors Solids, Membranes and Gel–Materials and Devices; Cambridge University Press: Cambridge, UK, 1992. [Google Scholar]
- Olah, G.A. Beyond oil and gas: The methanol economy. Angew. Chem. Int. Ed. 2005, 44, 2636–2649. [Google Scholar] [CrossRef]
- Ni, M.; Leung, M.K.H.; Leung, D.Y.C. Energy and exergy analysis of hydrogen production by solid oxide steam electrolyzer plant. Int. J. Hydrog. Energy 2007, 32, 4648–4660. [Google Scholar] [CrossRef]
- Matsumoto, H.; Okada, S.; Hashimoto, S.; Sasaki, K.; Yamamoto, R.; Enoki, M.; Ishihara, T. Hydrogen separation from syngas using high-temperature proton conductors. Ionics 2007, 13, 93–99. [Google Scholar] [CrossRef]
- Malavasi, L.; Fisher, C.A.J.; Islam, M.S. Oxide-ion and proton conducting electrolyte materials for clean energy applications: Structural and mechanistic features. Chem. Soc. Rev. 2010, 39, 4370–4387. [Google Scholar] [CrossRef]
- Yahiro, H.; Eguchi, K.; Arai, H. Electrical-properties and reducibilities of ceria rare earth oxide systems and their application to solid oxide fuel-cell. Solid State Ion. 1989, 36, 71–75. [Google Scholar] [CrossRef]
- Suzuki, T.; Kosacki, I.; Anderson, H.; Colomban, P. Electrical conductivity and lattice defects in nanocrystalline cerium oxide thin films. J. Am Ceram. Soc. 2001, 84, 2007–2014. [Google Scholar]
- Blum, P.; Deporters, C.; Schouler, E. Production d’hydrogène par réduction électrochimique de la vapeur d’eau à haute température (in French). Rev. Générale Electricité tome 1976, 85, 1–8. [Google Scholar]
- Kobayashi, T.; Abe, K.; Ukyo, Y.; Matsumoto, H. Study on current efficiency of steam electrolysis using a partial protonic conductor SrZr0.9Yb0.1O3−δ. Solid State Ion. 2001, 138, 243–251. [Google Scholar] [CrossRef]
- Iwahara, H.; Uchida, H.; Yamasaki, I. High-temperature steam electrolysis using SrCeO3-based proton conductive solid electrolyte. Int. J. Hydrog. Energy 1987, 2, 73–77. [Google Scholar]
- Sala, B.; Lacroix, O.; Willemin, S.; Rhamouni, K.; Takenouti, H.; van der Lee, A.; Goeuriot, P.; Bendjeriou, B.; Colomban, P. Procédé D’optimisation de la Conduction Ionique D’une Membrane Conductrice Ionique. F.R. Patent 2,916,653, 5 December 2008. [Google Scholar]
- Nowick, A.S.; Du, Y. High-temperature protonic conductors with perovskite-related structures. Solid State Ion. 1995, 77, 137–146. [Google Scholar] [CrossRef]
- Kreuer, K.D. Proton-conducting oxides. Ann. Rev. Mater. Res. 2003, 33, 333–359. [Google Scholar] [CrossRef]
- Schober, T.; Bohn, H.G. Water vapour solubility and electrochemical characterization of the high temperature proton conductor SrZr0.9Y0.1O2.95. Solid State Ion. 2000, 127, 351–356. [Google Scholar] [CrossRef]
- Baikov, Y.M.; Gunther, W.; Gorelov, V.P.; Colomban, P.; Baddour-Hadjean, R. Hydrogen in perovskites, mechanism of solubility, chemical state, effect on electron subsystem, phase transformation. Ionics 1998, 4, 347–354. [Google Scholar] [CrossRef]
- Irvine, J.T.S.; Corcoran, D.J.D.; Lashtabeg, A.; Walton, J.C. Incorporation of molecular species into the vacancies of perovskite oxides. Solid State Ion. 2002, 154–155, 447–453. [Google Scholar] [CrossRef]
- Ricote, S.; Bonanos, N.; Caboche, G. Water vapour solubility and conductivity study of the proton conductor BaCe(0.9−x)ZrxY0.1O3−δ. Solid State Ion. 2009, 180, 990–997. [Google Scholar] [CrossRef]
- Norby, T. Protonic conduction in solids: Bulk and interfaces. In Solid State Ionics in the 21st Century MRS Bulletin; Kim, S., Yamaguchi, S., Elliot, J., Eds.; Cambridge University Press: Cambridge, UK, 2009; Volume 34, pp. 923–928. [Google Scholar]
- Colomban, P. Latest developments in proton conductors. Ann. Chim. Sci. Mater. 1999, 24, 1–18. [Google Scholar] [CrossRef]
- Colomban, P.; Slodczyk, A.; Lamago, D.; Andre, G.; Zaafrani, O.; Lacroix, O.; Willemin, S.; Sala, B. Proton dynamics and structural modifications in the protonic conductor perovskites. J. Phys. Soc. Jpn. 2010, 79A, 1–6. [Google Scholar]
- Slodczyk, A.; Colomban, P.; Willemin, S.; Lacroix, O.; Sala, B. Indirect Raman identification of the proton insertion in the high temperature [Ba/Sr][Zr/Ti]O3 modified perovskite protonic conductors. J. Raman Spectrosc. 2009, 40, 513–521. [Google Scholar] [CrossRef]
- Zaafrani, O. Protonation, Distorsions Structurales et Espèces Protoniques Dans des Perovskites Lacunaires (in French). Ph.D. Thesis, Université Pierre et Marie Curie, Paris, France, 2010. [Google Scholar]
- Slodczyk, A.; Colomban, P.; Zaafrani, O.; Lacroix, O.; Loricourt, J.; Grasset, F.; Sala, B. What is the true nature of conducting proton in perovskite ceramic membrane: Hydroxyl ion or interstitial proton? MRS Proc. 2011, 1309, mrsf10-1309-ee03-21:1–mrsf10-1309-ee03-21:6. [Google Scholar]
- Slodczyk, A.; Dabrowski, B.; Malikova, N.; Colomban, P. Origins of rapid aging of Ba-based proton conducting perovskites. MRS Proc. 2011, 1311, mrsf10-1311-gg06-25:1–mrsf10-1311-gg06-25:6. [Google Scholar]
- Colomban, P.; Slodczyk, A. The structural and dynamics neutron study of proton conductors: Difficulties and improvement procedures in protonated perovskite. J. Eur. Phys. 2012. in submit.. [Google Scholar]
- Slodczyk, A.; Tran, C.; Colomban, P. Face to face with enemy—Analysis of aqua carbonate hydroxide second surface phases in proton conducting perovskite ceramic electrolytic membrane. MRS Proc. 2012, 1384, mrsf11-1384-b13-15:1–mrsf11-1384-b13-15:6. [Google Scholar]
- Rose, B.A.; Davis, G.J.; Ellingham, H.J.T.J. Studies in the thermodynamics of metallurgical reduction process by electrochemical methods. Discuss. Faraday Soc. 1948, 4, 154–162. [Google Scholar] [CrossRef]
- Lassègues, J.C.; Fouassier, M.; Baffier, N.; Colomban, P.; Dianoux, A.J. Neutron scattering study of the proton dynamics in NH4+ and OH3+ β-alumina. J. Phys. 1980, 41, 273–280. [Google Scholar] [CrossRef]
- Lechner, R.E. Neutron investigations of superprotonic conductors. Ferroelectrics 1995, 167, 83–98. [Google Scholar] [CrossRef]
- Lowesey, S.W. Theory of Neutron Scattering from Condensed Matter; Oxford University Press: New York, NY, USA, 1992. [Google Scholar]
- Hempelmann, R. Hydrogen diffusion mechanism in proton conducting oxides. Phys. B 1996, 226, 72–79. [Google Scholar] [CrossRef]
- Hempelmann, R.; Karmonik, C.; Matzke, T.; Cappadonia, M.; Stimming, U.; Springer, T.; Adams, M.A. Quasielastic neutron scattering study of proton diffusion in SrCe0.95Yb0.05H0.02O2.985. Solid State Ion. 1995, 77, 152–156. [Google Scholar] [CrossRef]
- Schnell, J.P.L.; Velasco, D.; Dubreuil, D.; Dieumegard, M.; Crozet, P.; Colomban, P. Hydrogenated beta-alumina-like thin-films. Solid State Ion. 1983, 9–10, 1465–1468. [Google Scholar] [CrossRef]
- Morita, K.; Tsuchiya, B.; Nagata, S.; Katahira, K. ERD measurement of D-H replacement in D-implanted oxide ceramics exposed to H2O vapor at room temperature. Nucl. Instrum. Methods Phys. Res. B 2006, 249, 322–325. [Google Scholar] [CrossRef]
- Sorieul, S.; Miro, S.; Taillades-Jacquin, M.; Dailly, J.; Mauvy, F.; Berger, M.H.; Berger, P. Hydrogen diffusion in high temperature proton conducting ceramics. Nucl. Instrum. Methods Phys. Res. B 2008, 266, 1430–1433. [Google Scholar] [CrossRef]
- Berger, P.; Gallien, J.P.; Khodja, H.; Daudin, L.; Berger, M.H.; Sayir, A. Nuclear microprobe local hydrogen measurements in HTPC. Solid State Ion. 2006, 177, 1655–1658. [Google Scholar] [CrossRef]
- Jalarvo, N.; Haavik, C.; Kongshaug, C.; Norby, P.; Norby, T. Conductivity and water uptake of Sr4(Sr2Nb2)O11·nH2O and Sr4(Sr2Ta2)O11·nH2O. Solid State Ion. 2009, 180, 1151–1157. [Google Scholar] [CrossRef]
- Colomban, P.; Romain, F.; Neiman, A.; Animitsa, I. Double perovskites with oxygen structural vacancies: Raman spectra, conductivity and water uptake. Solid State Ion. 2001, 145, 339–347. [Google Scholar] [CrossRef]
- Animitsa, I.; Denisova, T.; Neiman, A.; Nepryahin, A.; Kochetova, N.; Zhuravlev, N.; Colomban, P. States of H+-containing species and proton migration forms in hydrated niobates and tantalates of alkaline-earth metals with a perovskite-related structure. Solid State Ion. 2003, 162–163, 73–81. [Google Scholar] [CrossRef]
- Ahmed, I.; Eriksson, S.G.; Ahlberg, A.; Knee, C.S.; Gotlind, H.; Johansson, L.G; Karlsson, M.; Matic, A.; Börjesson, L. Structural study and proton conductivity in Yb-doped BaZrO3. Solid State Ion. 2007, 178, 515–520. [Google Scholar] [CrossRef]
- Ahmed, I.; Knee, C.S.; Karlsson, M.; Eriksson, S.G.; Henry, P.F.; Matic, A.; Engberg, D.; Börjesson, L. Location of deuteron sites in the proton conducting perovskite BaZr0.50In0.50O3−y. J. Alloy. Compd. 2008, 450, 103–110. [Google Scholar]
- Sosnowska, I.; Przenioslo, R.; Schafer, W.; Kockelmann, W.; Hempelmann, R.; Wysocki, K. Possible deuterium positions in the high-temperature deuterated proton conductor Ba3Ca1+yNb2−yO9−delta studied by neutron and X-ray powder diffraction. J. Alloys Comp. 2001, 328, 226–230. [Google Scholar] [CrossRef]
- Shimoyama, T.; Tojo, T.; Kawaji, H.; Atake, T.; Igawa, N.; Ishii, Y. Determination of deuterium location in Ba3Ca1.18Nb1.82O8.73. Solid State Ion. 2008, 179, 231–235. [Google Scholar] [CrossRef]
- Shimoyama, T.; Tojo, T.; Kawaji, H.; Atake, T.; Fukazawa, H.; Igawa, N. Crystal structure and lattice vibration of proton dissolved BaZr0.8Sc0.2O2.9. Solid State Ion. 2009, 180, 560–562. [Google Scholar] [CrossRef]
- Knight, K. Structural phase transitions, oxygen vacancy ordering and protonation in doped BaCeO3: Results from time-of-flight neutron powder diffraction investigations. Solid State Ion. 2001, 145, 275–294. [Google Scholar] [CrossRef]
- Rietveld, H.M. A profile refinement method for nuclear and magnetic structures. J. Appl. Cryst. 1969, 2, 65–71. [Google Scholar] [CrossRef]
- Kreuer, K.D. On the development of proton conducting materials for technological applications. Solid State Ion. 1997, 97, 1–15. [Google Scholar] [CrossRef]
- Karlsson, M.; Björketun, M.E.; Sundell, P.G.; Matic, A.; Wahnström, G.; Engberg, D.; Börjesson, L.; Ahmed, L.; Eriksson, S.; Berastegui, P. Vibrational properties of protons in hydrated BaInxZr1−xO3−x/2. Phys. Rev. B 2005, 72, 094303:1–094303:7. [Google Scholar]
- Glerup, M.; Poulsen, F.W.; Berg, R.W. Vibrational spectroscopy of protons and deuterons in proton conducting perovskites. Solid State Ion. 2002, 148, 83–92. [Google Scholar] [CrossRef]
- Sata, N.; Ishigame, M.; Shin, S. Optical absorption spectra of acceptor-doped SrZrO3 and SrTiO3 perovskite-type proton conductors. Solid State Ion. 1996, 86–88, 629–632. [Google Scholar] [CrossRef]
- Omata, T.; Takagi, M.; Otsuka-Yao-Matsuo, S. O–H stretching vibrations of proton conducting alkaline-earth zirconates. Solid State Ion. 2004, 168, 99–109. [Google Scholar] [CrossRef]
- Tournie, A.; Ricciardi, P.; Colomban, P. Glass corrosion mechanisms: A multiscale analysis. Solid State Ion. 2008, 179, 2142–2154. [Google Scholar] [CrossRef]
- Colomban, P.; Tomkinson, J. Novel forms of hydrogen in solids: The “ionic” proton and the “quasi-free” proton. Solid State Ion. 1997, 97, 123–134. [Google Scholar] [CrossRef]
- Fillaux, F.; Leygue, N.; Baddour-Hadjean, R.; Parker, S.; Colomban, P.; Gruger, A.; Yu, L.T. Inelastic neutron scattering studies of polyanilines and partially deuterated analogues. Chem. Phys. 1997, 216, 281–293. [Google Scholar] [CrossRef]
- Communiqué de presse. Available online: http://www2.cnrs.fr/presse/communique/1570.htm (accessed on 8 April 2009).
© 2012 by the authors; licensee MDPI, Basel, Switzerland. This article is an open access article distributed under the terms and conditions of the Creative Commons Attribution license (http://creativecommons.org/licenses/by/3.0/).
Share and Cite
Colomban, P.; Zaafrani, O.; Slodczyk, A. Proton Content and Nature in Perovskite Ceramic Membranes for Medium Temperature Fuel Cells and Electrolysers. Membranes 2012, 2, 493-509. https://doi.org/10.3390/membranes2030493
Colomban P, Zaafrani O, Slodczyk A. Proton Content and Nature in Perovskite Ceramic Membranes for Medium Temperature Fuel Cells and Electrolysers. Membranes. 2012; 2(3):493-509. https://doi.org/10.3390/membranes2030493
Chicago/Turabian StyleColomban, Philippe, Oumaya Zaafrani, and Aneta Slodczyk. 2012. "Proton Content and Nature in Perovskite Ceramic Membranes for Medium Temperature Fuel Cells and Electrolysers" Membranes 2, no. 3: 493-509. https://doi.org/10.3390/membranes2030493