Exercise-Induced Fatigue in One Leg Does Not Impair the Neuromuscular Performance in the Contralateral Leg but Improves the Excitability of the Ipsilateral Corticospinal Pathway


Abstract
:1. Introduction
2. Materials and Methods
2.1. Participants
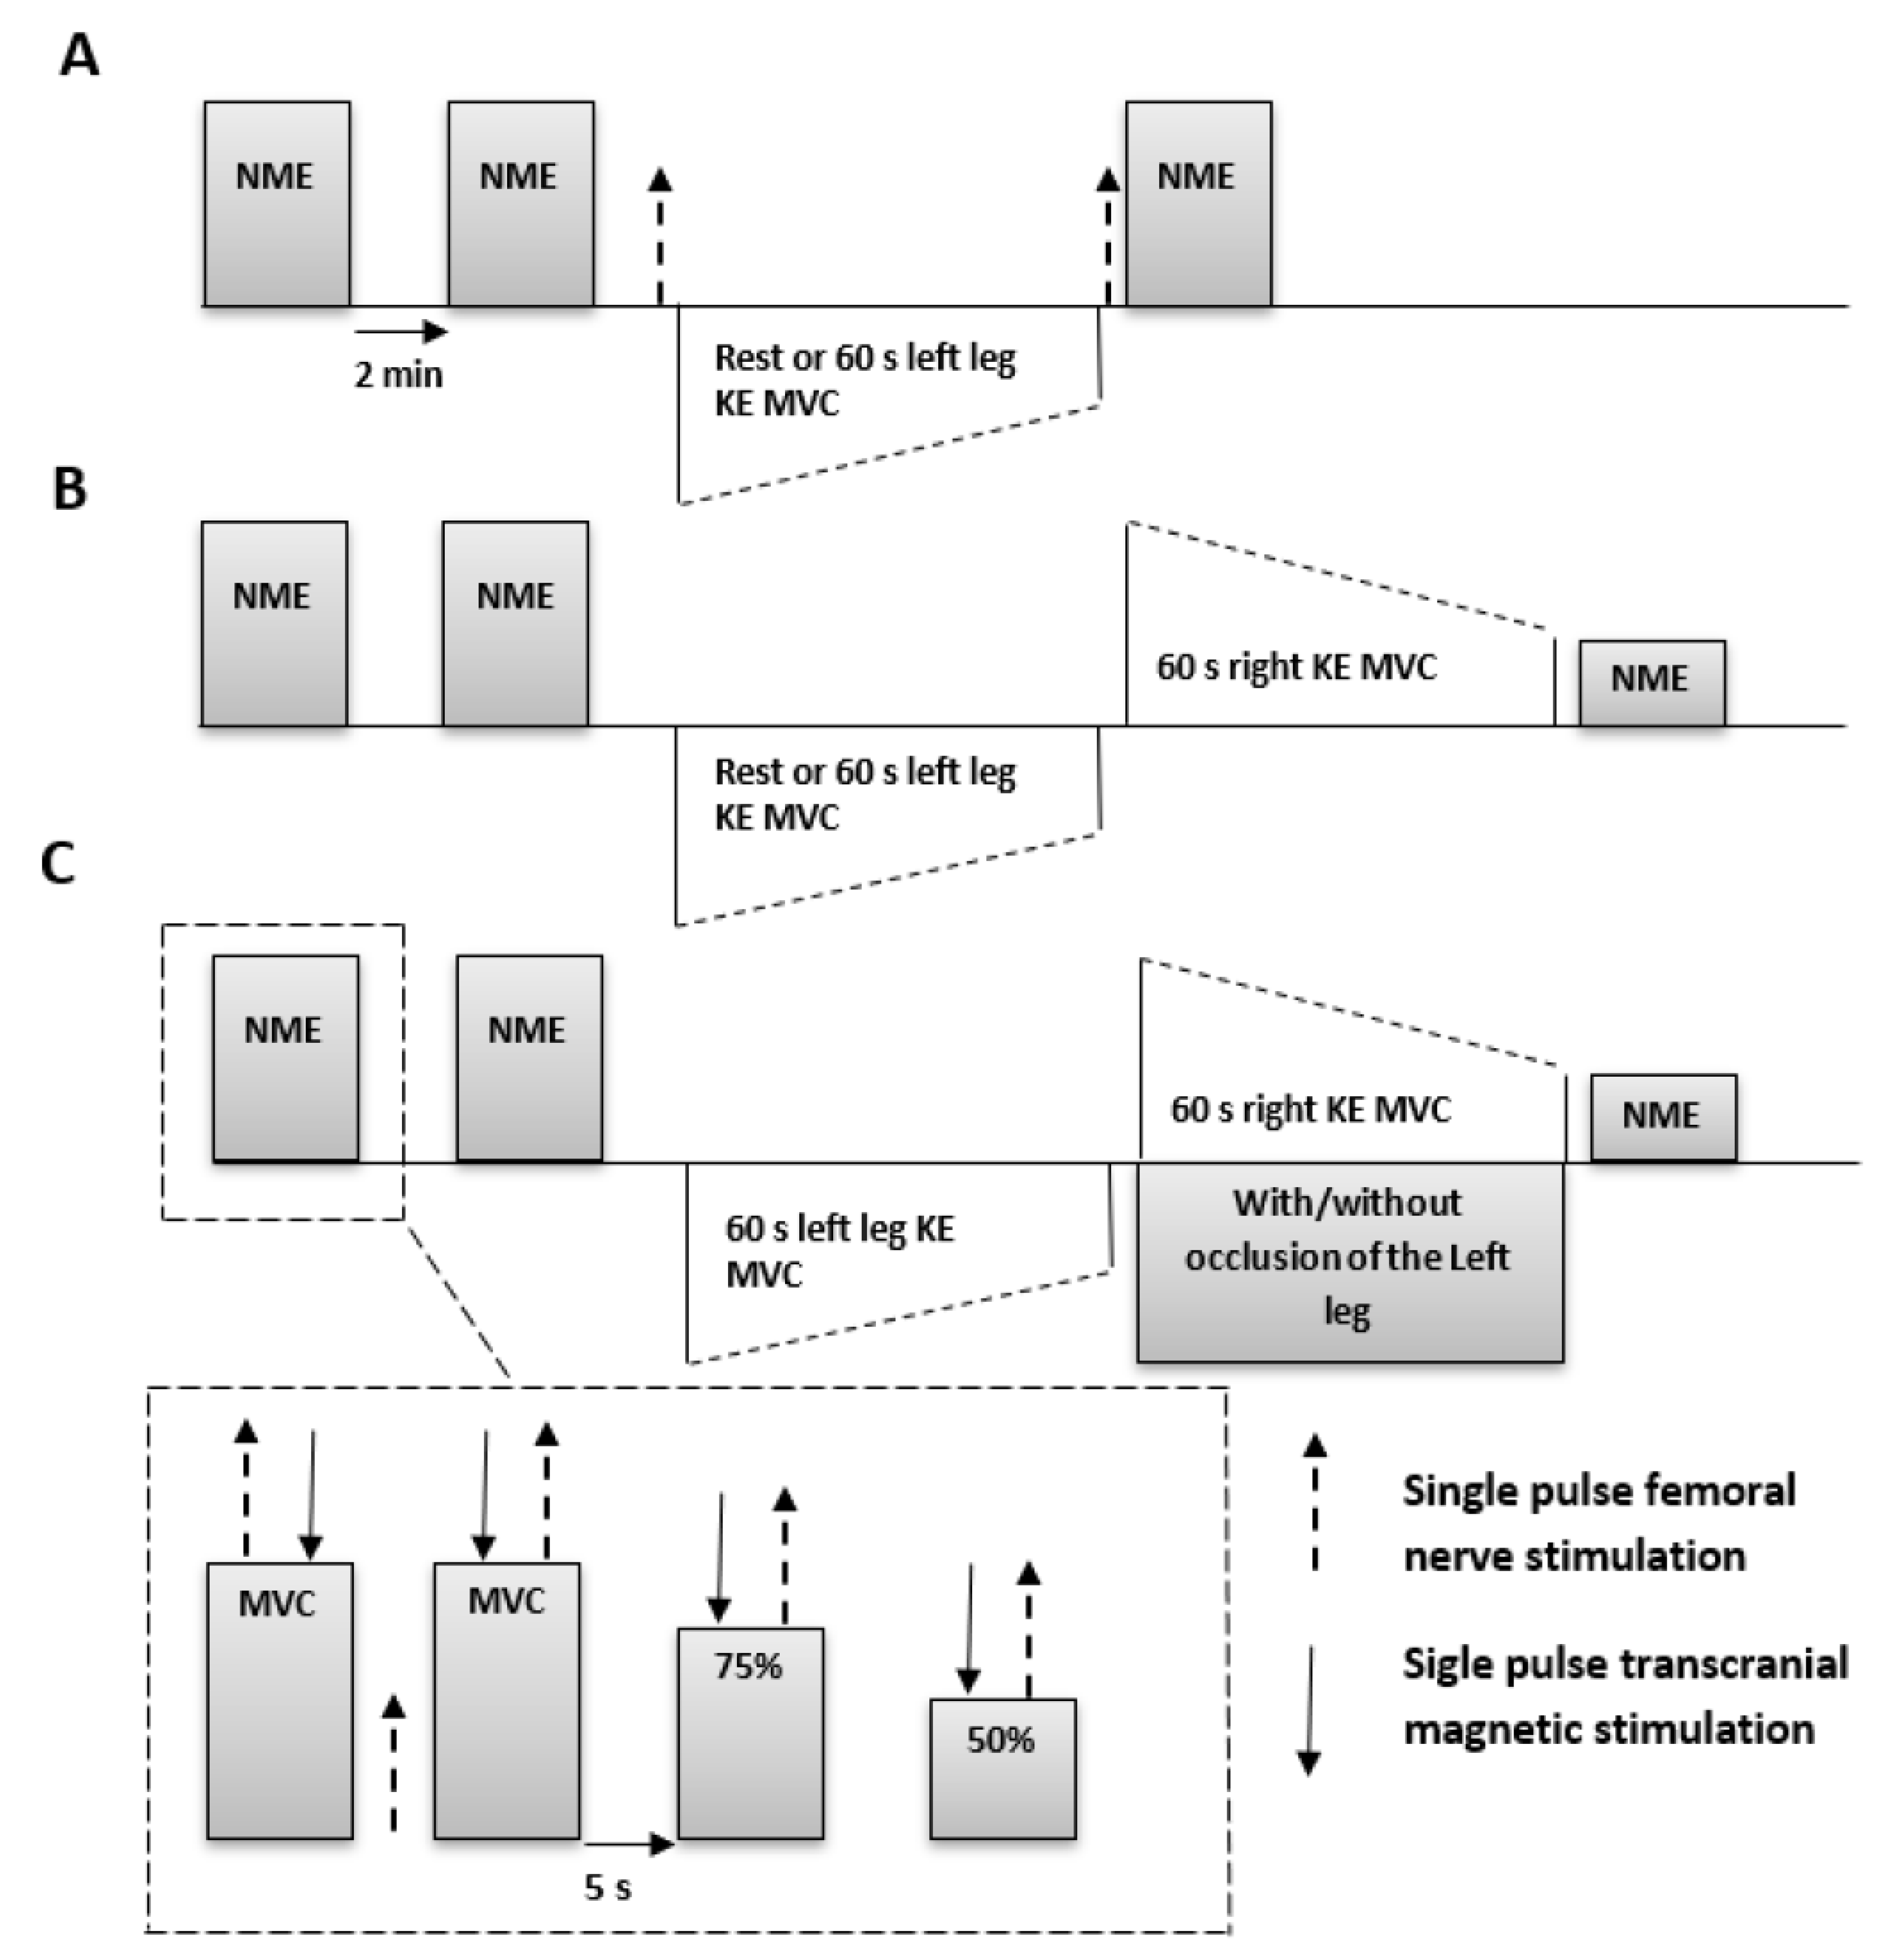
2.2. Experimental Setup and Procedures
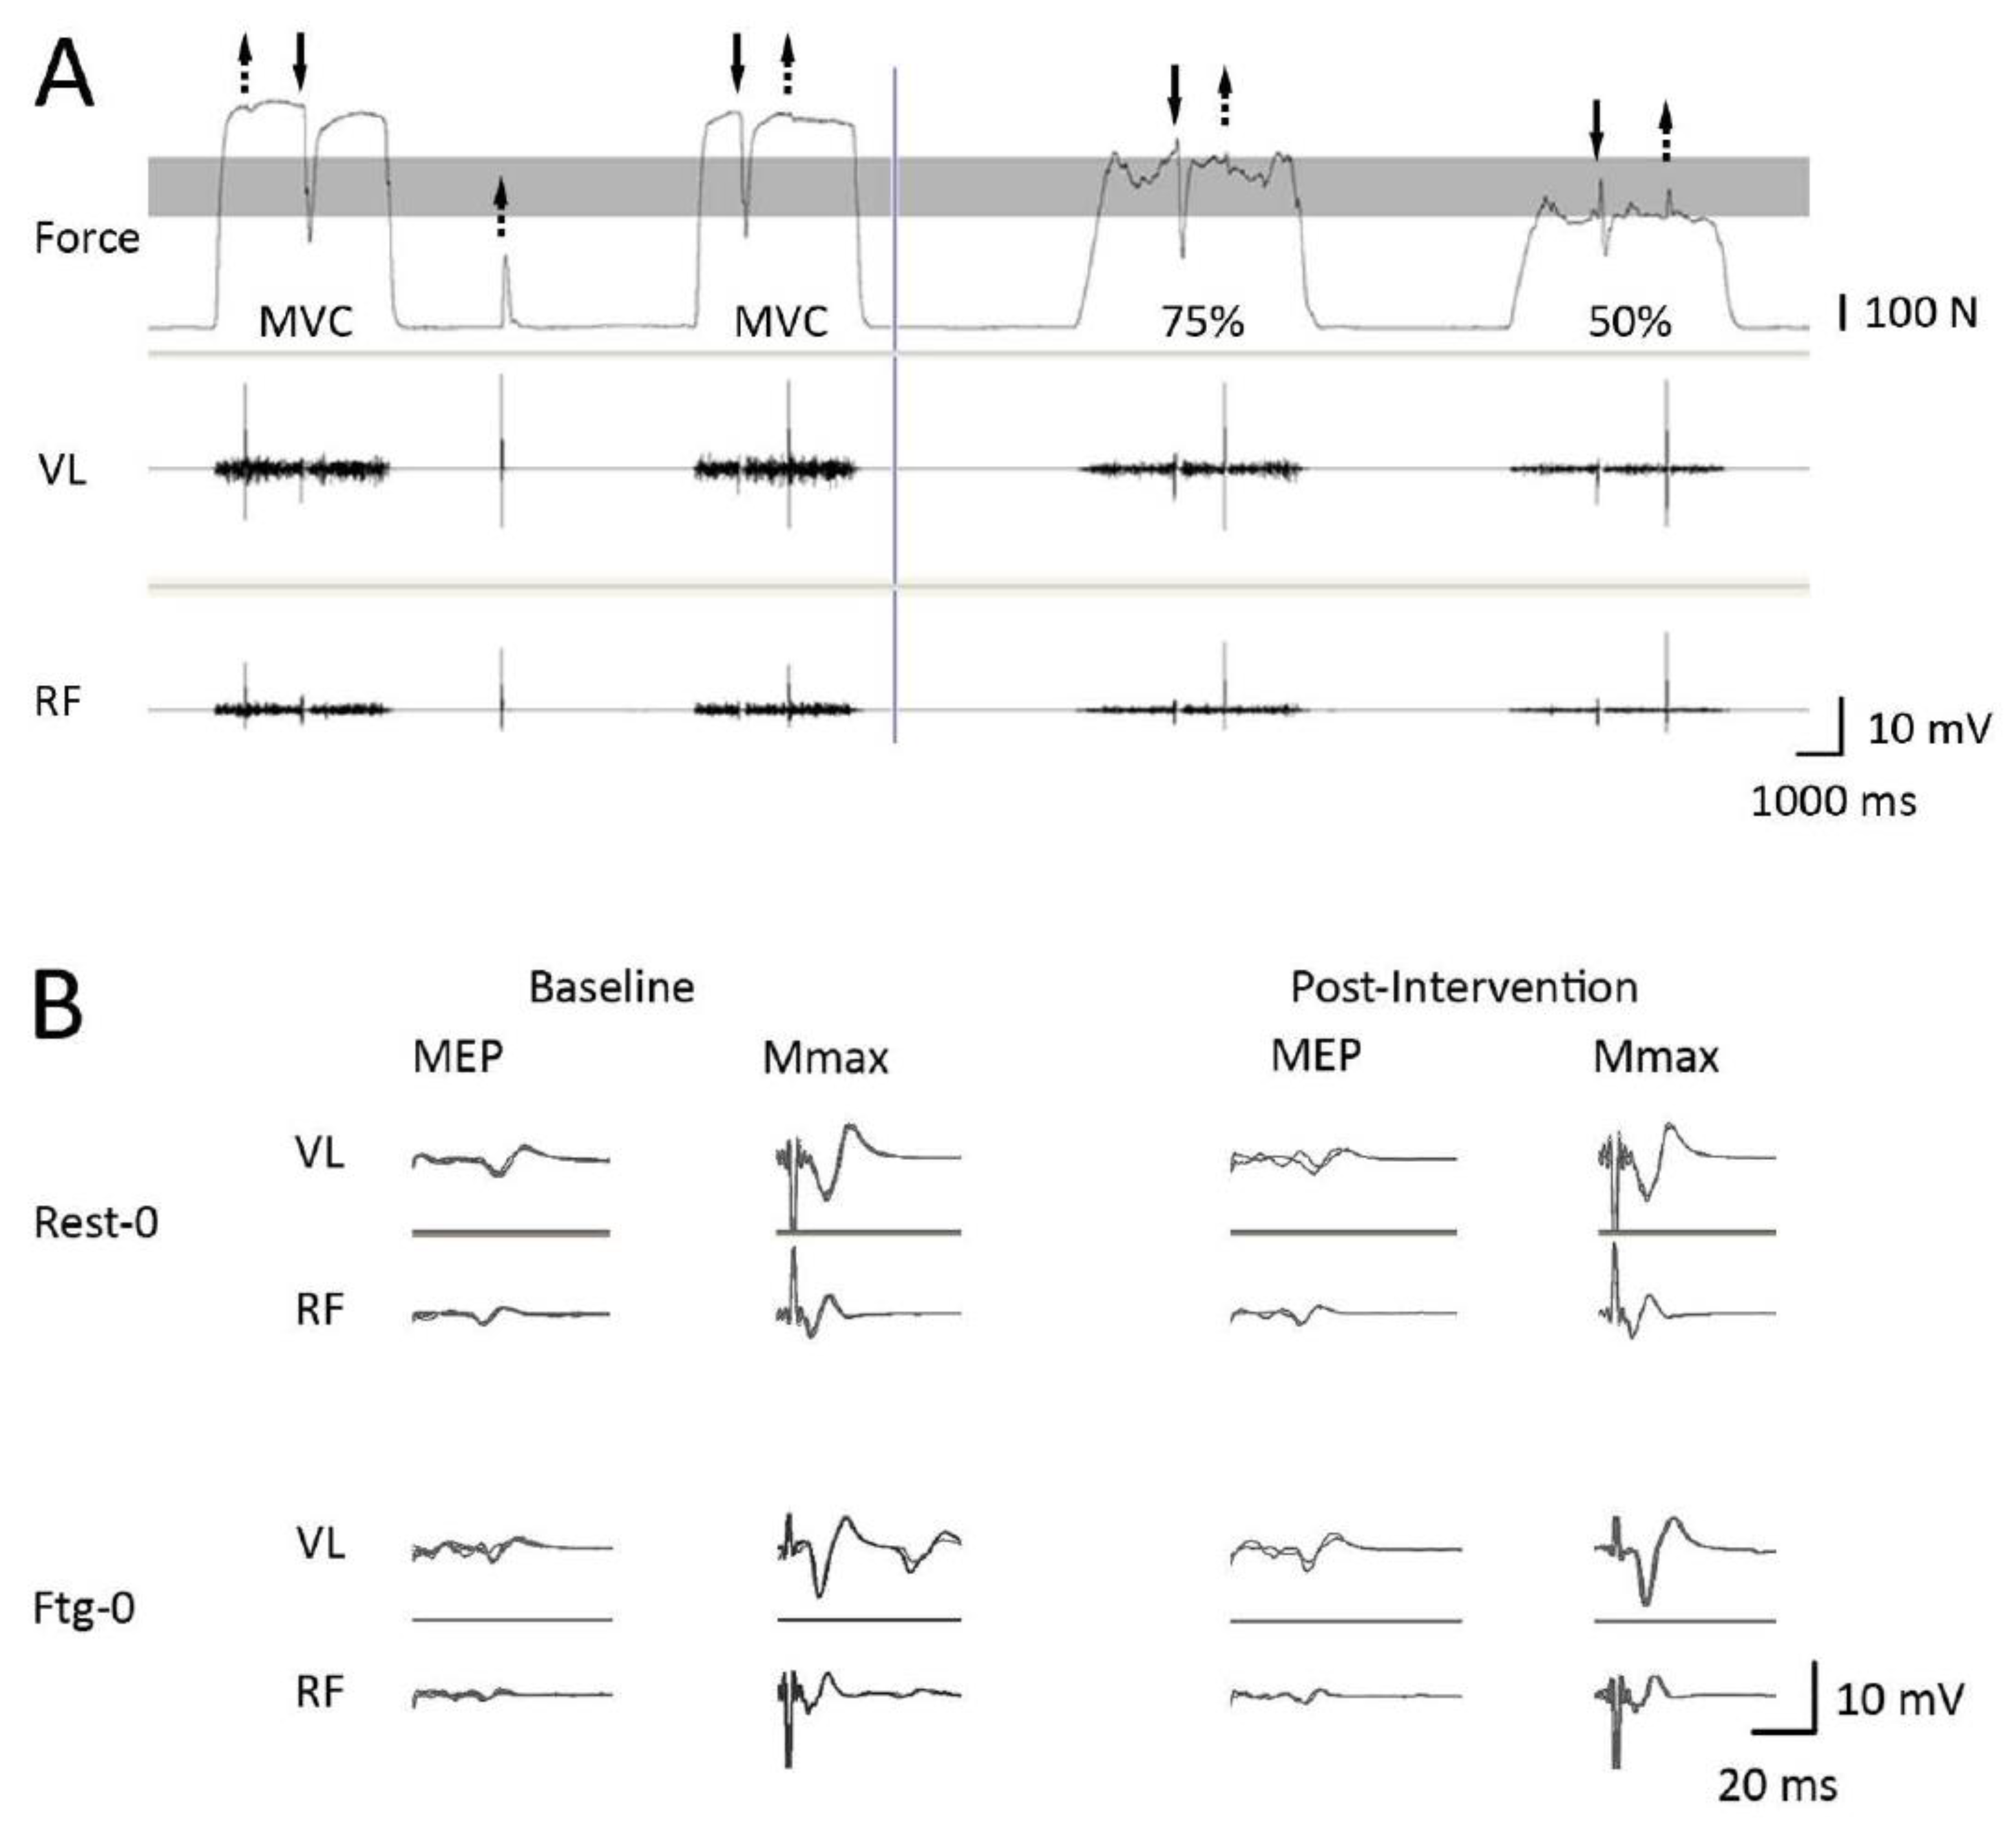
2.3. Data Analysis
2.4. Statistical Analysis
3. Results
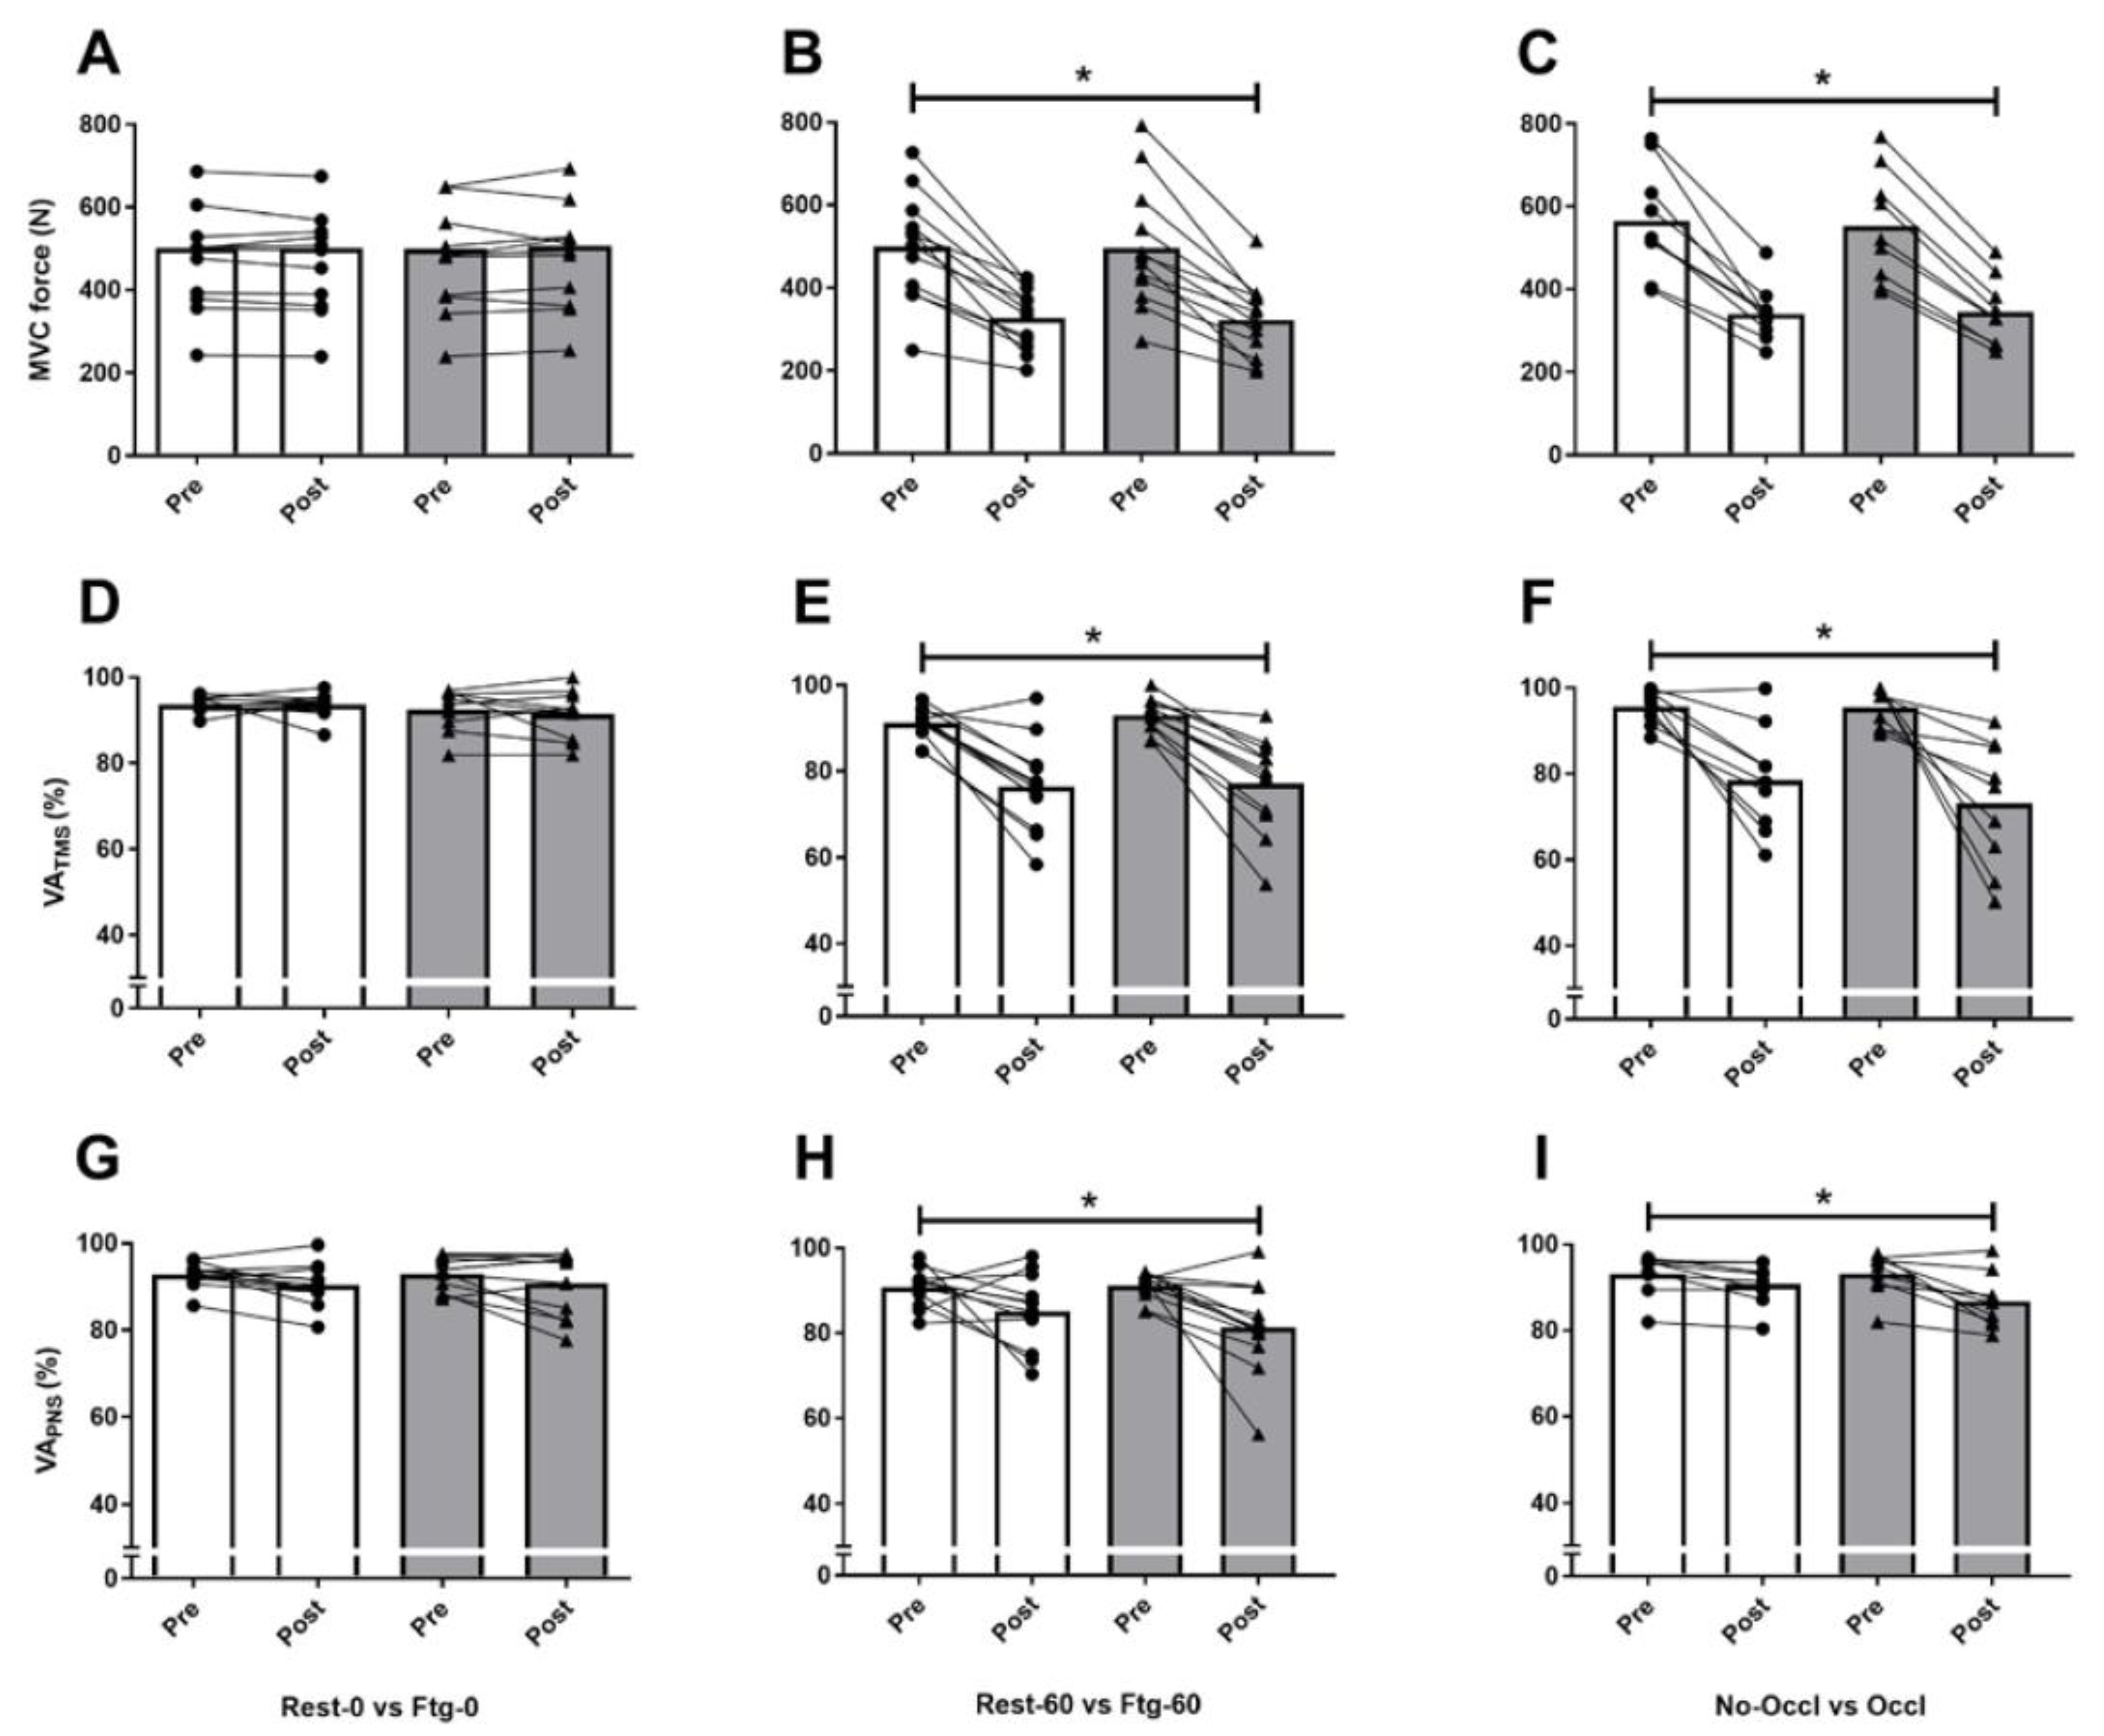
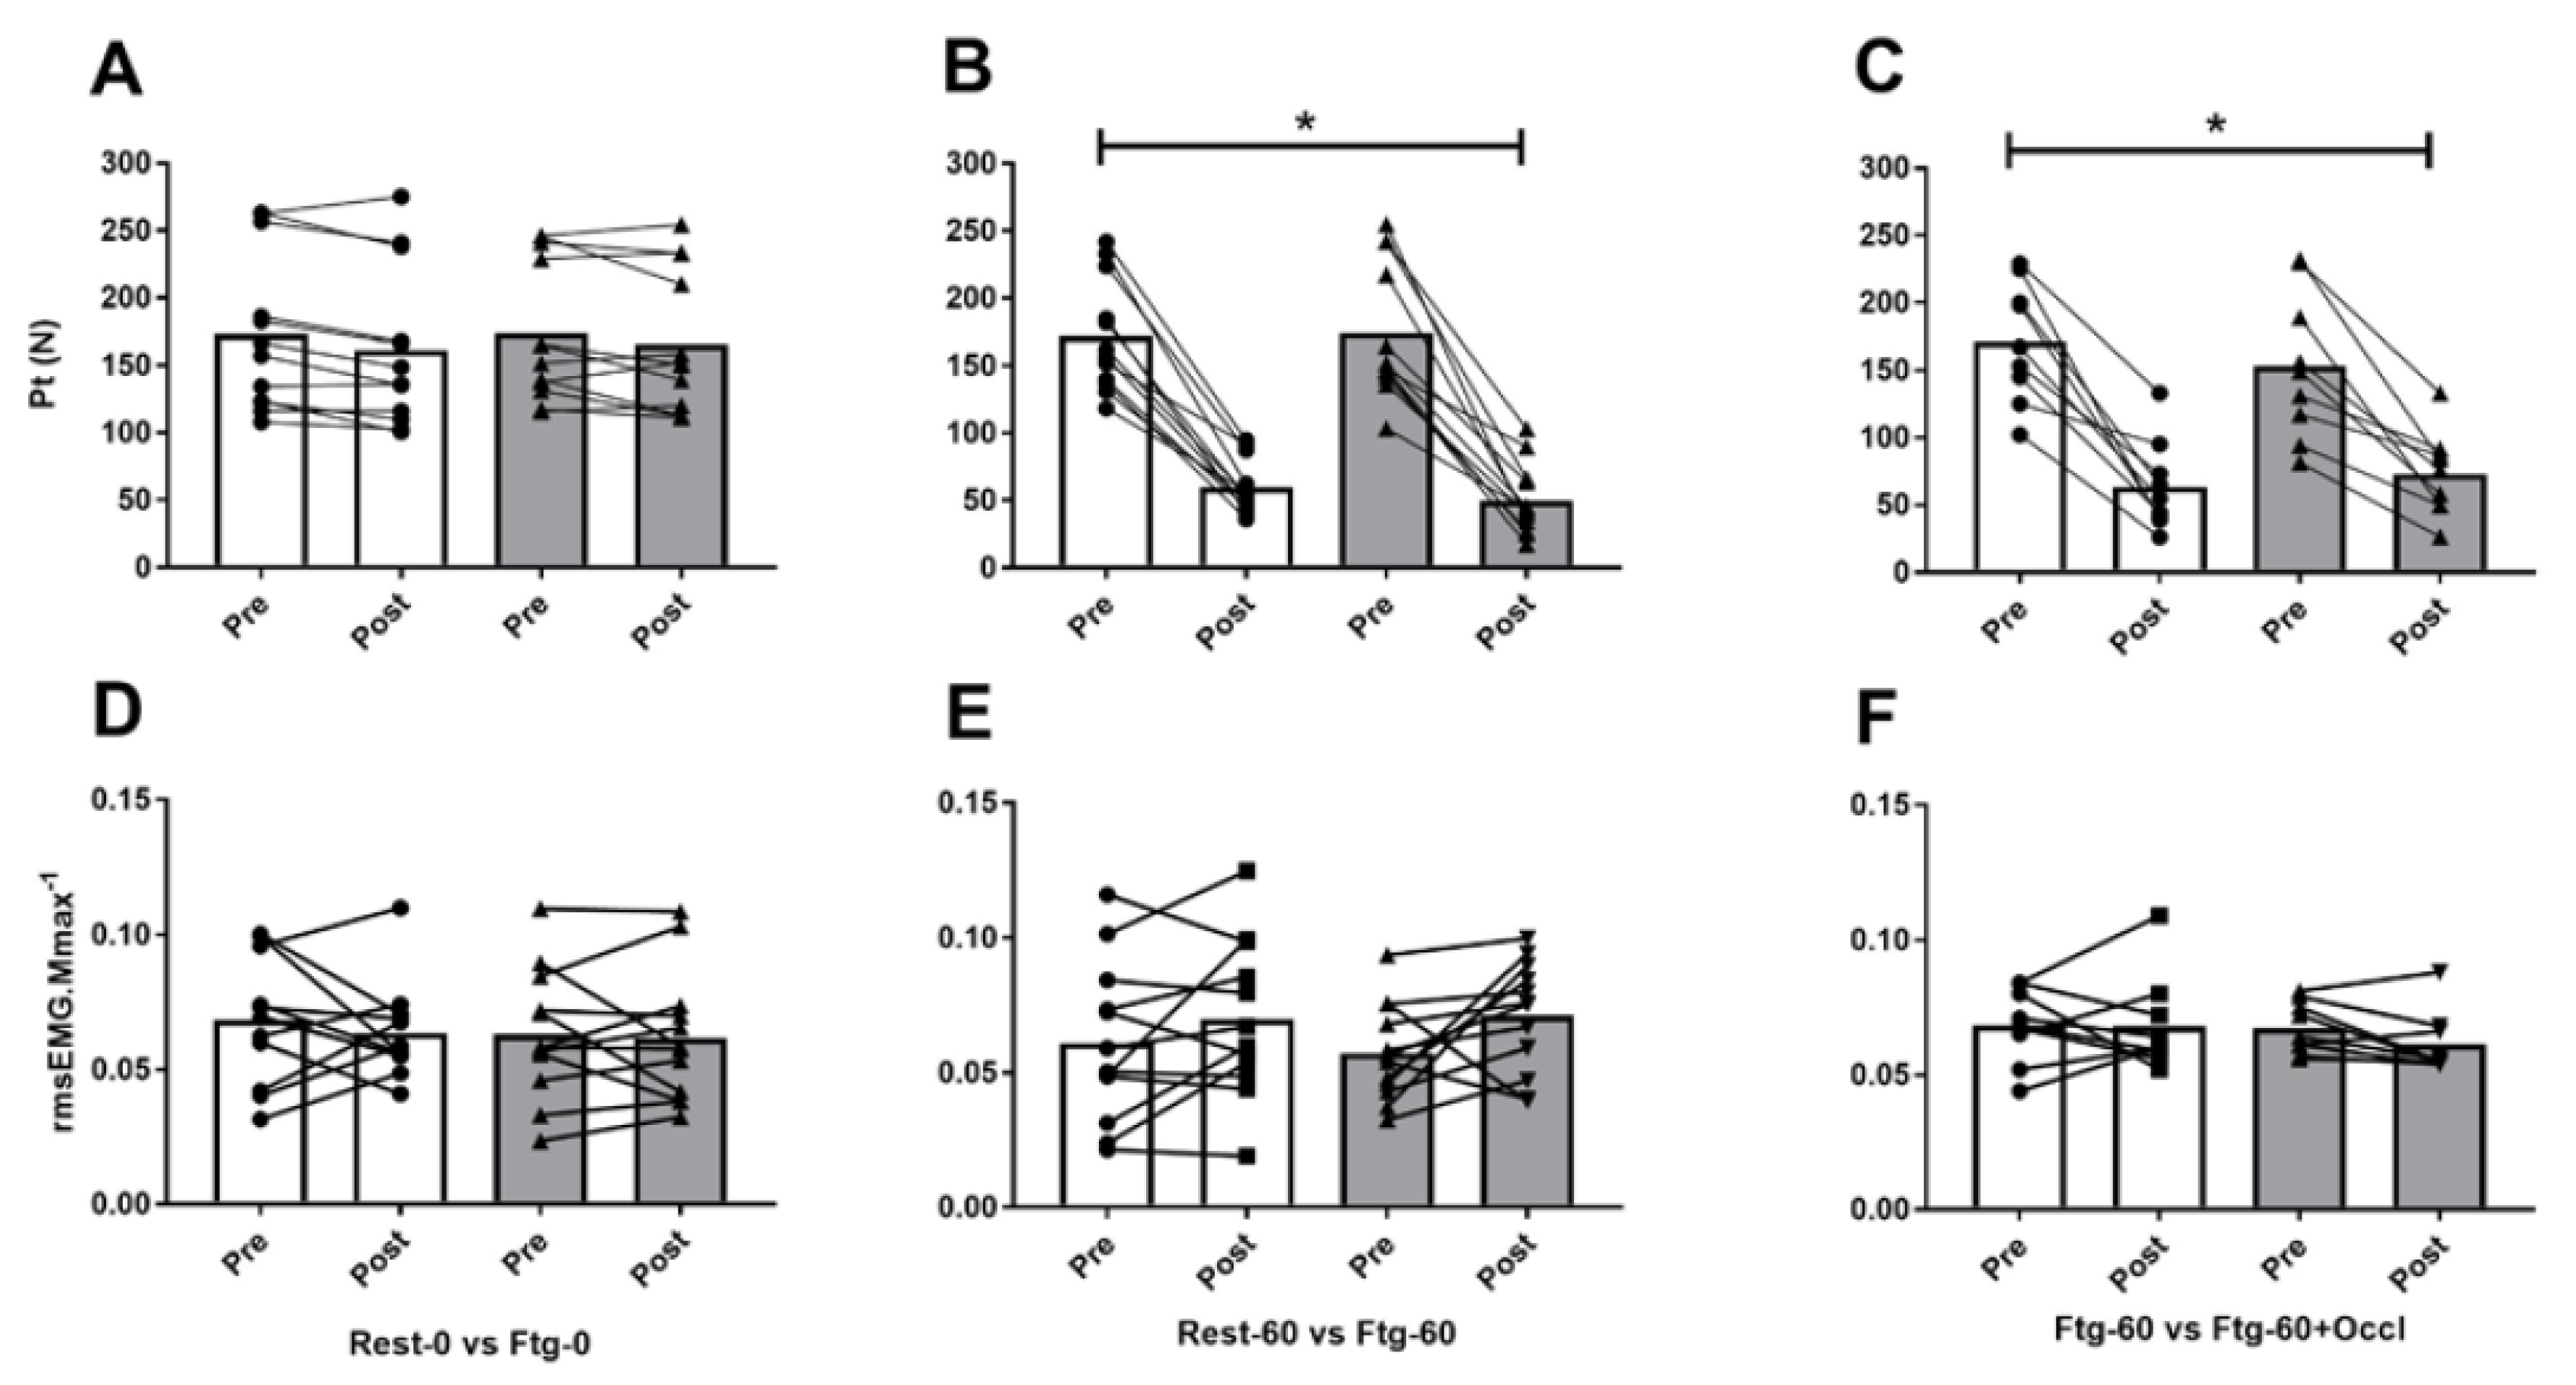
3.1. Experiment A
3.2. Experiment B
3.3. Experiment C
4. Discussion
4.1. MVC Force and Central Motor Drive
4.2. Corticospinal Excitability and Inhibition
4.3. Limitations
5. Conclusions
Author Contributions
Funding
Acknowledgments
Conflicts of Interest
References
- Halperin, I.; Chapman, D.W.; Behm, D.G. Non-local muscle fatigue: Effects and possible mechanisms. Eur. J. Appl. Physiol. 2015, 115, 2031–2048. [Google Scholar] [CrossRef] [PubMed]
- Martin, P.G.; Rattey, J. Central fatigue explains sex differences in muscle fatigue and contralateral cross-over effects of maximal contractions. Pflugers Arch. 2007, 454, 957–969. [Google Scholar] [CrossRef] [PubMed]
- Šambaher, N.; Aboodarda, S.J.; Behm, D.G. Bilateral Knee Extensor Fatigue Modulates Force and Responsiveness of the Corticospinal Pathway in the Non-fatigued, Dominant Elbow Flexors. Front. Hum. Neurosci. 2016, 10, 18. [Google Scholar] [CrossRef] [PubMed]
- Halperin, I.; Aboodarda, S.J.; Behm, D.G. Knee extension fatigue attenuates repeated force production of the elbow flexors. Eur. J. Sport Sci. 2014, 14, 823–829. [Google Scholar] [CrossRef] [PubMed]
- Sidhu, S.K.; Weavil, J.C.; Venturelli, M.; Garten, R.S.; Rossman, M.J.; Richardson, R.S.; Gmelch, B.S.; Morgan, D.E.; Amann, M. Spinal μ-opioid receptor-sensitive lower limb muscle afferents determine corticospinal responsiveness and promote central fatigue in upper limb muscle. J. Physiol. 2014, 592, 5011–5024. [Google Scholar] [CrossRef] [PubMed]
- Amann, M.; Venturelli, M.; Ives, S.J.; McDaniel, J.; Layec, G.; Rossman, M.J.; Richardson, R.S. Peripheral fatigue limits endurance exercise via a sensory feedback-mediated reduction in spinal motoneuronal output. J. Appl. Physiol. (1985) 2013, 115, 355–364. [Google Scholar] [CrossRef] [PubMed] [Green Version]
- Gandevia, S.C. Spinal and supraspinal factors in human muscle fatigue. Physiol. Rev. 2001, 81, 1725–1789. [Google Scholar] [CrossRef] [PubMed]
- Aboodarda, S.J.; Šambaher, N.; Millet, G.Y.; Behm, D.G. Knee extensors neuromuscular fatigue changes the corticospinal pathway excitability in biceps brachii muscle. Neuroscience 2017, 340, 477–486. [Google Scholar] [CrossRef] [PubMed]
- Kennedy, D.S.; Fitzpatrick, S.C.; Gandevia, S.C.; Taylor, J.L. Fatigue-related firing of muscle nociceptors reduces voluntary activation of ipsilateral but not contralateral lower limb muscles. J. Appl. Physiol. (1985) 2015, 118, 408–418. [Google Scholar] [CrossRef] [PubMed] [Green Version]
- Prieske, O.; Aboodarda, S.J.; Benitez Sierra, J.A.; Behm, D.G.; Granacher, U. Slower but not faster unilateral fatiguing knee extensions alter contralateral limb performance without impairment of maximal torque output. Eur. J. Appl. Physiol. 2017, 117, 323–334. [Google Scholar] [CrossRef] [PubMed]
- Paillard, T.; Chaubet, V.; Maitre, J.; Dumitrescu, M.; Borel, L. Disturbance of contralateral unipedal postural control after stimulated and voluntary contractions of the ipsilateral limb. Neurosci. Res. 2010, 68, 301–306. [Google Scholar] [CrossRef] [PubMed]
- Regueme, S.C.; Barthèlemy, J.; Nicol, C. Exhaustive stretch-shortening cycle exercise: No contralateral effects on muscle activity in maximal motor performances. Scand. J. Med. Sci. Sports 2007, 17, 547–555. [Google Scholar] [CrossRef] [PubMed]
- Aboodarda, S.J.; Copithorne, D.B.; Power, K.E.; Drinkwater, E.; Behm, D.G. Elbow flexor fatigue modulates central excitability of the knee extensors. Appl. Physiol. Nutr. Metab. 2015, 40, 924–930. [Google Scholar] [CrossRef] [PubMed]
- Johnson, M.A.; Mills, D.E.; Brown, P.I.; Sharpe, G.R. Prior upper body exercise reduces cycling work capacity but not critical power. Med. Sci. Sports Exerc. 2014, 46, 802–808. [Google Scholar] [CrossRef] [PubMed]
- Halperin, I.; Copithorne, D.; Behm, D.G. Unilateral isometric muscle fatigue decreases force production and activation of contralateral knee extensors but not elbow flexors. Appl. Physiol. Nutr. Metab. 2014, 39, 1338–1344. [Google Scholar] [CrossRef] [PubMed]
- Kaufman, M.P.; Rybicki, K.J.; Waldrop, T.G.; Ordway, G.A. Effect of ischemia on responses of group III and IV afferents to contraction. J. Appl. Physiol. Respir. Environ. Exerc. Physiol. 1984, 57, 644–650. [Google Scholar] [CrossRef] [PubMed]
- Hayward, L.; Wesselmann, U.; Rymer, W.Z. Effects of muscle fatigue on mechanically sensitive afferents of slow conduction velocity in the cat triceps surae. J. Neurophysiol. 1991, 65, 360–370. [Google Scholar] [CrossRef] [PubMed]
- van Melick, N.; Meddeler, B.M.; Hoogeboom, T.J.; Nijhuis-van der Sanden, M.W.G.; van Cingel, R.E.H. How to determine leg dominance: The agreement between self-reported and observed performance in healthy adults. PLoS ONE 2017, 12, e0189876. [Google Scholar] [CrossRef] [PubMed]
- Rossi, S.; Hallett, M.; Rossini, P.M.; Pascual-Leone, A. Screening questionnaire before TMS: An update. Clin. Neurophysiol. 2011, 122, 1686. [Google Scholar] [CrossRef] [PubMed]
- Warburton, D.; Jamnik, V.; Bredin, S.; Gledhill, N. The Physical Activity Readiness Questionnaire for Everyone (PAR-Q+): English North America Version. Health Fit. J. Canada 2011, 4, 18–20. [Google Scholar]
- Vernillo, G.; Temesi, J.; Martin, M.; Millet, G.Y. Mechanisms of Fatigue and Recovery in Upper versus Lower Limbs in Men. Med. Sci. Sports Exerc. 2018, 50, 334–343. [Google Scholar] [CrossRef] [PubMed]
- Hermens, H.J.; Freriks, B.; Disselhorst-Klug, C.; Rau, G. Development of recommendations for SEMG sensors and sensor placement procedures. J. Electromyogr. Kinesiol. 2000, 10, 361–374. [Google Scholar] [CrossRef]
- Behm, D.G.; St-Pierre, D.M.; Perez, D. Muscle inactivation: Assessment of interpolated twitch technique. J. Appl. Physiol. 1996, 81, 2267–2273. [Google Scholar] [CrossRef] [PubMed]
- Strojnik, V.; Komi, P.V. Neuromuscular fatigue after maximal stretch-shortening cycle exercise. J. Appl. Physiol. 1998, 84, 344–350. [Google Scholar] [CrossRef] [PubMed] [Green Version]
- Todd, G.; Taylor, J.L.; Gandevia, S.C. Measurement of voluntary activation of fresh and fatigued human muscles using transcranial magnetic stimulation. J. Physiol. 2003, 551, 661–671. [Google Scholar] [CrossRef] [PubMed]
- Todd, G.; Taylor, J.L.; Gandevia, S.C. Reproducible measurement of voluntary activation of human elbow flexors with motor cortical stimulation. J. Appl. Physiol. (1985) 2004, 97, 236–242. [Google Scholar] [CrossRef] [PubMed] [Green Version]
- Cohen, J. Statistical Power Analysis for the Behavioral Sciences, 2nd ed.; L. Erlbaum Associates: Hillsdale, NJ, USA, 1988; pp. xxi, 567. [Google Scholar]
- Arora, S.; Budden, S.; Byrne, J.M.; Behm, D.G. Effect of unilateral knee extensor fatigue on force and balance of the contralateral limb. Eur. J. Appl. Physiol. 2015, 115, 2177–2187. [Google Scholar] [CrossRef] [PubMed]
- Grabiner, M.D.; Owings, T.M. Effects of eccentrically and concentrically induced unilateral fatigue on the involved and uninvolved limbs. J. Electromyogr. Kinesiol. 1999, 9, 185–189. [Google Scholar] [CrossRef]
- Aboodarda, S.J.; Šambaher, N.; Behm, D.G. Unilateral elbow flexion fatigue modulates corticospinal responsiveness in non-fatigued contralateral biceps brachii. Scand. J. Med. Sci. Sports 2016, 26, 1301–1312. [Google Scholar] [CrossRef] [PubMed]
- Todd, G.; Taylor, J.L.; Gandevia, S.C. Measurement of voluntary activation based on transcranial magnetic stimulation over the motor cortex. J. Appl. Physiol. (1985) 2016, 121, 678–686. [Google Scholar] [CrossRef] [PubMed] [Green Version]
- Sadamoto, T.; Bonde-Petersen, F.; Suzuki, Y. Skeletal muscle tension, flow, pressure, and EMG during sustained isometric contractions in humans. Eur. J. Appl. Physiol. Occup. Physiol. 1983, 51, 395–408. [Google Scholar] [CrossRef] [PubMed]
- Hortobágyi, T.; Taylor, J.L.; Petersen, N.T.; Russell, G.; Gandevia, S.C. Changes in segmental and motor cortical output with contralateral muscle contractions and altered sensory inputs in humans. J. Neurophysiol. 2003, 90, 2451–2459. [Google Scholar] [CrossRef] [PubMed]
- Samii, A.; Wassermann, E.M.; Ikoma, K.; Mercuri, B.; Hallett, M. Characterization of postexercise facilitation and depression of motor evoked potentials to transcranial magnetic stimulation. Neurology 1996, 46, 1376–1382. [Google Scholar] [CrossRef] [PubMed]
- Brasil-Neto, J.P.; Araújo, V.P.; Carneiro, C.R. Postexercise facilitation of motor evoked potentials elicited by ipsilateral voluntary contraction. Muscle Nerve 1999, 22, 1710–1712. [Google Scholar] [CrossRef]
- Heckman, C.J.; Hyngstrom, A.S.; Johnson, M.D. Active properties of motoneurone dendrites: Diffuse descending neuromodulation, focused local inhibition. J. Physiol. 2008, 586, 1225–1231. [Google Scholar] [CrossRef] [PubMed]
- Tanaka, M.; Watanabe, Y. Supraspinal regulation of physical fatigue. Neurosci. Biobehav. Rev. 2012, 36, 727–734. [Google Scholar] [CrossRef] [PubMed]
- Taylor, J.L. Stimulation at the cervicomedullary junction in human subjects. J. Electromyogr. Kinesiol. 2006, 16, 215–223. [Google Scholar] [CrossRef]

| Variables | Experiment A | Experiment B | Experiment C | ||||
|---|---|---|---|---|---|---|---|
| Rest-0 | Ftg-0 | Rest-60 | Ftg-60 | Ftg-60 | Ftg-60-Occl | ||
| MVC force (N) | Baseline | 501.7 ± 159.9 | 499.9 ± 158.7 | 507.1 ± 148.2 | 495.3 ± 150.3 | 555.0 ± 128.8 | 573.9 ± 144.1 |
| Post-test | 501.1 ± 170.7 | 506.3 ± 158.6 | 334.8 ± 88.9 | 322.2 ± 89.9 | 349.9 ± 71.1 | 363.6 ± 96.7 | |
| rmsEMG∙Mmax−1 ratio (rmsEMG100) | Baseline | 0.074 ± 0.031 | 0.070 ± 0.037 | 0.067 ± 0.034 | 0.066 ± 0.026 | 0.063 ± 0.030 | 0.068 ± 0.026 |
| Post-test | 0.069 ± 0.028 | 0.069 ± 0.044 | 0.066 ± 0.026 | 0.078 ± 0.029 | 0.066 ± 0.031 | 0.072 ± 0.038 | |
| PT (N) | Baseline | 173.2 ± 54.4 | 173.7 ± 51.7 | 171.8 ± 41.7 | 174.5 ± 50.4 | 171.5 ± 44.3 | 153.4 ± 54.5 |
| Post-test | 161.4 ± 59.1 | 165.6 ± 52.9 | 59.9 ± 20.2 | 49.8 ± 26.1 | 63.5 ± 33.2 | 72.8 ± 31.1 | |
| VAPNS (%) | Baseline | 92.7 ± 2.9 | 93.1 ± 3.8 | 90.7 ± 4.5 | 91.1 ± 3.2 | 93.1 ± 5.1 | 93.2 ± 5.2 |
| Post-test | 90.6 ± 4.9 | 90.7 ± 7.5 | 85.1 ± 9.1 | 81.2 ± 11.2 | 90.6 ± 5.2 | 86.7 ± 6.7 | |
| VATMS (%) | Baseline | 93.6 ± 1.9 | 92.6 ± 5.2 | 91.1 ± 4.2 | 93.1 ± 4.4 | 94.8 ± 5.5 | 85.4 ± 4.5 |
| Post-test | 93.4 ± 3.1 | 91.2 ± 6.1 | 73.3 ± 18.3 | 76.6 ± 12.6 | 78.4 ± 12.2 | 70.1 ± 17.1 | |
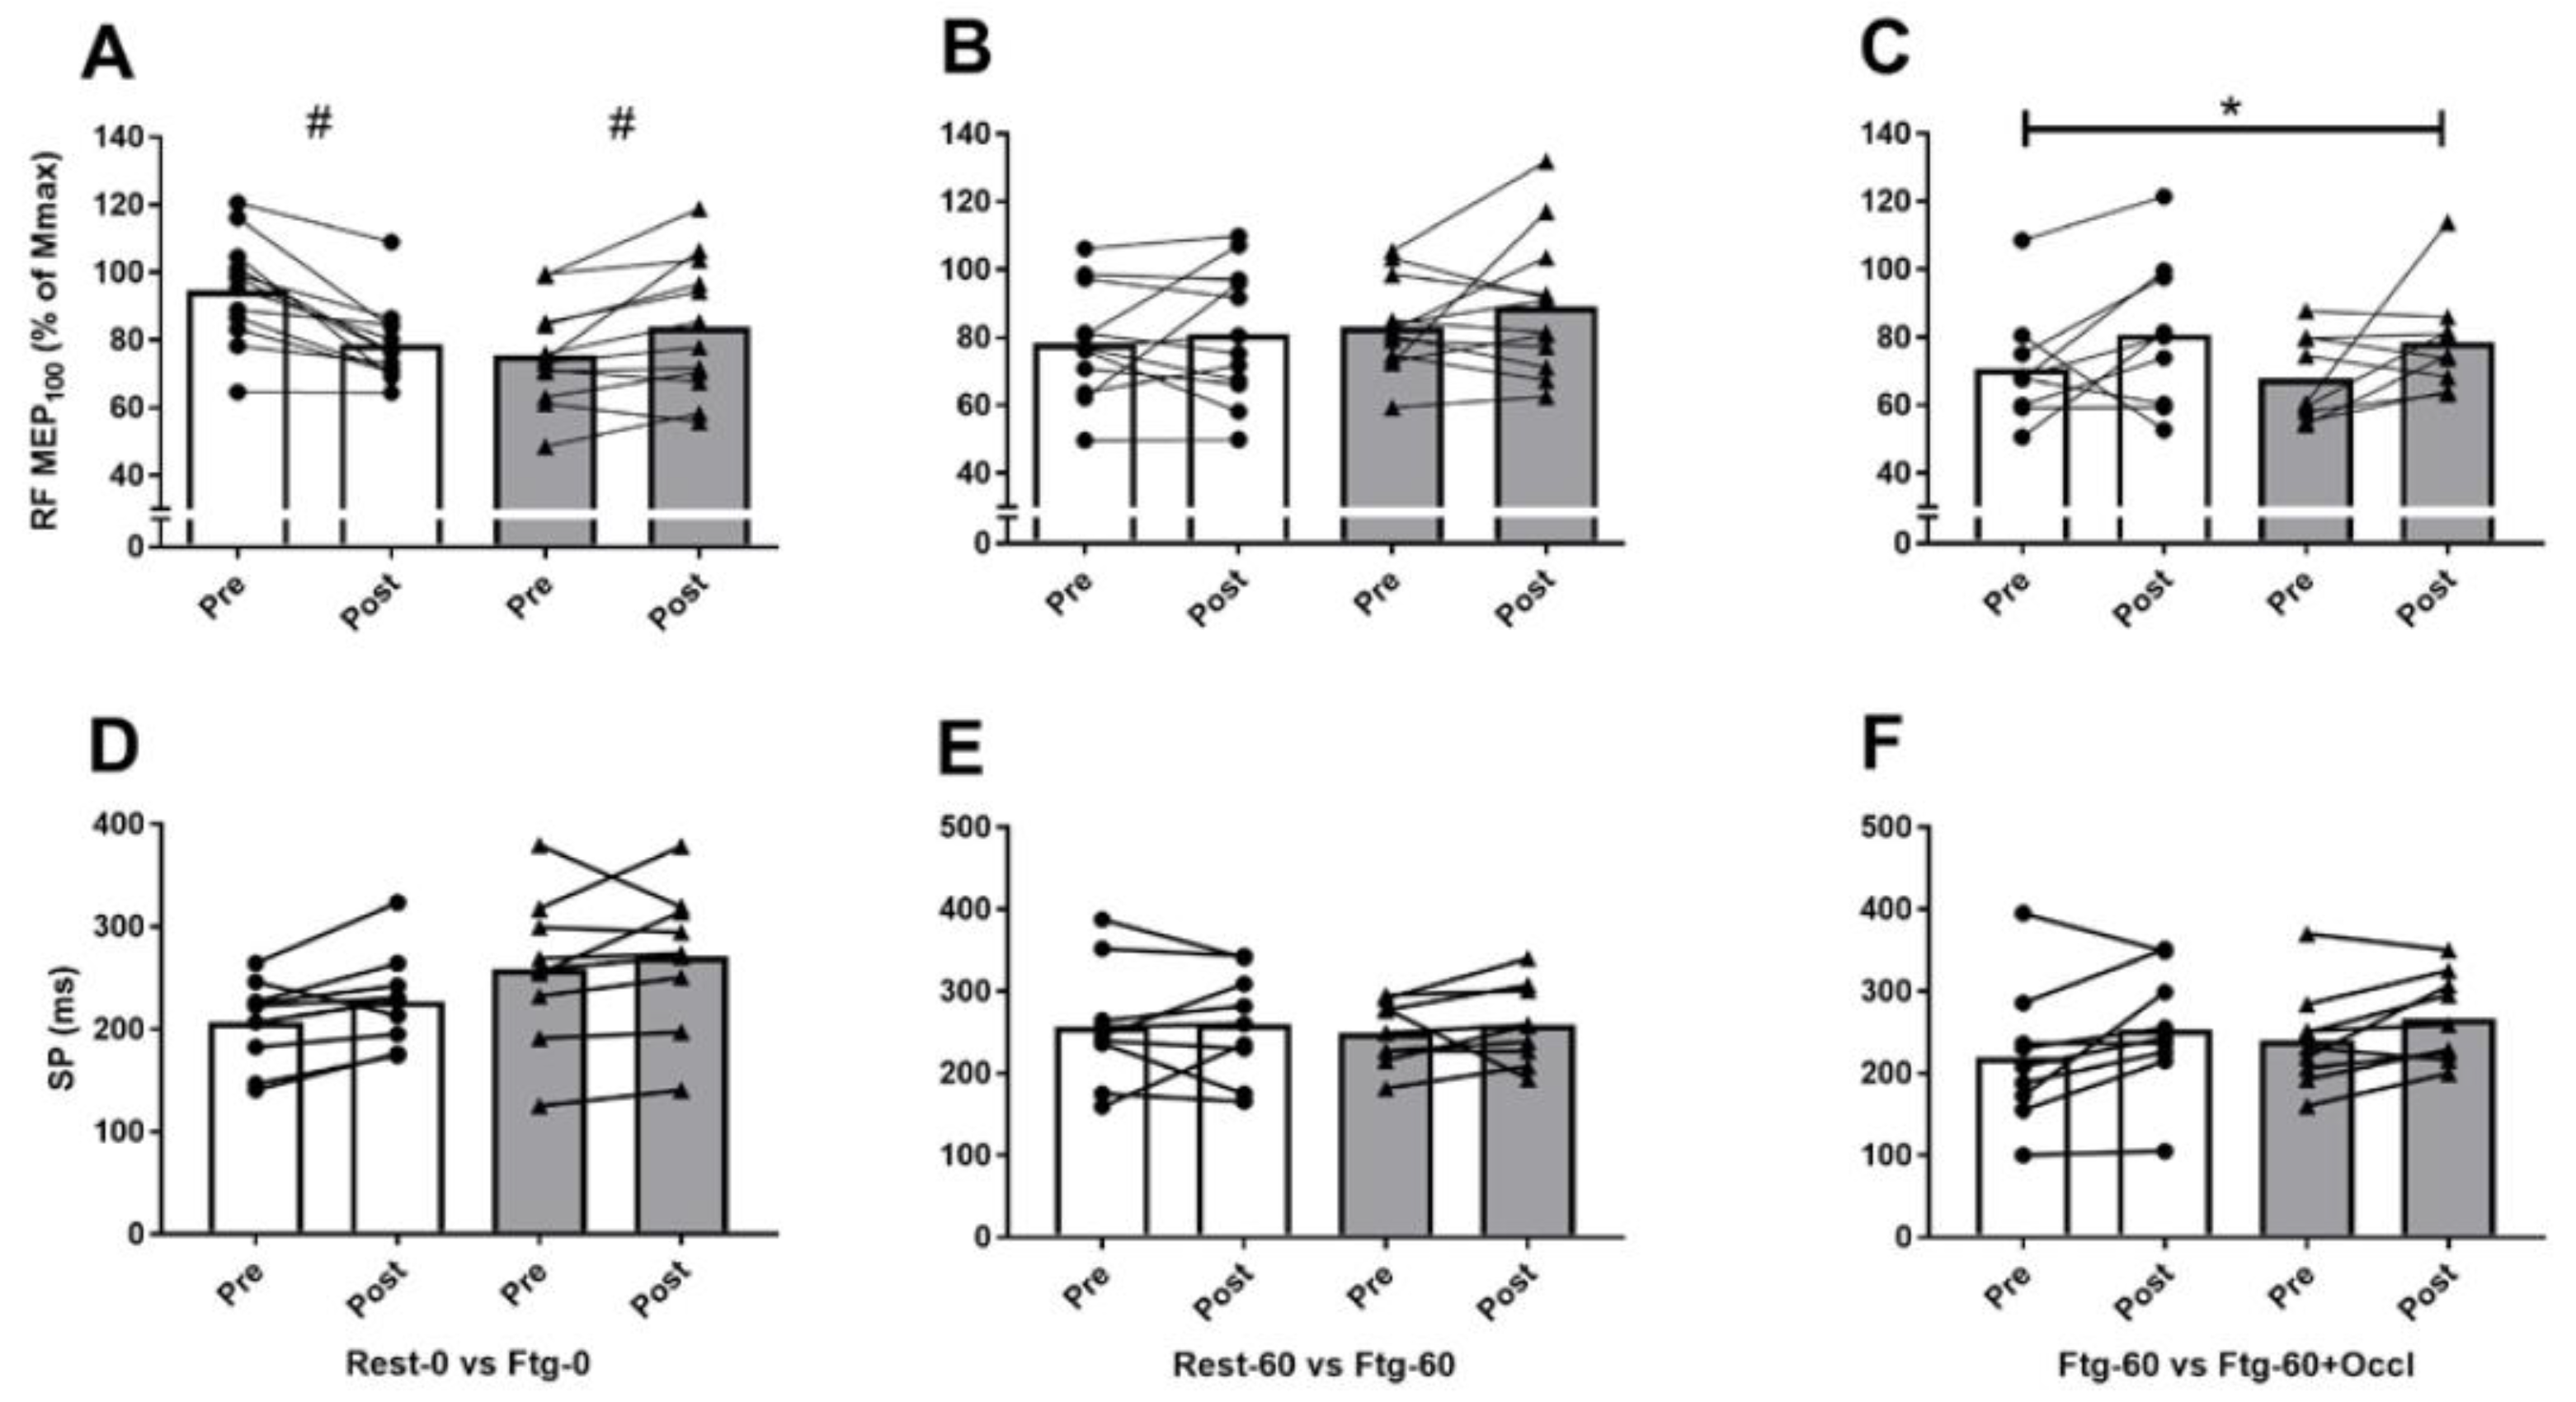
| RF MEP∙Mmax−1 (MEP100) | Baseline | 0.93 ± 0.18 | 0.80 ± 0.21 | 0.77 ± 0.18 | 0.83 ± 0.14 | 0.70 ± 0.16 | 0.67 ± 0.12 |
| Post-test | 0.82 ± 0.18 # | 0.90 ± 0.25 # | 0.79 ± 0.21 | 0.88 ± 0.21 | 0.80 ± 0.22 | 0.78 ± 0.22 | |
| RF MEP∙Mmax−1 (MEP75) | Baseline | 0.94 ± 0.19 | 0.84 ± 0.23 | 0.87 ± 0.20 | 0.92 ± 0.15 | 0.82 ± 0.15 | 0.81 ± 0.15 |
| Post-test | 0.87 ± 0.22 | 0.82 ± 0.20 | 0.83 ± 0.22 | 0.89 ± 0.11 | 0.92 ± 0.24 | 0.84 ± 0.33 | |
| RF MEP∙Mmax−1 (MEP50) | Baseline | 0.96 ± 0.15 | 0.90 ± 0.19 | 0.89 ± 0.18 | 0.97 ± 0.13 | 0.89 ± 0.14 | 0.81 ± 09 |
| Post-test | 0.95 ± 0.16 | 0.88 ± 0.19 | 0.87 ± 0.14 | 0.88 ± 0.22 | 0.97 ± 0.34 | 0.79 ± 0.28 | |
| RF SP100 (ms) | Baseline | 206.7 ± 45.2 | 258.5 ± 78.3 | 257.5 ± 78.6 | 249.3 ± 41.6 | 219.1 ± 84.6 | 240.6 ± 60.5 |
| Post-test | 227.3 ± 50.0 | 270.9 ± 74.7 | 260.1 ± 69.7 | 259.3 ± 52.0 | 253.4 ± 75.3 | 267.4 ± 53.7 | |
| RF SP75 (ms) | Baseline | 211.4 ± 48.3 | 256.8 ± 59.6 | 267.7 ± 64.0 | 252.0 ± 54.3 | 214.1 ± 77.7 | 208.5 ± 96.8 |
| Post-test | 226.1 ± 67.3 | 270.3 ± 77.0 | 254.1 ± 70.3 | 254.9 ± 56.5 | 231.6 ± 67.5 | 250.2 ± 55.9 | |
| RF SP50 (ms) | Baseline | 231.6 ± 40.9 | 276.4 ± 61.4 | 270.0 ± 69.1 | 273.1 ± 45.9 | 207.3 ± 71.8 | 213.1 ± 47.4 |
| Post-test | 248.9 ± 63.2 | 269.8 ± 61.2 | 256.9 ± 61.2 | 261.5 ± 55.6 | 248.5 ± 74.6 | 253.2 ± 77.3 | |
| BF MEP100 (mV.s) | Baseline | 0.009 ± 0.005 | 0.010 ± 0.008 | 0.007 ± 0.004 | 0.009 ± 0.005 | 0.008 ± 0.005 | 0.008 ± 0.004 |
| Post-test | 0.007 ± 0.006 | 0.009 ± 0.006 | 0.007 ± 0.005 | 0.007 ± 0.005 | 0.008 ± 0.005 | 0.006 ± 0.005 | |
| BF MEP75 (mV.s) | Baseline | 0.007 ± 0.005 | 0.009 ± 0.008 | 0.007 ± 0.004 | 0.009 ± 0.006 | 0.007 ± 0.005 | 0.008 ± 0.005 |
| Post-test | 0.007 ± 0.006 | 0.009 ± 0.007 | 0.005 ± 0.005 | 0.007 ± 0.007 | 0.006 ± 0.004 | 0.006 ± 0.005 | |
| BF MEP50 (mV.s) | Baseline | 0.007 ± 0.006 | 0.009 ± 0.008 | 0.007 ± 0.006 | 0.007 ± 0.003 | 0.007 ± 0.006 | 0.006 ± 0.004 |
| Post-test | 0.006 ± 0.006 | 0.008 ± 0.007 | 0.004 ± 0.002 | 0.005 ± 0.003 | 0.005 ± 0.003 | 0.004 ± 0.002 | |
© 2019 by the authors. Licensee MDPI, Basel, Switzerland. This article is an open access article distributed under the terms and conditions of the Creative Commons Attribution (CC BY) license (http://creativecommons.org/licenses/by/4.0/).
Share and Cite
Aboodarda, S.J.; Zhang, C.X.Y.; Sharara, R.; Cline, M.; Millet, G.Y. Exercise-Induced Fatigue in One Leg Does Not Impair the Neuromuscular Performance in the Contralateral Leg but Improves the Excitability of the Ipsilateral Corticospinal Pathway. Brain Sci. 2019, 9, 250. https://doi.org/10.3390/brainsci9100250
Aboodarda SJ, Zhang CXY, Sharara R, Cline M, Millet GY. Exercise-Induced Fatigue in One Leg Does Not Impair the Neuromuscular Performance in the Contralateral Leg but Improves the Excitability of the Ipsilateral Corticospinal Pathway. Brain Sciences. 2019; 9(10):250. https://doi.org/10.3390/brainsci9100250
Chicago/Turabian StyleAboodarda, Saied Jalal, Cindy Xin Yu Zhang, Ruva Sharara, Madeleine Cline, and Guillaume Y Millet. 2019. "Exercise-Induced Fatigue in One Leg Does Not Impair the Neuromuscular Performance in the Contralateral Leg but Improves the Excitability of the Ipsilateral Corticospinal Pathway" Brain Sciences 9, no. 10: 250. https://doi.org/10.3390/brainsci9100250