Corticospinal-Evoked Responses from the Biceps Brachii during Arm Cycling across Multiple Power Outputs


Abstract
:1. Introduction
2. Materials and Methods
2.1. Participants
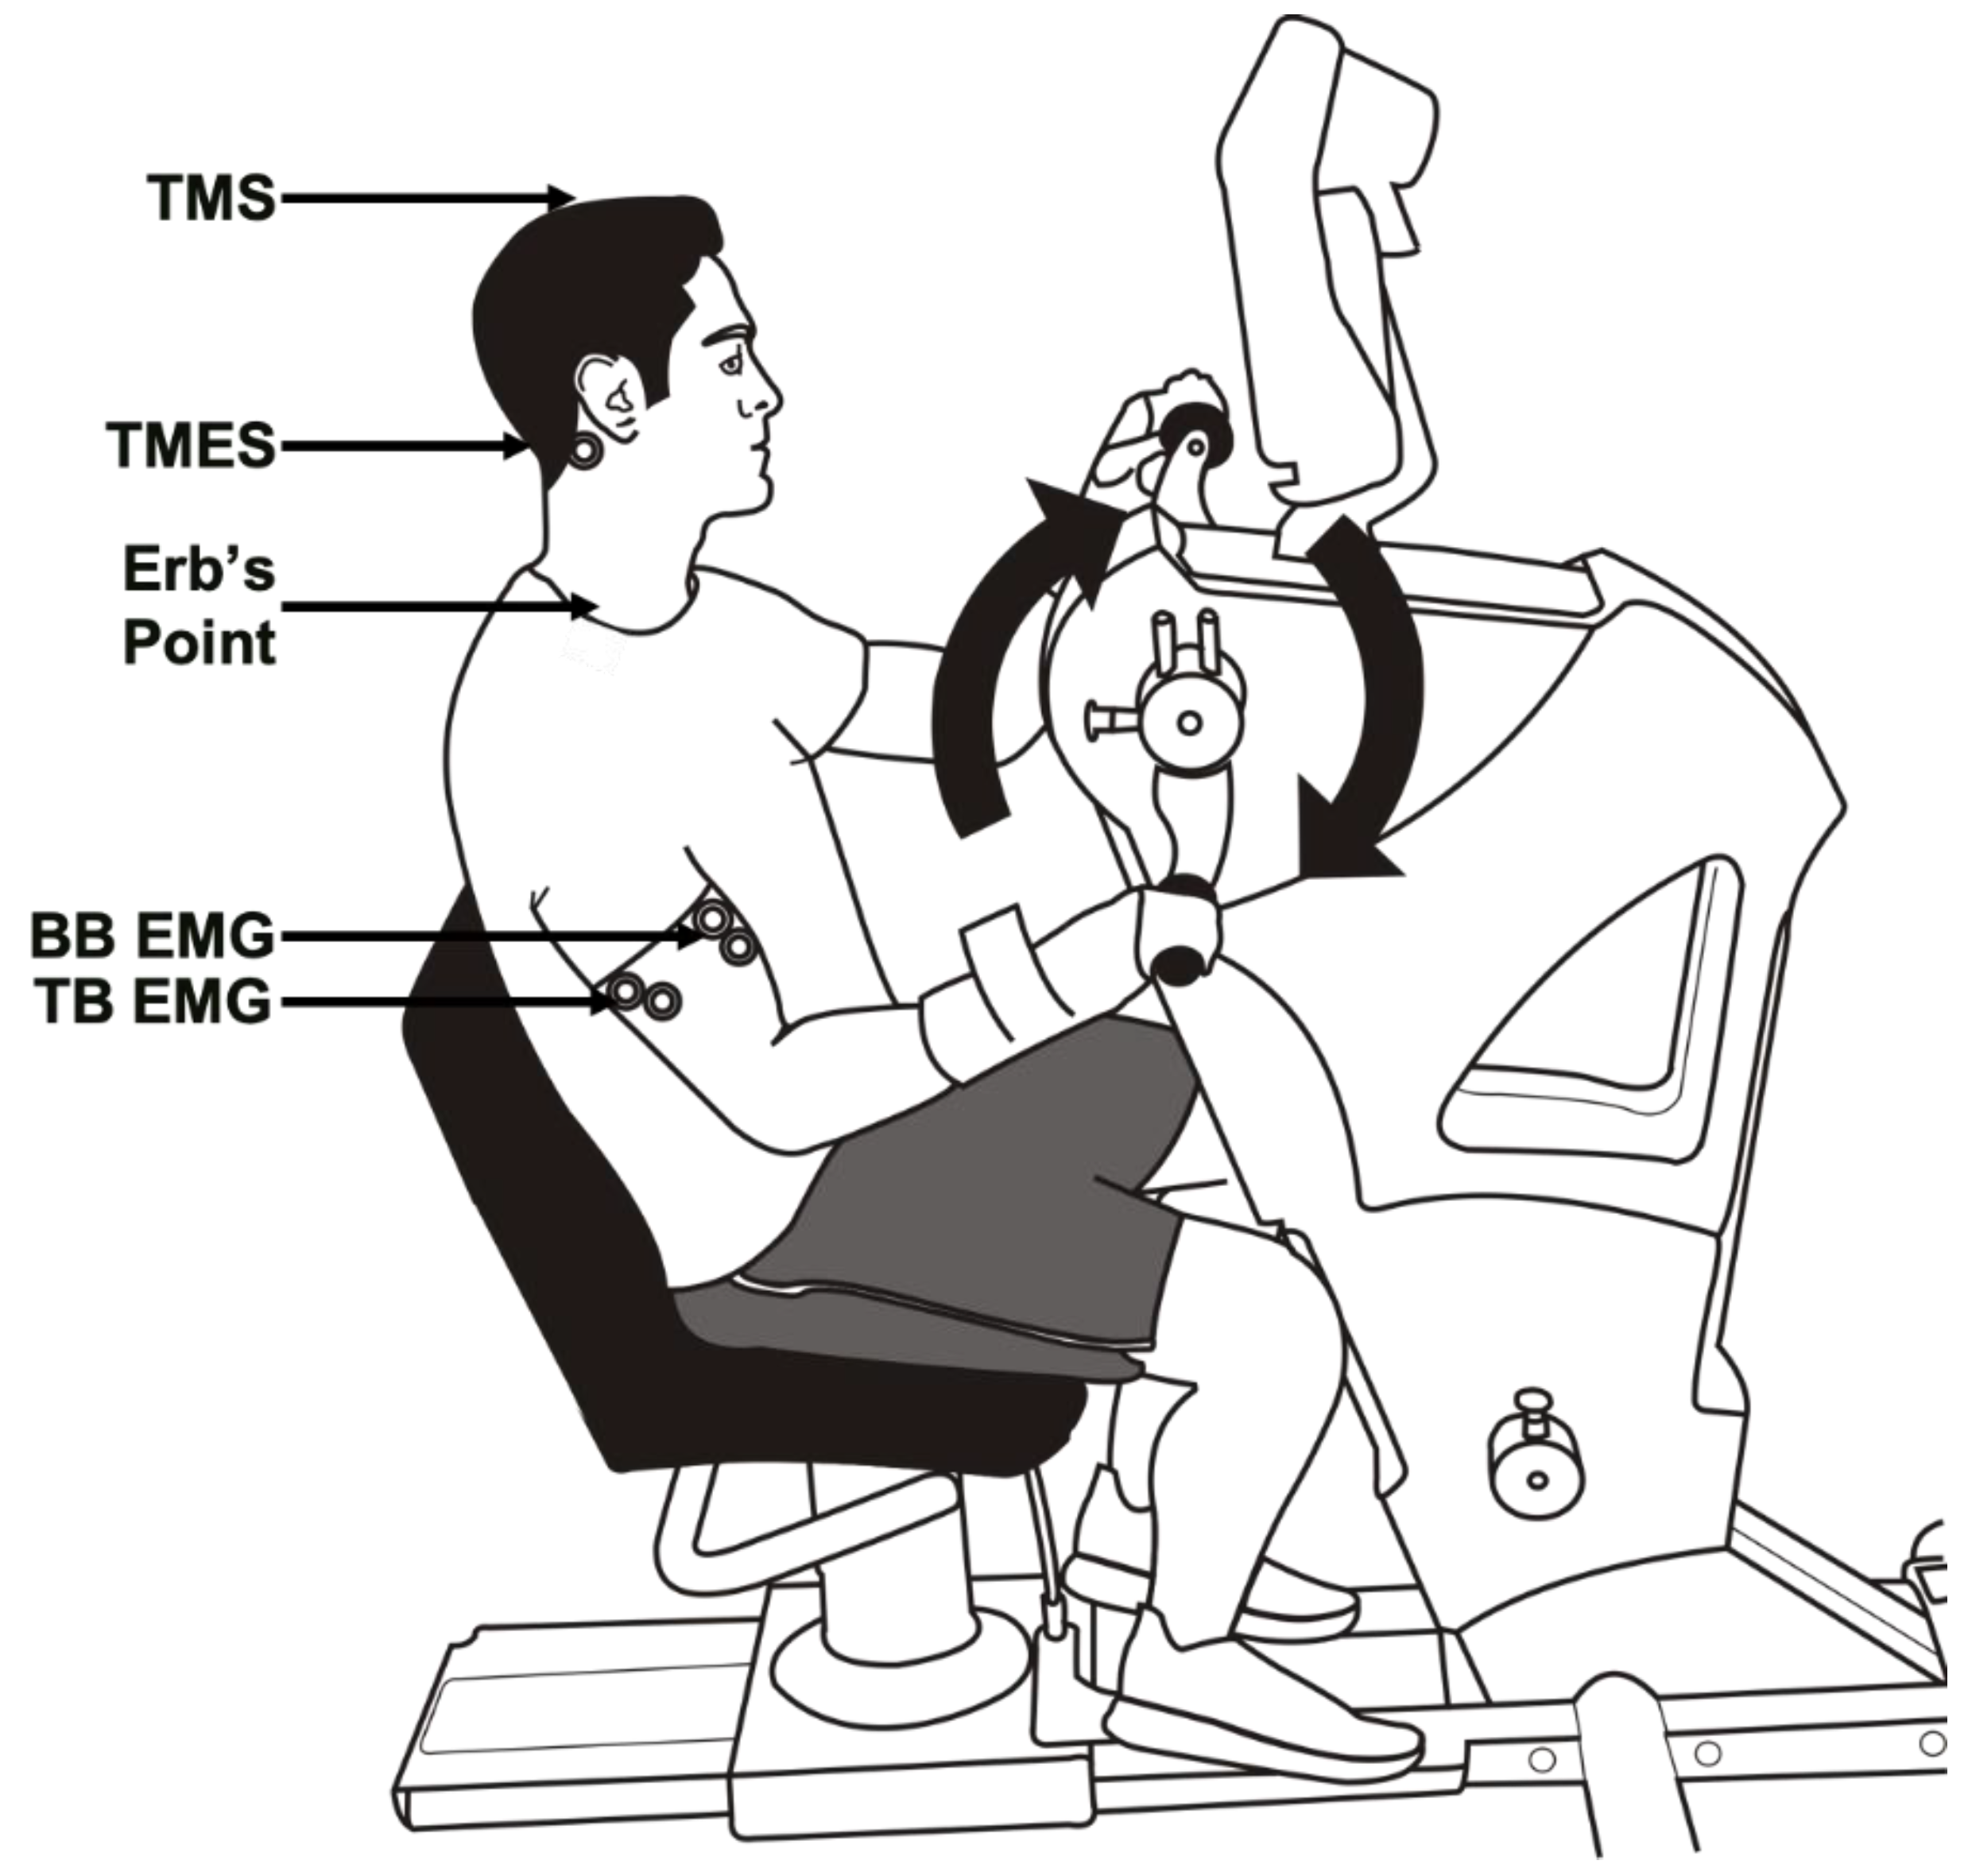
2.2. Experimental Setup
2.3. Electromyography Recordings
2.4. Stimulation Conditions
2.5. Brachial Plexus Stimulation
2.6. TMS
2.7. TMES
2.8. Protocol
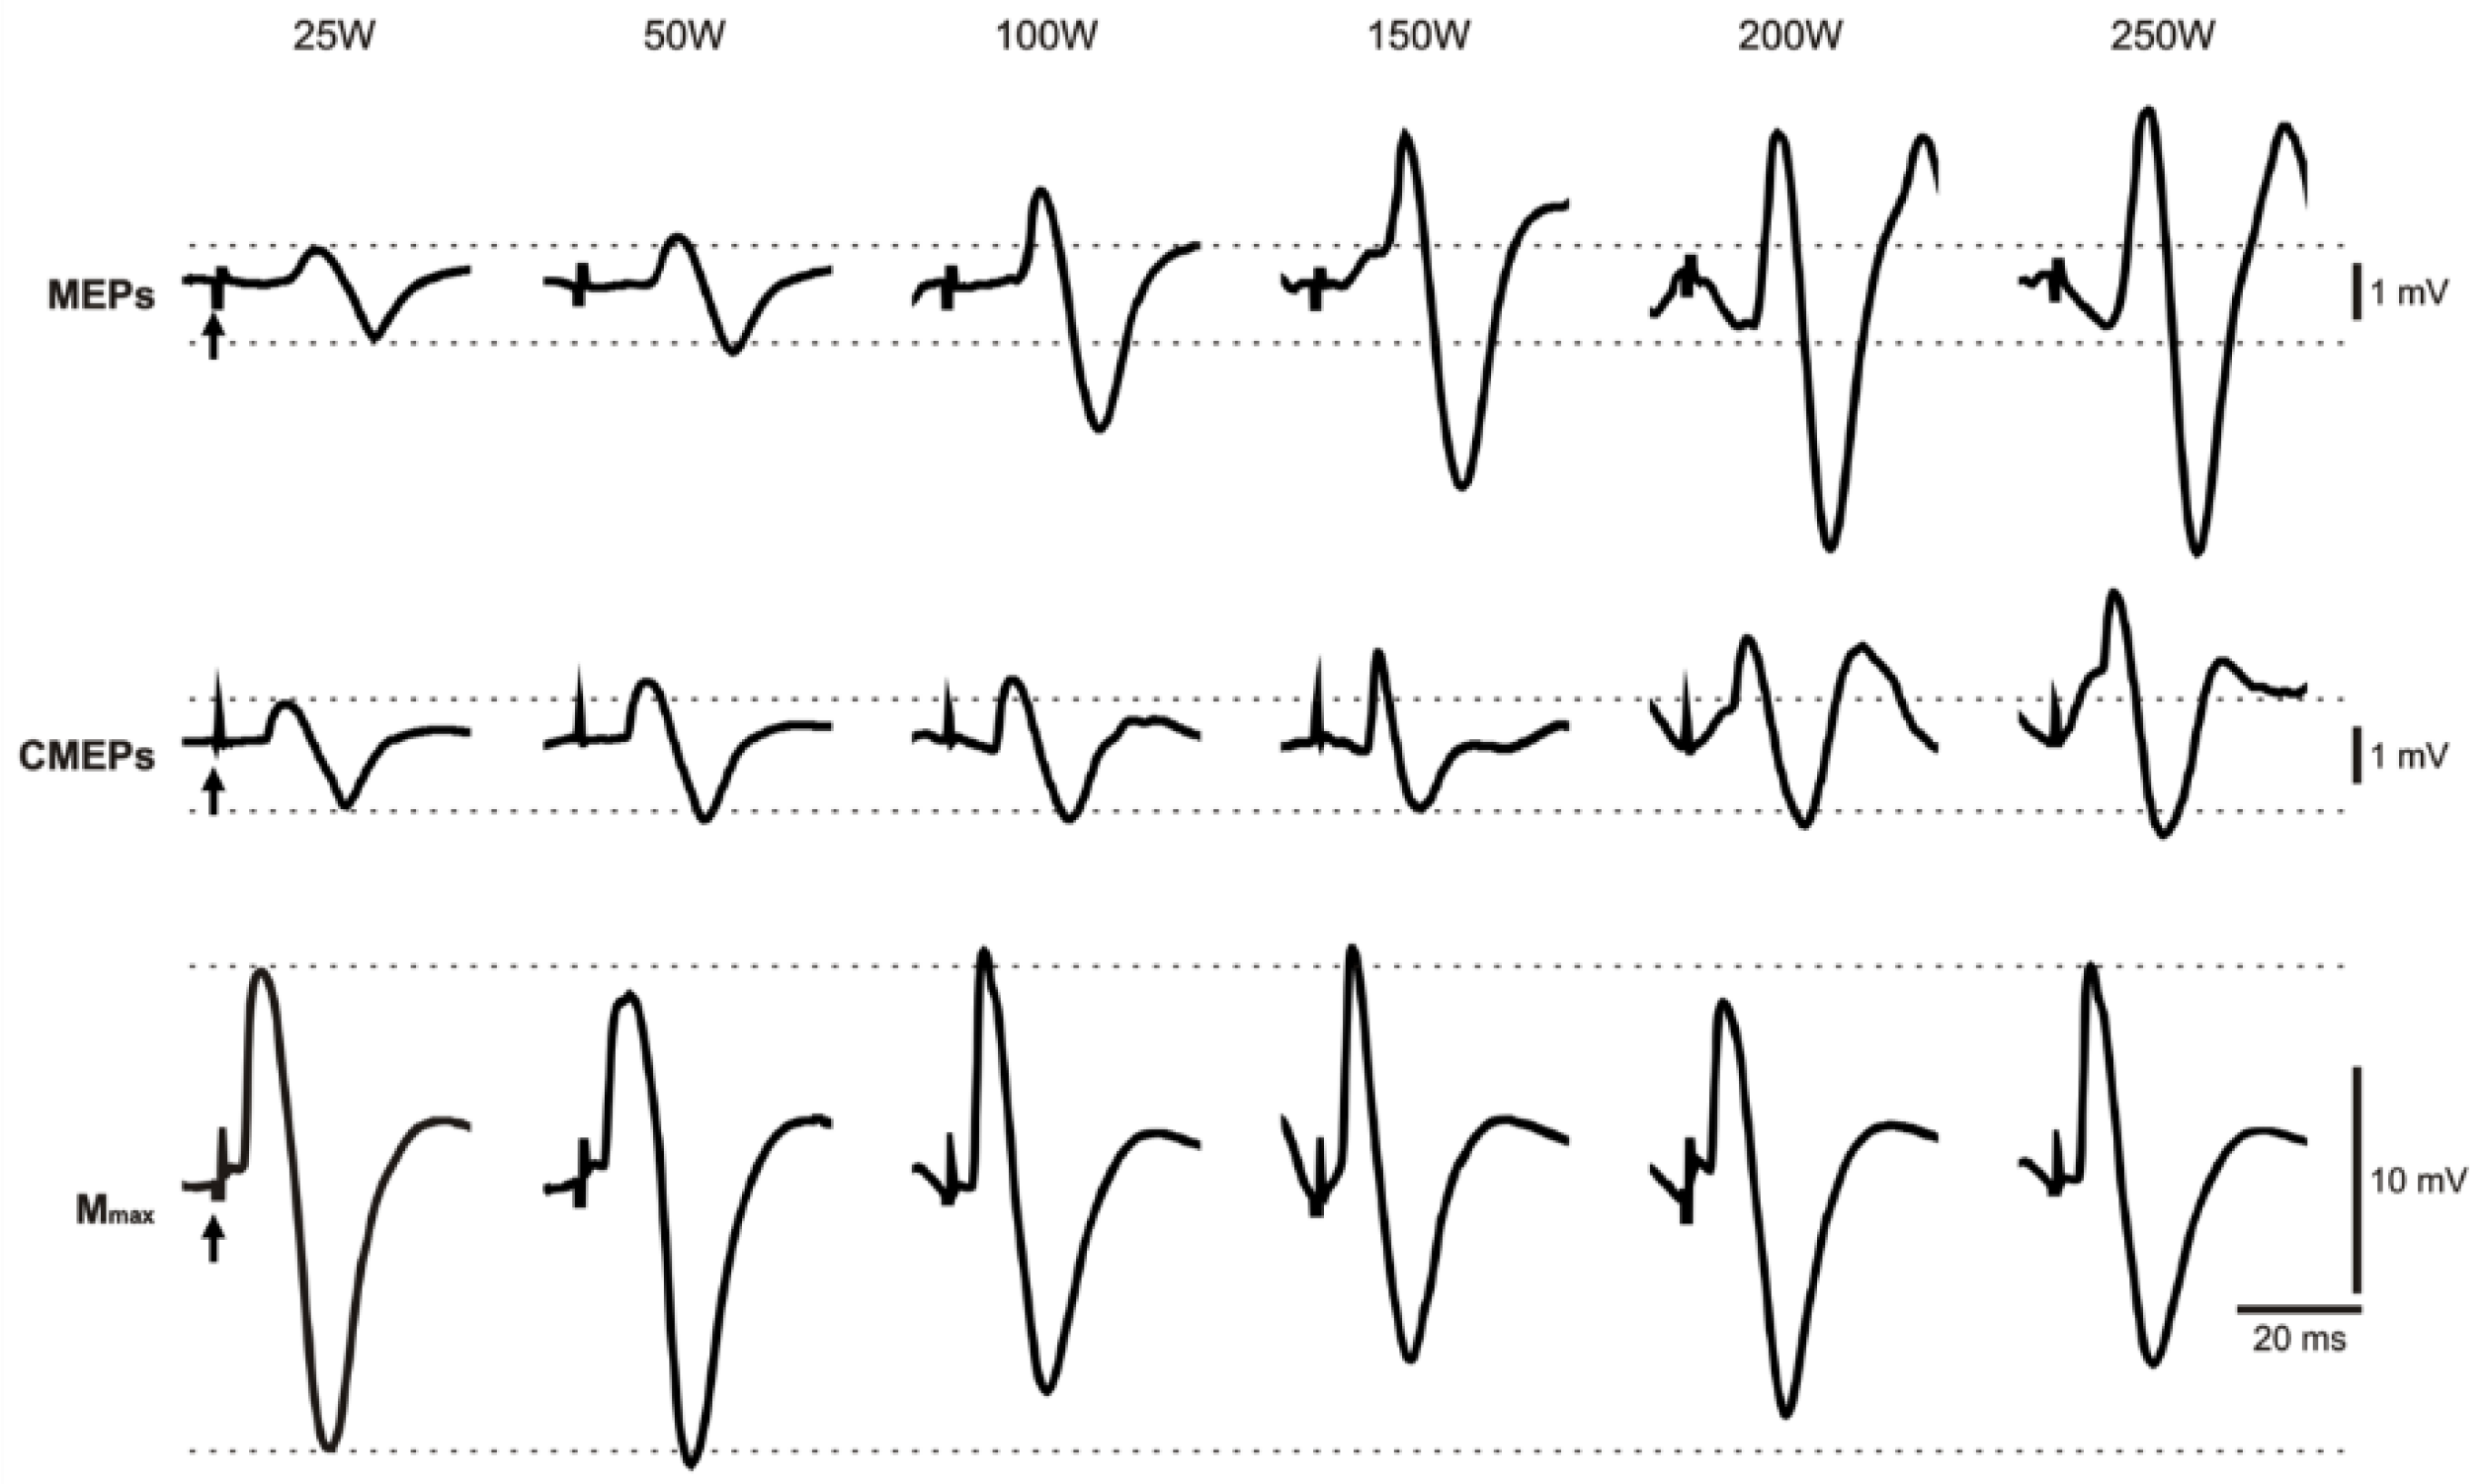
2.9. Data Analysis
2.10. Statistical Analysis
3. Results
3.1. Biceps Brachii Evoked Responses
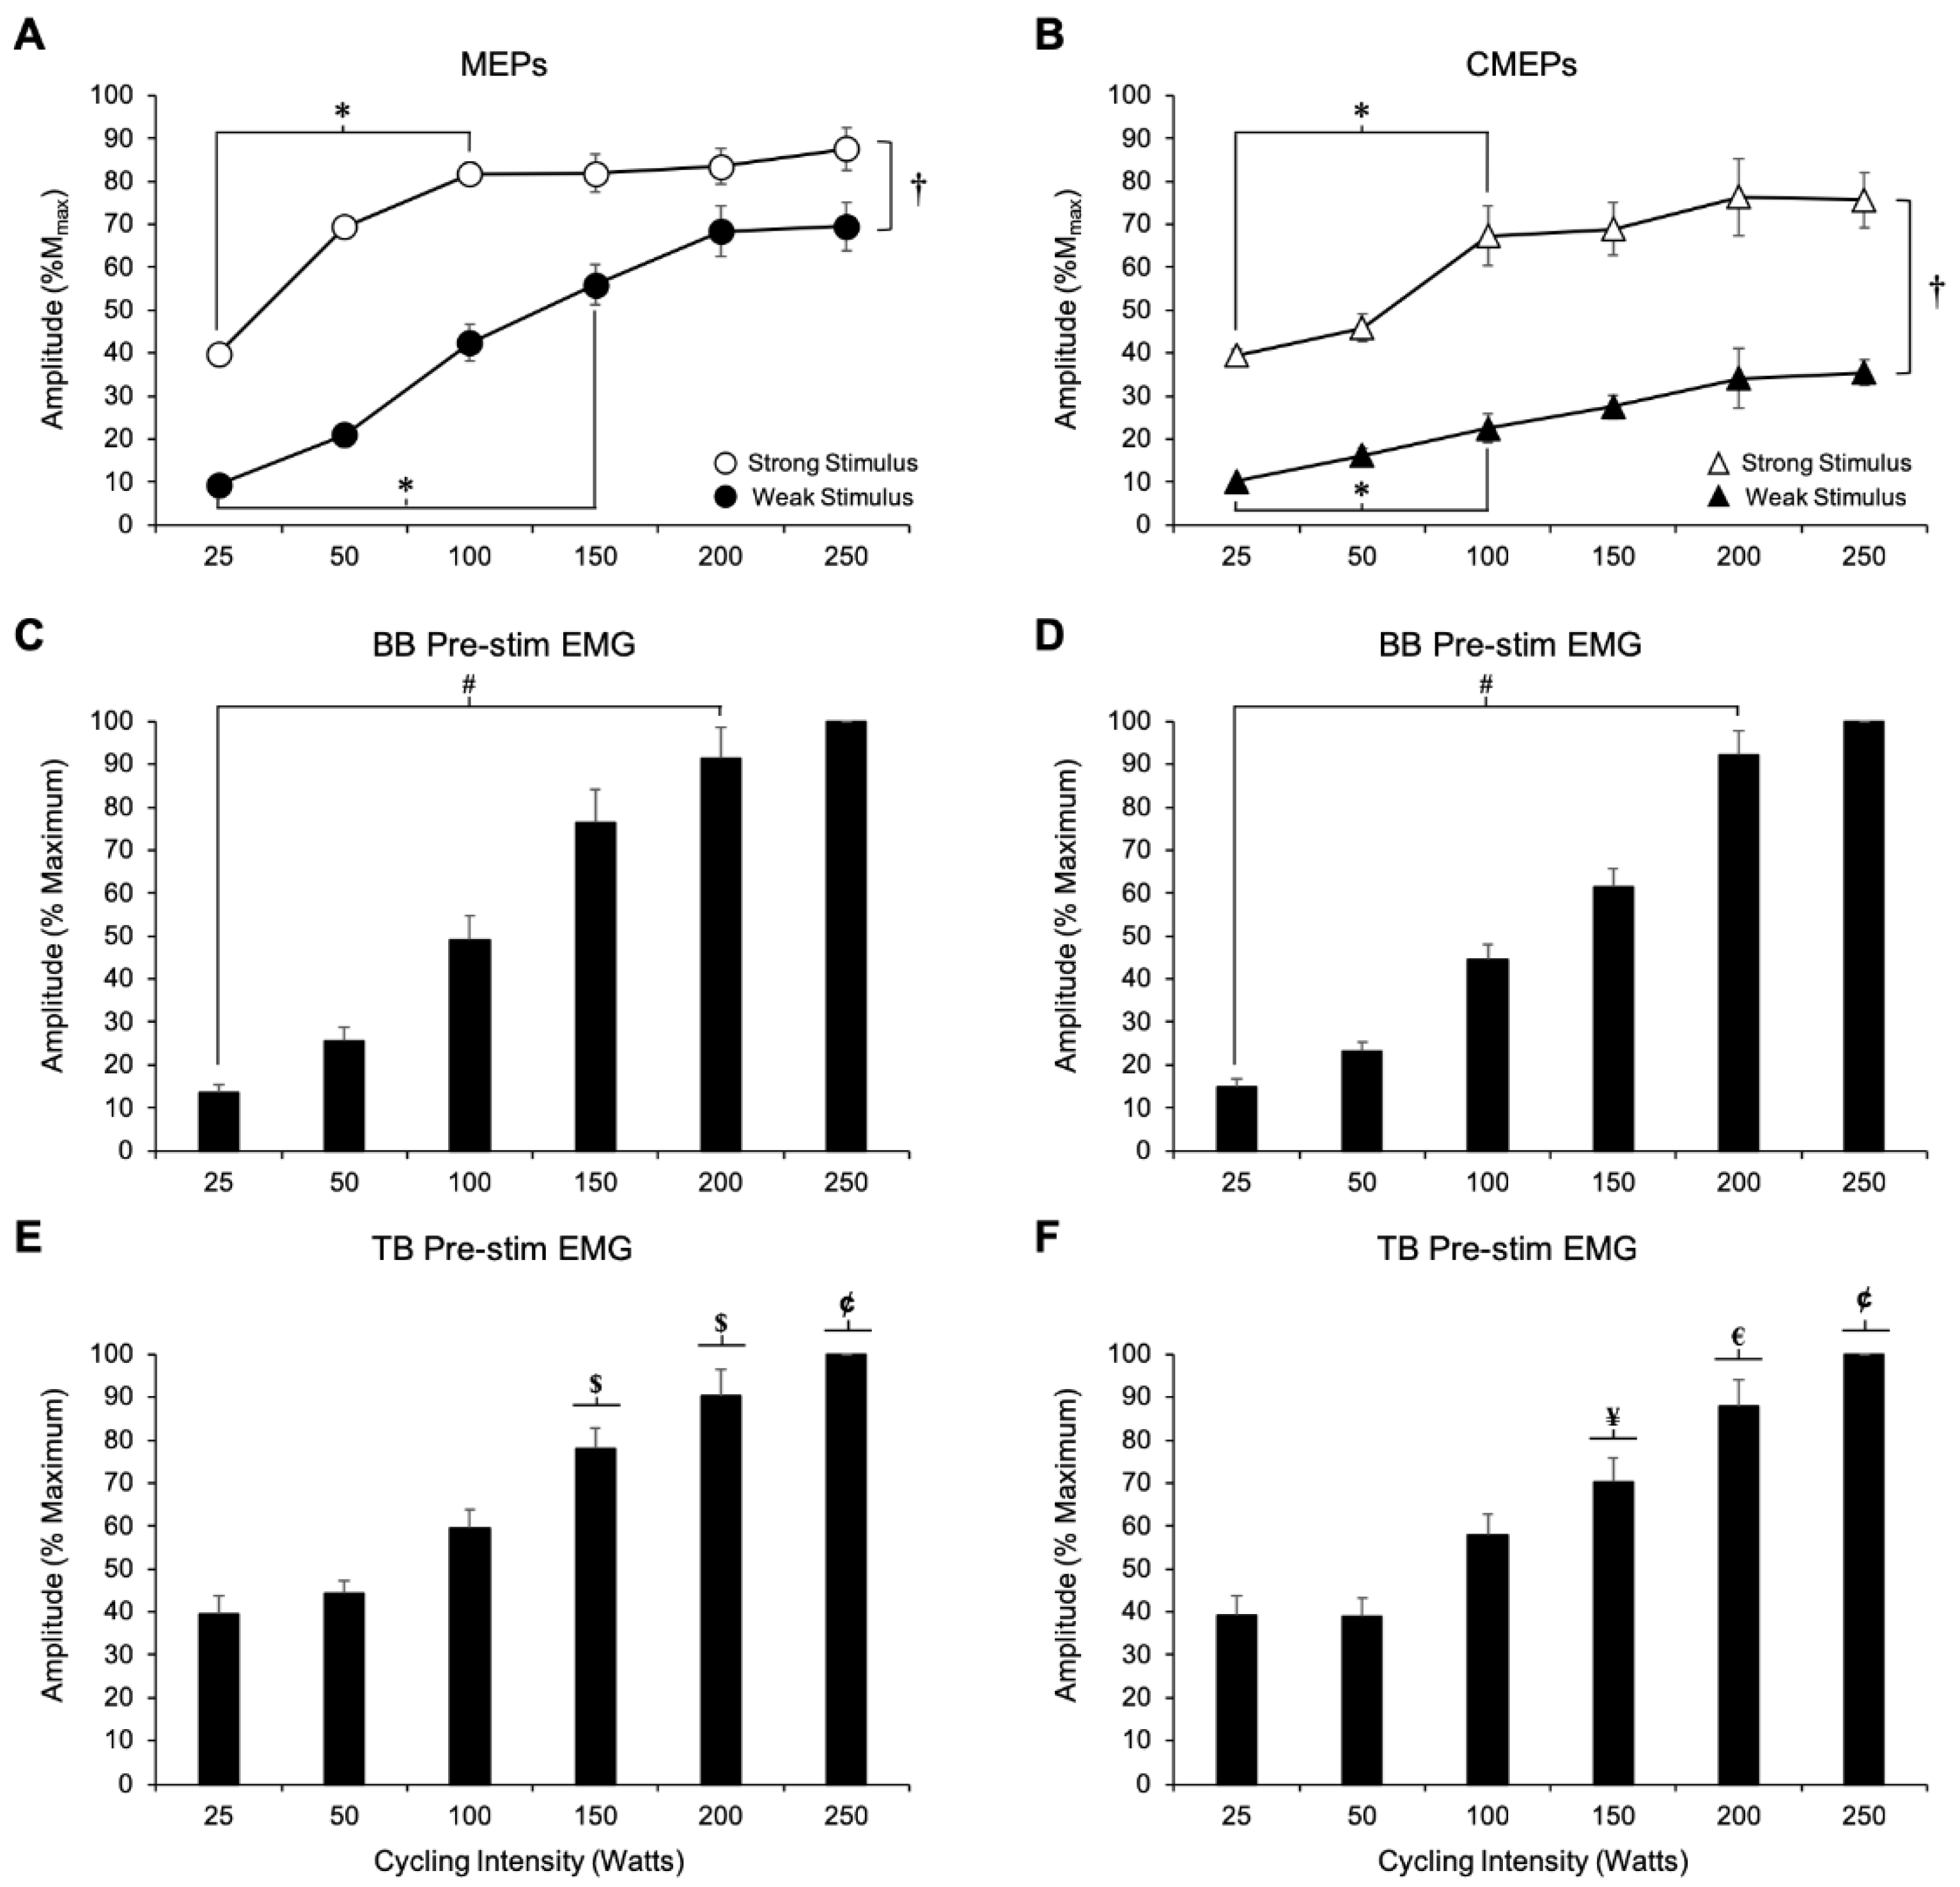
3.1.1. MEP Amplitude
3.1.2. Biceps Brachii Pre-stimulus EMG
3.1.3. Triceps Brachii Pre-Stimulus EMG
3.1.4. CMEP Amplitude
3.1.5. Biceps Brachii Pre-Stimulus EMG
3.1.6. Triceps Brachii Pre-Stimulus EMG
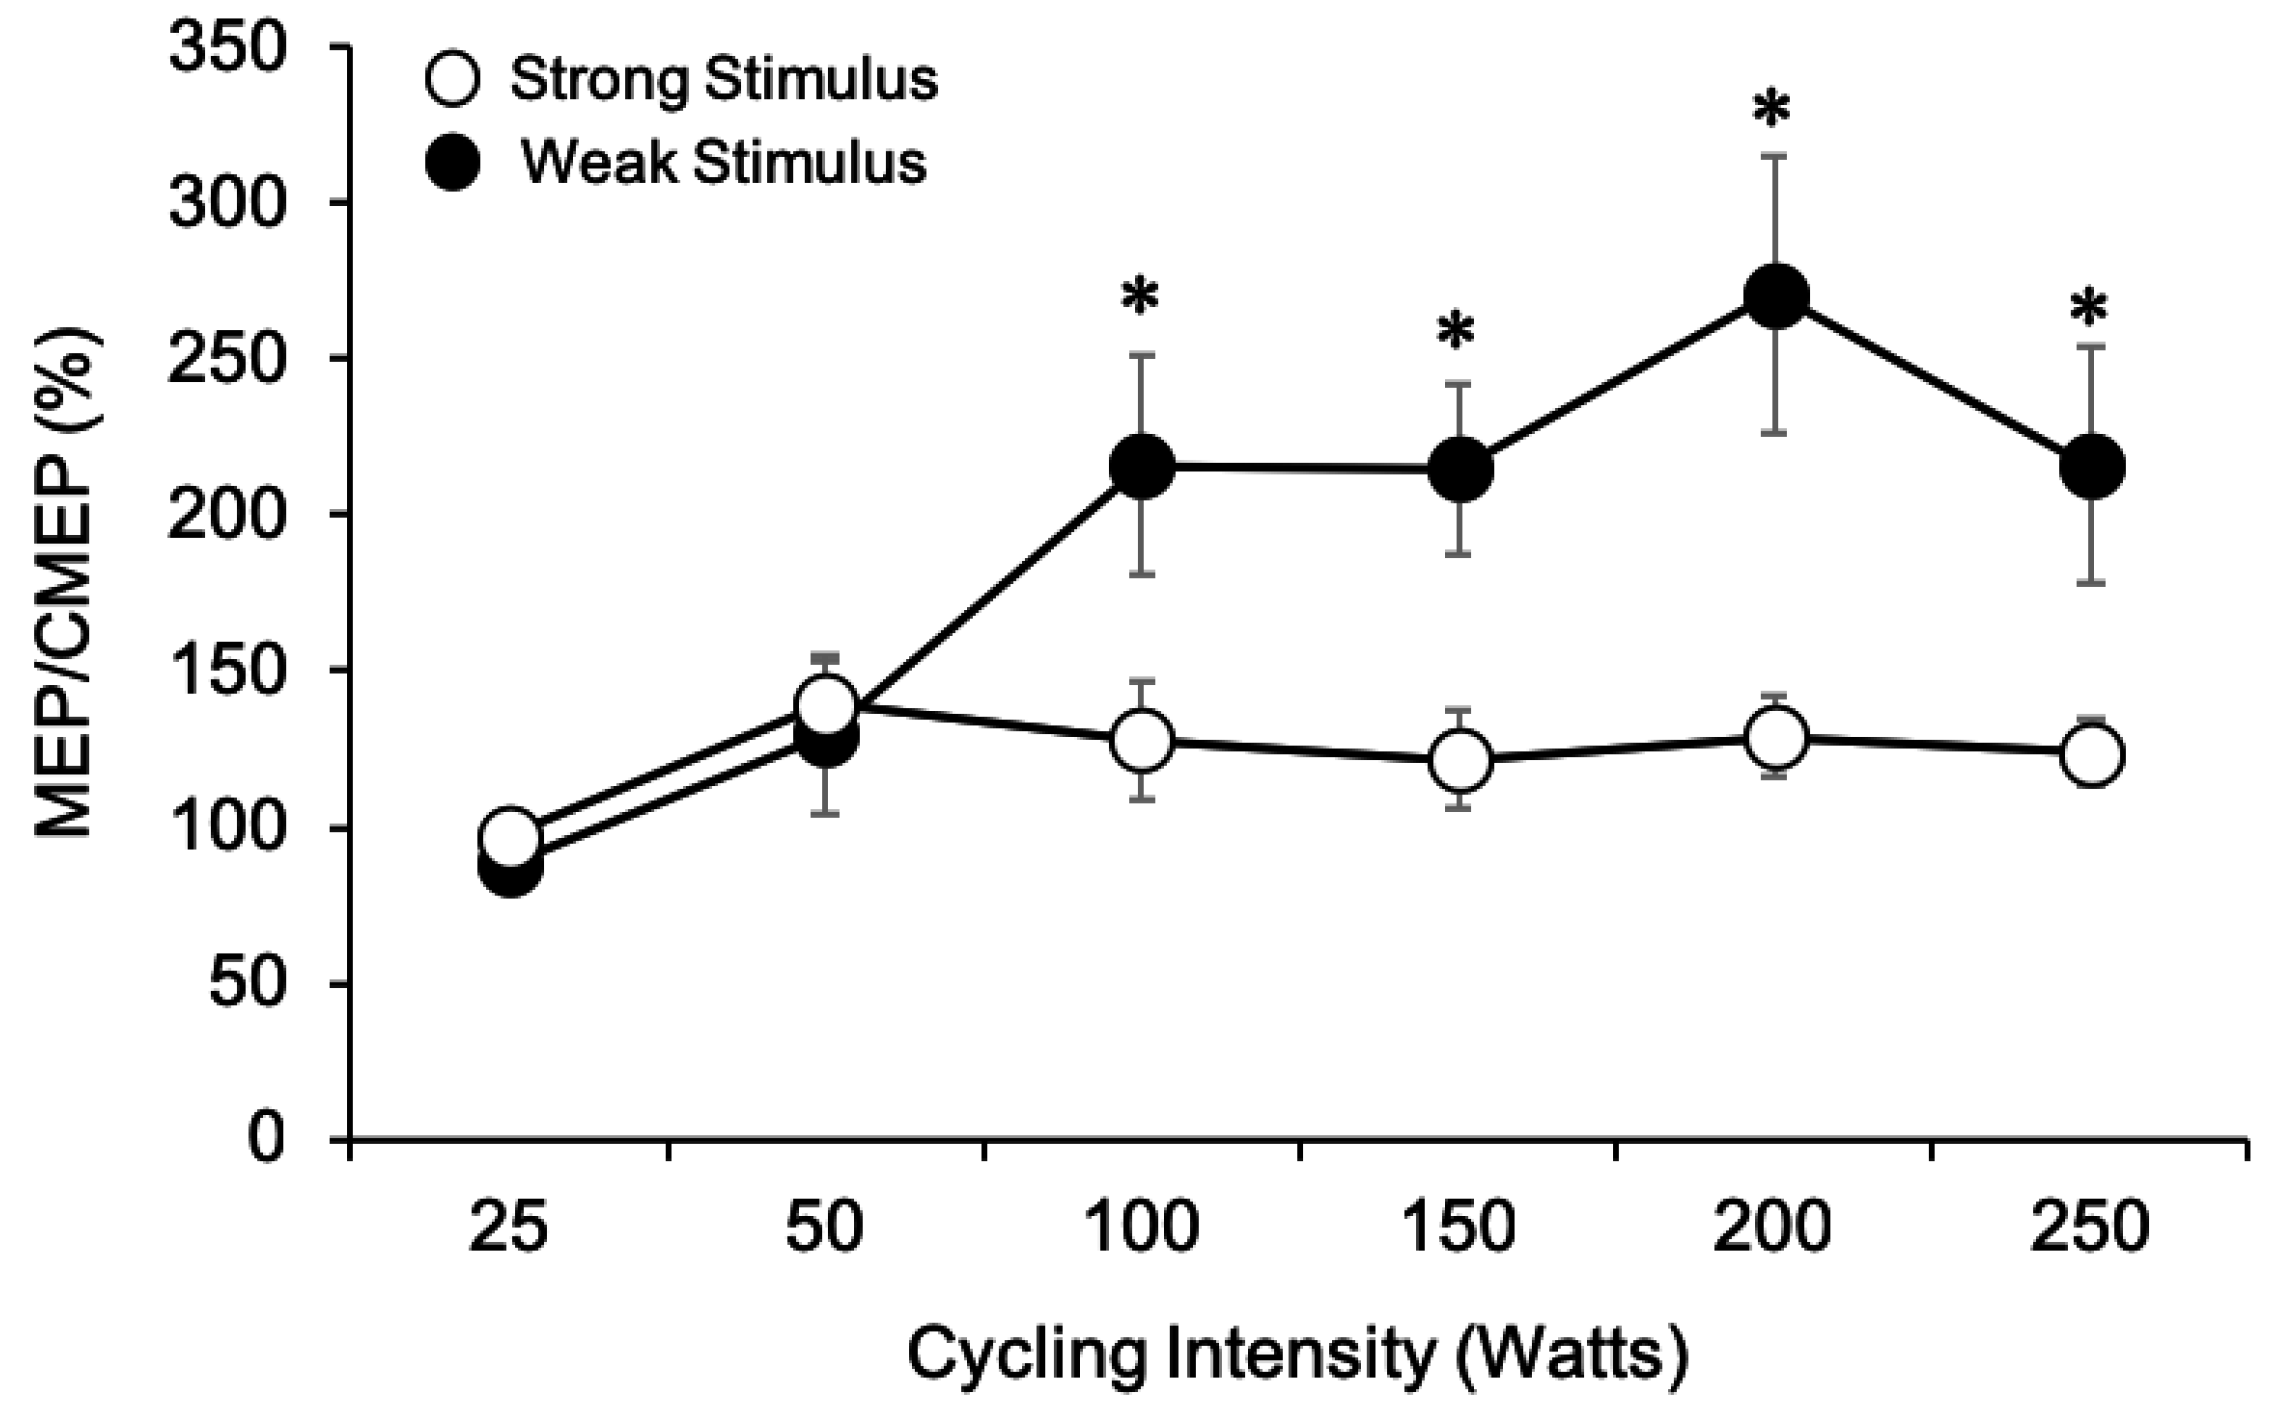
3.1.7. MEP/CMEP Ratios
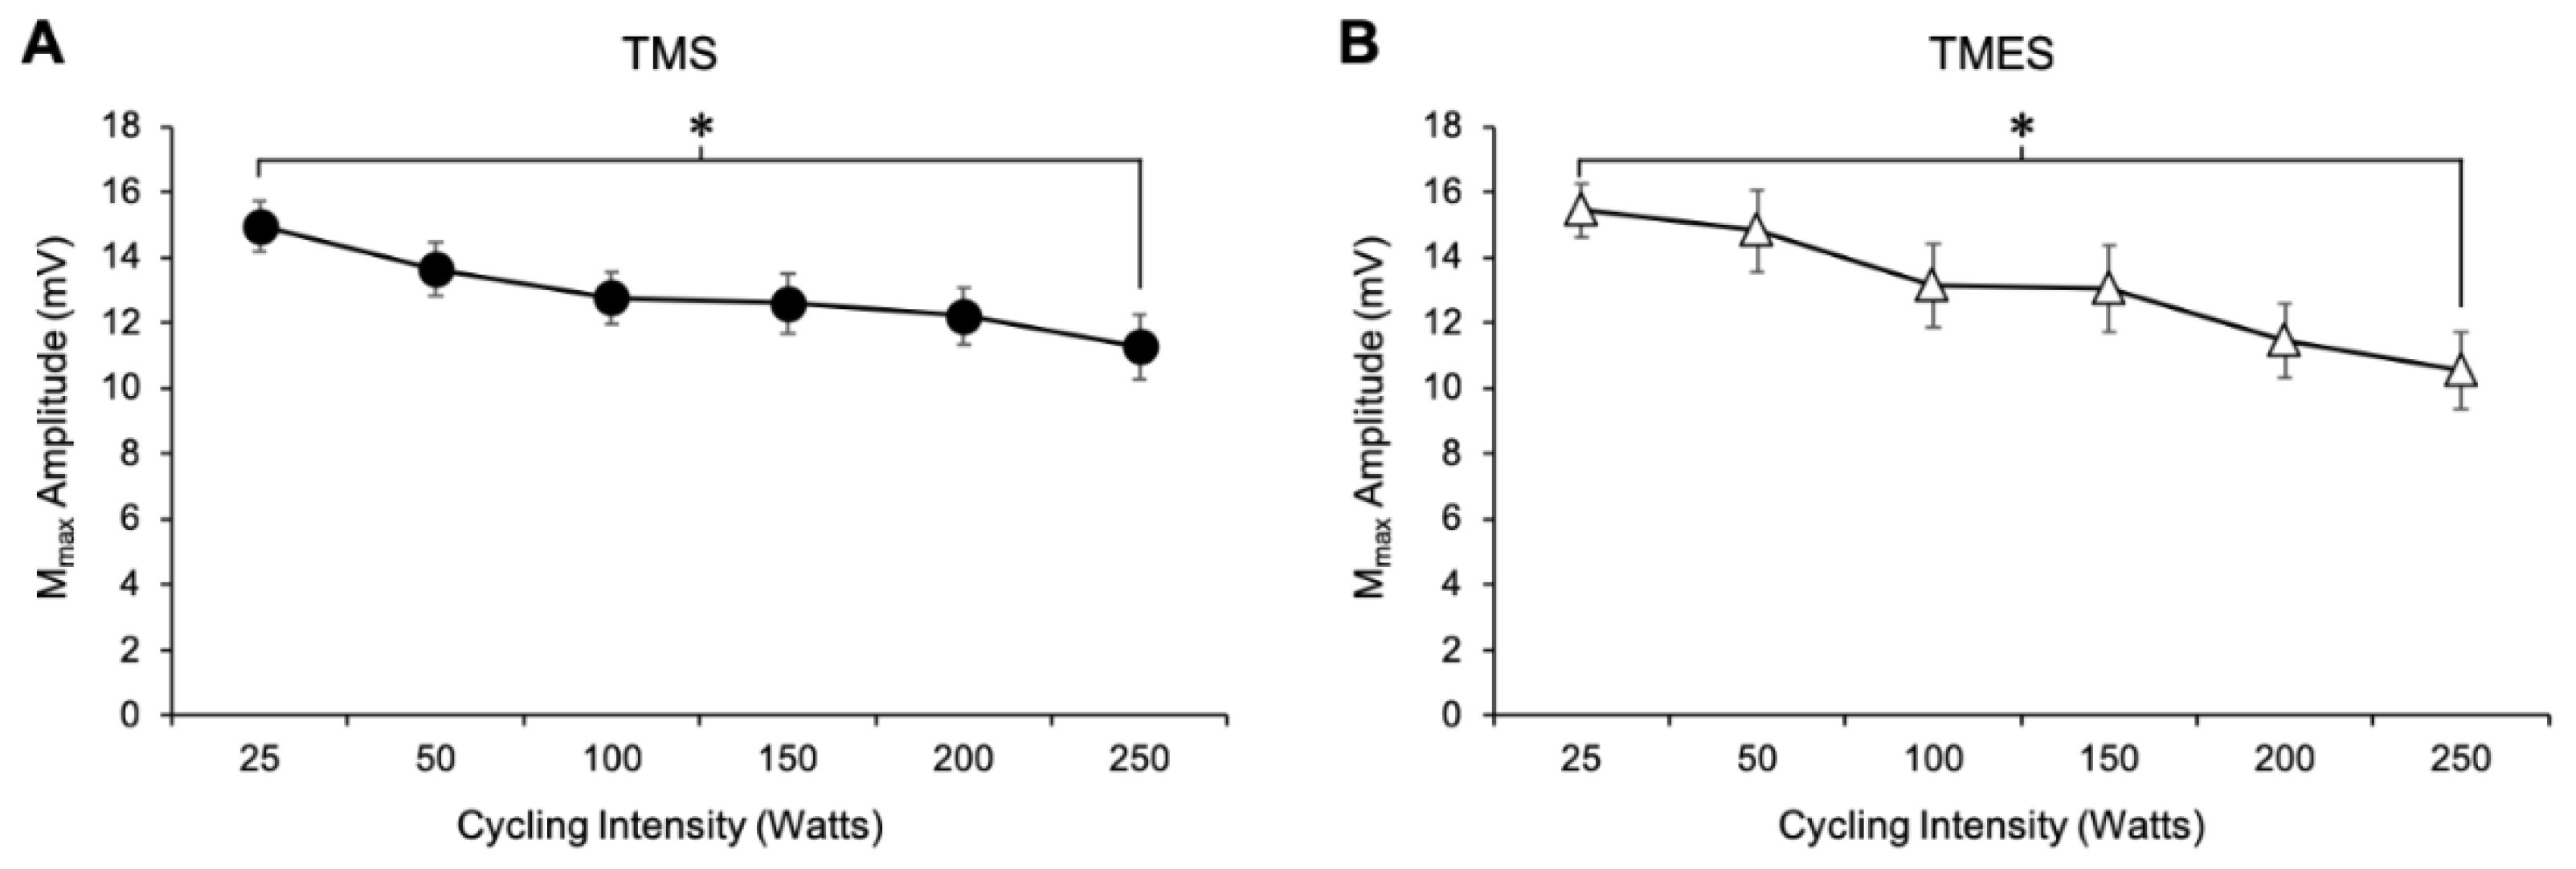
3.1.8. Mmax Amplitude
4. Discussion
4.1. Modulation of Corticospinal and Spinal Excitability with Cycling Intensity
4.2. Modulation of Supraspinal Excitability with Cycling Intensity
4.3. Differences between Stimulation Intensities
4.4. Methodological Considerations
5. Conclusions
Author Contributions
Funding
Acknowledgments
Conflicts of Interest
References
- Martin, P.G.; Gandevia, S.C.; Taylor, J.L. Output of human motoneuron pools to corticospinal inputs during voluntary contractions. J. Neurophysiol. 2006, 95, 3512–3518. [Google Scholar] [CrossRef] [PubMed]
- Todd, G.; Taylor, J.L.; Gandevia, S.C. Measurement of voluntary activation of fresh and fatigued human muscles using transcranial magnetic stimulation. J. Physiol. 2003, 551, 661–671. [Google Scholar] [CrossRef] [PubMed]
- Taylor, J.L.; Allen, G.M.; Butler, J.E.; Gandevia, S.C. Effect of contraction strength on responses in biceps brachii and adductor pollicis to transcranial magnetic stimulation. Exp. Brain Res. 1997, 117, 472–478. [Google Scholar] [CrossRef] [PubMed]
- Oya, T.; Hoffman, B.W.; Cresswell, A.G. Corticospinal-evoked responses in lower limb muscles during voluntary contractions at varying strengths. J. Appl. Physiol. 2008, 105, 1527–1532. [Google Scholar] [CrossRef] [PubMed] [Green Version]
- Weavil, J.C.; Sidhu, S.K.; Mangum, T.S.; Richardson, R.S.; Amann, M. Intensity-dependent alterations in the excitability of cortical and spinal projections to the knee extensors during isometric and locomotor exercise. Am. J. Physiol. Regul. Integr. Comp. Physiol. 2015, 308, R998–R1007. [Google Scholar] [CrossRef] [Green Version]
- Lockyer, E.J.; Benson, R.J.; Hynes, A.P.; Alcock, L.R.; Spence, A.J.; Button, D.C.; Power, K.E. Intensity matters: effects of cadence and power output on corticospinal excitability during arm cycling are phase- and muscle-dependent. J. Neurophysiol. 2018, 120, 2908–2921. [Google Scholar] [CrossRef] [PubMed]
- Spence, A.J.; Alcock, L.R.; Lockyer, E.J.; Button, D.C.; Power, K.E. Phase- and Workload-Dependent Changes in Corticospinal Excitability to the Biceps and Triceps Brachii during Arm Cycling. Brain Sci. 2016, 6, 60. [Google Scholar] [CrossRef]
- Zehr, E.P.; Carroll, T.J.; Chua, R.; Collins, D.F.; Frigon, A.; Haridas, C.; Hundza, S.R.; Thompson, A.K. Possible contributions of CPG activity to the control of rhythmic human arm movement. Can. J. Physiol. Pharmacol. 2004, 82, 556–568. [Google Scholar] [CrossRef]
- Zehr, E.P.; Collins, D.F.; Frigon, A.; Hoogenboom, N. Neural control of rhythmic human arm movement: Phase dependence and task modulation of hoffmann reflexes in forearm muscles. J. Neurophysiol. 2003, 89, 12–21. [Google Scholar] [CrossRef]
- Forman, D.; Raj, A.; Button, D.C.; Power, K.E. Corticospinal excitability of the biceps brachii is higher during arm cycling than an intensity-matched tonic contraction. J. Neurophysiol. 2014, 112, 1142–1151. [Google Scholar] [CrossRef] [Green Version]
- Forman, D.A.; Monks, M.; Power, K.E. Corticospinal excitability, assessed through stimulus response curves, is phase-, task-, and muscle-dependent during arm cycling. Neurosci. Lett. 2018, 692, 100–106. [Google Scholar] [CrossRef]
- Rossi, S.; Hallett, M.; Rossini, P.M.; Pascual-Leone, A. Safety of TMS Consensus Group. Safety, ethical considerations, and application guidelines for the use of transcranial magnetic stimulation in clinical practice and research. Clin. Neurophysiol. 2009, 120, 2008–2039. [Google Scholar] [CrossRef]
- Veale, J.F. Edinburgh Handedness Inventory—Short Form: A revised version based on confirmatory factor analysis. Laterality 2014, 19, 164–177. [Google Scholar] [CrossRef]
- Forman, D.A.; Philpott, D.T.; Button, D.C.; Power, K.E. Cadence-dependent changes in corticospinal excitability of the biceps brachii during arm cycling. J. Neurophysiol. 2015, 114, 2285–2294. [Google Scholar] [CrossRef] [Green Version]
- Manning, C.D.; Bawa, P. Heteronymous reflex connections in human upper limb muscles in response to stretch of forearm muscles. J. Neurophysiol. 2011, 106, 1489–1499. [Google Scholar] [CrossRef]
- Power, K.E.; Lockyer, E.J.; Forman, D.A.; Button, D.C. Modulation of motoneurone excitability during rhythmic motor outputs. Appl. Physiol. Nutr. Metab. 2018, 43, 1176–1185. [Google Scholar] [CrossRef]
- Taylor, J.L.; Gandevia, S.C. Noninvasive stimulation of the human corticospinal tract. J. Appl. Physiol. 2004, 96, 1496–1503. [Google Scholar] [CrossRef]
- Taylor, J.L. Stimulation at the cervicomedullary junction in human subjects. J. Electromyogr. Kinesiol. 2006, 16, 215–223. [Google Scholar] [CrossRef]
- De Luca, C.J.; LeFever, R.S.; McCue, M.P.; Xenakis, A.P. Behaviour of human motor units in different muscles during linearly varying contractions. J. Physiol. 1982, 329, 113–128. [Google Scholar] [CrossRef]
- Kukulka, C.G.; Clamann, H.P. Comparison of the recruitment and discharge properties of motor units in human brachial biceps and adductor pollicis during isometric contractions. Brain Res. 1981, 219, 45–55. [Google Scholar] [CrossRef]
- Forman, D.A.; Richards, M.; Forman, G.N.; Holmes, M.W.; Power, K.E. Changes in Corticospinal and Spinal Excitability to the Biceps Brachii with a Neutral vs. Pronated Handgrip Position Differ between Arm Cycling and Tonic Elbow Flexion. Front. Hum. Neurosci. 2016, 10, 543. [Google Scholar] [CrossRef] [Green Version]
- MacDonell, C.W.; Power, K.E.; Chopek, J.W.; Gardiner, K.R.; Gardiner, P.F. Extensor motoneurone properties are altered immediately before and during fictive locomotion in the adult decerebrate rat. J. Physiol. 2015, 593, 2327–2342. [Google Scholar] [CrossRef] [Green Version]
- Power, K.E.; McCrea, D.A.; Fedirchuk, B. Intraspinally mediated state-dependent enhancement of motoneurone excitability during fictive scratch in the adult decerebrate cat. J. Physiol. 2010, 588, 2839–2857. [Google Scholar] [CrossRef]
- Krawitz, S.; Fedirchuk, B.; Dai, Y.; Jordan, L.M.; McCrea, D.A. State-dependent hyperpolarization of voltage threshold enhances motoneurone excitability during fictive locomotion in the cat. J. Physiol. 2001, 532, 271–281. [Google Scholar] [CrossRef]
- Ridding, M.C.; Taylor, J.L.; Rothwell, J.C. The effect of voluntary contraction on cortico-cortical inhibition in human motor cortex. J. Physiol. 1995, 487, 541–548. [Google Scholar] [CrossRef]
- Kujirai, T.; Caramia, M.D.; Rothwell, J.C.; Day, B.L.; Thompson, P.D.; Ferbert, A.; Wroe, S.; Asselman, P.; Marsden, C.D. Corticocortical inhibition in human motor cortex. J. Physiol. 1993, 471, 501–519. [Google Scholar] [CrossRef]
- Ortu, E.; Deriu, F.; Suppa, A.; Tolu, E.; Rothwell, J.C. Effects of volitional contraction on intracortical inhibition and facilitation in the human motor cortex. J. Physiol. 2008, 586, 5147–5159. [Google Scholar] [CrossRef]
- Alcock, L.R.; Spence, A.J.; Lockyer, E.J.; Button, D.C.; Power, K.E. Short-interval intracortical inhibition to the biceps brachii is present during arm cycling but is not different than a position- and intensity-matched tonic contraction. Exp. Brain Res. 2019, 237, 2145–2154. [Google Scholar] [CrossRef]
- Price, M.J.; Collins, L.; Smith, P.M.; Goss-Sampson, M. The effects of cadence and power output upon physiological and biomechanical responses to incremental arm-crank ergometry. Appl. Physiol. Nutr. Metab. 2007, 32, 686–692. [Google Scholar] [CrossRef]
- Christensen, L.O.; Johannsen, P.; Sinkjaer, T.; Petersen, N.; Pyndt, H.S.; Nielsen, J.B. Cerebral activation during bicycle movements in man. Exp. Brain Res. 2000, 135, 66–72. [Google Scholar] [CrossRef]


© 2019 by the authors. Licensee MDPI, Basel, Switzerland. This article is an open access article distributed under the terms and conditions of the Creative Commons Attribution (CC BY) license (http://creativecommons.org/licenses/by/4.0/).
Share and Cite
Lockyer, E.J.; Hosel, K.; Nippard, A.P.; Button, D.C.; Power, K.E. Corticospinal-Evoked Responses from the Biceps Brachii during Arm Cycling across Multiple Power Outputs. Brain Sci. 2019, 9, 205. https://doi.org/10.3390/brainsci9080205
Lockyer EJ, Hosel K, Nippard AP, Button DC, Power KE. Corticospinal-Evoked Responses from the Biceps Brachii during Arm Cycling across Multiple Power Outputs. Brain Sciences. 2019; 9(8):205. https://doi.org/10.3390/brainsci9080205
Chicago/Turabian StyleLockyer, Evan J., Katarina Hosel, Anna P. Nippard, Duane C. Button, and Kevin E. Power. 2019. "Corticospinal-Evoked Responses from the Biceps Brachii during Arm Cycling across Multiple Power Outputs" Brain Sciences 9, no. 8: 205. https://doi.org/10.3390/brainsci9080205
APA StyleLockyer, E. J., Hosel, K., Nippard, A. P., Button, D. C., & Power, K. E. (2019). Corticospinal-Evoked Responses from the Biceps Brachii during Arm Cycling across Multiple Power Outputs. Brain Sciences, 9(8), 205. https://doi.org/10.3390/brainsci9080205