2.1. Spontaneous Ca2+ Waves Occur in Axonal Growth Cones of Developing Hippocampal Neurons
To determine whether Ca
2+ waves occur in dissociated hippocampal neurons, we loaded fetal rat hippocampal neurons with the Ca
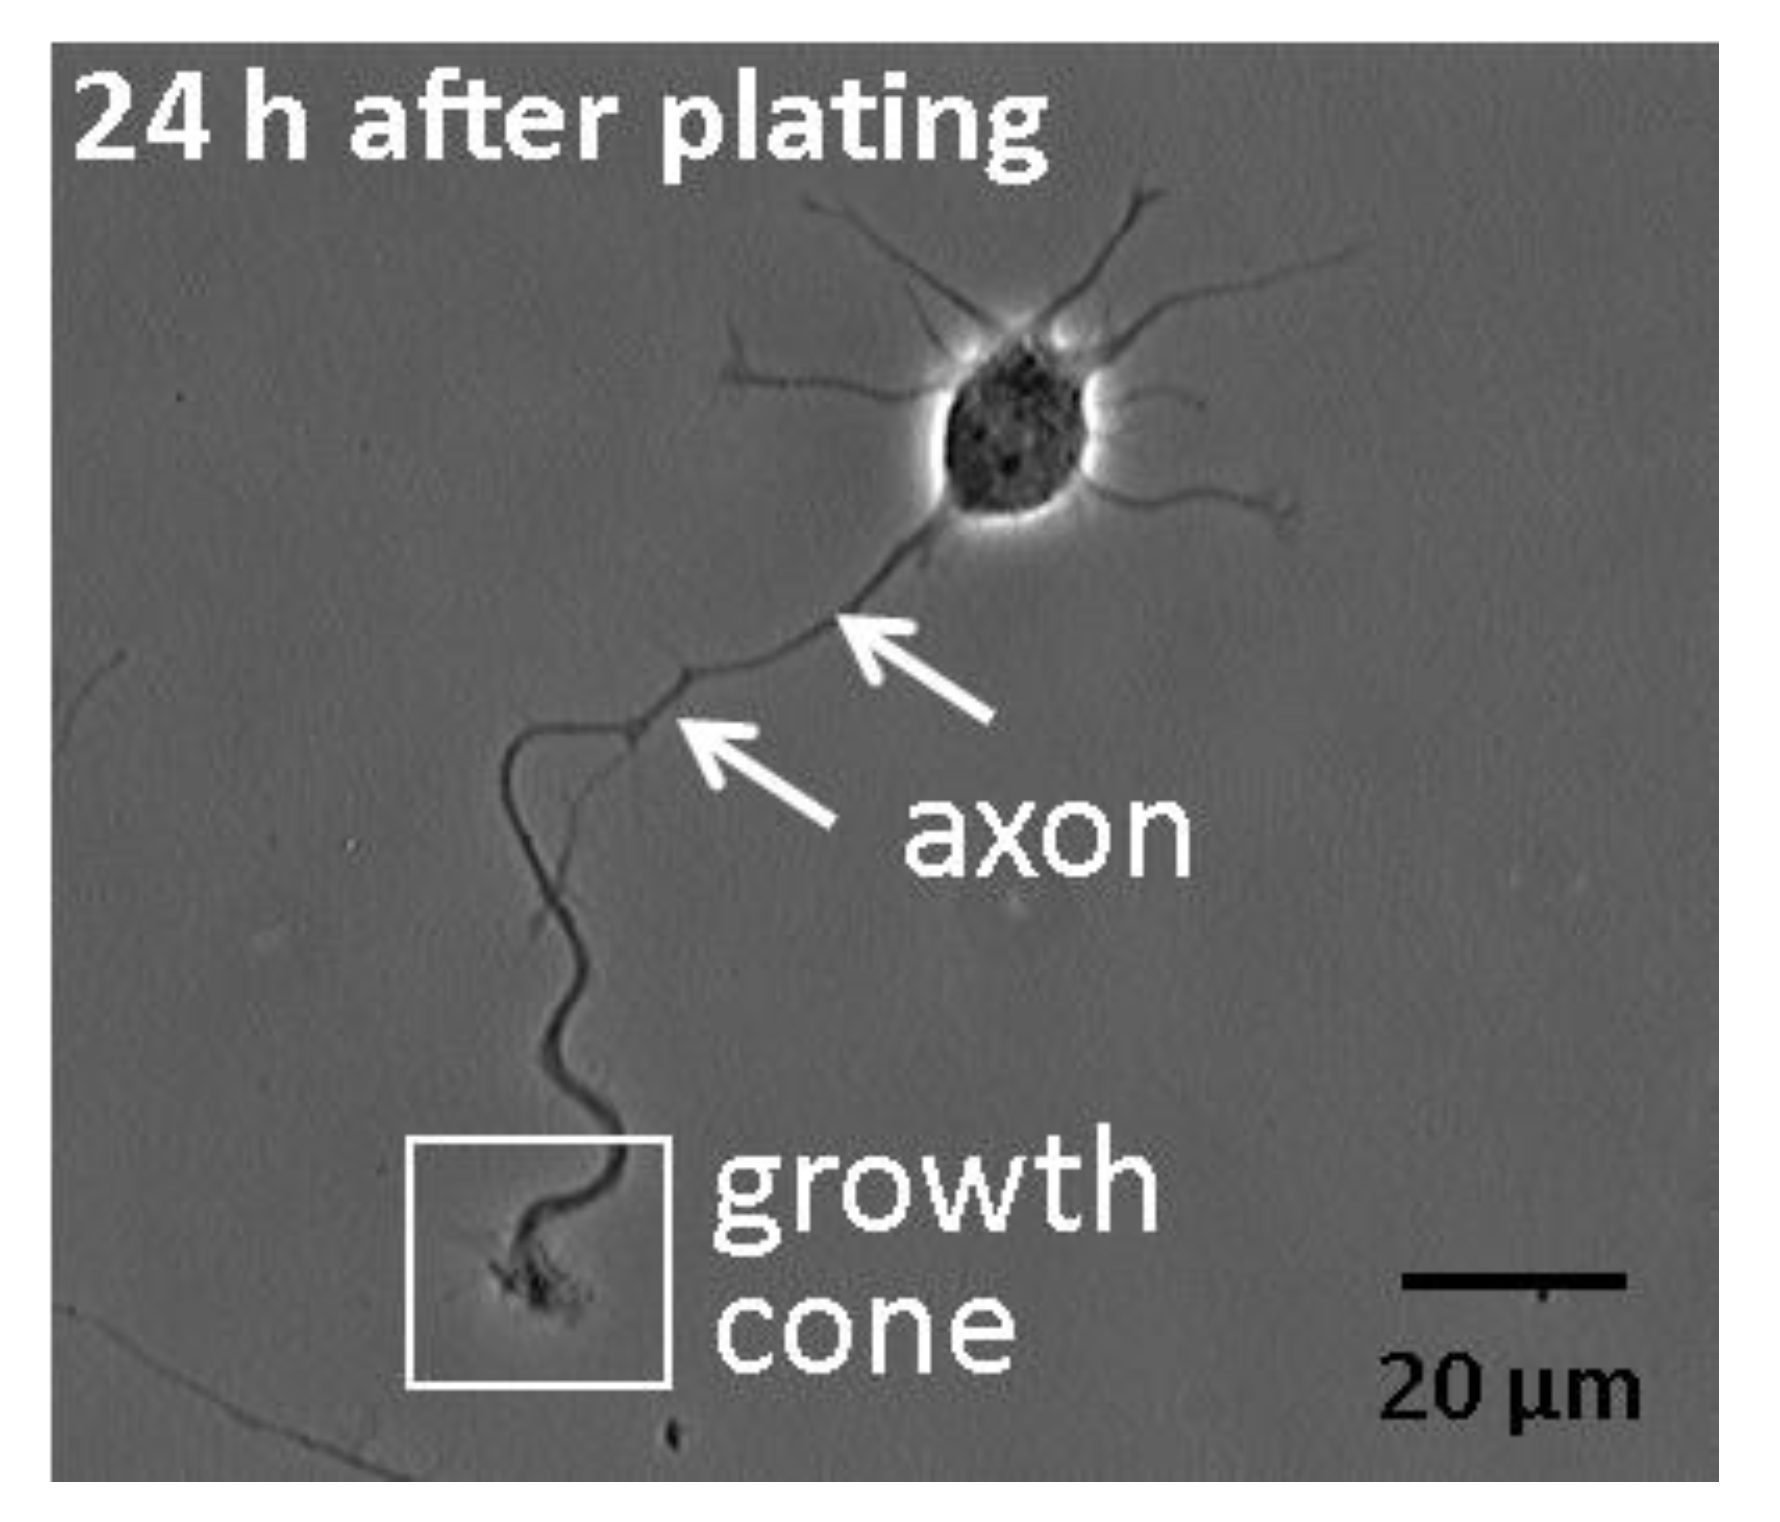
2+ indicator dye Fluo-3 and imaged their axonal growth cones for 10 min. Imaging was performed on cultures 24 h after plating, when axons are rapidly extending but not intermingled with other processes. Only pyramidal neurons, which make up greater than 90% of the cells in these cultures, were imaged. Axons were identified by their length, which had to be longer than 40 µm and also longer than the next longest process by at least 20 µm [
18] (
Figure 1).
Figure 1.
Morphology of hippocampal pyramidal neurons at an early stage of development in low-density dissociated cultures. Shown is a phase contrast image of a representative embryonic rat hippocampal pyramidal neuron 1-day after plating. It illustrates the typical appearance of the newly formed axon, tipped by a growth cone. Several shorter processes emerging from the cell body are nascent dendrites.
Calcium waves were defined according to the criteria of Gomez
et al. [
15], which includes localization to the growth cone, fluorescence increases >150% of baseline, slow rise time (>3 s to peak), and return to baseline. Rarely, Ca
2+ transients propagated to the growth cone from the cell body or axon shaft, and these were excluded from the analyses. These characteristics distinguish Ca
2+ waves from Ca
2+ spikes and from morphological movements and noise. To determine whether spontaneous Ca
2+ waves also occur in neurons exposed to ethanol, ethanol was added to the medium (final concentration of 43 or 87 mM), either acutely or chronically. For acute exposure, ethanol was added 24 h after plating in normal medium, just before imaging. For chronic exposure, ethanol was added shortly after plating and was present in the medium continuously until imaging 24 h later. In both conditions, the concentration of ethanol in the medium was also present in buffers during imaging. None of these experimental conditions resulted in any observable effect on baseline calcium levels, neuron survival or growth cone morphology, either during 10 min recordings or 60 min afterwards. Calcium waves with varying temporal patterns were observed in axonal growth cones in all treatment groups.
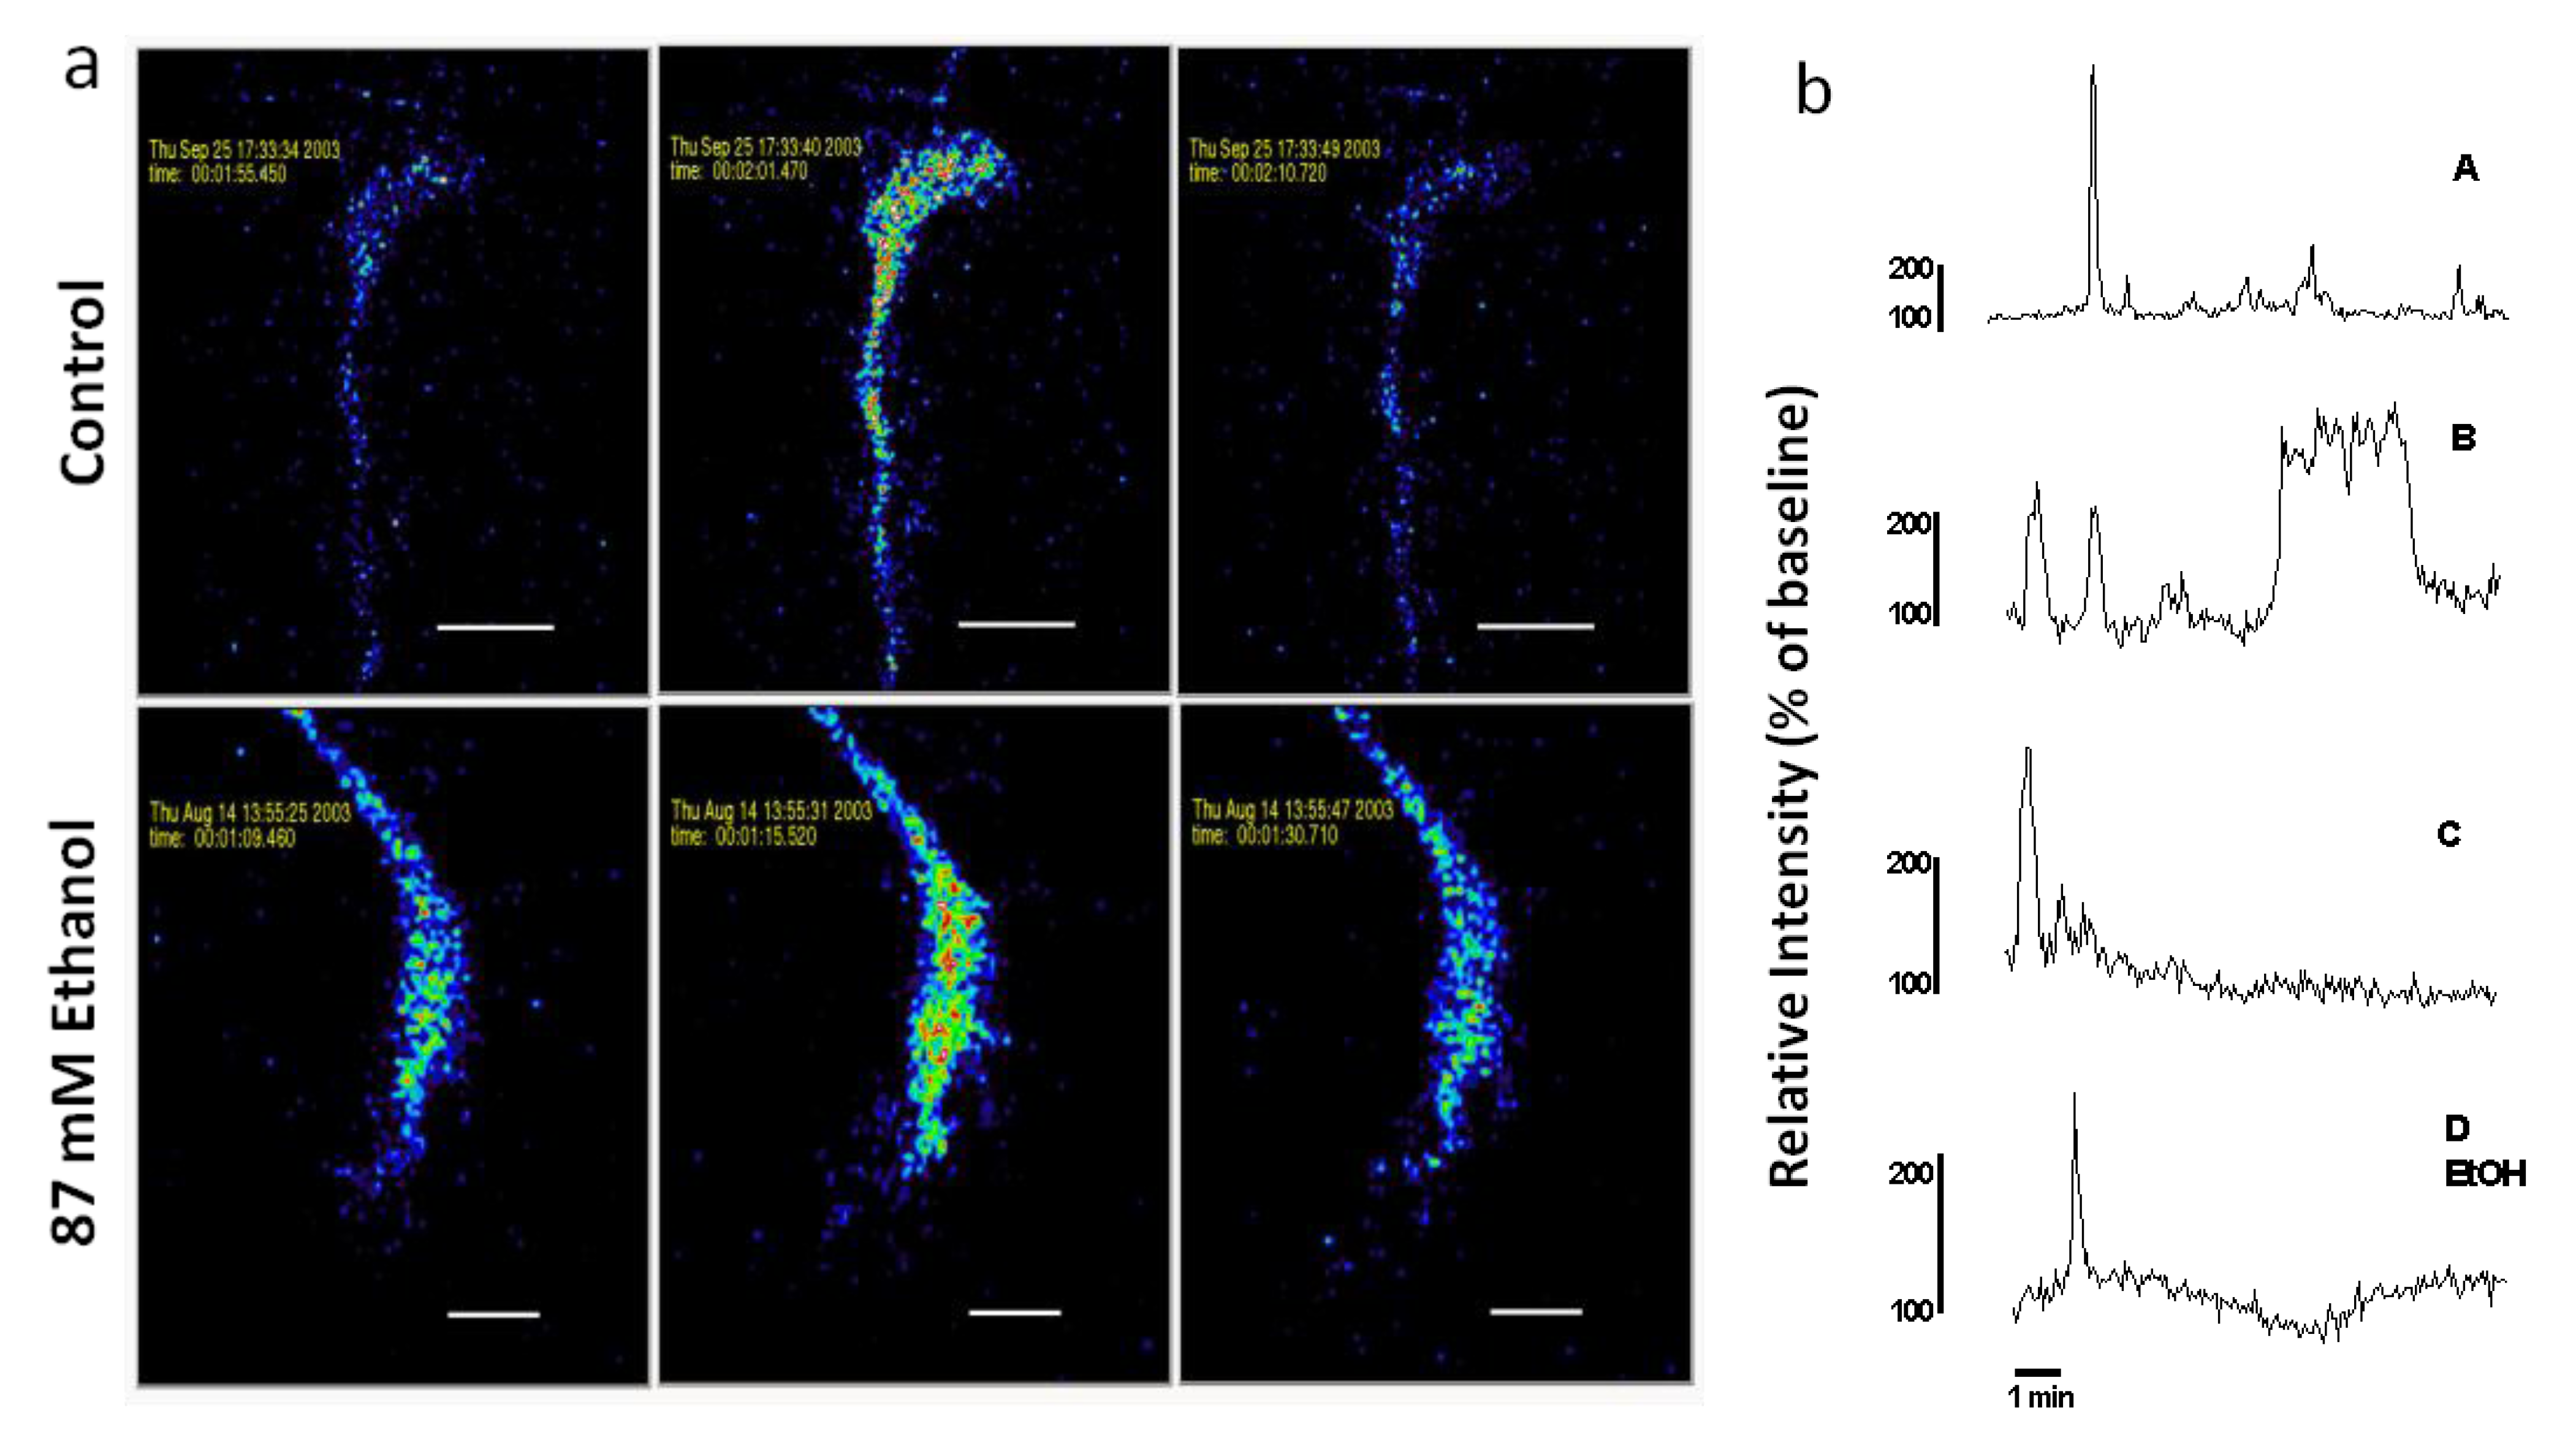
Figure 2 shows spontaneous Ca
2+ waves in growth cones of control and ethanol-treated neurons.
Figure 2.
(a) Spontaneous Ca2+ waves in axonal growth cones of control and acute ethanol-exposed hippocampal pyramidal neurons. Time-series confocal images of cells loaded with Fluo-3 demonstrate a Ca2+ wave in a control neuron (top panels), and in a neuron exposed to 87 mM ethanol (bottom panels) added 15 min before starting the recording. Images are pseudocolored with peak elevations of [Ca2+]i indicated in red. (b) Plots of relative fluorescence over time in representative growth cones illustrate variation in temporal pattern of waves. Traces A–C are typical Ca2+ waves recorded in the growth cones of neurons in control medium without ethanol. Trace D shows a Ca2+ wave observed when ethanol is added to the medium 15 min before imaging. Trace A is the growth cone on top in (a). Trace D EtOH is the growth cone on the bottom in (a).
2.2. Ethanol Alters the Incidence of Spontaneous Growth Cone Ca2+ Waves
The frequency of spontaneous Ca
2+ waves in axonal growth cones in dissociated neuronal cultures varies depending on the cell type, but is generally low (1–8/h) under physiologic conditions. Since continuous imaging for more than a few minutes is associated with photobleaching, dye compartmentation and cell toxicity, we did not monitor the frequency of waves in the same growth cone. Instead, frequency of waves was determined indirectly by examining the mean incidence of axonal growth cones displaying at least 1 wave during a 10 min interval of recording, a method applied in other similar studies. For example, about 20% of chick dorsal root ganglion neurons at early stages of development in culture display at least 1 growth cone Ca
2+ wave during a 10 min recording [
15]. When localized waves in cell bodies and in growth cones are counted, about 38% of embryonic
Xenopus spinal neurons display Ca
2+ waves during 60 min period [
19] and 50% of differentiating mouse striatal neurospheres show waves over 10 min [
20]. The reliability of this method is supported by evidence from other studies showing that when the frequency of Ca
2+ spike events is estimated by continuous imaging for 6 min, the calculated spikes/neuron × h yields estimates that are comparable to those obtained by measuring incidence over 10 min [
19].
We, therefore, determined the effect of acute or chronic ethanol exposure on incidence of spontaneous Ca
2+ waves in axonal growth cones of hippocampal neurons in dissociated cultures
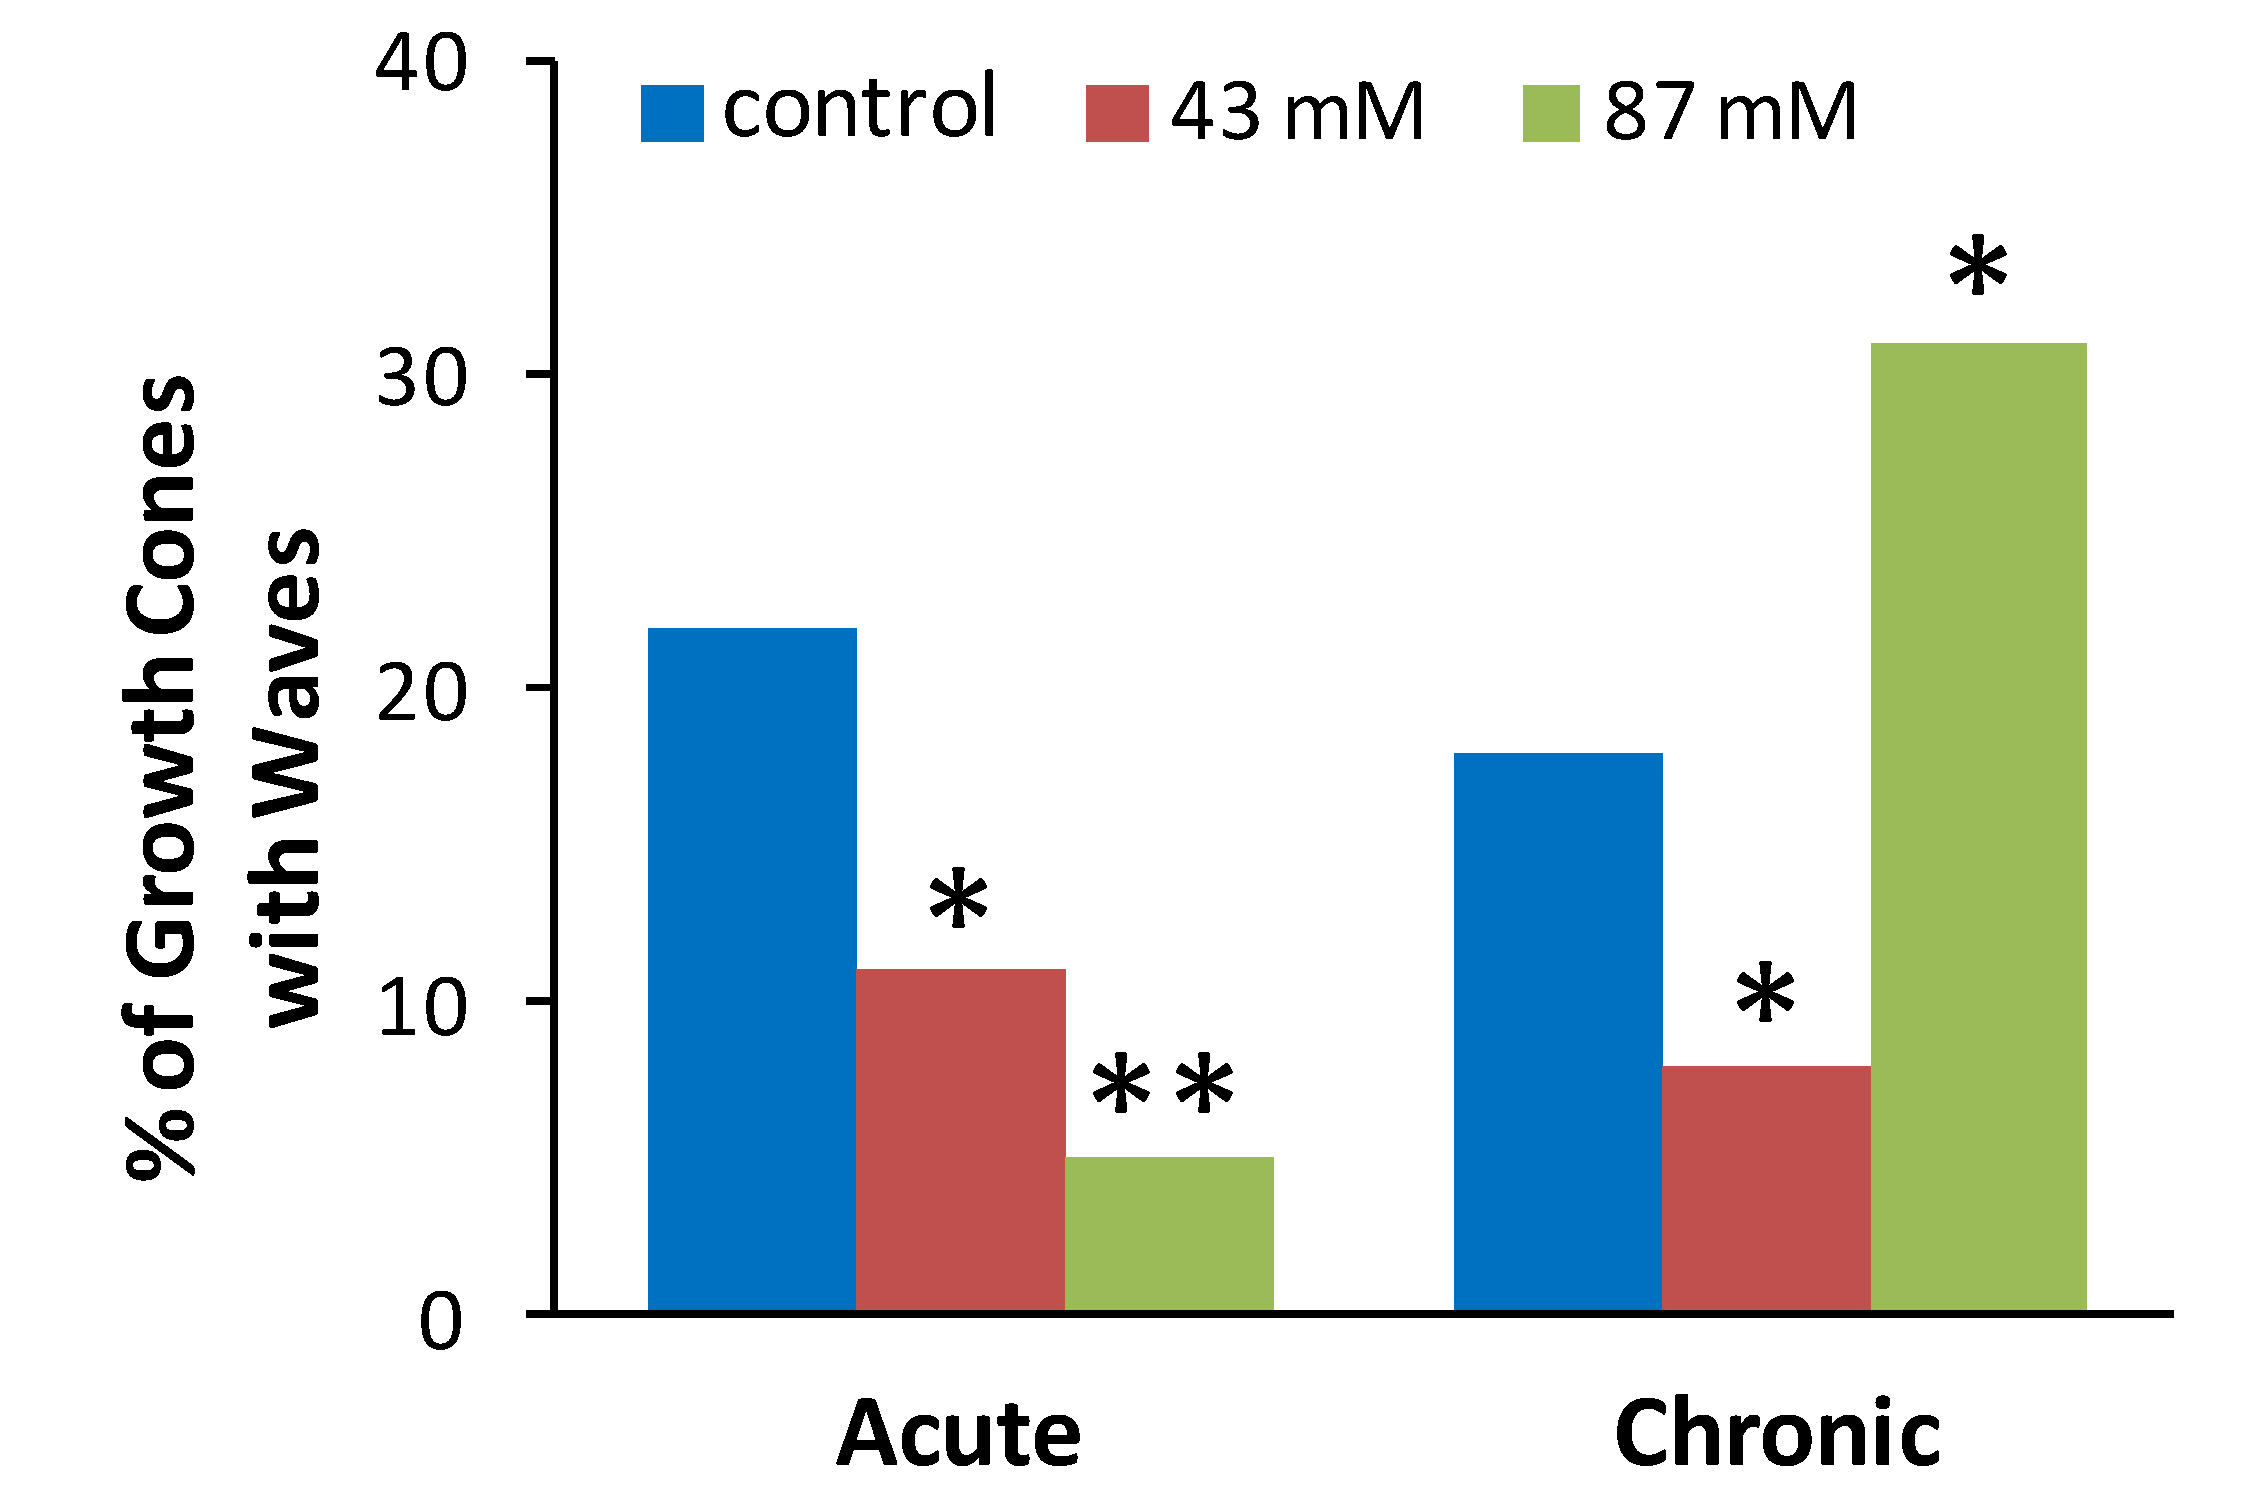
Figure 3 shows the proportion (%) of axonal growth cones in each treatment group that displayed at least 1 wave during a 10 min recording period. Chi square tests were performed to determine if the observed proportion of growth cones displaying waves after ethanol treatment was different than the expected proportion as indicated by proportion of control growth cones displaying waves. Compared to control cultures without ethanol, the incidence of spontaneous waves was decreased by acute or chronic exposure to 43 mM ethanol and by acute exposure to 87 mM ethanol. In contrast, chronic exposure to 87 mM ethanol increased the incidence of growth cones with waves.
Figure 3.
Ethanol alters the incidence of spontaneous calcium waves in axonal growth cones. The plot shows the percent of neurons in each treatment group that exhibited at least one Ca2+ wave during the 10 min. recording. The data are combined from 39 separate cultures with a total of 453 growth cones analyzed (54–91 per treatment group). * p < 0.05, ** p < 0.001, chi square, compared to control group for acute or chronic treatment.
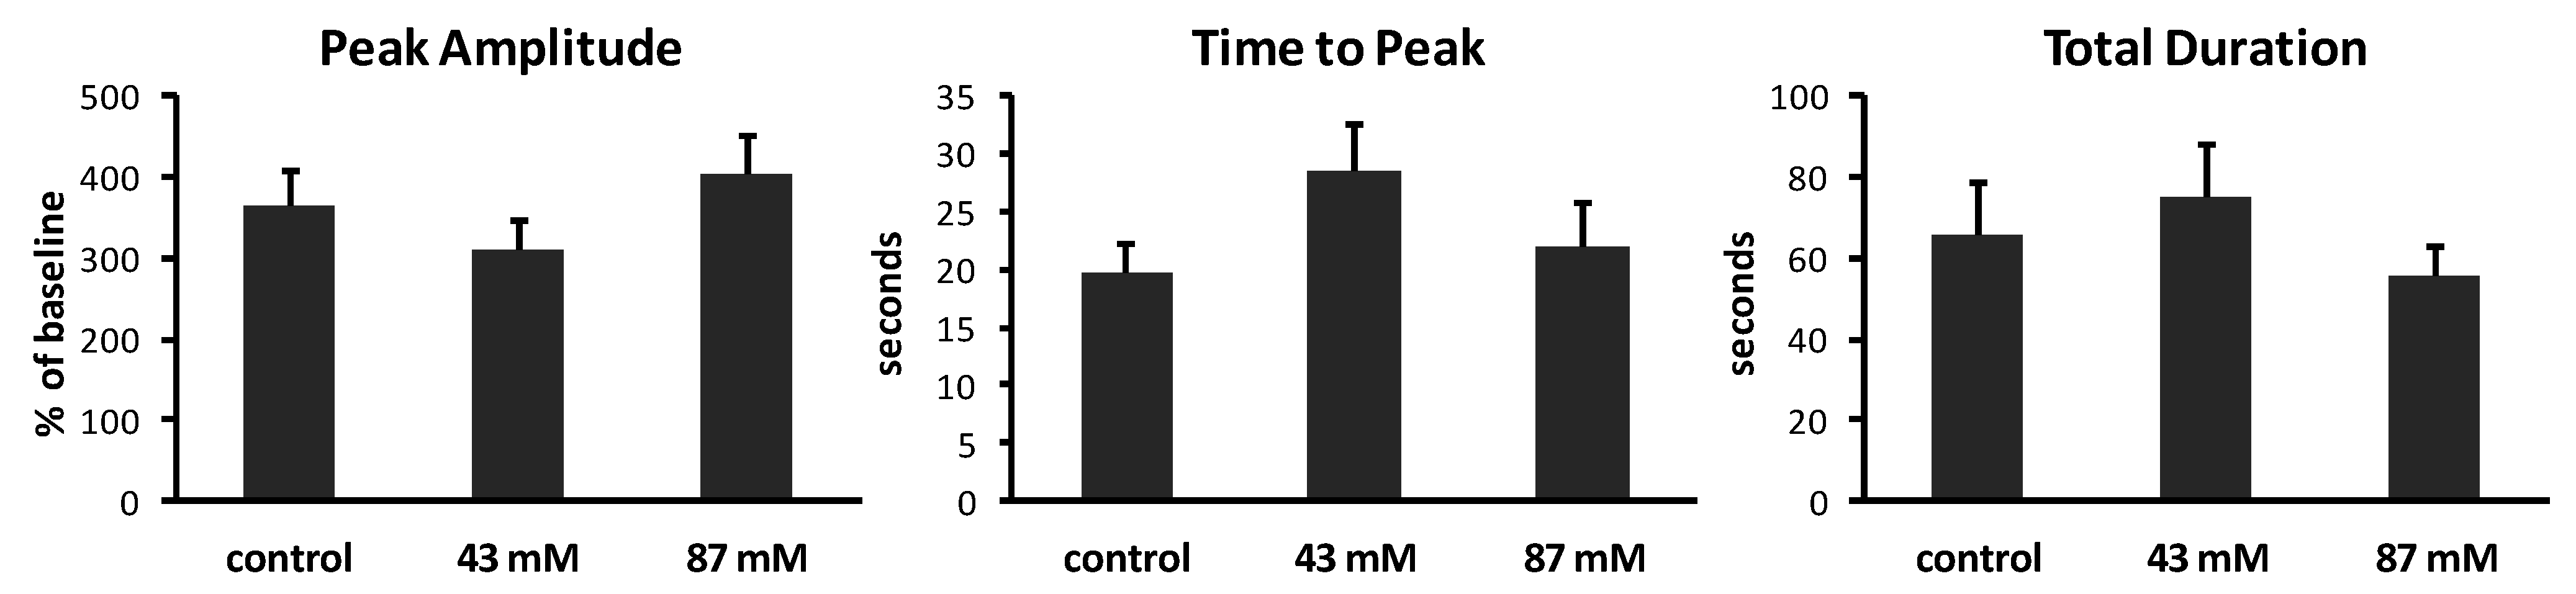
2.3. Ethanol Has No Effect on the Kinetics of Spontaneous Ca2+ Waves
To determine whether chronic ethanol exposure alters the kinetic characteristics of spontaneous Ca
2+ waves, we measured the peak amplitude, time to peak and total duration of waves in axonal growth cones from each treatment group. Results are summarized in
Figure 4. In control cultures without ethanol, Ca
2+ waves had varied amplitudes, ranging from 202% to 707% above baseline (mean = 363% ± 46.6%). The time to peak also varied, ranging from 3 to 40 s (mean = 19.8 ± 2.4 s). The total duration of waves ranged from 21.1 to 203 s (mean = 65.4 ± 13.2 s). The same analyses of Ca
2+ waves in cultures containing ethanol in the medium, added shortly after plating, showed no significant effects on peak amplitude (
p = 0.17; ANOVA), on time to peak (
p = 0.20; ANOVA) or on total duration (
p = 0.52; ANOVA).
Figure 4.
Characteristics of Ca2+ waves in axonal growth cones. Calcium imaging at 1 image/s generated plots of fluorescence over time. Analysis was performed on axonal growth cones that displayed at least one Ca2+ wave during 10 min (n = 14–15 growth cones per treatment group). Peak amplitudes of waves are expressed as the mean percent of baseline fluorescence (±SEM). Time to peak and total duration of waves are expressed as the mean time in seconds (s) (±SEM) to reach maximum fluorescence and to rise to the peak and return to baseline, respectively.
2.4. Regulation of Axon Growth by Ca2+ Waves Is Altered by Ethanol
Others have reported that Ca
2+ transients are most prevalent in growth cones when they pause between periods of active extension, and are rarely observed during growth phases when length increases [
15,
17]. To determine whether ethanol affects the relationship between phase of axon growth and Ca
2+ dynamics, we captured a single image of axonal growth cones 50 min after a Ca
2+ wave and recorded whether it had advanced at least 20 µm (growth period), or had remained stationary or retracted (non-growth period). Results are summarized in
Table 1.
Table 1.
The percent of wave-displaying growth cones which are in periods of non-growth.
Table 1.
The percent of wave-displaying growth cones which are in periods of non-growth.
| Treatment | Number in non-growth period | Number in growth period | % in non-growth period |
|---|
| Acute ethanol |
| Control (0 mM) | 21 | 7 | 86% |
| 43 mM | 10 | 2 | 83% |
| 87 mM | 8 | 2 | 80% |
| Chronic ethanol |
| Control (0 mM) | 26 | 6 | 81% |
| 43 mM | 10 | 2 | 83% |
| 87 mM | 14 | 34 | 26% ** |
As expected, based on previous studies [
15,
17], in control cultures without ethanol in the medium more than 80% of the axonal growth cones that exhibited Ca
2+ waves had not extended at least 20 μm when examined 50 min after the wave was recorded. These results indicate that the Ca
2+ waves likely occurred during periods of non-growth. Although only a small proportion of axonal growth cones displayed Ca
2+ waves after acute exposure to 43 or 87 mM ethanol (
Figure 3 above), those that did were much more likely to be in a period of non-growth than in a period of growth when the wave occurred as evidenced by the length of axon extension when examined 50 min subsequent to the wave. Similar results were observed for growth cones that displayed Ca
2+ waves after chronic exposure to 43 mM ethanol in the medium. Thus, for both acute alcohol at 43 and 87 mM and chronic ethanol at 43 mM, ethanol appears to have decreased the frequency of Ca
2+ waves in axonal growth cones without affecting the correspondence between the expression of waves and non-growth periods that is normally observed. In surprising contrast, after chronic exposure to 87 mM ethanol, 34 out of 48 (74%) of axonal growth cones that displayed Ca
2+ waves had extended at least 20 μm, indicating the wave occurred during a growth period. These results suggest that continuous exposure to ethanol at higher concentrations prevents the normal braking effect of Ca
2+ waves on axon growth, even as it increases wave frequency.
We report here that developing hippocampal neurons in dissociated cultures displayed spontaneous Ca2+ transients in their axonal growth cones. The low frequency, slow kinetics and localization of these transients are consistent with their identity as Ca2+ waves. Furthermore, these transients showed the inverse relationship to axon growth that is characteristic of waves. Specifically, axons in non-growth periods were more likely to display Ca2+ waves than axons in growth periods. Acute exposure to 43 or 87 mM ethanol decreased the frequency of Ca2+ waves in axonal growth cones, but did not affect their kinetics or their inverse relationship to axon growth. Continuous exposure to 43 mM ethanol in the medium had a similar effect. Unexpectedly, although continuous exposure to 87 mM ethanol also had no effect on the kinetics of waves, it greatly increased their frequency, but suppressed the inhibition of axon growth expected when the frequency of Ca2+ waves is high. Thus, both the frequency of Ca2+ waves and their regulation of axon growth dynamics were perturbed by ethanol in these cultures, albeit in a complex manner.
We previously reported that chronic exposure to 43 or 87 mM ethanol in hippocampal pyramidal neuron cultures increases the overall growth rate of axons, by inhibiting retractions when axons pause [
11]. We also noted that axons averaged 20% less time in non-growth periods than control neurons, though this difference was not statistically significant. The chronic exposure to 43 mM ethanol that enhanced overall rate of axon growth in our previous study decreased the proportion of growth cones with waves in the current study. This finding was not unexpected, given that the frequency of Ca
2+ waves is normally decreased under conditions that increase rate of axon growth. It was surprising however, that chronic exposure to 87 mM ethanol which also enhanced overall rate of axon growth in the previous study
increased the proportion of growth cones with waves in the current study. Normally such an increase in wave frequency would be expected to decrease the rate of axon growth, but our previous findings showed the effects ethanol on axon growth dynamics were similar at 43 and 87 mM. Taken together, it appears that the correlation between frequency of waves and axon pausing may be lost at the higher concentration of ethanol, perhaps because ethanol interferes with other cellular functions or extracellular conditions that favor axon growth in this culture system.
We also recently reported that acute and chronic exposure to ethanol at the same concentrations used in the present studies inhibits the amplitude of KCl-induced Ca
2+ transients in axonal growth cones [
12]. This was true despite up-regulation of L-type channel expression that occurs with prolonged exposure to ethanol. Like KCl-induced calcium spikes, spontaneous calcium waves require Ca
2+ influx, as they can be blocked by Ni
2+ and disappear when extracellular Ca
2+ is removed, but waves do not involve Ca
2+ influx through VGCCs because they are not affected by agents that block these channels [
19]. Instead, Ca
2+ entry associated with waves has been proposed to be through an unidentified channel activated perhaps by mechanical forces at the growth cone, by products of local metabolism or by depletion of Ca
2+ stores [
13]. Although we did not assess ethanol effects on Ca
2+ release from intracellular stores in the current study, this seems unlikely to contribute to waves because wave amplitude was not affected by ethanol under any treatment conditions.
What can be learned from ethanol disruption of Ca
2+ wave frequency? Although regulation of axon growth dynamics is encoded by the frequency of waves [
14], the underlying mechanism controlling cell-specific frequency is mysterious. Some evidence in developing
Xenopus spinal cord indicates that neurons have an endogenous frequency of Ca
2+ waves in axon growth cones that can be modulated up or down by changes either in extracellular cues or in the expression of axonal molecules that interact with those cues [
16]. This raises the possibility that ethanol alters wave frequency by modifying an adhesive property of the extracellular matrix bound to the culture substrate, or an axonal protein that binds to that matrix. What can be learned from ethanol disruption of wave-regulated axon growth? In
Xenopus spinal neurons the mechanism underlying control of axon growth by spontaneous Ca
2+ waves requires calcineurin (CN), a Ca
2+-dependent protein phosphatase, which acts downstream of waves [
21]. Pharmacological treatments that inhibit CN or stabilize actin filaments can prevent the growth-inhibiting effect of Ca
2+ waves, much the way ethanol did in the current study. This raises the possibility that prolonged high concentrations of ethanol may act similarly in mammalian neurons by directly inhibiting CN or other components of the signaling cascade downstream of waves. Interestingly, some substrates of CN are sensitive to ethanol, such as GAP-43 which is down-regulated and dephosphorylated in rat hippocampus by short-term ethanol treatment [
22]. In the future, it will be important to relate our findings in dissociated cultures to ethanol effects on growth-regulating spontaneous Ca
2+ waves
in vivo, where the complex cellular and molecular environment of the developing hippocampus is preserved.


