Article

Cooperative Three-View Imaging Optical Coherence Tomography for Intraoperative Vascular Evaluation

School of Optics and Photonics, Beijing Institute of Technology, No.5 South Zhongguancun Street, Haidian, Beijing 100081, China
*
Author to whom correspondence should be addressed.
Appl. Sci. 2018, 8(9), 1551; https://doi.org/10.3390/app8091551
Submission received: 12 August 2018 / Revised: 25 August 2018 / Accepted: 26 August 2018 / Published: 4 September 2018

Abstract

:

Featured Application

Intraoperative evaluation of vascular anastomosis.

Abstract

Real-time intraoperative optical coherence tomography (OCT) imaging of blood vessels after anastomosis operation can provide important information the vessel, such as patency, flow speed, and thrombosis morphology. Due to the strong scattering and absorption effect of blood, normal OCT imaging suffers from the problem of incomplete cross-sectional view of the vessel under investigation when the diameter is large. In this work, we present a novel cooperative three-view imaging spectral domain optical coherence tomography system for intraoperative exposed vascular imaging. Two more side views (left view and right view) were realized through a customized sample arm optical design and corresponding mechanical design and fabrication, which could generate cross-sectional images from three circumferential view directions to achieve a larger synthetic field of view (FOV). For each view, the imaging depth was 6.7 mm (in air) and the lateral scanning range was designed to be 3 mm. Therefore, a shared synthetic rectangle FOV of 3 mm × 3 mm was achieved through cooperative three view scanning. This multi-view imaging method can meet the circumferential imaging demands of vessels with an outer diameter less than 3 mm. Both phantom tube and rat vessel imaging confirmed the increased system FOV performance. We believe the intraoperative application of this cooperative three-imaging optical coherence tomography for objective vascular anastomosis evaluation can benefit patient outcomes in the future.

1. Introduction

Vascular anastomosis is a common surgical procedure that connects two blood vessels in various surgical subspecialties. It is considered as the foundation for reconstructive microsurgery, vascular surgery and transplant surgery [1]. Postoperative evaluation of the surgical outcome requires objective assessment of the vessel lumen patency, flow restoration status and thrombosis morphology of the anastomosed vessel site instead of surgeon’s subjective judgement and accumulated experience over the years [2]. Different methods have been developed to provide the objective evaluation of the vessel status, such as skin surface temperature measurement, transcutaneous oxygen measurement, laser Doppler flowmeters, implantable Doppler monitoring, transit-time flow monitoring, and intraoperative angiography [2,3,4,5]. However, these methods lack the direct imaging capability of the anastomosed vessel site.
Optical coherence tomography is a noninvasive optical imaging modality that can provide high-speed, high-resolution, three-dimensional images of biological samples [6]. Ever since its invention, it has been widely used for diagnosis, therapy monitoring, and ranging [7,8,9,10,11,12,13]. Combined with Doppler flow sensing principle, phase resolved Doppler OCT (PRDOCT) was developed to get the sample structure and flow information simultaneously [14]. Blood flow restoration, 3D thrombosis morphology and stenosis information thus can thus be acquired objectively and quickly using OCT [15,16]. A real-time, detailed imaging methodology of the vasculature after anastomosis procedures can significantly affect patient outcomes [17]. In our past work, we have demonstrated the unique advantages and potential of PRDOCT imaging as the intraoperative evaluation method for vascular anastomosis [2,18,19].
However, the capability of PRDOCT imaging to visualize large vessels is significantly reduced by the limited penetration depth of light in blood vessels. Although using longer wavelength for imaging such as 1.3 μm band light can get a larger penetration depth, there are still problems for vessels with inner diameter larger than 0.5 mm due to the strong scattering and absorption of blood within the vessel tunnel [18]. One consequent issue is that OCT images can only show the partial outer area of the vessel, which results in an incomplete cross-sectional view of the vessel under investigation.
Various methods have been proposed to increase the effective FOV of OCT images. The multi-angle oblique OCT technique combines OCT images from multiple 3D scan volumes to form one single volume that contains the missing part in each individual volume scanning [20]. However, this method requires multiple 3D volume scans that takes more scanning time and complicated restoration algorithms to form the final volume. Rotational imaging OCT (RI-OCT) was proposed for mouse embryonic study [21]. In RI-OCT, a mouse embryo was placed on a rotational stage. By registering OCT images of the embryo at different controlled angles, a whole embryo cross-sectional image was generated. Sample rotation is required in RI-OCT, which is impossible for intraoperative vessel imaging applications. Recently, a long-range and wide FOV OCT has been developed based on an akinetic programmable swept source [22]. Promising as it is, the limited physical penetration depth of light into blood cannot be solved.
In this work, we propose a cooperative three-view imaging optical coherence tomography to increase the effective FOV. Taking advantages of the tubular structure of vessel that are exposed during the surgery, we add two extra left and right views for image scanning compared to conventional OCT one view scanning. The vessel is placed at the middle of the top, left and right imaging views. By dividing the conventional scanning OCT line into three parts and shifting the focal plane of the left and right part via customized waveplate and folding mirror, an extra left and right view are achieved. With the customized sample arm configuration, we get simultaneous cross-sectional images of the vessel from three different views. With proper image registration, a synthetic image can be produced which is equivalent to circumferential imaging of the vessel. We first test the system on phantom plastic tubes with different outer diameters. Then in vivo rat artery imaging was performed to evaluate our system. We believe this novel cooperative three-view imaging optical coherence tomography can be of great value to intraoperative vascular anastomosis evaluation.

2. Materials and Methods

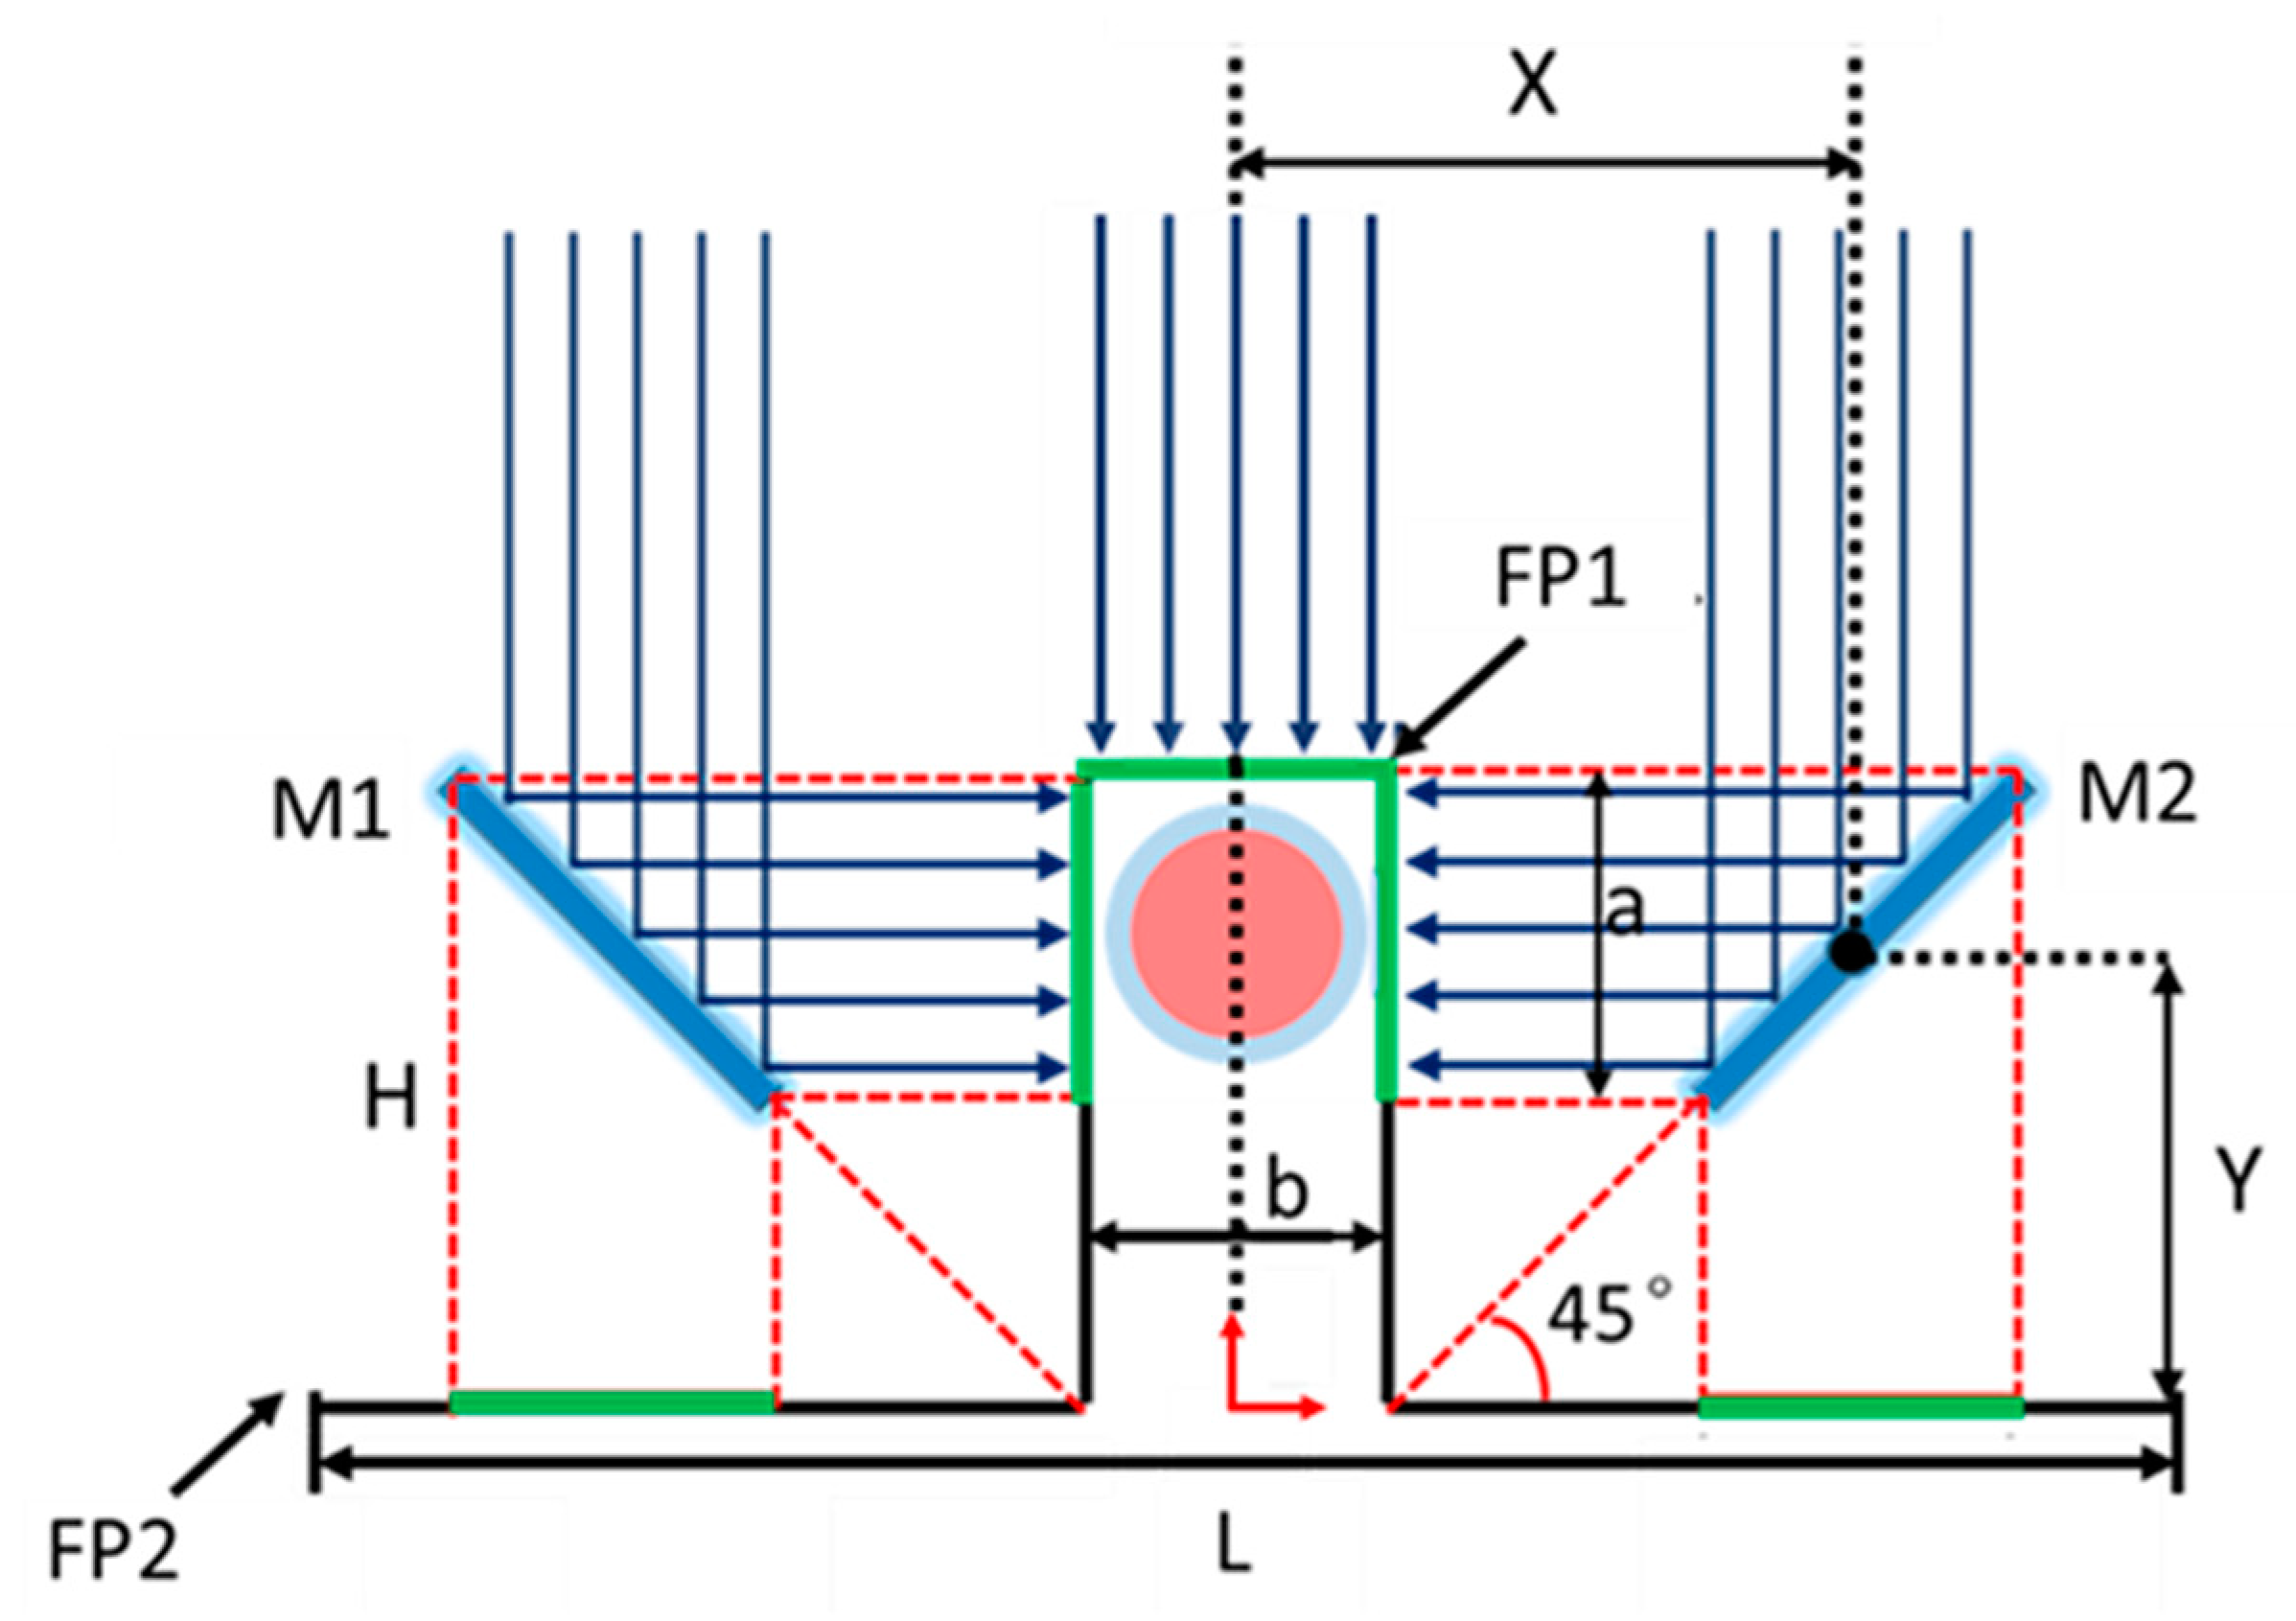
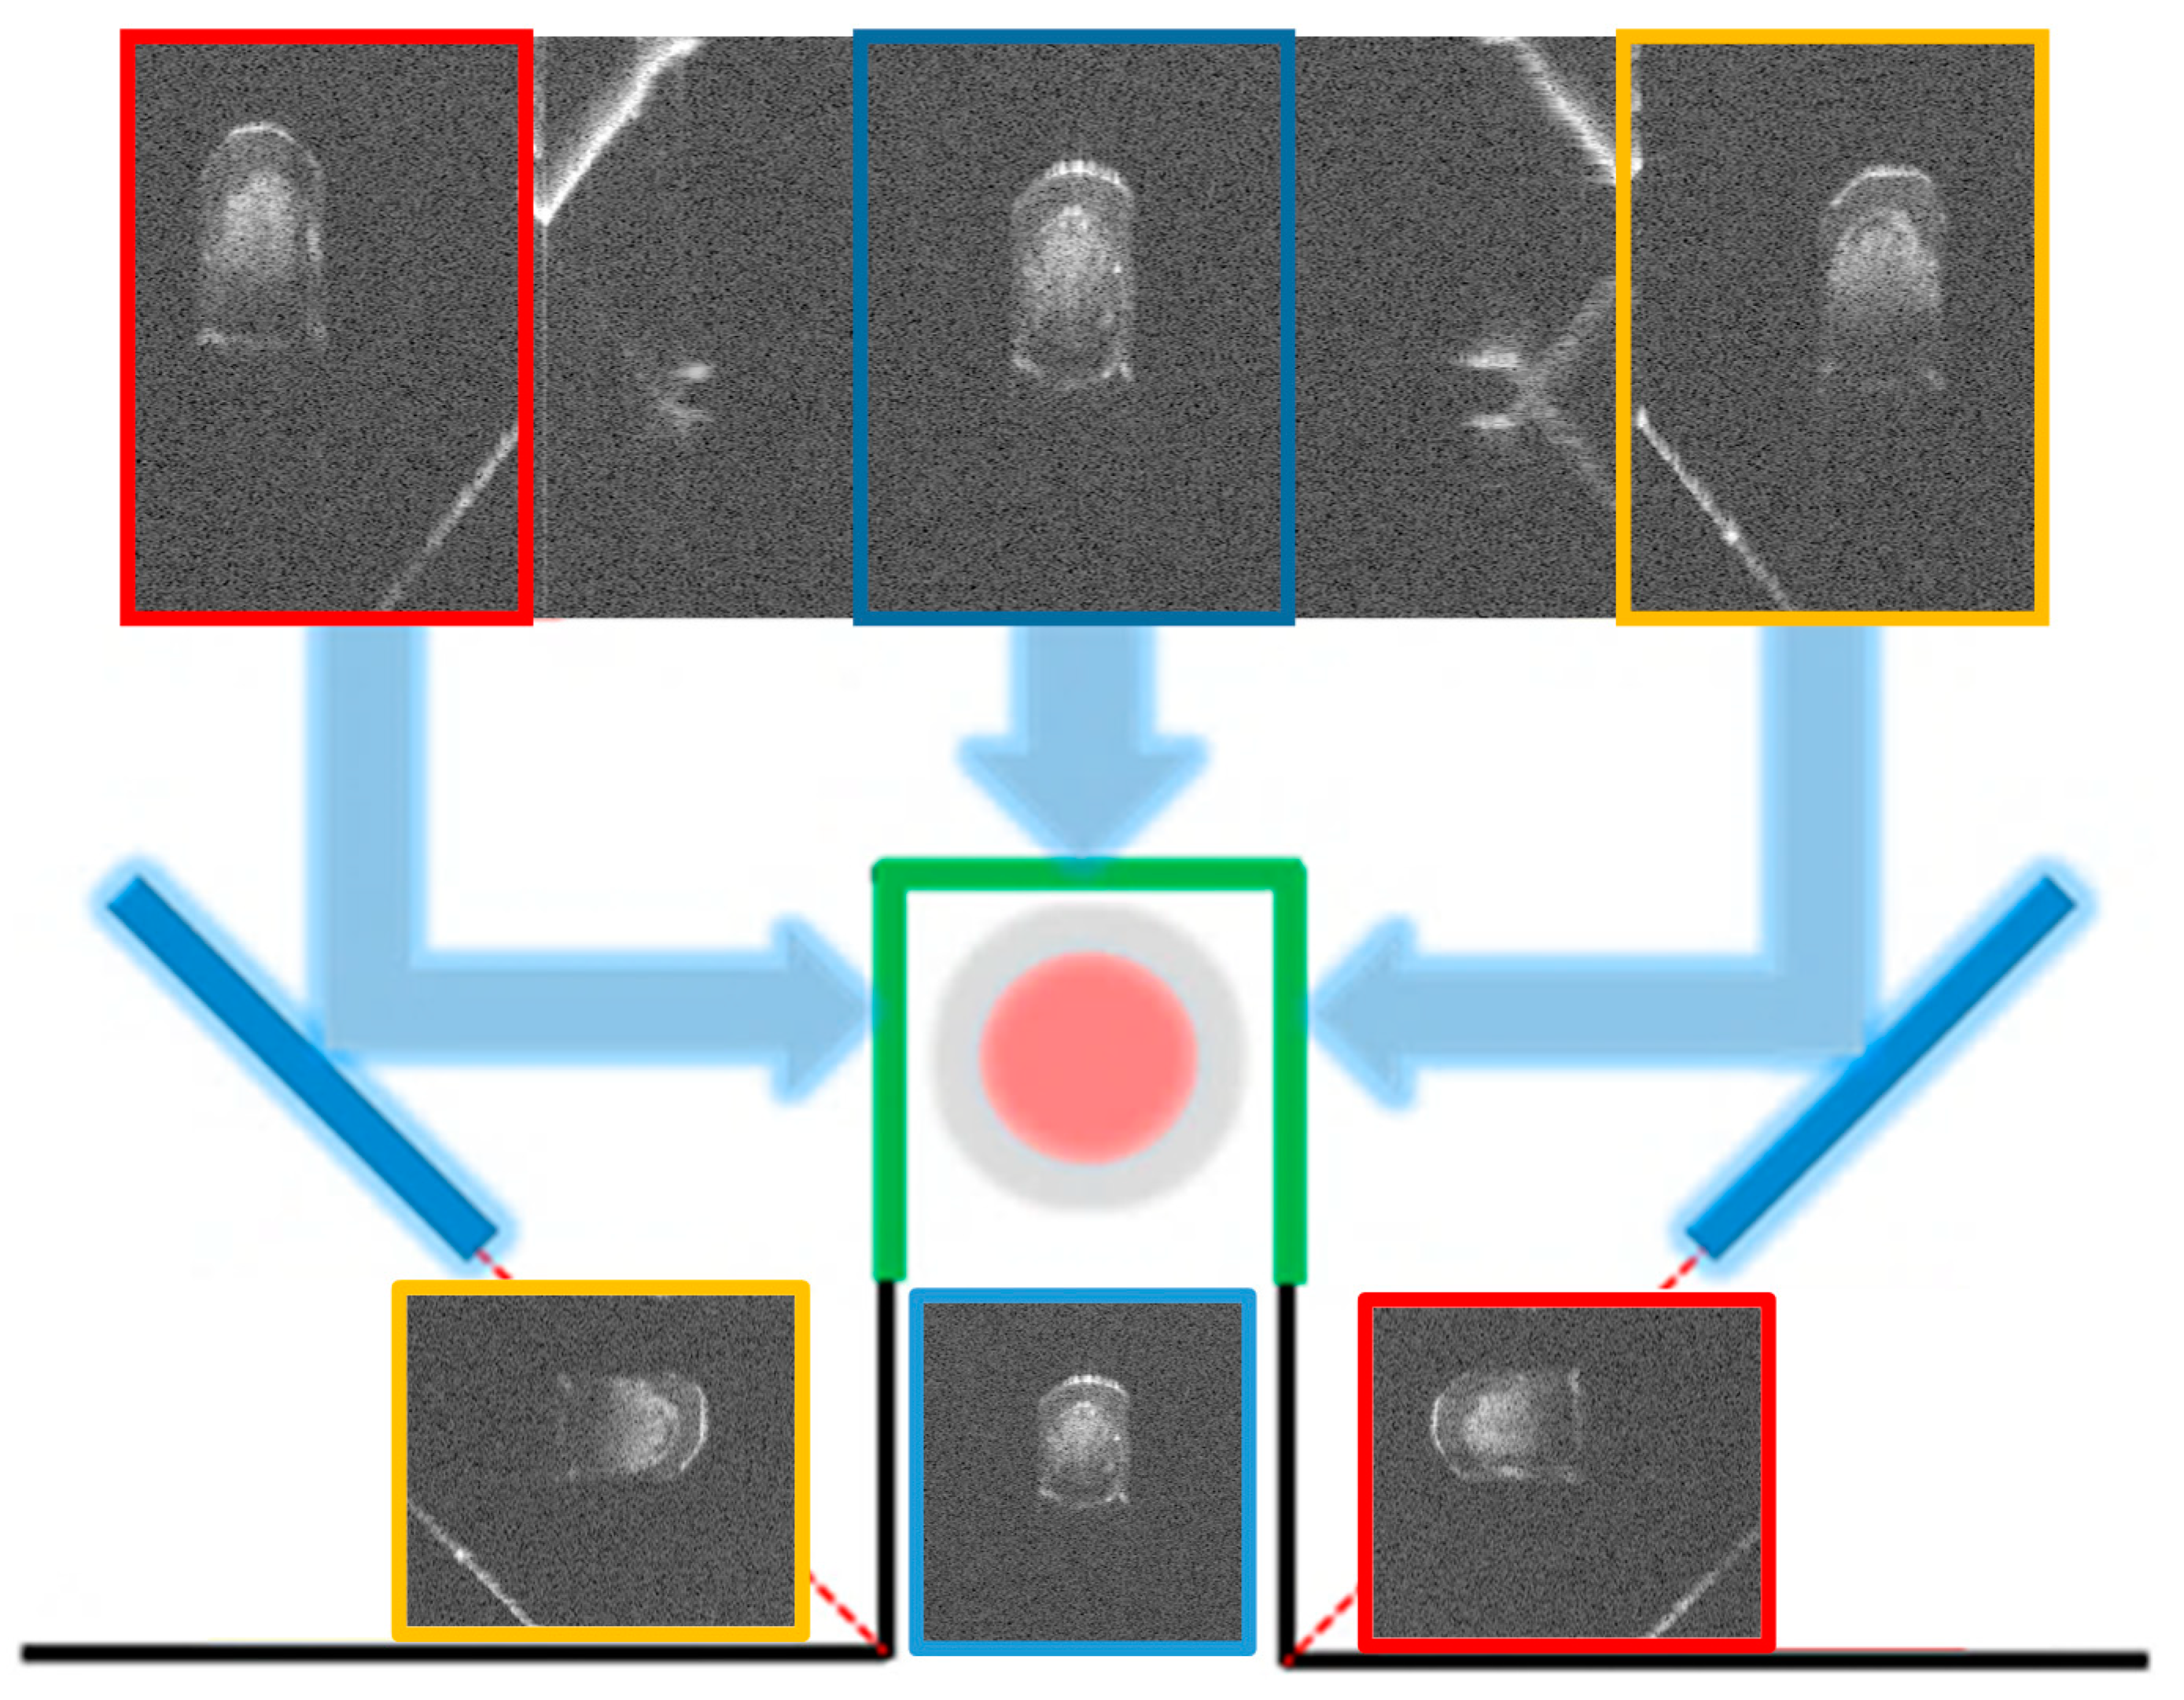
2.1. Principle of Cooperative Three-View Imaging

The principle of cooperative three-view imaging is illustrated in Figure 1. Focal plane1 and focal plane2 are separated by a certain distance H. The rectangle scanning area or FOV (a × b) is formed by the deflection of two side beams through two symmetrically placed 45° mirrors. Central position of the mirrors (M1 and M2) must satisfy the following equations X = H + (ba)/2, Y = Ha/2 with the constraints 2a + bL and aH. Parameters a and b can be designed to form different sizes of rectangular scanning area to meet the circumferential imaging demands of vessels with various diameters. The benefit of this novel scanning scheme is that the internal structure information of the vessel from three orthogonal views can be acquired within one fast B-mode scan.

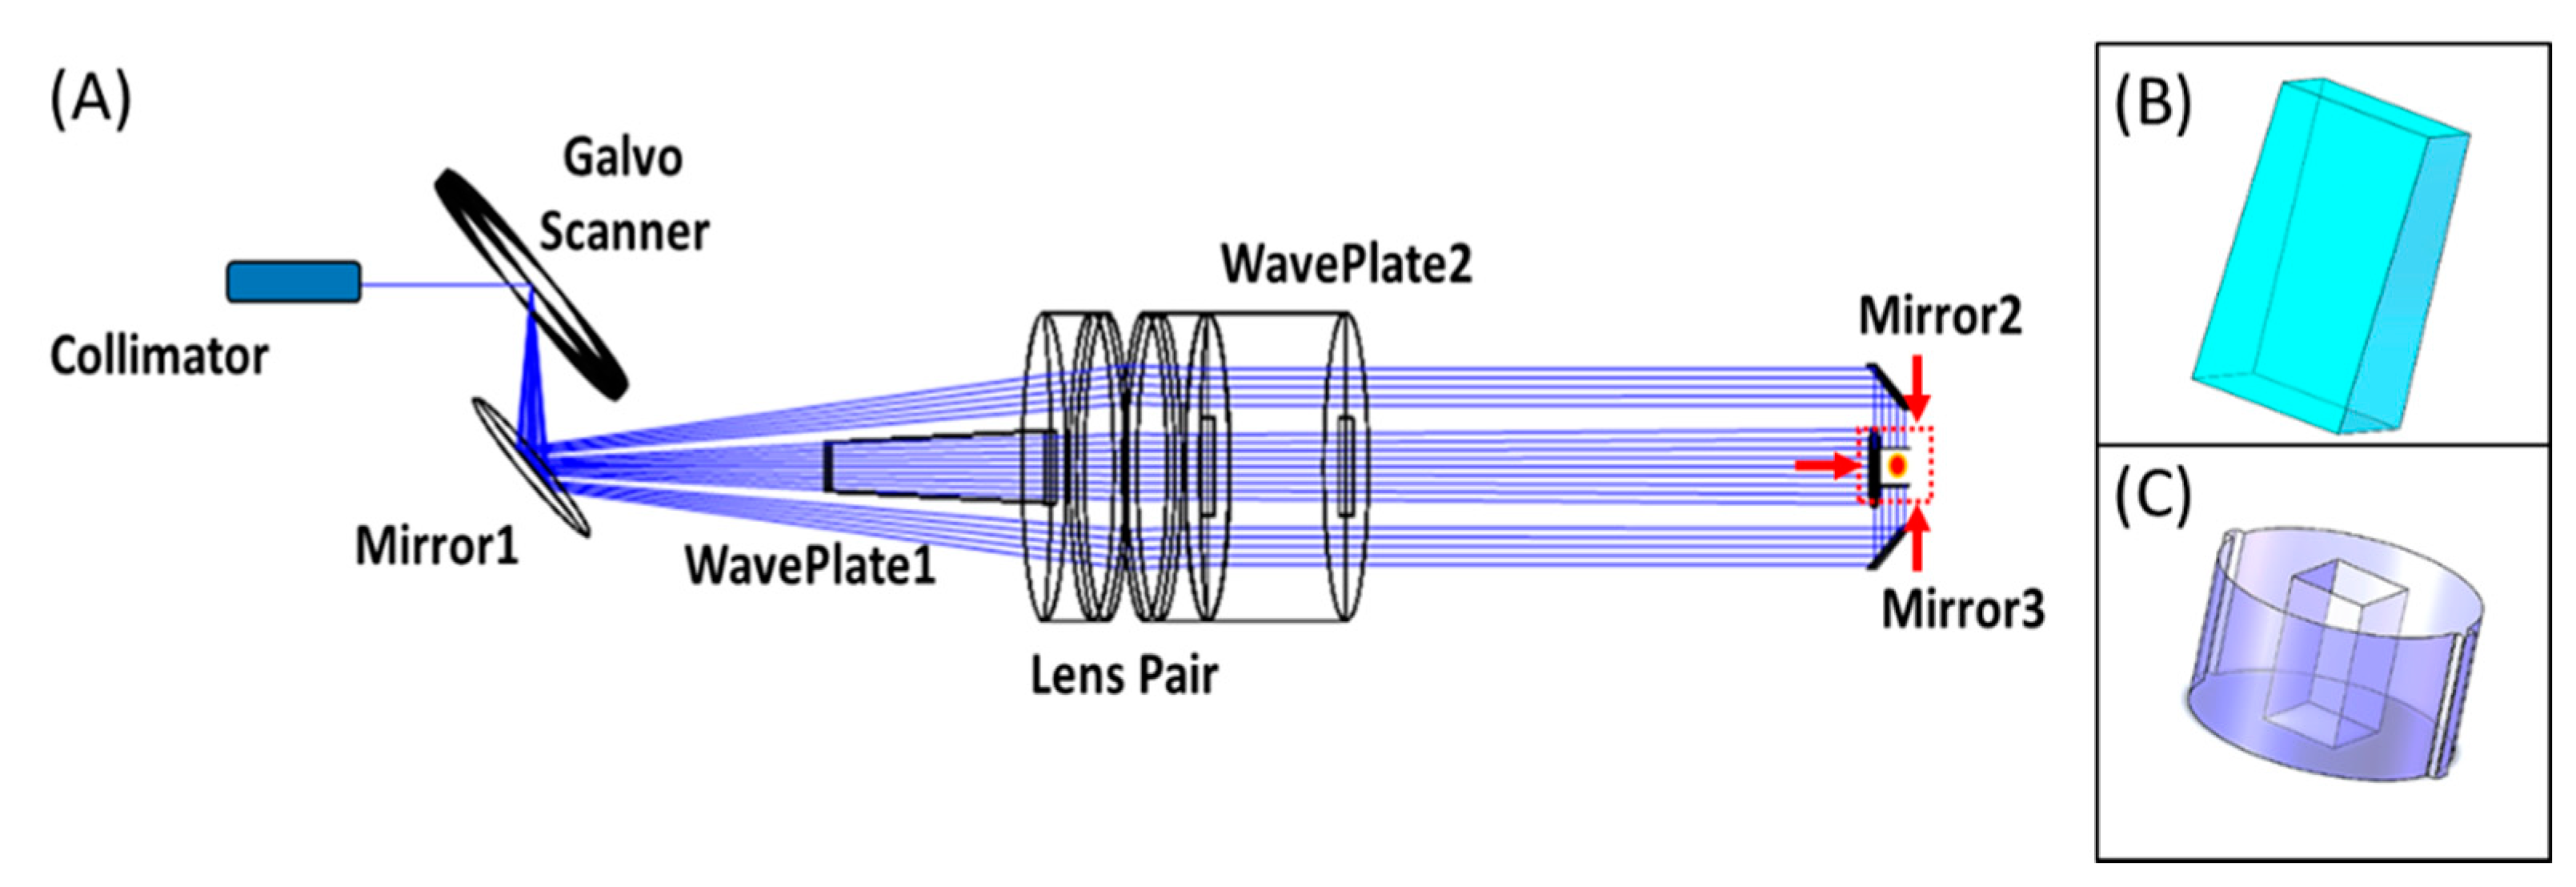
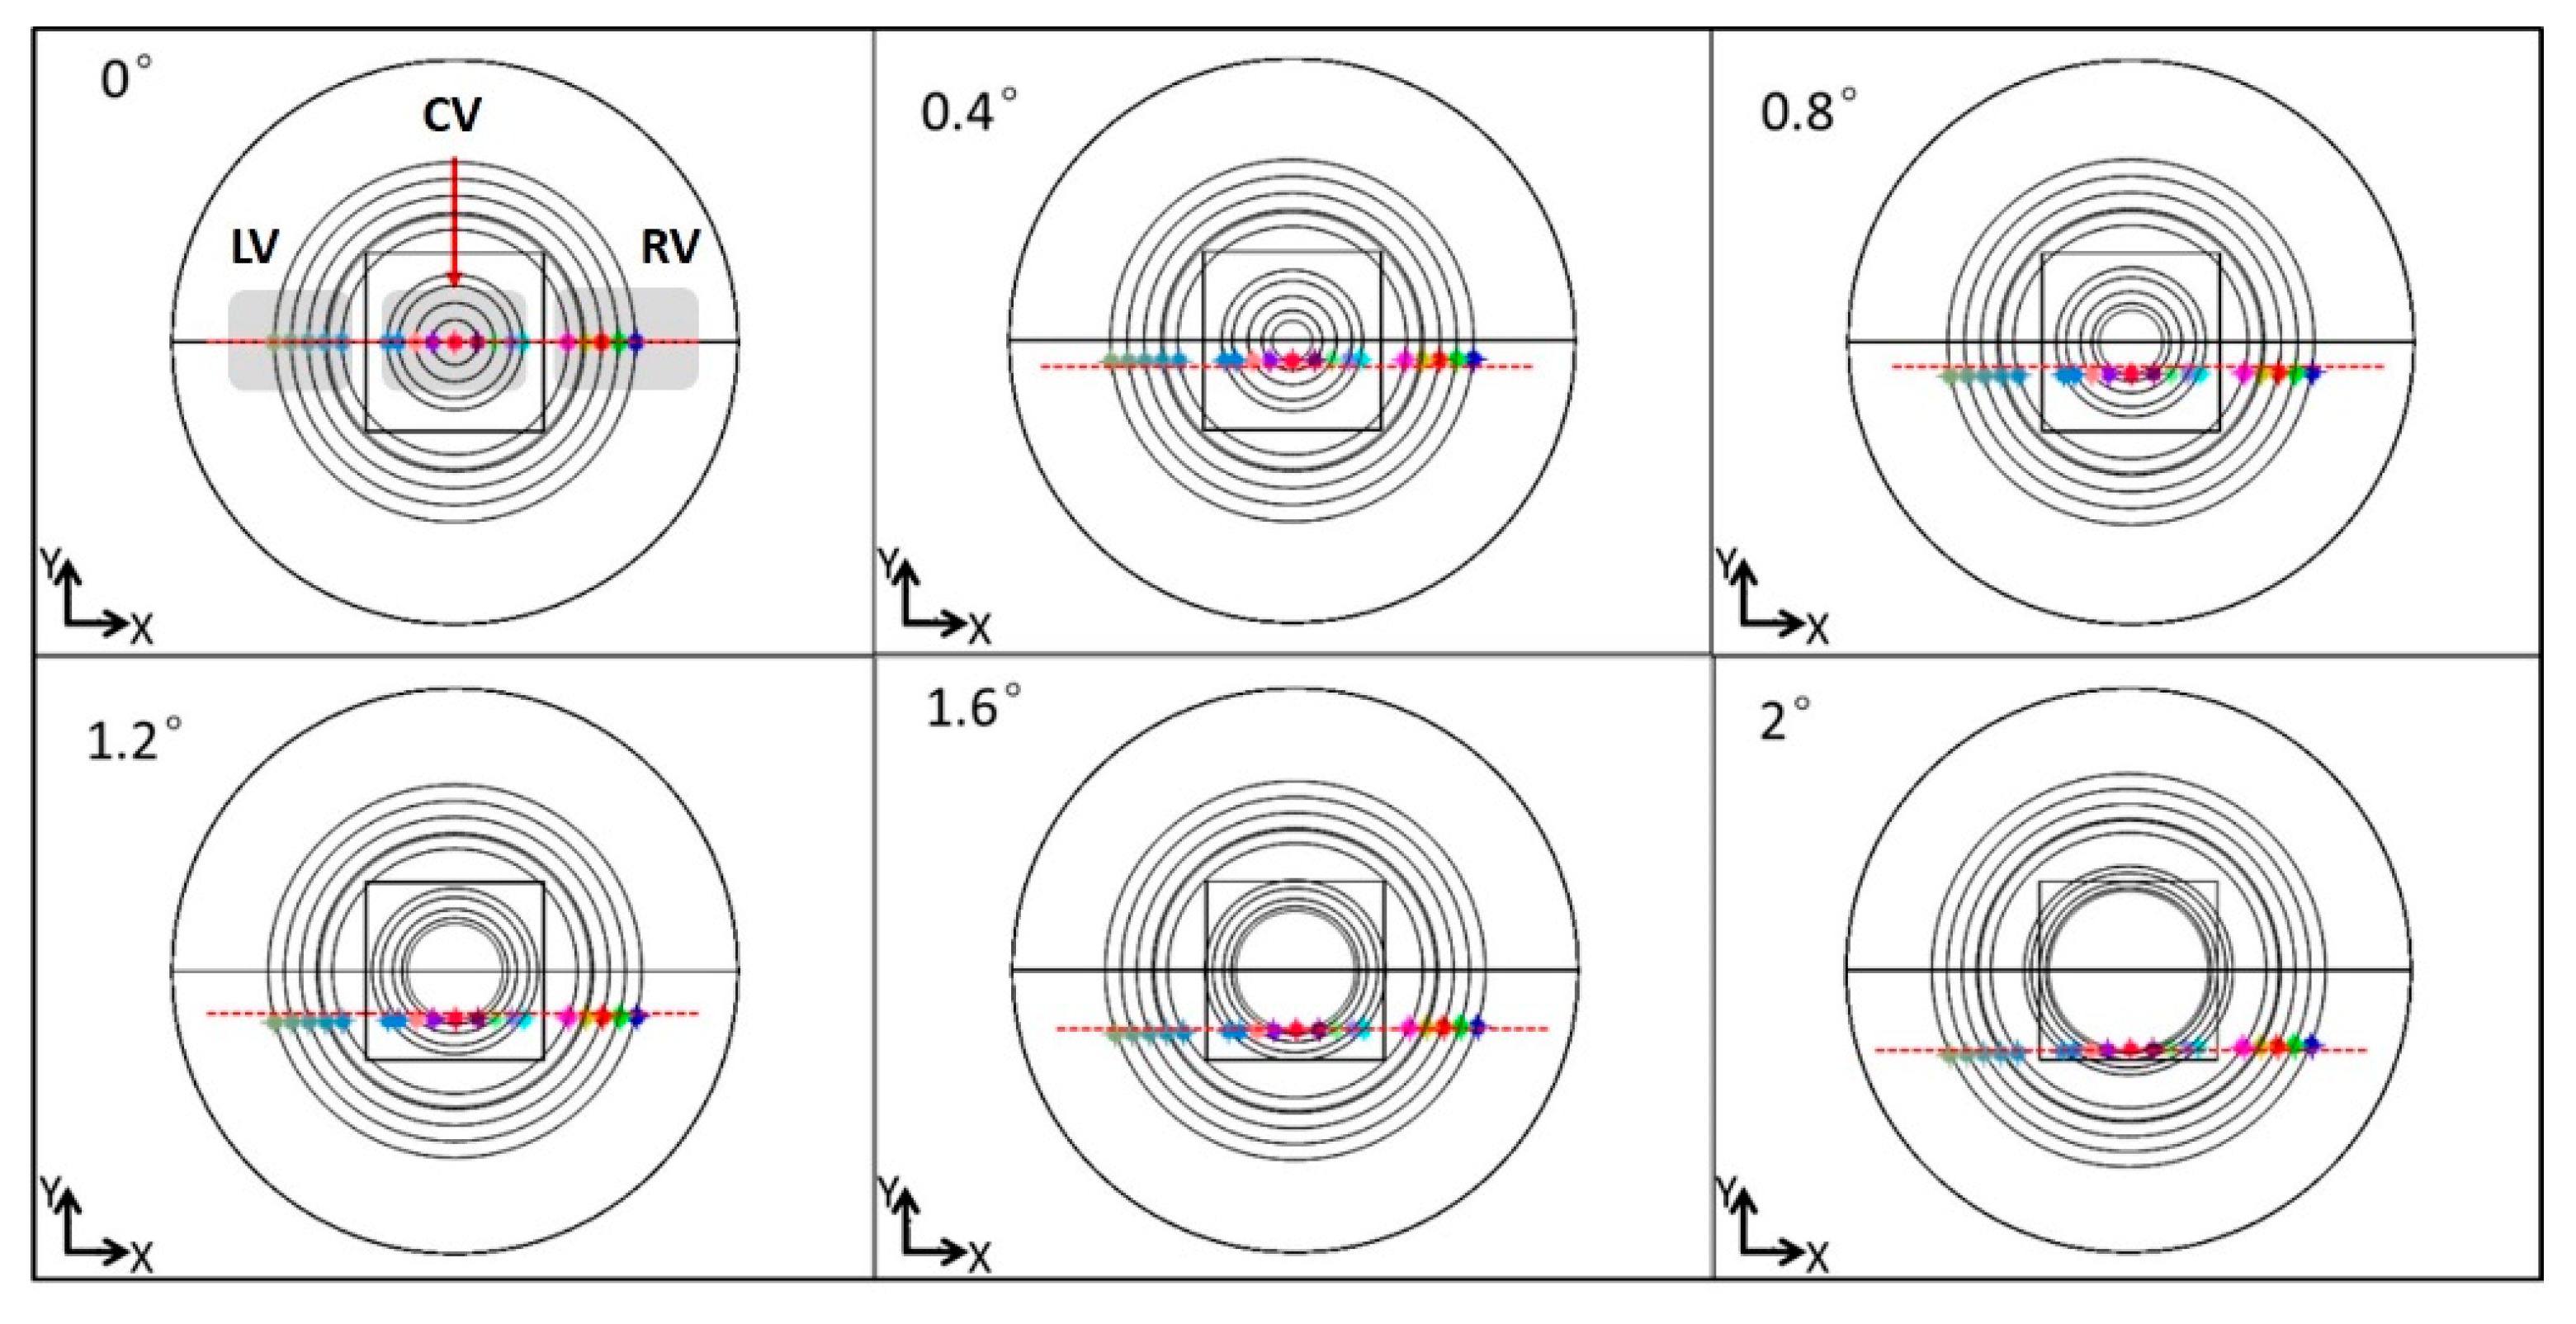
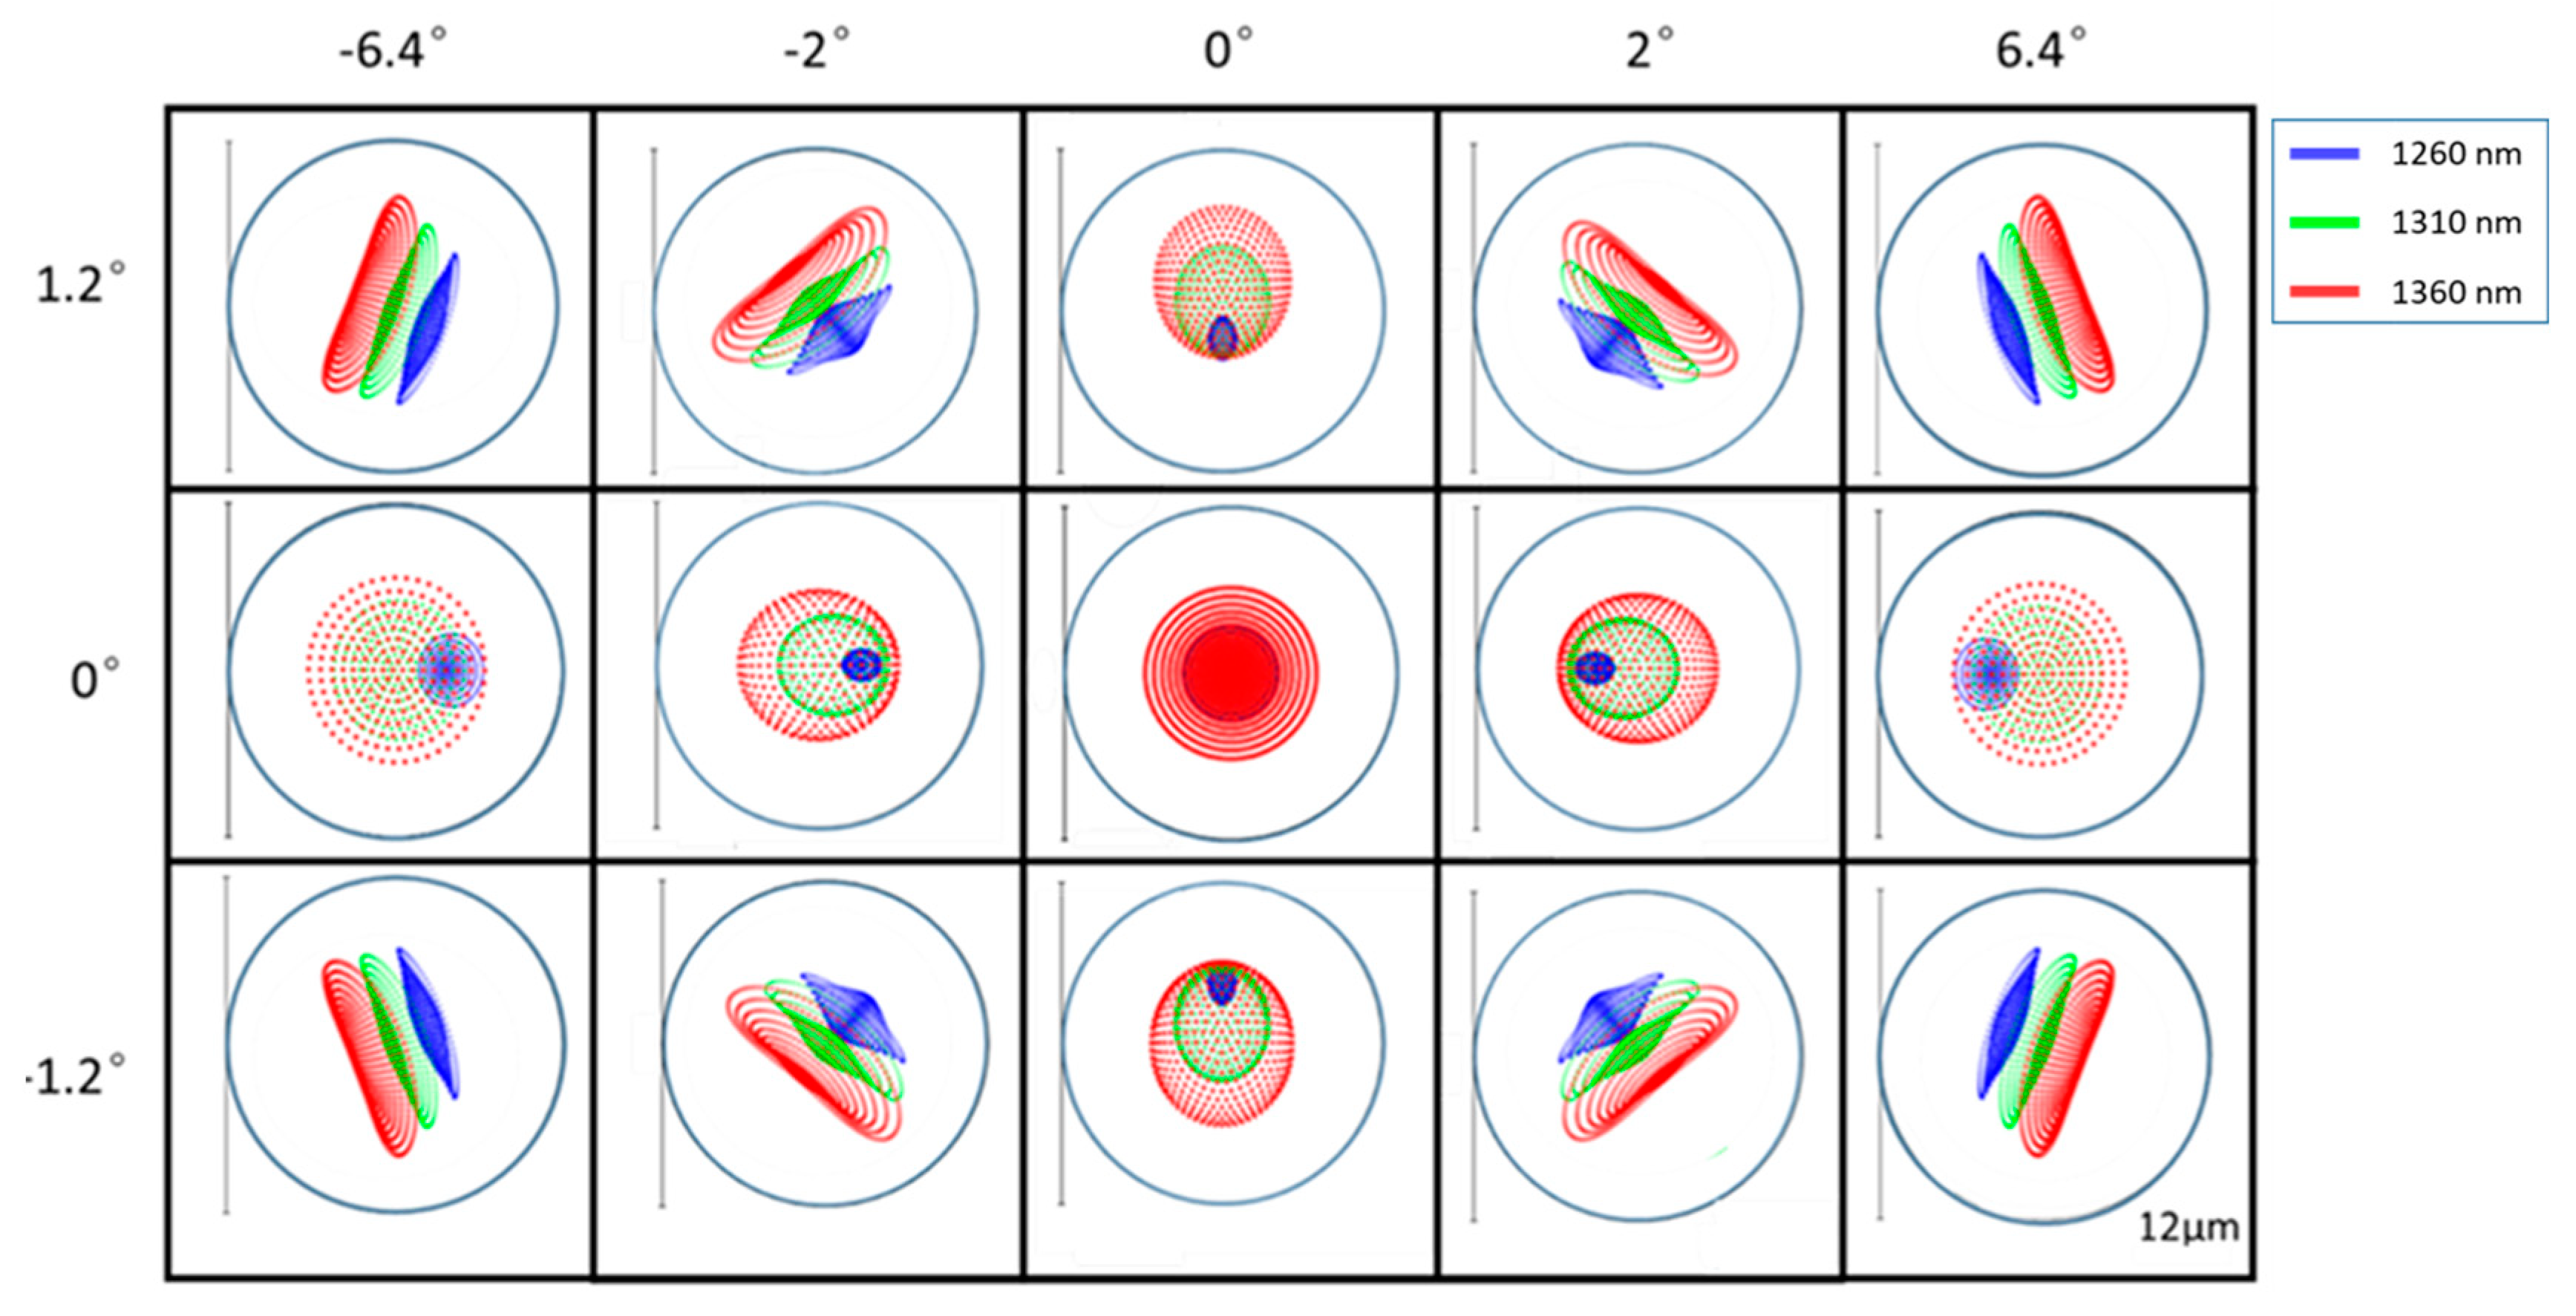
2.2. Optical Design of The Sample Arm

To realize cooperative three-view imaging, optics of the sample arm were designed to meet the following three main performance specifications. First, there should be a synthetic 3 mm × 3 mm square shape FOV to accommodate different tube structures within a diameter of 3 mm. The size of the synthetic FOV can be changed depending on the application requirement. Here a 3 mm × 3 mm FOV is designed to meet the imaging demand of most of the vessel sizes in clinical reconstructive surgery. Second, the optical scanning segment line for each individual view at its focal plane should lie on the same plane to guarantee cross-sectional imaging for the same sample position. Third, to form the image at the same position relative to the reference beam of OCT, the optical path length (OPL) of each individual view should be the same from the sample arm collimator to its focal plane.
The optical setup of the cooperative three-view imaging sample arm is shown in Figure 2A. It was designed and optimized in Zemax (Radiant Zemax LLC, Redmond, WA, USA). Light from the sample arm is transmitted through a single-mode fiber. A laser beam then passes through a collimator (F220APC, Thorlabs, Newton, NJ, USA), and a two-axis galvanometer scanner (GVSM002, Thorlabs, Newton, NJ, USA) is used to perform beam scanning. The center of the galvanometer scanner is placed at the focal plane of one pair of achromatic doublets (AC254-150-C, Φ25.4 mm, Thorlabs, Newton, NJ, USA). Then the scanning beam perpendicularly emerged from the Mirror1 and was split into three parts. A cylindrical WavePlate2 with a diameter of 25.4 mm, thickness of 14 mm and an 8 mm × 8 mm square hole in the center was used to shift the focal plane of the side views backward by 6 mm. In this configuration, the sample can be imaged at the ideal imaging position of each view, which is near the focal plane of each view when the reference position is fixed. Eventually, a 3 mm × 3 mm rectangular scanning area was constructed by adjusting the position of the Mirror2 and Mirror3. A 22.5 mm long customized wedge WavePlate1 shown in Figure 2B was designed to match the OPL of the three individual imaging paths. The front surface size of waveplate1 is 12 mm × 4 mm while the back surface of waveplate1 is 12 mm × 6 mm. A customized waveplate shown in Figure 2B,C were manufactured using N-SF6HT material( C.F. Technology, Beijing, China) working at a bandwidth of 1020 nm–1390 nm. Surfaces of the waveplate were coated with an antireflection coating.
Positions of the focused scanning spots at the focal plane for left view, right view, and central view at different slow axis scanning angles based on Zemax simulations are shown in Figure 3. From Figure 3 we can clearly see that the focused scanning spots from three views lie almost on the same line. It will keep cross-sectional images of the sample from different views on the same plane, which is easier for poster image registration.
Figure 4 shows the spot diagrams on the image plane for the sample arm. The maximum radial field angle (6.4° and 1.2°) of the scanner in XY-directions corresponds a rectangle FOV of 12 mm × 3 mm and each scanning area has a 3 mm × 3 mm square FOV. The optic design was optimized in Zemax to achieve a near-diffraction limited resolution of 12 μm. An airy disk is marked out with blue circles on the spot diagrams.

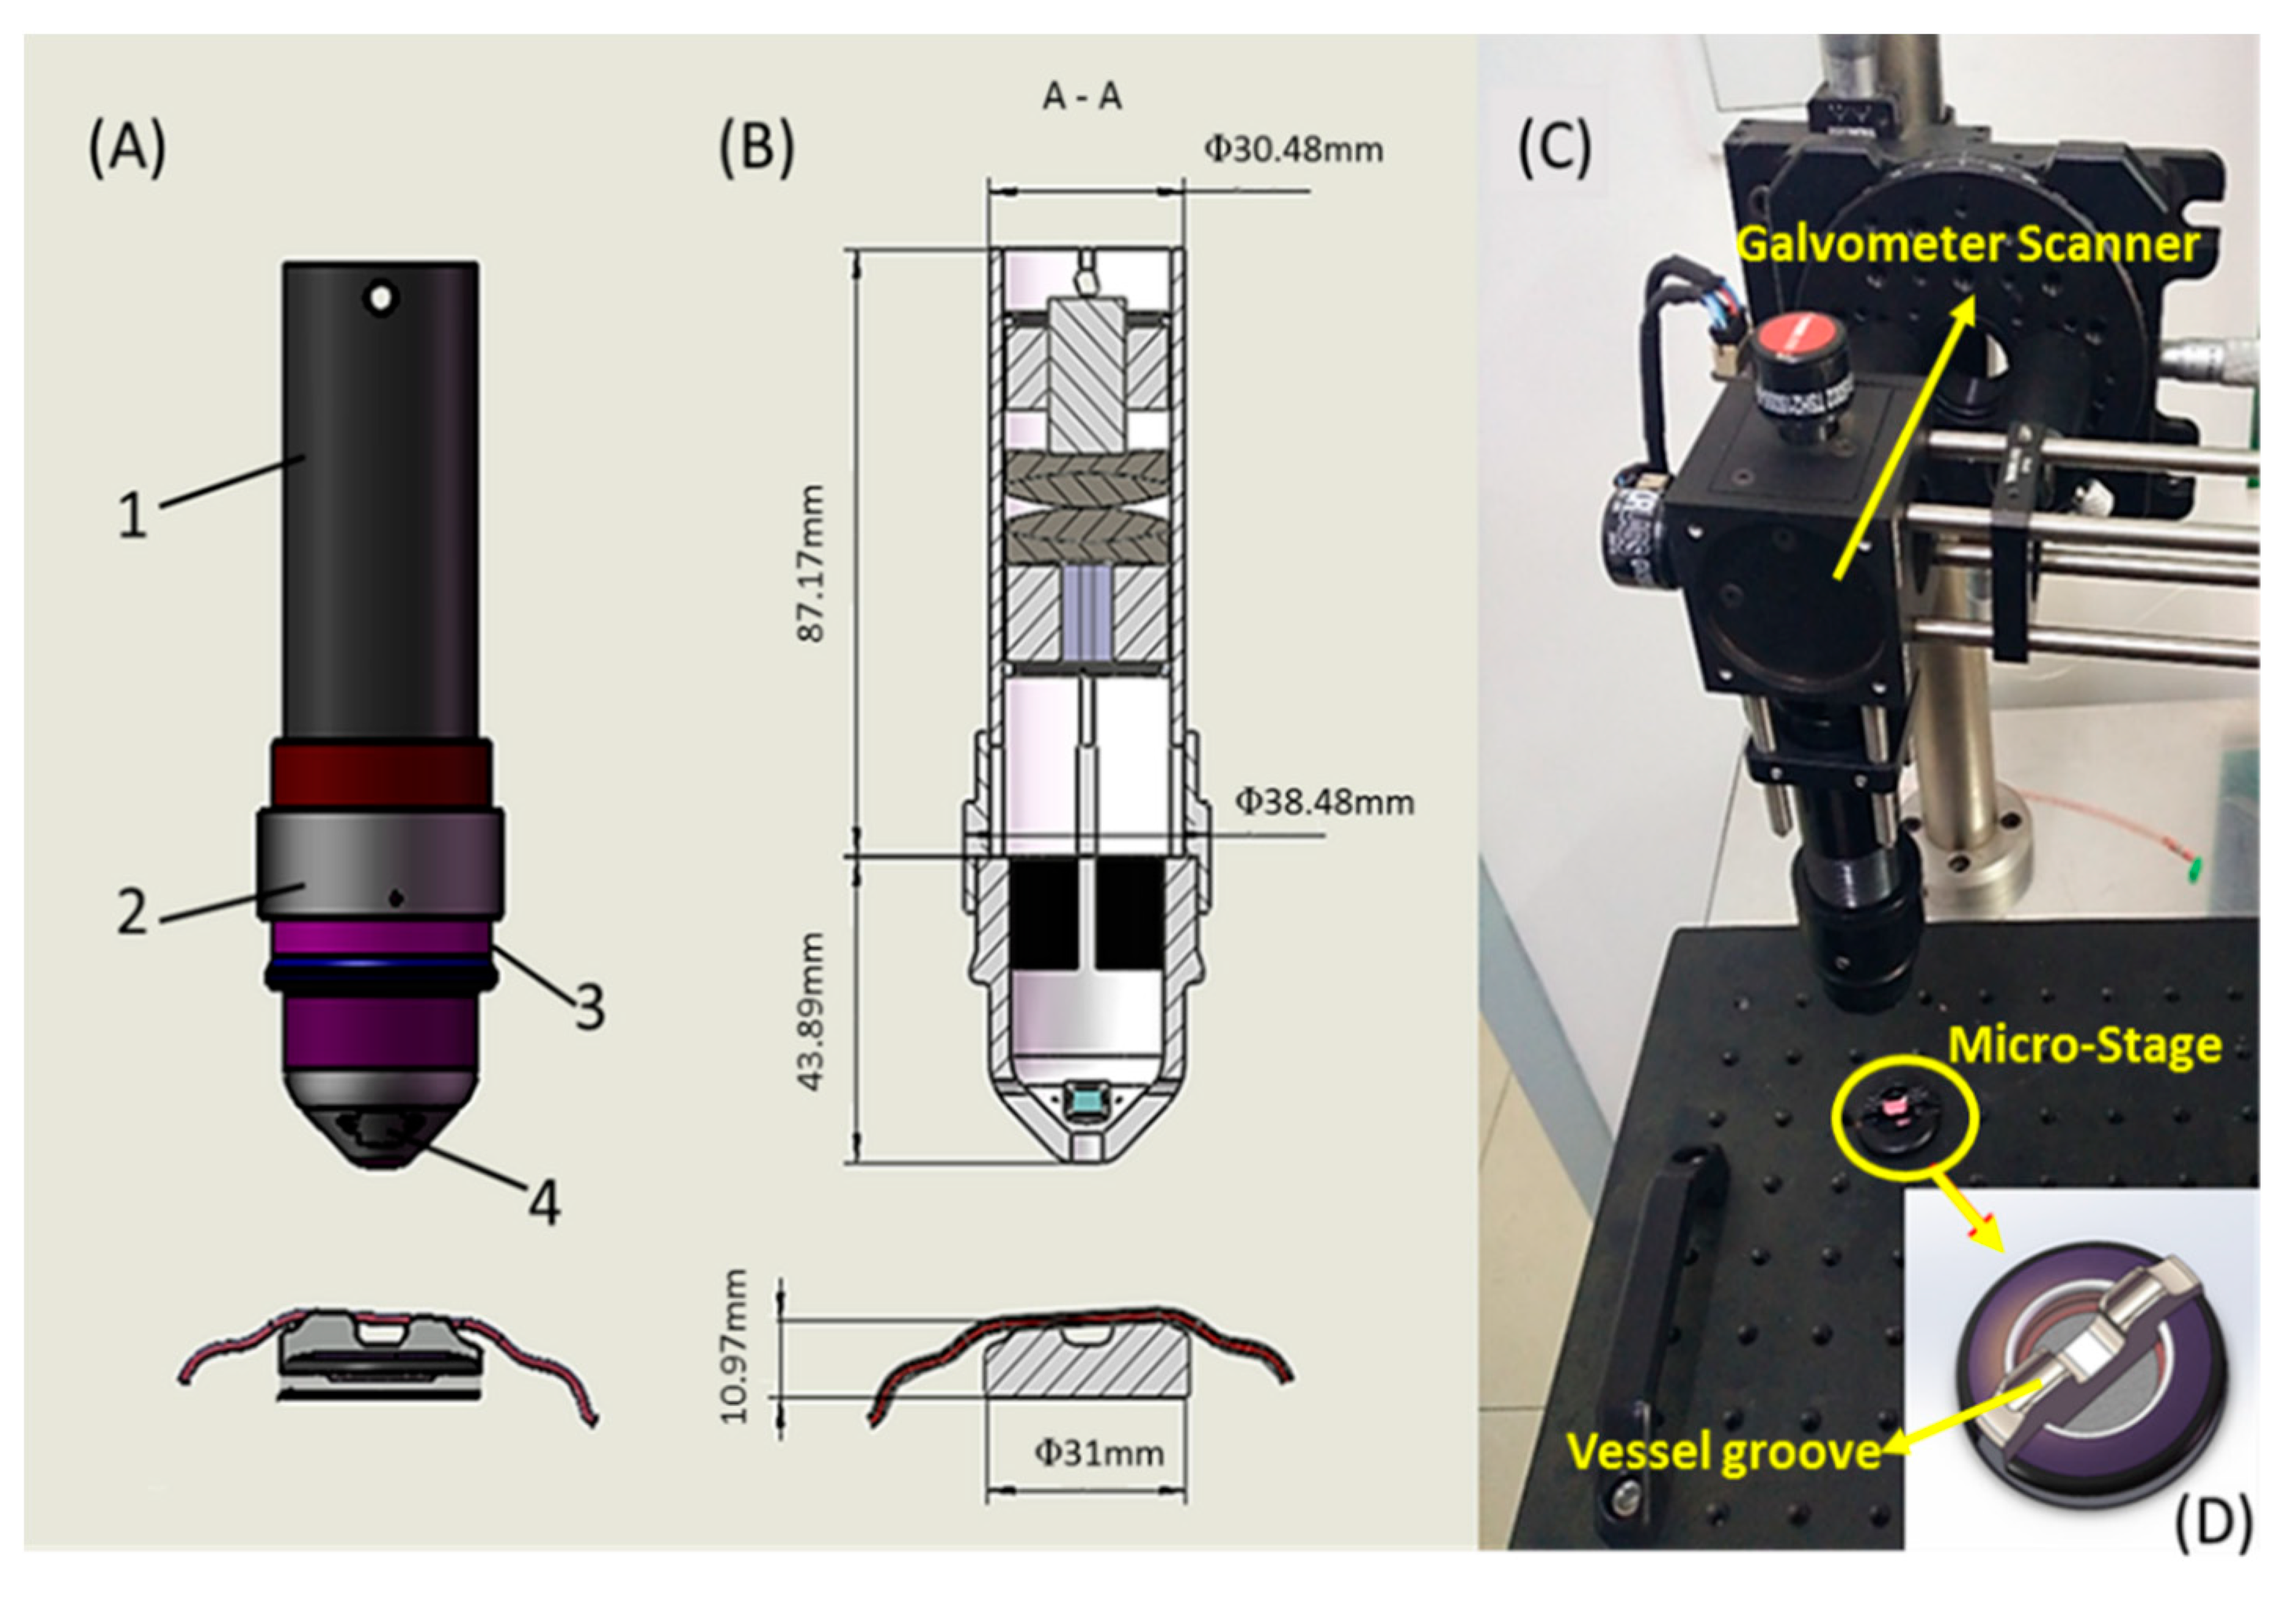
2.3. Mechanical Design and Fabrication

The mechanical design of the holder to accommodate the designed optical setup is shown in Figure 5A. It contains four parts: a lens tube, an adjustable ring, a scanning head and a micro stage. Figure 5B is the cross-sectional view of the holder. Achromatic doublets, customized waveplates, and the corresponding retaining fixtures were encapsulated inside the tube. A pair of 5 mm × 5 mm mirrors were mounted symmetrically on a 45° inner wall of the scanning head. The lens tube was fixed with the galvanometer scanner through a cage system and connected with the scanning head through a groove on its bottom. The outside of the lens tube was equipped with an adjustable ring with an internal thread, which can be used to control the working distance.
To avoid the imaging instability caused by the actual operation tremble, we designed a micro stage with a diameter of 31 mm coupled with the scanning head. As shown in Figure 5D, the middle protruding part of the micro stage has a tilt angle of 3° with a groove to accommodate vessel. That 3° tilt angle can serve as Doppler angle for future velocity measurement. The assembled sample arm is shown in Figure 5C mounted on a cage system. All the structure components and the enclosure shown in Figure 5A were made of aluminum, which had a weight of 210 g and a size of 131 mm × 38 mm × 38 mm.

2.4. SD-OCT System Configuration

A schematic of the SDOCT system configuration is shown in Figure 6. The super-luminescent diode (IPSDS1307, InPhenix Technologies Inc., Livermore, CA, USA) laser was used with a central wavelength of 1310 nm and a bandwidth of 100 nm. The emitted light of the SLD source is split into the sample arm and reference arm by a 50/50 fiber coupler (FC1310-70-50APC, Thorlabs, Newton, NJ, USA). The light of the sample arm propagates along fiber into the collimator and then converts into a 1.5 mm beam input to our novel three-view imaging sample arm as illustrated in Figure 6.
The homebuilt SDOCT system has an axial resolution of 14 μm and imaging range of 6.7 mm. A GL2048R line scan camera from Sensors Unlimited Inc. (Princeton, NJ, USA) was used in the spectrometer, which has 2018 pixels with a 10-μm pixel pitch width and 210-μm pixel height. A-scan rate of the OCT system is 40 kHz and each B-Scan consists of 1000 A-Scan. The sensitivity of the SDOCT system was measured to be 92 dB at a position 0.2 mm away from the focal plane of sample objective and the sensitivity roll-off was 13.6 dB/mm. A numerical dispersion method was implemented into the software to deal with any dispersion mismatch. Each frame contains cross-sectional images of three individual views. The 3D volume scanning data consists of 250 B-Scan frames. The DAQ card generates scanner control waveforms and synchronization signals for data acquisition. A customized software developed based on Qt 5.5, C++ (Microsoft Visual Studio, Redmond, WA, USA) and CUDA 7.5 controls data acquisition, processing and display.

2.5. Ethical Considerations

Beijing Institute of Technology Animal Care and Use Committee approved all experiments and the animals were handled in accordance with the Beijing Institute of Technology Animal Care and Use Committee guidelines. A six to eight-week-old rat was anesthetized with a Nembutal injection. A femoral artery was exposed through an anteromedial skin incision. OCT imaging procedures were performed immediately after the surgical procedure was completed. At the end of the experiments, the rat was euthanized by cervical dislocation.

3. Results

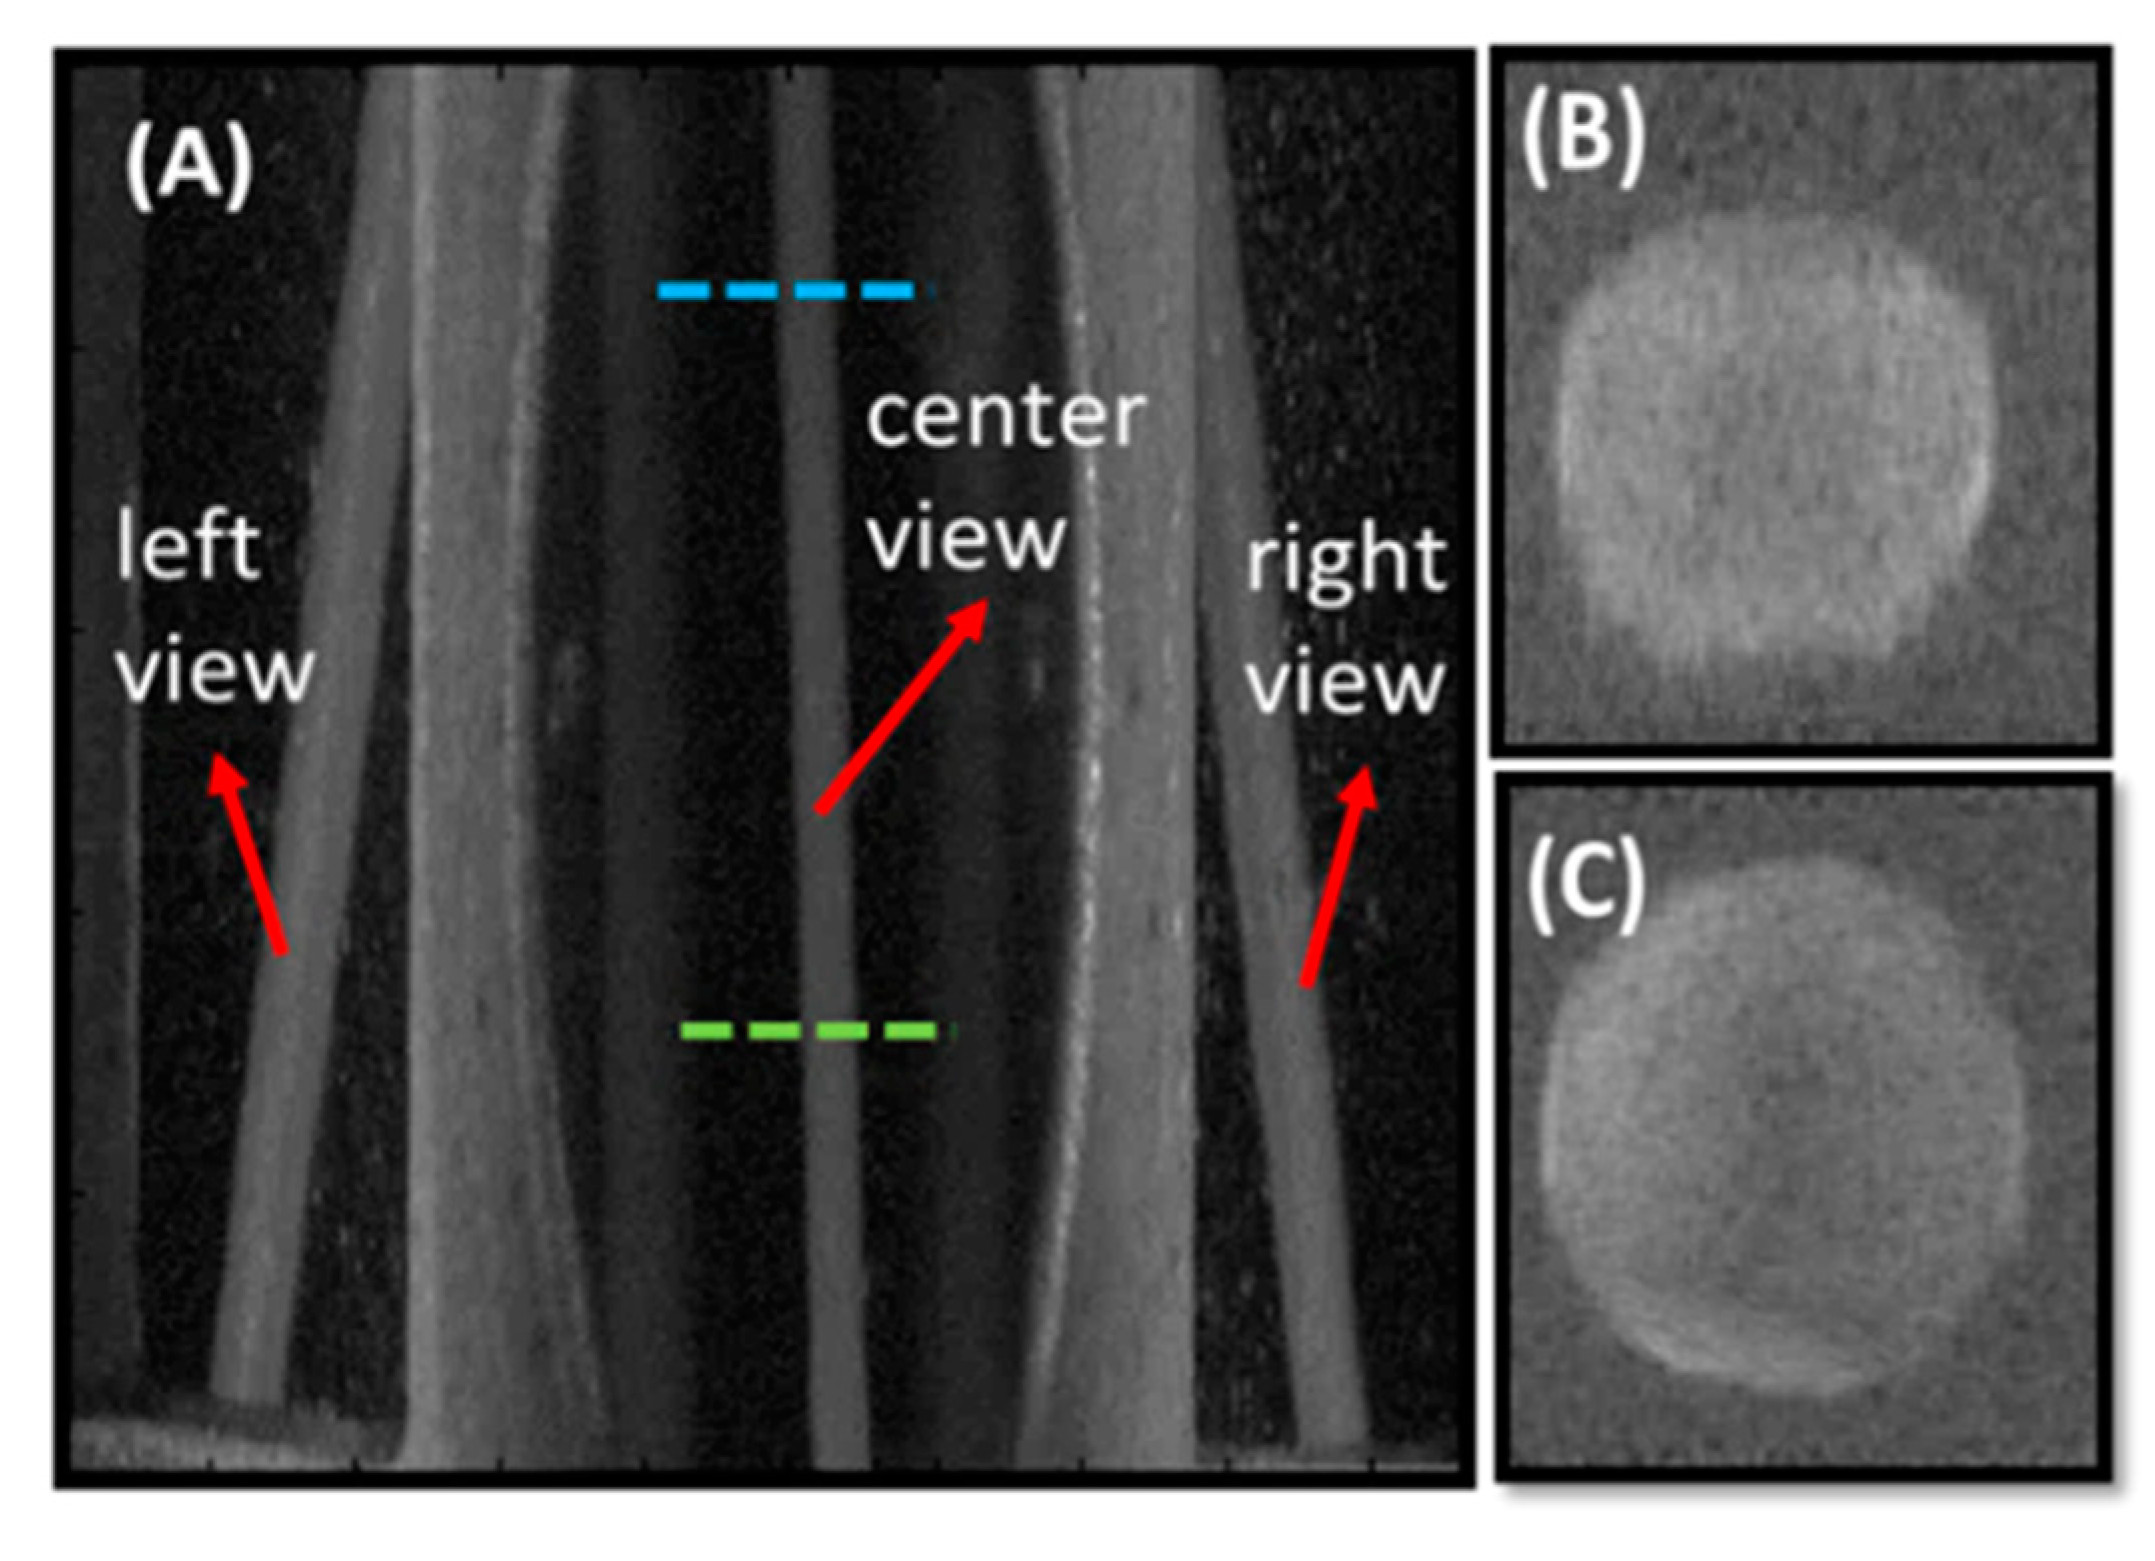
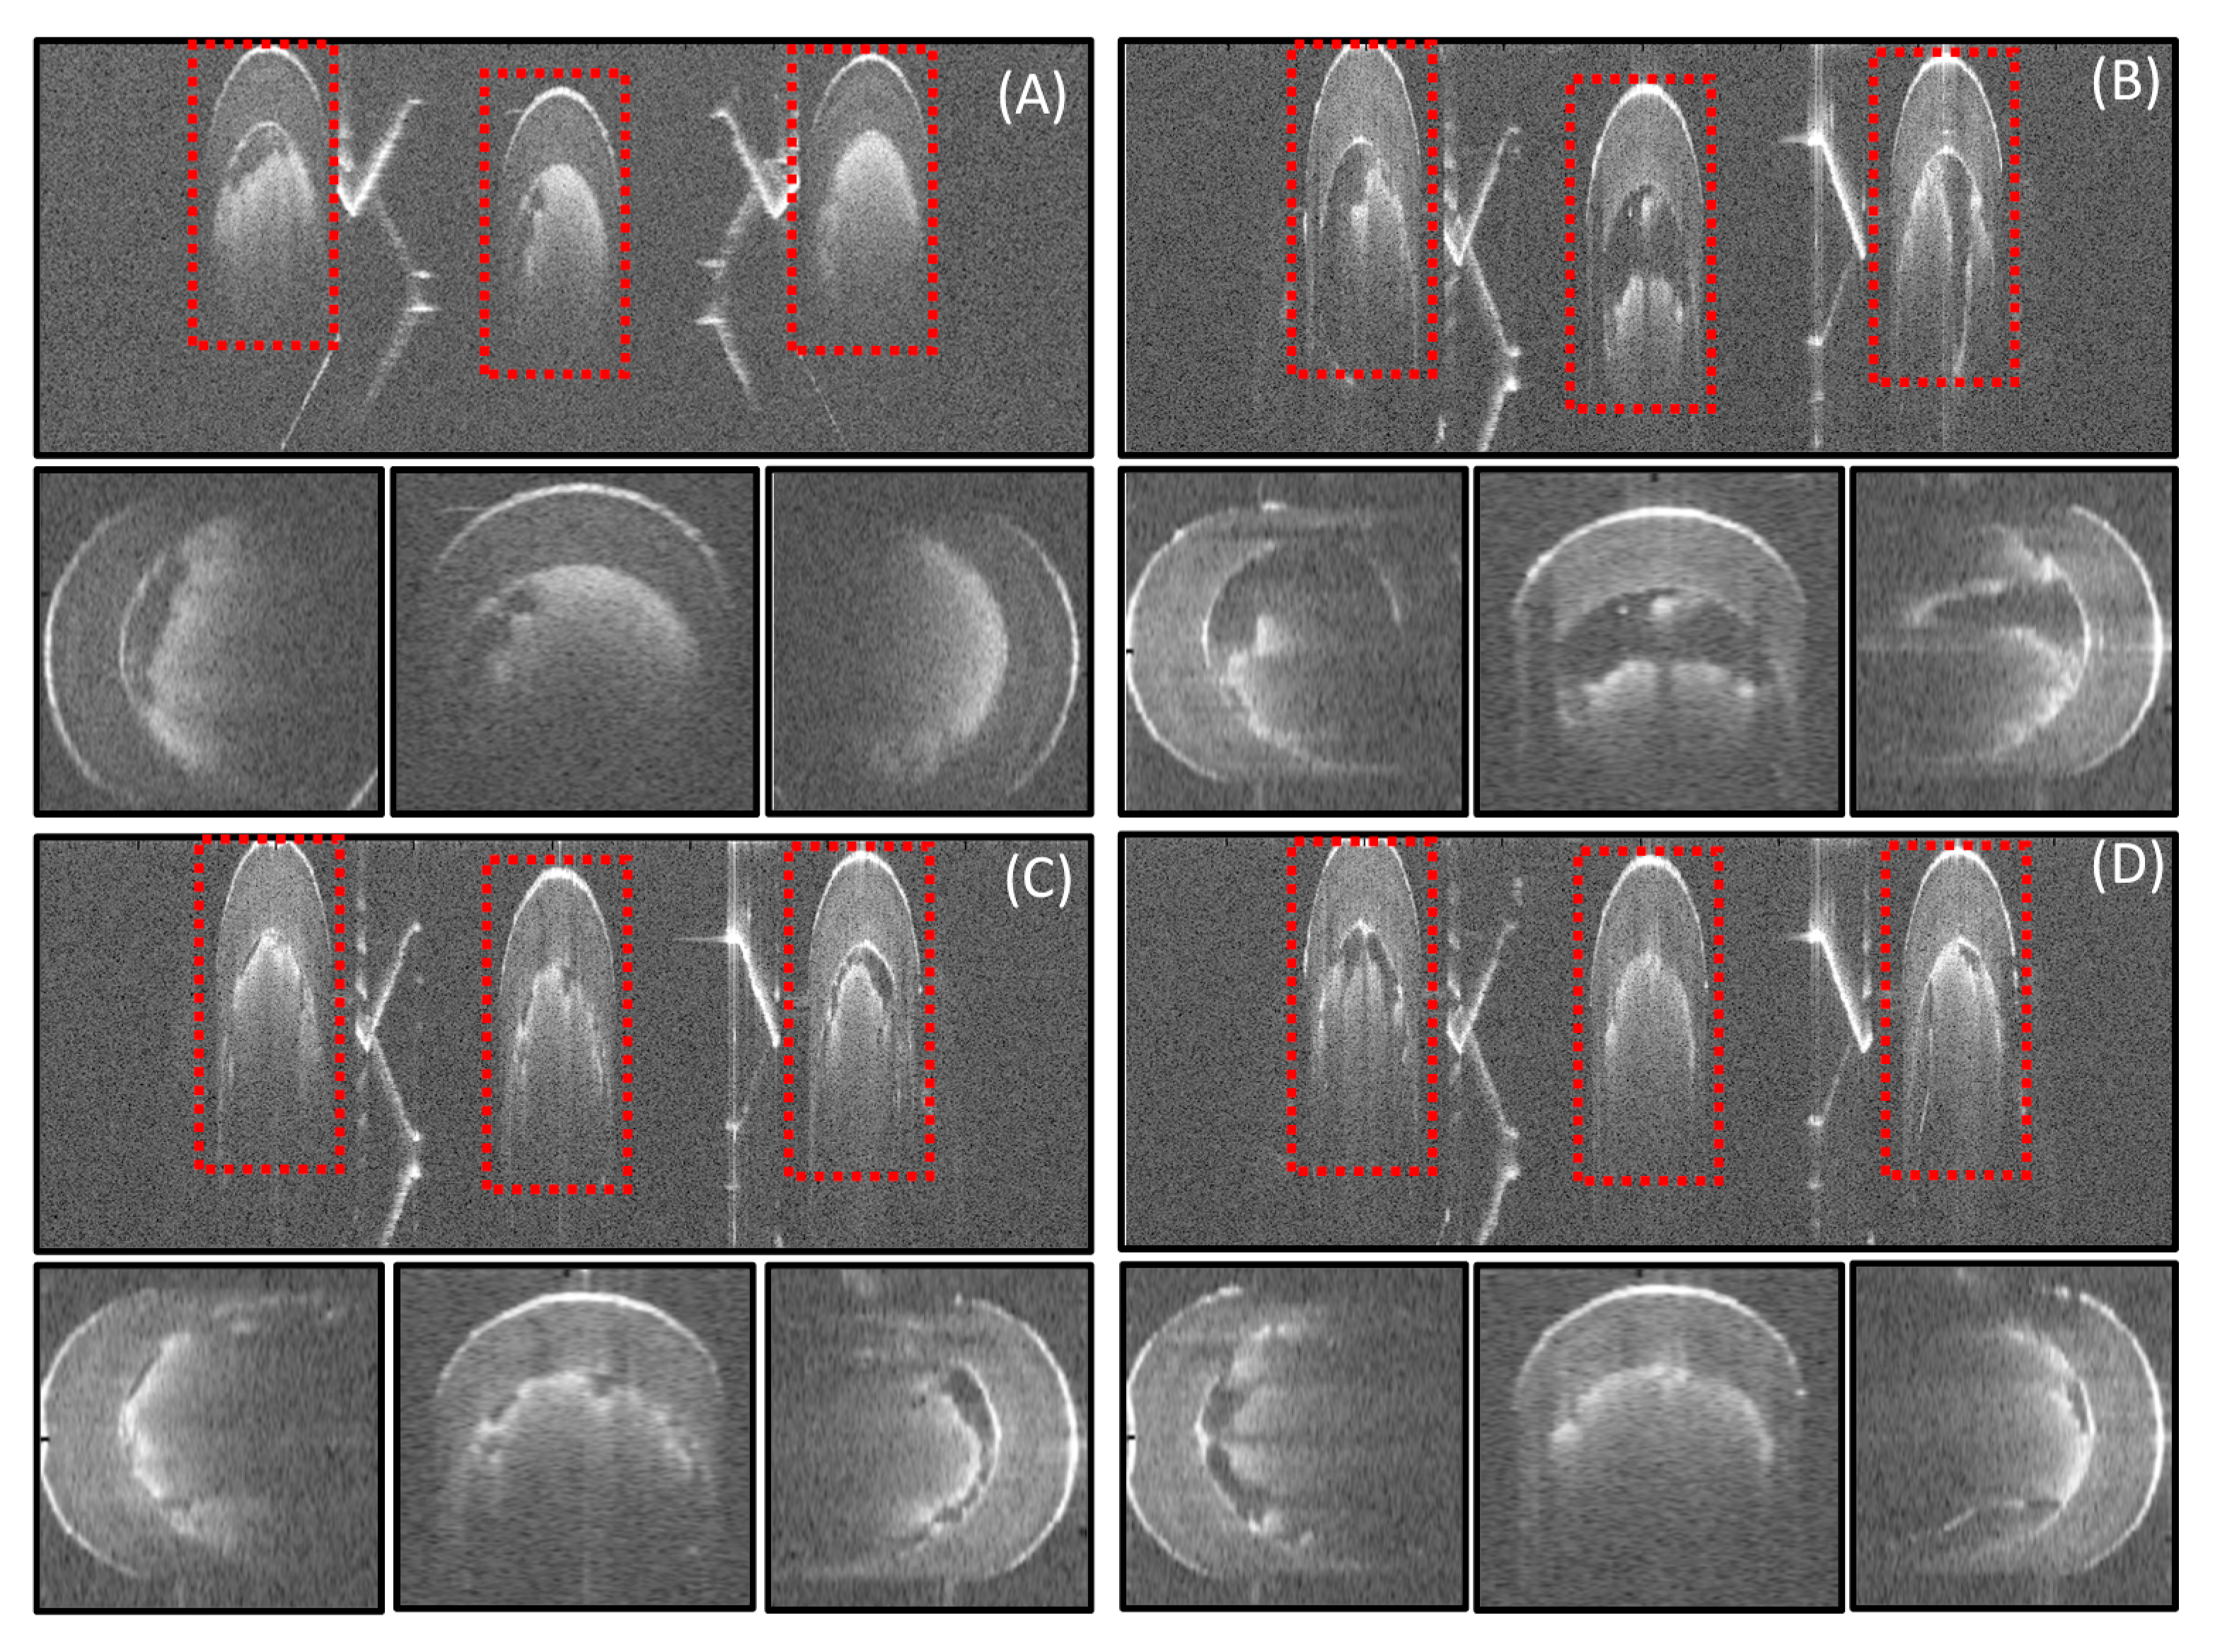
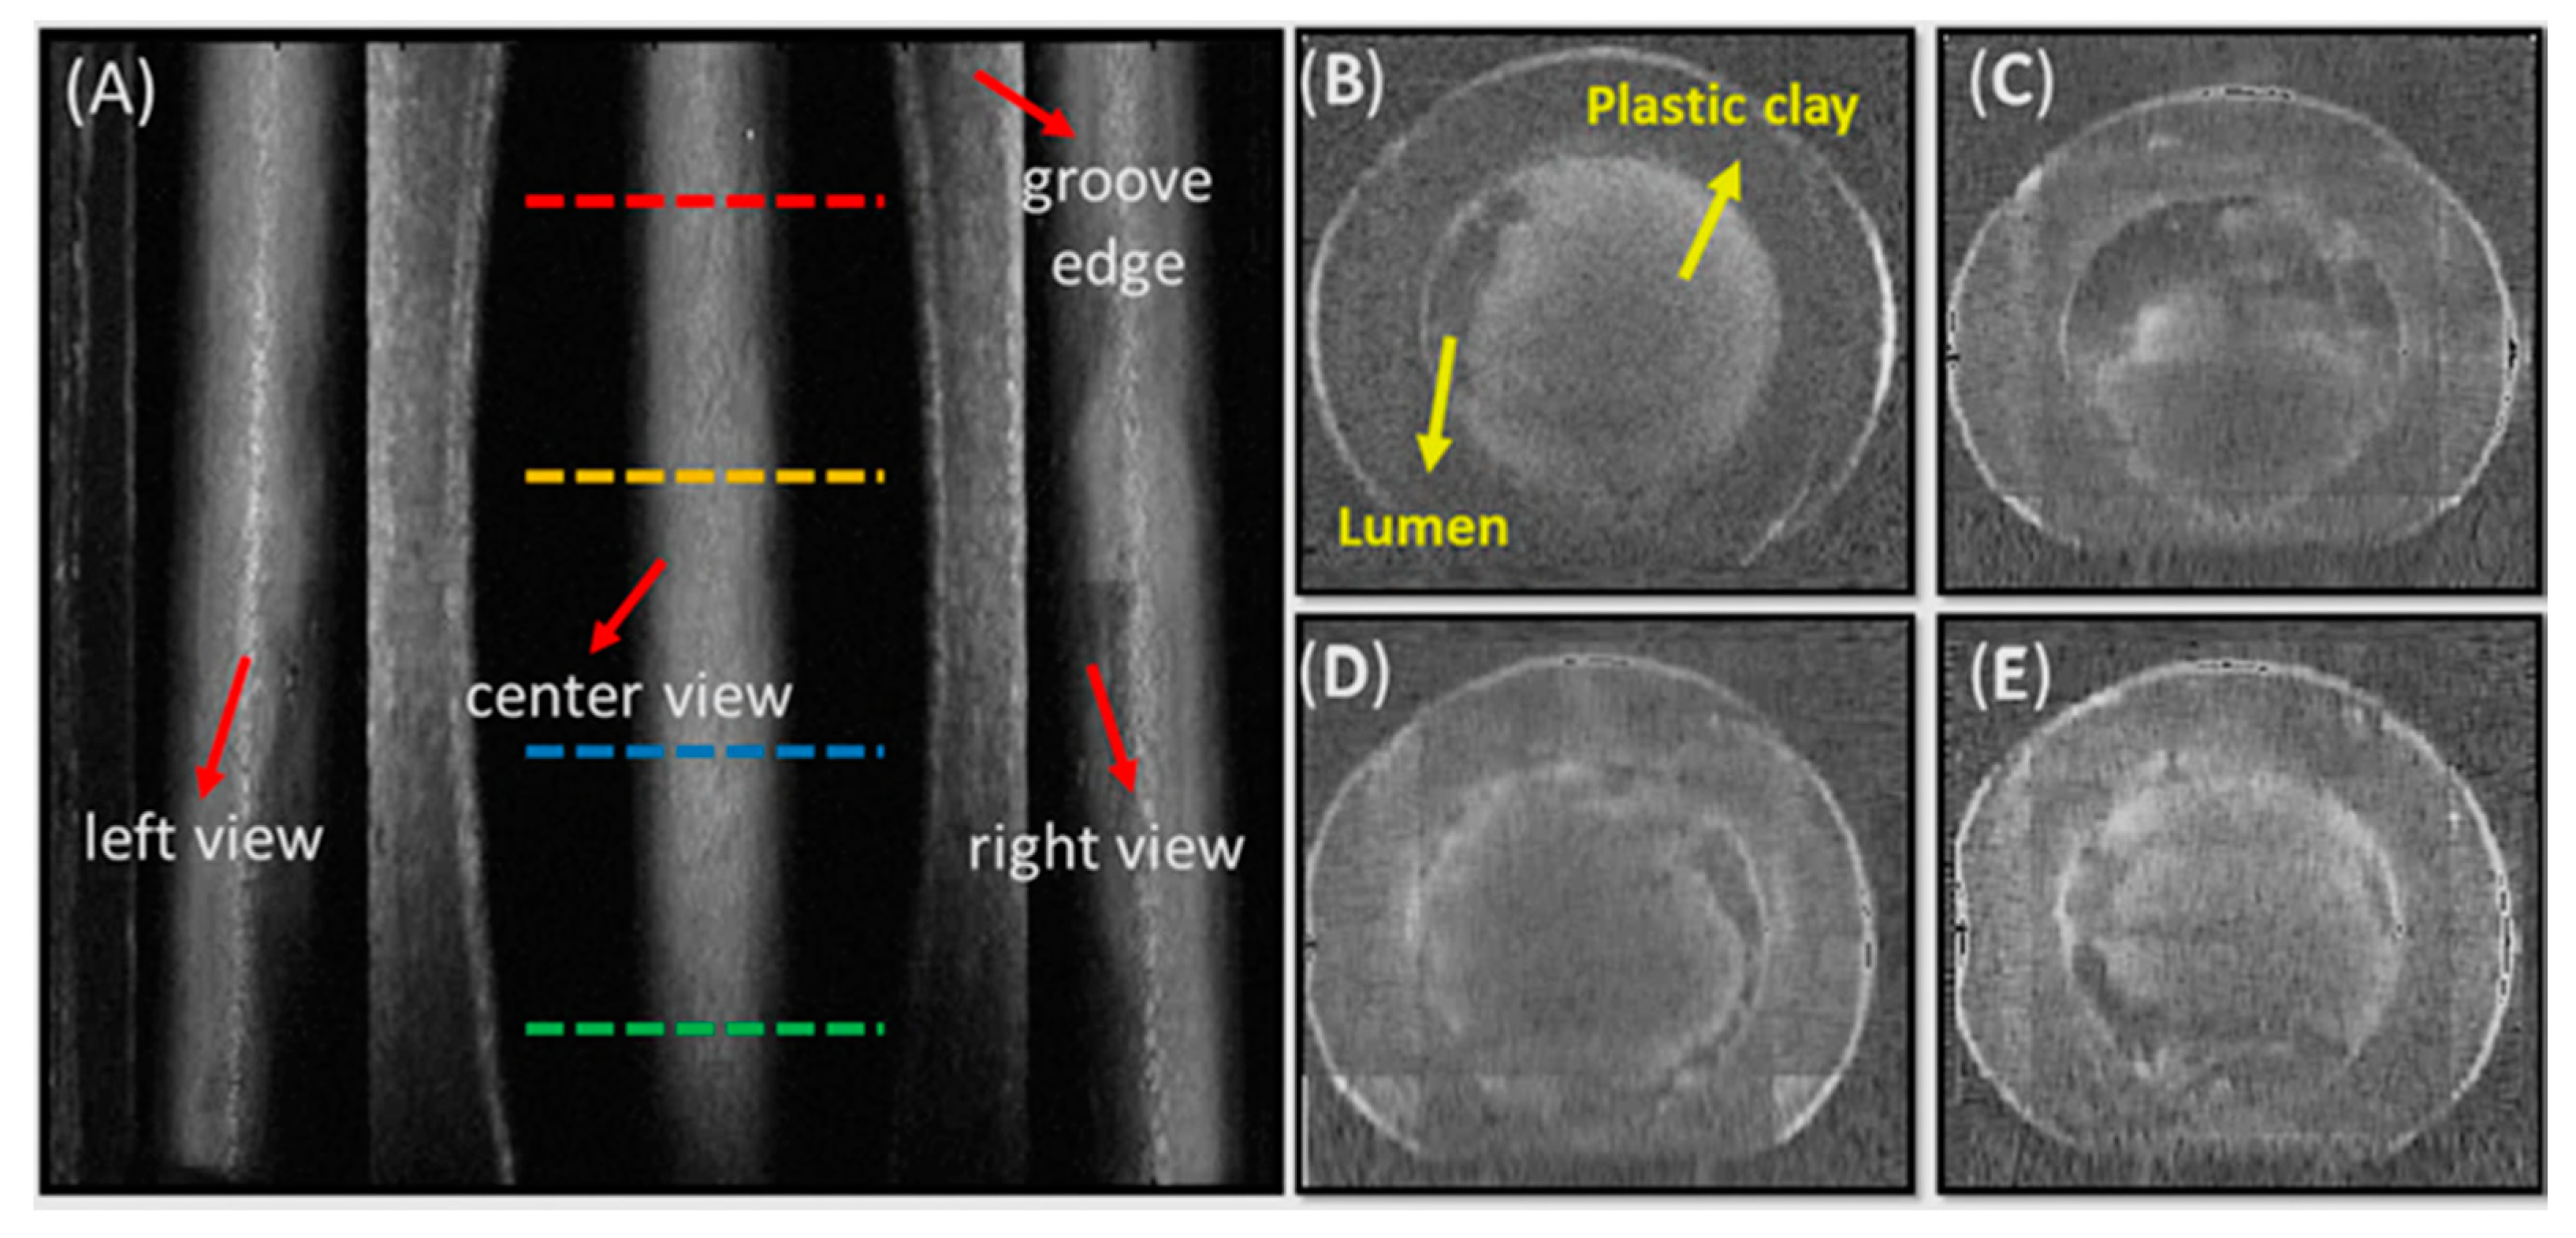
3.1. Phantom Imaging

We first evaluated our system for plastic tube phantom imaging. Before showing the results, it is necessary to show how to interpret the imaging results. Figure 7 illustrates the original B-mode image from cooperative three-view scanning. The red box in the top of Figure 7 is the left view image, the blue box shows the central view imaging while the yellow box shows the right view image. To place the left view image in the correct physical position as in the bottom of Figure 7, the red box should be flipped left to right and rotated 90° anti-clockwise. To place the right view image in the correct physical position as in the bottom-left of Figure 7, the yellow box should be flipped left to right and rotated 90° clock-wise. The reason behind these operations is that the left view beam scans from top to bottom and right view beam scans from bottom to top when beams are folded.
To demonstrate the capability of the system for tube imaging with different sizes, we imaged phantom tubes with outer diameters of 1 mm, 2.0 mm, and 2.5 mm, respectively. The inner wall of the tube was modified by filling certain plastic clay in the tube to mimic a thrombosis structure in blood vessels and the flow was simulated by milk flow pumped at different rates. The results are shown in Figure 8A–C. We can clearly see the left, central, and right view of the sample in each B-mode image. Between the image zones of each individual view, there are mirror holder margins that separate the threeview images.
From Figure 8 we can see that when the outer dimeter of the tube goes beyond 2 mm, it became impossible for each single view to resolve the whole tube cross-sectional structure. Bottom information of the tube for each view was missing due to the limited penetration depth, which will be a problem for conventional single view imaging OCT systems.
The initial B-mode image needed to be processed to construct the synthetic cross-sectional image of the sample, which included horizontal and lateral scale matching and image registration. Figure 9A–D show the results of image horizontal and lateral scale matching for four selective B-mode images of a 1.8 mm outer diameter tube at different positions within a C-mode imaging. The top row of the figure is the initial B-mode image where the area of interest is marked out by a dashed red rectangular. The bottom row of the figure shows the results after scale matching.
After image scale matching, images from three views were manually registered. A MATLAB graphics user interface (GUI) was developed to realize the manual registration process based on the weighted average fusion algorithm. First, left, right, and top view images needed to be cropped out from one single B-mode frame. Then, the left and right view images were rotated and scaled to the same scale and coordinates as that of top view image. Then the left and right view images were shifted rigidly for registration. Figure 10A shows the en-face image generated by summing the volume in the axial direction. We can see that the tube structure in the groove under the central view and the projections from left and right views are reflected through the 45° mirrors. Figure 10B–E are the synthesized whole-view cross-sectional images of the tube based on Figure 9A–D, respectively, corresponding to the dashed line marked in Figure 10A. We can see clearly that the synthesized whole-view image contains all the information from each view and has effectively solved the problem of information missing in each individual view due to limited penetration depth.

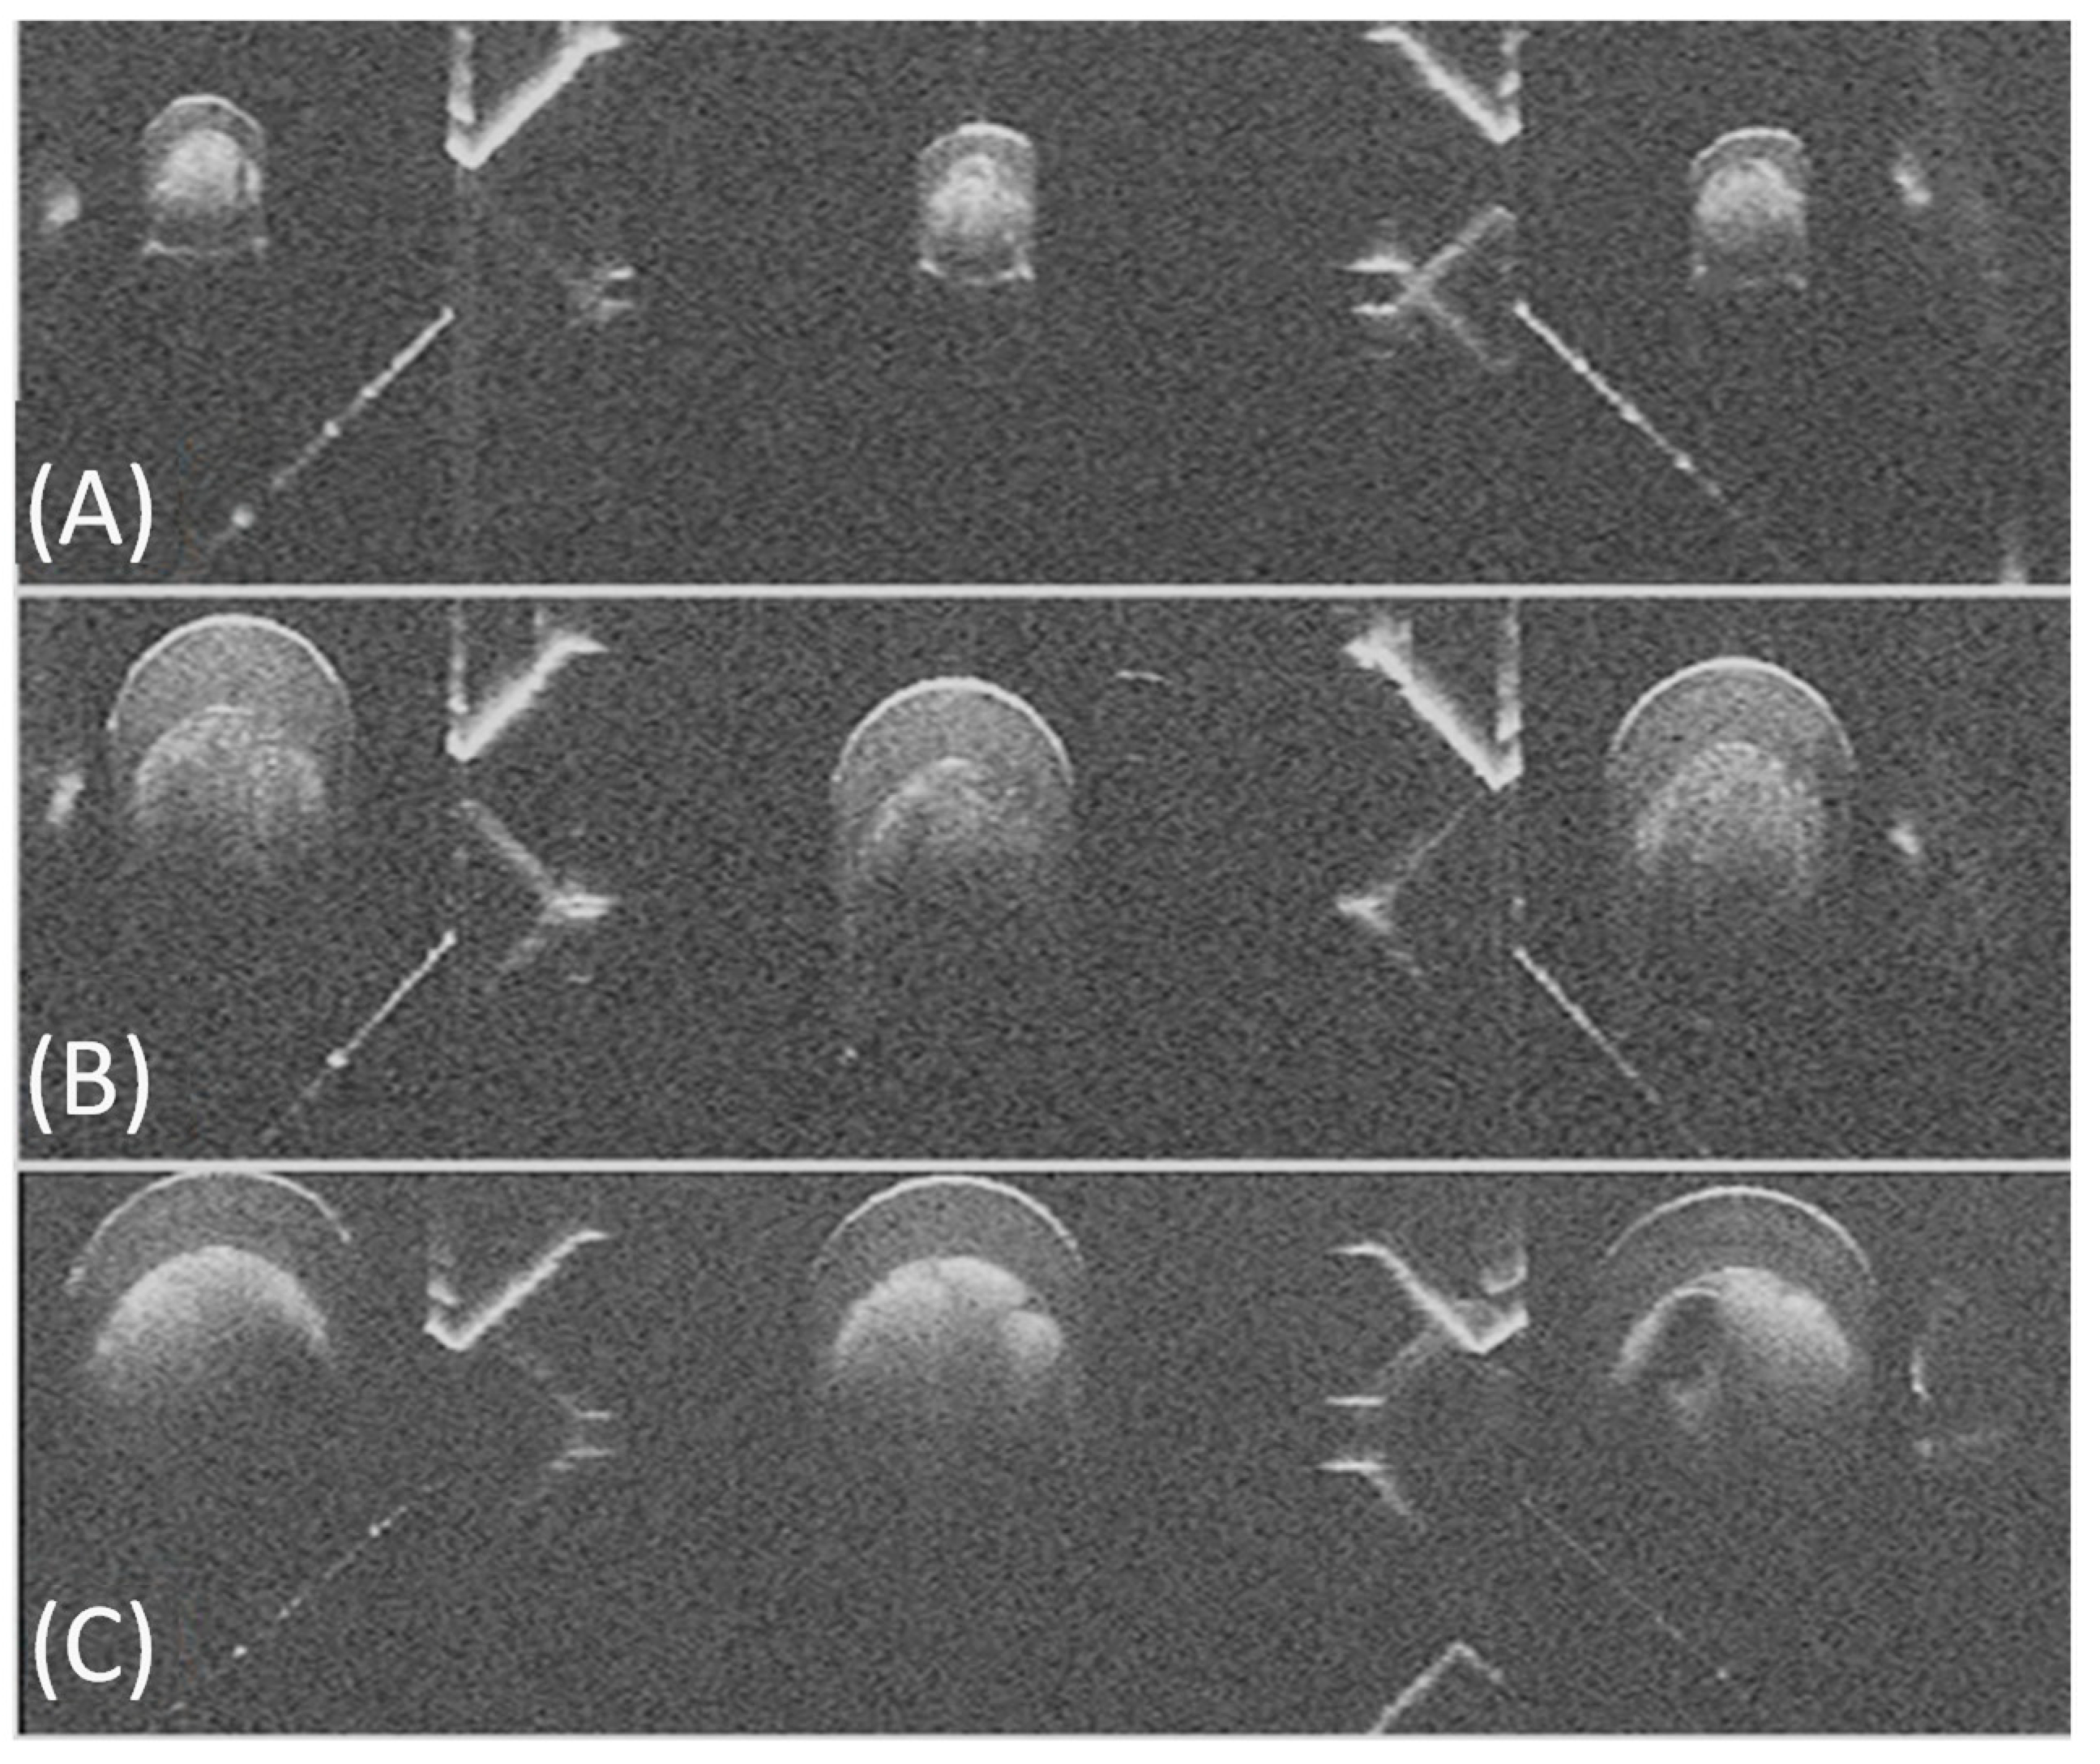
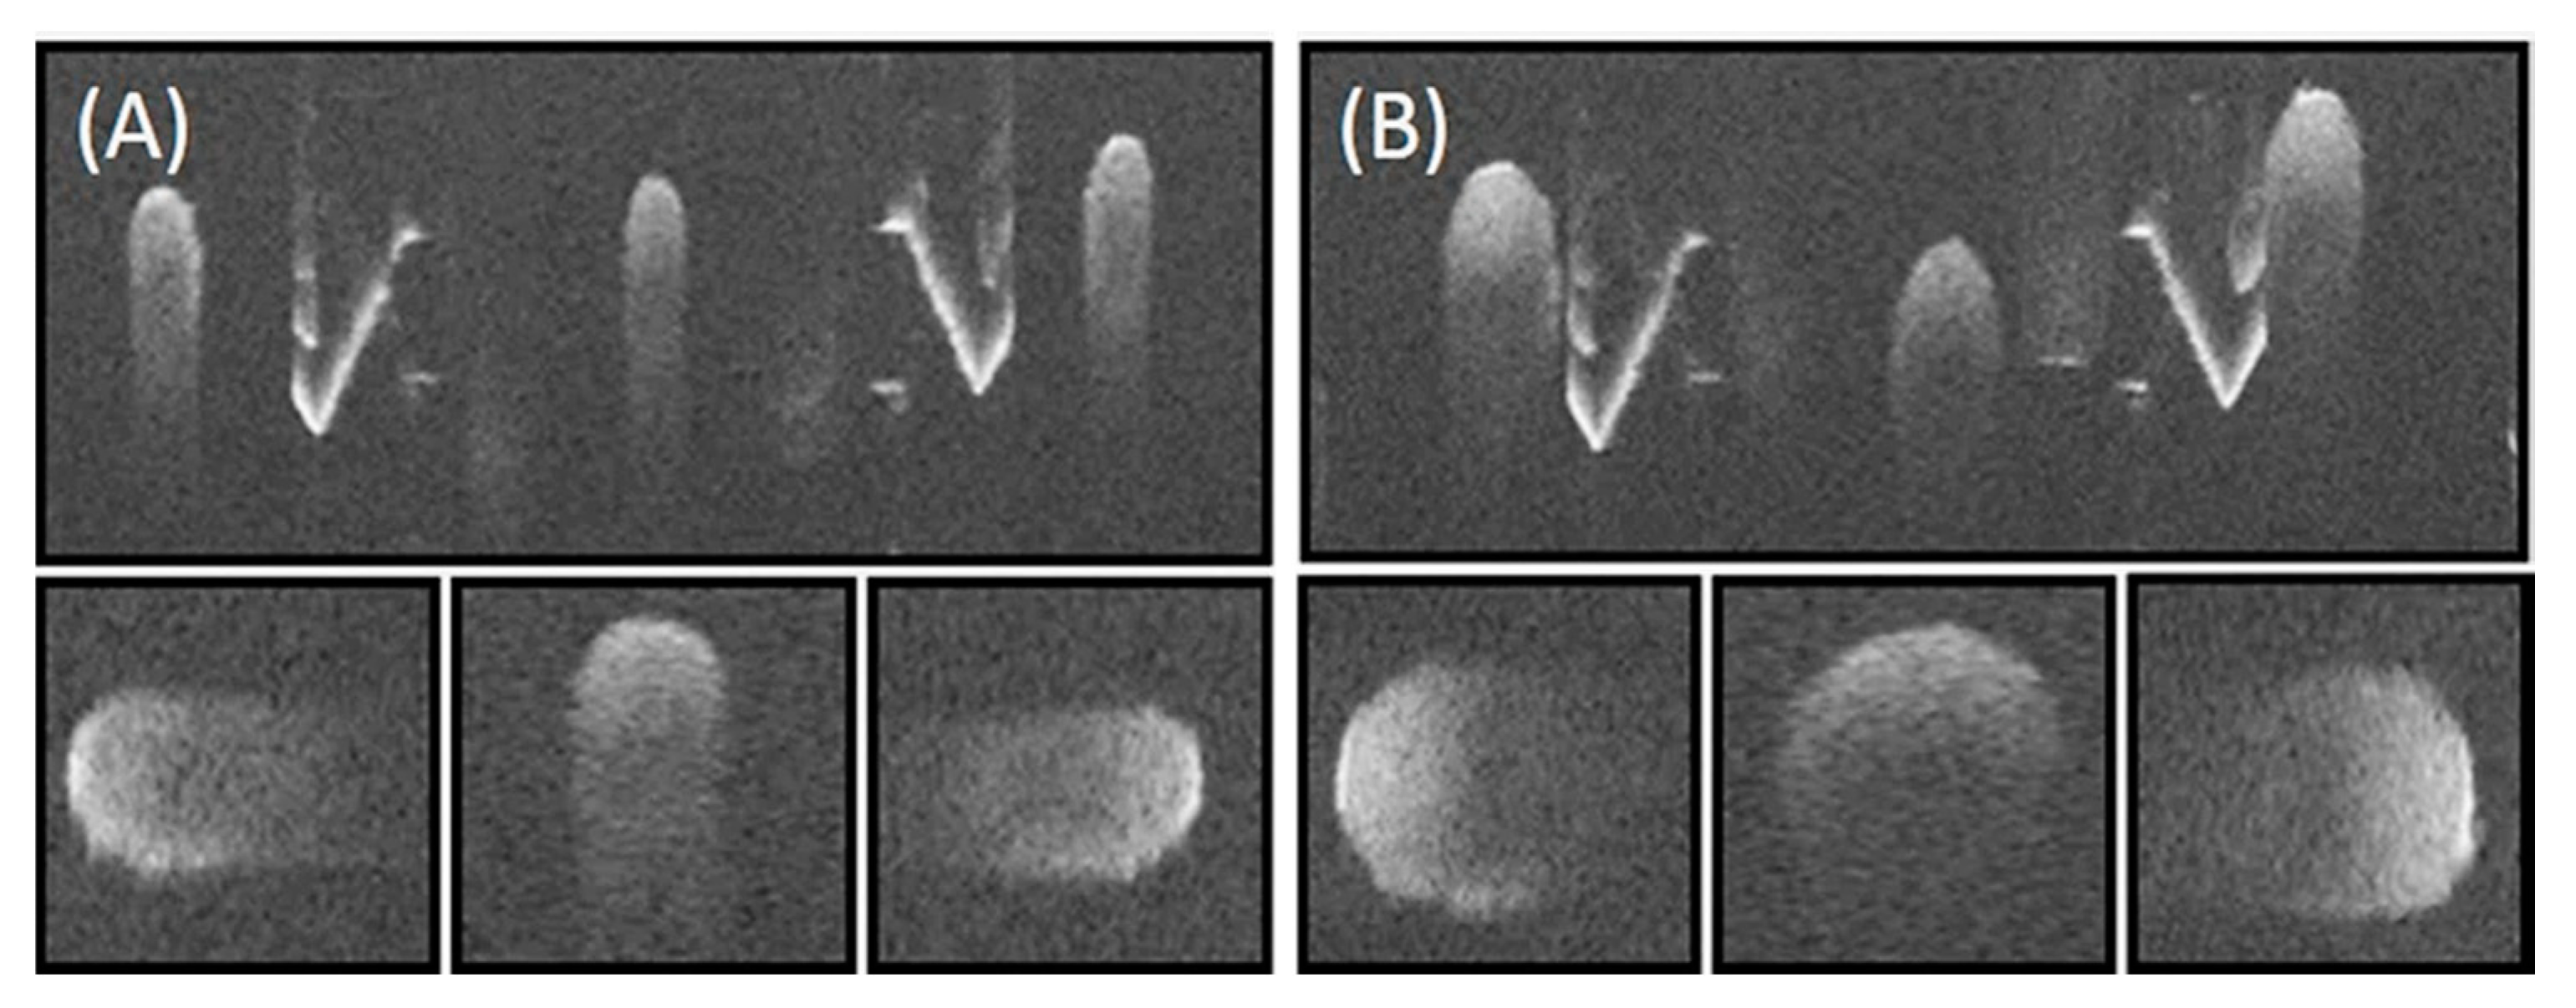
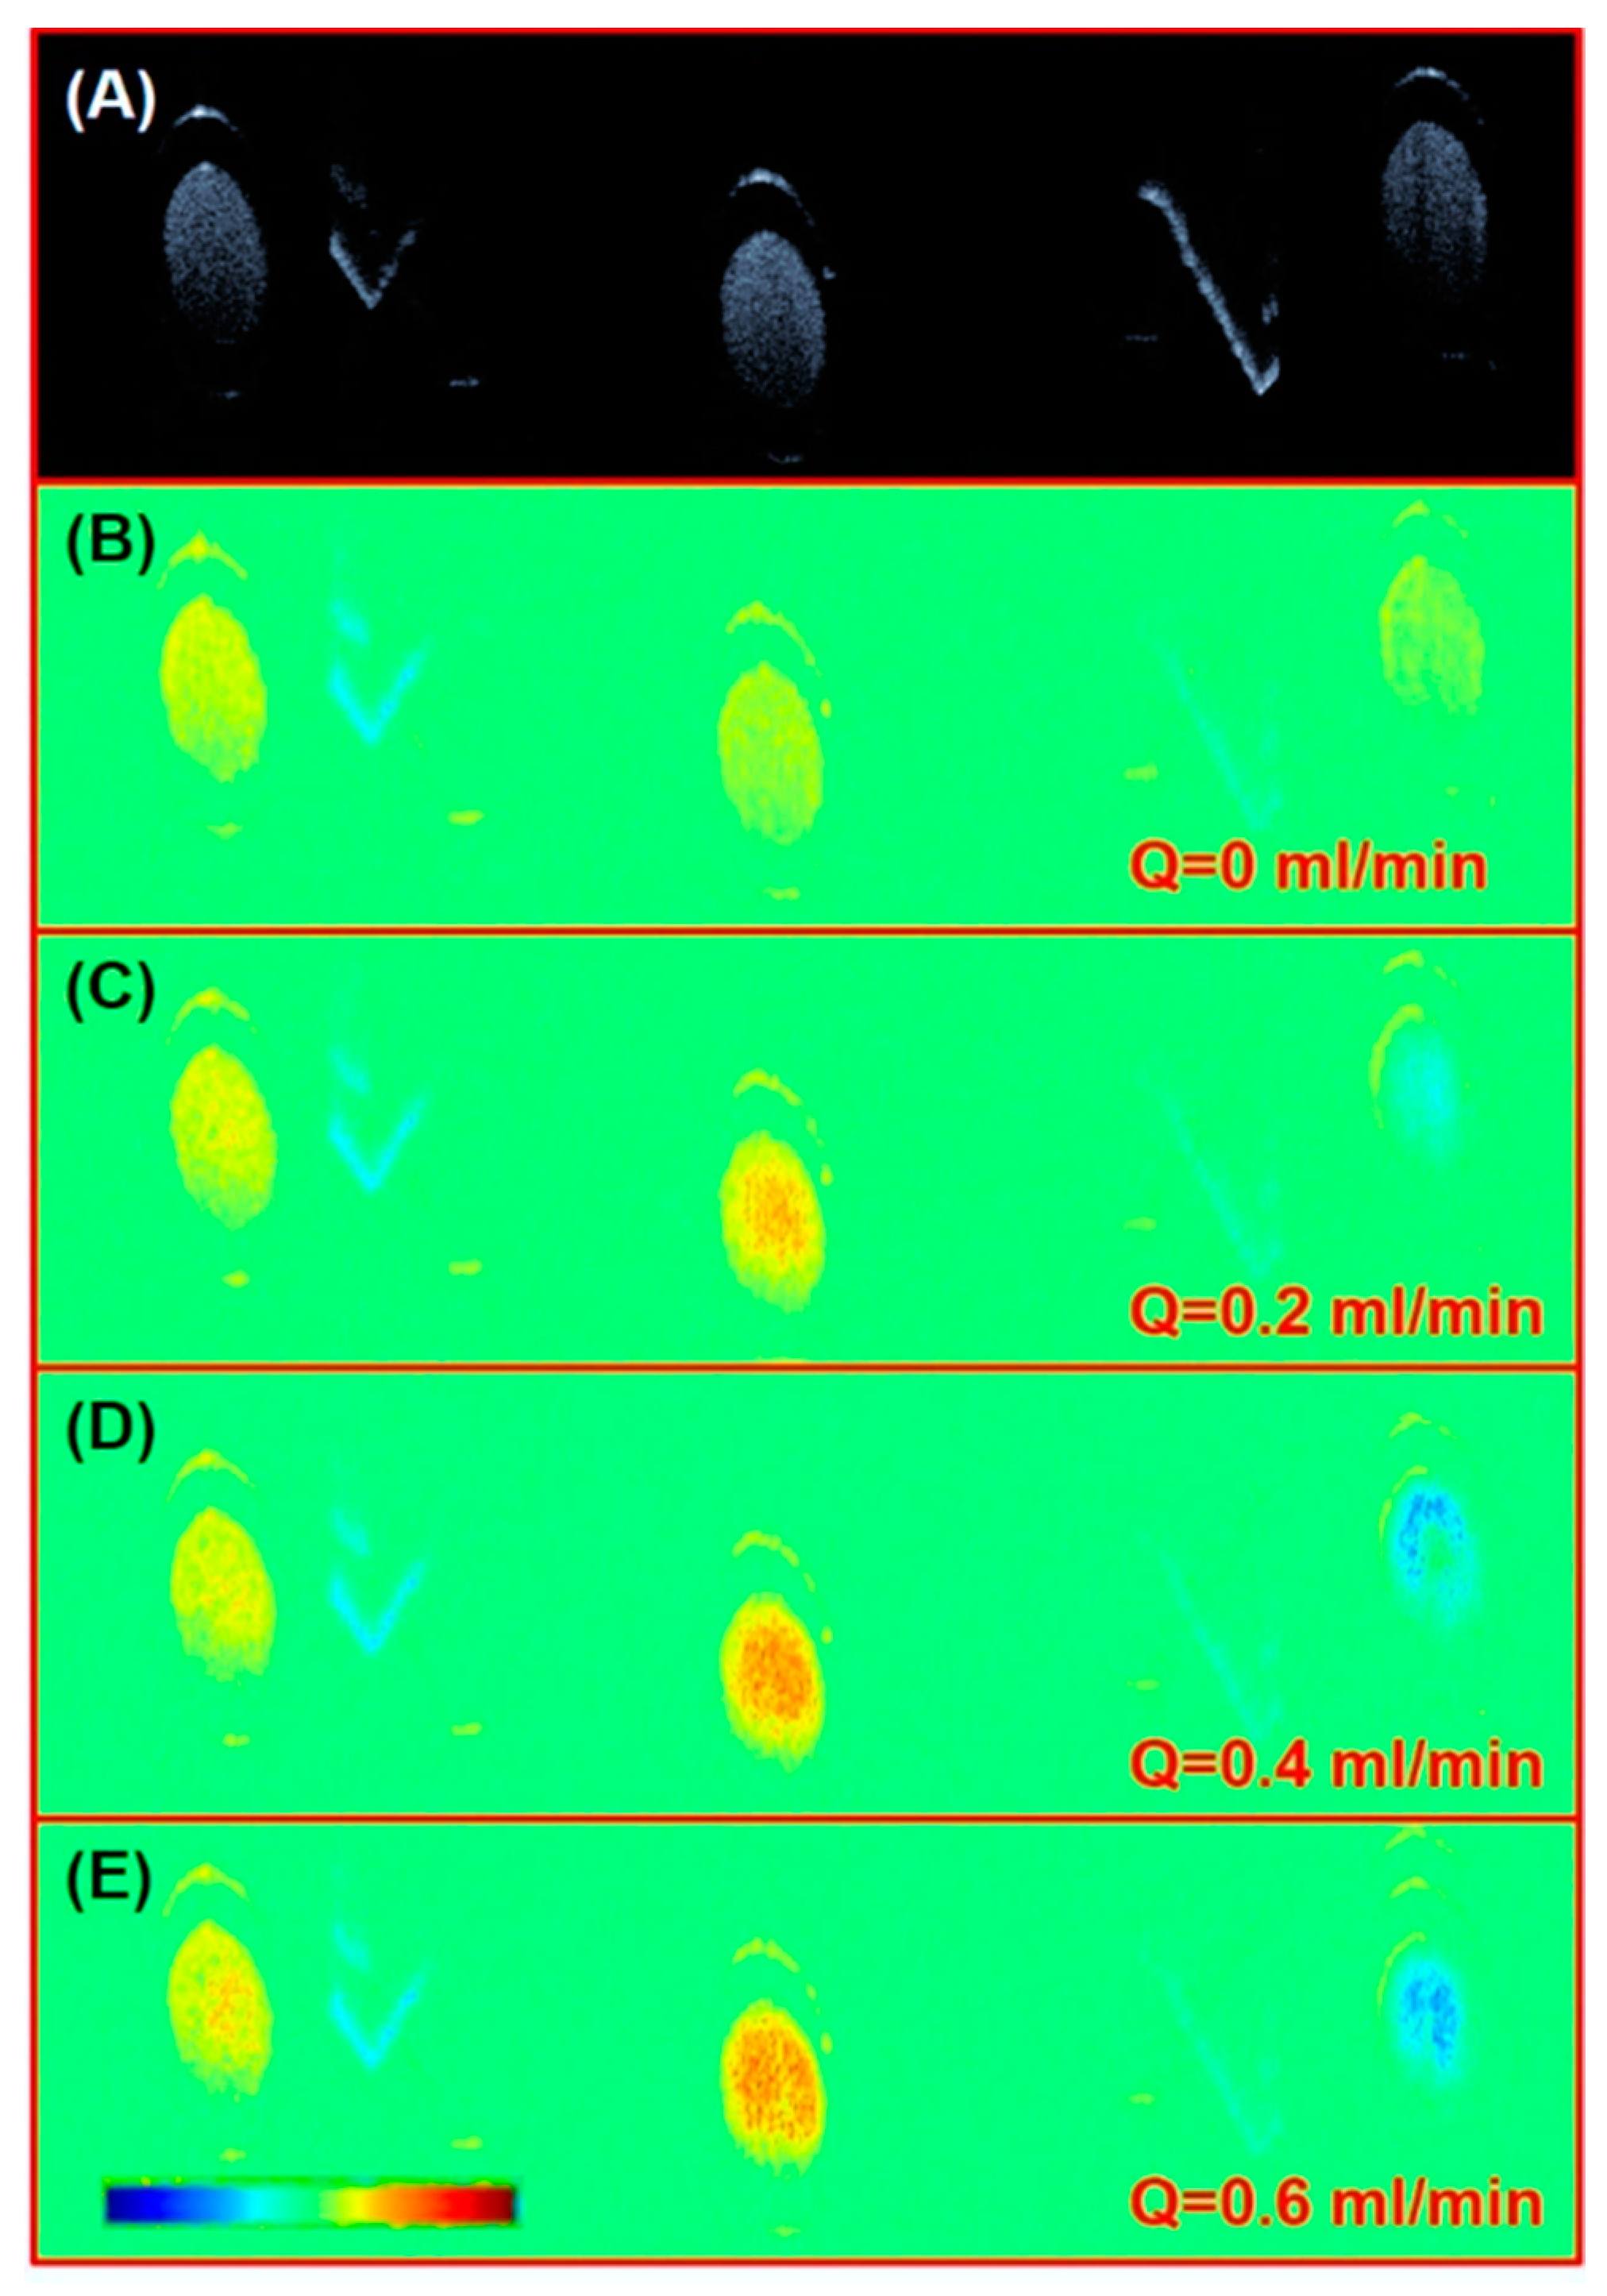
3.2. Rat Femoral Artery Imaging

We further evaluated our cooperative three-view imaging method for in vivo rat femoral artery inspection. A segment of the femoral artery was exposed and placed on the micro stage for imaging. The top parts of Figure 11A,B show the initial B-mode images of the femoral artery at two different locations. The bottom parts of Figure 11A,B show the vessel after image scale matching and rotation. The average outer diameter of the artery was measured to be 0.9 mm. Due to the strong scattering and absorption effect of blood, it is impossible for any single view to resolve the bottom structure of the vessel. As the diameter of the vessel goes up, the problem becomes more severe. However, with cooperative three-view imaging circumferential structure information of the vessel can be obtained within one fast B-mode scan from outer wall to the center. During intraoperative imaging, the thrombosis structure attached to the inner wall of vessel is important to visualize. Extravascular circumferential imaging can help get as much the thrombosis structure information as possible. Since thrombosis grows on the inner vessel wall, in each single view when the vessel is investigated from outside to inside, the vessel wall and thrombosis structure can be visualized before reaching the limited imaging penetration depth. Although the shadowing effect of blood will cause the bottom vessel wall and thrombosis information to be missing in each individual view, part of the missing information can be resolved in the other two complementary views.
Figure 12A shows the en-face image of the vessel imaged. We can clearly see the vessel projections in each view. In addition, utilization of the micro stage for vessel placement during the imaging can effectively remove motion artifacts caused by sample movement in the images. Figure 12B,C show the synthesized whole view cross-sectional image at the blue dashed line and green dashed line, respectively, in Figure 12A. Whole vessel information has been depicted clearly in Figure 12B,C. One thing that needs to be pointed out is that although we tested our method on blood vessel samples, this method holds the potential to be extended to other tubular structures that requires circumferential imaging, such as lymph vessels and nerve fiber tracts when limited penetration depth is an issue.
We have demonstrated the structure imaging capability of our proposed cooperative three-view imaging for both phantom tubes and a rat vessel. On the other hand, flowing imaging is also of interest for intraoperative applications. However, to perform the phase-resolved Doppler imaging, the sampling distance between adjacent A-scans needs to be comparably smaller than the system optical lateral resolution. During previous in vivo imaging experiments, the number of A-scans in a single B-mode image was set at 1000 to achieve a fast imaging frame rate, which made the sampling distance in the lateral direction 12 μm. Since 12 μm was close to the lateral optical resolution, Doppler flow images were not reliable.
We set the number of A-scans in one B-mode image as 4000 to meet the oversampling requirement here to evaluate the Doppler flow imaging capability. Figure 13 shows the simultaneous structure and flow imaging results of a 1.2 mm outer diameter tube with milk flowing inside at pump rates of 0, 0.2, 0.4, and 0.6 mL/min, respectively. Please note that images are cropped here to show areas of interest. We can see clearly that when the pump rate was increased, the Doppler signals got stronger in each view. In addition, we can see the parabolic speed distribution profile within the inner lumen of the tube. Ideally, left and right view Doppler signals should have the same magnitude but opposite directions as their Doppler angles are complementary. However, during the fabrication and assembling process small folding mirror deviation from ideal position will cause a Doppler angle mismatch. That is why Figure 13 Doppler speed magnitudes for the left and right view are different. Based on the results of tube flow imaging, we can decrease the sampling distance to perform flow imaging of the vessel. In that case, the imaging frame rate will be reduced.

4. Discussion

We have demonstrated a novel cooperative three-view imaging SDOCT system with a 3 mm × 3 mm rectangle scanning FOV. Both the phantom tube and in vivo rat femoral artery imaging clearly demonstrate the effectiveness of cooperative three-view imaging with a larger synthetic FOV in resolving tubular structures. We believe the intraoperative application of this cooperative three-view imaging system will greatly benefit the objective evaluation of vascular anastomosis procedures. As for the future work, we will develop a handheld probe based on a compact MEMS mirror that is more user-friendly for intraoperative applications. Secondly, an efficient and fast image registration algorithm to meet the real-time application demand is necessary.

Author Contributions

Conceptualization, Y.H.; Data curation, S.P., Y.J., C.W. and Y.H.; Funding acquisition, D.A., J.Y., Y.W. and Y.H.; Investigation, S.P., Y.J., K.Z. and Y.H.; Methodology, Y.H.; Project administration, Y.H.; Resources, D.A., J.Y. and Y.W.; Supervision, J.Y. and Y.W.; Visualization, D.A.; Writing—original draft, S.P. and Y.H.; Writing—review & editing, K.Z., C.W. and Y.H.

Funding

This research was funded by the National Key Research & Development Program of China, grant number [2017YFC0107900], National Natural Science Foundation of China, grant number (61505006, 61527827, 61672099, and 81627803) and Beijing Institute of Technology Science and Technology Innovation Program under Central Special Funds of China for Science and Technology Development.

Acknowledgments

The authors acknowledge help from Bin Hou from Institute of Automation, Chinese Academy of Sciences for the animal experiment.

Conflicts of Interest

The authors declare no conflict of interest.

References

  1. Rothwell, A. Alexis Carrel: Innovator extraordinaire. J. Perioper. Pract. 2011, 21, 73–76. [Google Scholar] [CrossRef] [PubMed]
  2. Huang, Y.; Tong, D.; Zhu, S.; Wu, L.; Mao, Q.; Ibrahim, Z.; Lee, W.P.; Brandacher, G.; Kang, J.U. Evaluation of microvascular anastomosis using real-time, ultra-high-resolution, Fourier domain Doppler optical coherence tomography. Plast. Reconstr. Surg. 2015, 135, 711e–720e. [Google Scholar] [CrossRef] [PubMed]
  3. Hovius, S.E.; van Adrichem, L.N.; Mulder, H.D.; van Strik, R.; van der Meulen, J.C. The predictive value of the laser Doppler flowmeter for posteroperative microvascular monitoring. Ann. Plast. Surg. 1993, 31, 307–312. [Google Scholar] [CrossRef] [PubMed]
  4. Swartz, W.M.; Izquierdo, R.; Miller, M.J. Implantable venous Doppler microvascular monitoring: Laboratory investigation and clinical results. Plast. Reconstr. Surg. 1994, 93, 152–163. [Google Scholar] [CrossRef] [PubMed]
  5. Selber, J.C.; Garvey, P.B.; Clemens, M.W.; Chang, E.I.; Zhang, H.; Hanasono, M.M. A prospective study of Transit-Time flow volume measurement for intraoperative evaluation and optimization of free flaps. Plast. Reconstr. Surg. 2013, 131, 270–281. [Google Scholar] [CrossRef] [PubMed]
  6. Drexler, W.; Fuijmoto, J.G. Optical Coherence Tomography: Technology and Applications, 1st ed.; Springer: Midtown Manhattan, NY, USA, 2008; pp. 5–51. ISBN 978-3-540-77549-2. [Google Scholar]
  7. Liu, M.; Chen, Z.; Zabihian, B.; Sinz, C.; Zhang, E.; Beard, P.C.; Ginner, L.; Hoover, E.; Minneman, M.P.; Leitgeb, R.A.; et al. Combined multi-modal photoacoustic tomography, optical coherence tomography (OCT) and OCT angiography system with an articulated probe for in vivo human skin structure and vasculature imaging. Biomed. Opt. Express 2016, 7, 3390–3402. [Google Scholar] [CrossRef] [PubMed]
  8. Chong, S.P.; Merkle, C.W.; Cooke, D.F.; Zhang, T.; Radhakrishnn, H.; Krubitzer, L.; Srinivasan, V.J. Noninvasive, in vivo imaging of subcortical mouse brain regions with 1.7 μm optical coherence tomography. Opt. Lett. 2015, 40, 4911–4914. [Google Scholar] [CrossRef] [PubMed]
  9. Bhaduri, B.; Nolan, R.M.; Shelton, R.L.; Pilutti, L.A.; Motl, R.W.; Moss, H.E.; Pula, J.H.; Boppart, S.A. Detection of retinal blood vessel changes in multiple sclerosis with optical coherence tomography. Biomed. Opt. Express 2016, 7, 2321–2330. [Google Scholar] [CrossRef] [PubMed]
  10. Ginner, L.; Schmoll, T.; Kumar, A.; Salas, M.; Pricoupenko, N.; Wurster, L.M.; Leitgeb, R.A. Holographic line field en-face OCT with digital adaptive optics in the retina in vivo. Biomed. Opt. Express 2018, 9, 472–485. [Google Scholar] [CrossRef] [PubMed]
  11. Liang, K.C.; Traverso, G.; Lee, H.C.; Ahsen, O.O.; Wang, Z.; Potsaid, B.; Giacomelli, M.; Jayaraman, V.; Barman, R.; Cable, A.; et al. Ultrahigh speed en face OTC capsule for endoscopic imaging. Biomed. Opt. Express 2015, 6, 1146–1163. [Google Scholar] [CrossRef] [PubMed]
  12. Felberer, F.; Rechenmacher, M.; Haindl, R.; Baumann, B.; Hitzenberger, C.K.; Pircher, M. Imaging of retinal vasculature using adaptive optics SLO/OCT. Biomed. Opt. Express 2015, 6, 1407–1418. [Google Scholar] [CrossRef] [PubMed]
  13. Yabushita, H.; Bouma, B.E.; Houser, S.L.; Aretz, H.T.; Jang, I.K.; Schlendorf, K.H.; Kauffman, C.R.; Shishkov, M.; Kang, D.H.; Halpern, E.F.; et al. Characterization of human atherosclerosis by optical coherence tomography. Circulation 2002, 106, 1640–1645. [Google Scholar] [CrossRef] [PubMed]
  14. Chen, Z.; Milner, T.E.; Srinivas, S.; Wang, X.; Malekafzali, A.; van Gemert, M.J.; Nelson, J.S. Noninvasive imaging of in vivo blood flow velocity using optical Doppler tomography. Opt. Lett. 1997, 22, 1119–1121. [Google Scholar] [CrossRef] [PubMed]
  15. Byers, R.A.; Fisher, M.; Brown, N.J.; Tozer, G.M.; Matcher, S.J. Vascular patterning of subcutaneous mouse fibrosarcomas expressing individual VEGF isoforms can be differentiated using angiographic optical coherence tomography. Biomed. Opt. Express 2017, 8, 4551–4567. [Google Scholar] [CrossRef] [PubMed] [Green Version]
  16. Prakash, A.; Hewko, M.; Sowa, M.; Sherif, S. Texture based segmentation method to detect atherosclerotic plaque from optical tomography images. In Proceedings of the European Conference on Biomedical Optics, Munich, Germany, 12–16 May 2013. SPIE 8802. [Google Scholar] [CrossRef]
  17. Wicks, R.T.; Huang, Y.; Zhang, K.; Zhao, M.; Tyler, B.M.; Suk, I.; Hwang, L.; Ruzevick, J.; Jallo, G.; Brem, H.; et al. Extravascular Optical Coherence Tomography. Stroke 2014, 45, 1123–1130. [Google Scholar] [CrossRef] [PubMed]
  18. Huang, Y.; Ibrahim, Z.; Tong, D.; Zhu, S.; Mao, Q.; Pang, J.; Lee, W.P.A.; Brandacher, G.; Kang, J.U. Microvascular anastomosis guidance and evaluation using real-time three-dimensional Fourier-domain Doppler optical coherence tomography. J. Biomed. Opt. 2013, 18, 111404. [Google Scholar] [CrossRef] [PubMed]
  19. Huang, Y.; Furtmüller, G.J.; Tong, D.; Zhu, S.; Lee, W.P.; Brandacher, G.; Kang, J.U. MEMS-Based Handheld Fourier Domain Doppler Optical Coherence Tomography for Intraoperative Microvascular Anastomosis Imaging. PLoS ONE. 2014, 9, e114215. [Google Scholar] [CrossRef] [PubMed]
  20. Malmström, M. Multi-Angle Oblique Optical Coherence Tomography; Lund University: Lund, Sweden, 2008. [Google Scholar]
  21. Wu, C.; Le, H.; Ran, S.; Singh, M.; Larina, I.V.; Mayerich, D.; Dickinson, M.E.; Larin, K.V. Comparison and combination of rotational imaging optical coherence tomography and selective plane illumination microscopy for embryonic study. Biomed. Opt. Express 2017, 8, 4629–4639. [Google Scholar] [CrossRef] [PubMed]
  22. Song, S.Z.; Xu, J.J.; Wang, R.K. Long-range and wide field of view optical coherence tomography for in vivo 3D imaging of large volume object based on akinetic programmable swept source. Biomed. Opt. Express 2016, 7, 4734–4748. [Google Scholar] [CrossRef] [PubMed]
Figure 1. The principle of cooperative three-view imaging. The initial lateral scanning range is L, and the synthetic FOV height and width is a and b respectively. Two focal planes (FP1 and FP2) are shifted to be H apart. Two 45° oriented folding mirrors (M1 and M2) are used to deflect the scanning beam to form the left and right view.
Applsci 08 01551 g001
Figure 2. Design of three-view cooperative imaging optics. (A) Optical layout simulated by Zemax and the red arrow indicates the scanning view from three directions. (B) A wedge waveplate for OPL compensation. (C) A rear cylindrical waveplate with rectangular central hollow for focal plane separation.
Applsci 08 01551 g002
Figure 3. Focused spots of the left view (LV), central view (CV) and right view (RV)of the scanning line on the focal plane for different slow-axis scanning angles. Color spots represent the scanning focus spots and the dashed red line is a reference line.
Applsci 08 01551 g003
Figure 4. Spot diagrams of the sample arm on the image plane spanning a 12.8° X-FOV and a 2.4° Y-FOV for 1260 nm (blue), 1310 nm (green) and 1360 nm (red) light.
Applsci 08 01551 g004
Figure 5. Mechanical design of the holder in sample arm. (A) Photorealistic rendering of the fully assembled kits, 1—lens tube, 2—adjustable ring, 3—scanning head, 4—mirror mounted spacer (B) Cross-sectional view of the tube (C) Picture of the manufactured holder in system (D) Micro stage for vessel placement.
Applsci 08 01551 g005
Figure 6. SDOCT system setup. SLD: super luminescent diode, PC: polarization controller, DAQ: data acquisition card.
Applsci 08 01551 g006
Figure 7. Typical B-mode image from cooperative three-view imaging and its operation to place three individual view into correct physical position. Left, right and central view image are marked out by red, yellow and blue boxes respectively.
Applsci 08 01551 g007
Figure 8. Cooperative three-view imaging of phantom tubes with different outer diameters (A) 1 mm, (B) 2 mm, and (C) 2.5 mm, respectively.
Applsci 08 01551 g008
Figure 9. Results of horizontal and lateral scale matching for B-mode images of a 1.8 mm outer diameter tube at four different positions (AD). Red dashed rectangles mark the regions that are selected and processed.
Applsci 08 01551 g009
Figure 10. (A) en-face OCT image of a diameter of 1.8 mm tube; (BE) show the results of image registration based the pixel weighted averaging algorithm.
Applsci 08 01551 g010
Figure 11. Cross-sectional structure images of rat femoral artery at two different positions (A) and (B).
Applsci 08 01551 g011
Figure 12. (A) en-face OCT image of the rat femoral artery with a diameter of 0.9 mm; (B) Synthetic image of the blue line position in (A); (C) Synthetic image of the green line position in (A).
Applsci 08 01551 g012
Figure 13. Cooperative three-view structure and flow imaging results of a 1.2 mm outer diameter tube. (A) Structure image, (B) Doppler image with pump off, (C) Doppler image at a pump rate of Q = 0.2 mL/min, (D) Doppler image at a pump rate of Q = 0.4 mL/min, and (E) Doppler image at a pump rate of Q = 0.6 mL/min.
Applsci 08 01551 g013

