Article

Preventive Effect of Lactobacillus Plantarum CQPC10 on Activated Carbon Induced Constipation in Institute of Cancer Research (ICR) Mice

1
Beijing Advanced Innovation Center for Food Nutrition and Human Health, Beijing Technology & Business University (BTBU), Beijing 102488, China
2
Environmental and Quality Inspection College, Chongqing Chemical Industry Vocational College, Chongqing 401228, China
3
Chongqing Collaborative Innovation Center for Functional Food, Chongqing University of Education, Chongqing 400067, China
4
College of Food Science, Southwest University, Chongqing 400715, China
5
Department of Food Science and Biotechnology, Cha University, Seongnam 13488, Gyeongghi-do, Korea
6
Department of Nutrition and Food Hygiene, School of Public Health, Guilin Medical University, Guilin, Guangxi 541004, China
*
Authors to whom correspondence should be addressed.
These authors contributed equally to this work.
Appl. Sci. 2018, 8(9), 1498; https://doi.org/10.3390/app8091498
Submission received: 13 August 2018 / Revised: 26 August 2018 / Accepted: 28 August 2018 / Published: 1 September 2018
(This article belongs to the Section Applied Biosciences and Bioengineering)

Abstract

:
Chinese Paocai is a traditional fermented food containing an abundance of beneficial microorganisms. In this study, the microorganisms in Szechwan Paocai were isolated and identified, and a strain of lactic acid bacteria (Lactobacillus plantarum CQPC10, LP-CQPC10) was found to exert an inhibitory effect on constipation. Microorganisms were isolated and identified via 16S rDNA. Activated carbon was used to induce constipation in a mouse model and the inhibitory effect of LP-CQPC10 on this induced constipation was investigated via both pathological sections and qPCR (quantitative polymerase chain reaction). A strain of Lactobacillus plantarum was identified and named LP-CQPC10. The obtained results showed that, as compared to the control group, LP-CQPC10 significantly inhibited the amount, weight, and water content of faeces. The defecation time of the first tarry stool was significantly shorter in LP-CQPC10 groups than in the control group. The activated carbon progradation rate was significantly higher when compared to the control group and the effectiveness was improved. LP-CQPC10 increased the serum levels of MTL (motilin), Gas (gastrin), ET (endothelin), AchE (acetylcholinesterase), SP (substance P), and VIP (vasoactive intestinal peptide), while decreasing the SS (somatostatin) level. Furthermore, it improved the GSH (glutathione) level and decreased the MPO (myeloperoxidase), MDA (malondialdehyde), and NO (nitric oxide) levels. The results of qPCR indicated that LP-CQPC10 significantly up-regulated the mRNA expression levels of c-Kit, SCF (stem cell factor), GDNF (glial cell-derived neurotrophic factor), eNOS (endothelial nitric oxide synthase), nNOS (neuronal nitric oxide synthase), and AQP3 (aquaporin-3), while down-regulating the expression levels of TRPV1 (transient receptor potential cation channel subfamily V member 1), iNOS (inducible nitric oxide synthase), and AQP9 (aquaporin-9). LP-CQPC10 showed a good inhibitory effect on experimentally induced constipation, and the obtained effectiveness is superior to that of Lactobacillus bulgaricus, indicating the better probiotic potential of this strain.

1. Introduction

The preparation of Sichuan Paocai (fermented Chinese cabbage) follows a number of steps: fresh vegetables are washed and sealed in a jar for anaerobic fermentation in salt water [1]. Salt water plays a very important role for the exudation of vegetable juice and the soluble components are metabolized by lactic acid bacteria (saccharides and nitrogen substance). Acidic substances are generated and flavor components are metabolized, causing the unique crispy taste of Paocai [2]. An abundance of natural lactic acid bacteria can be found in Paocai, which play a central role in the formation of both flavor and quality [3]. Several lactic acid bacteria are also used as probiotics with a number of excellent health benefits for humans, including the prevention of constipation, colitis, liver injury, and diabetes [4,5,6,7]. The difference in the types of lactic acid bacteria is caused by many factors, such as areas, climate, and the method of preparation. To better utilize these microorganisms, methods for isolation and identification should be further developed in order to accumulate these abundant bacterial resources for the development of probiotics. The microorganisms in Sichuan Paocai include Lactobacillus plantarum, Lactobacillus casei, Saccharomyces cerevisiae, and Lactobacillus acidophilus, Brevibacterium spec. [8,9,10]. Several Paocai variations are common in the East Asian region. The lactic acid bacteria in Paocai are good leavening agents and they can be used to ferment food, as well as to prepare functional foods due to their bioactivity. The microorganisms that were used in this study (lactic acid bacteria) were isolated and identified from Sichuan Paocai.
With the exception of probiotics, the intestinal tract contains several harmful bacterial species. Under normal conditions, these are at a state of equilibrium [11]. The probiotics in the intestinal tract participate in the digestion, preventing dyspepsia and digestive tract dysfunction [12]. Mediated by the lactic acid metabolism, lactic acid bacteria can effectively inhibit both the growth and reproduction of harmful bacteria in the gastrointestinal tract and maintain the intestinal ecological balance and normal function. Imbalance within the intestinal lactic acid bacteria is related to chronic diarrhea, constipation, abdominal distension, and dyspepsia [13]. Lactic acid bacteria cannot only activate phagocytosis of macrophages, but they also play an important role in intestinal colonization. Lactic acid bacteria stimulate peritoneal macrophages, induce interferon, promote cell division, generate antibodies, promote cellular immunity, improve both the non-specific and specific immune response, and improve the body's ability to restore tissue damage and malfunction [14,15]. Constipation is a problematic medical condition that manifests as a difficulty to defecate and dryness of faeces [16]. Constipation leads to slow intestinal peristalsis and an increase of harmful bacteria, which cause additional intestinal tract diseases [17]. Lactic acid bacteria have been used to remedy constipation, because they can generate organic acids within the intestinal tract, repair and promote the intestinal function, reduce the pH in the enteric cavity, regulate neuromuscular activity, improve the peristalsis function of the intestinal tract, and promote both digestion and absorption. Moreover, they can effectively inhibit the proliferation of putrefying bacteria in the intestinal tract and improve the intestinal environment, softening the faeces, thus facilitating defecation [18].
Constipation is more of a bad state of life, intestinal regulation by probiotics can effectively prevent constipation, but there are not many probiotics with a better constipation prevention effect, from the traditional fermented food to find more effective strains of bacteria is the focus of current research. In this study, activated carbon influenced the normal physiology of the small intestine, leading to constipation in mice. An inhibitory effect of LP-CQPC10 on constipation was observed, and the mechanism of this effect was investigated with experiments of molecular biology, which provided a theoretical basis for the application of this bacterial strain.

2. Materials and Methods

2.1. Isolation and Identification of Lactic Acid Bacteria

In this experiment, pickled vegetables were collected from naturally fermented pickles that were sold in the market of Nan’an District, Chongqing, China. Paocai water solution (1 mL) was 10-fold diluted with sterile physiological saline to 10−6, and 100 μL of solutions were spread at 10−4, 10−5, and 10−6 on a plate and incubated at 37 °C for 24–48 h. The morphology of bacterial colonies was recorded. Colonies with different morphologies were picked and streaked. After 48 h at 37 °C, a single colony was picked and streaked again, and the step was repeated three times until a single colony with consistent morphology was obtained. The pure colony was seeded with MRS culture medium (5 mL) and cultured at 37 °C for 24 h. 1 mL of the above culture medium containing bacteria was centrifuged at 4000 rpm/min for 10 min. The supernatant was discarded and bacteria were resuspended with sterile physiological saline and then stained. The suspicious purified target strain was seeded into MRS broth. After 18–24 h at 37 °C, DNA (Tiangen Biotech (Beijing) Co., Ltd., Beijing, China) was extracted. 16S rDNA was amplified via polymerase chain reaction (PCR), using 1 μL upstream primer 27F (5′-AGAGTTTGATCCTG GCTCAG-3′, SEQ ID No. 1), 1 μL down-stream primer (Thermo Fisher Scientific, Inc., Waltham, MA, USA) 1495R (5′-CTACGGCTACCTTGTTACGA-3′, SEQ ID No. 2), 12.5 μL 2×Taq plus Buffer, and 1 μL template DNA. The system was filled to 25 μL with sterile ddH2O. Sterile ultrapure water was used to replace template DNA as negative control. Amplification conditions were: 94 °C, 5 min; 94 °C, 30 s; 55 °C, 30 s; 72 °C, 1 min; 29 cycles; finally, 72 °C for 5 min. 5 μL of the amplified product was used for agarose gel electrophoresis (agarose concentration 1.5%, electrophoresis 110 V, 45 min, SimpliAmp Thermal Cycler, Thermo Fisher Scientific, Inc., Waltham, MA, USA). Then, the amplification products of 16S rDNA were sequenced [19]. Meanwhile, the abilities of microorganisms to resist artificial gastric acid and bile salt were detected by Chen’s method [6].

2.2. Animal Experiment

Sixty SPF grade Institute of Cancer Research (ICR) female mice (six weeks old) were purchased from Chongqing Medical University. The mice were raised at room temperature 25 ± 2 °C, relative humidity 50 ± 5%, 12 h day/night cycle, and acclimated for one week. After acclimation, 50 mice were divided into five groups (n = 10): normal group, model group, Lactobacillus bulgaricus (LB) group, Lactobacillus plantarum CQPC10 low concentration group (LP-CQPC10-L) group, and Lactobacillus plantarum CQPC10 high concentration group (LP-CQPC10-H). The experimental cycle was 18 days. Physiological saline was administrated to mice in normal and model groups daily via gavage. Those that were in the LB group were administrated with LB at 1.0 × 10⁹ CFU/kg, and those in LP-CQPC10-L group and LP-CQPC10-H group were administrated with LP-CQPC10 at 1.0 × 10⁸ CFU/kg and 1.0 × 10⁹ CFU/kg, respectively. From Day 15 to 17, except for mice in the normal group, mice were administrated with 10% activated carbon ice water (0.2 mL) via gavage every day. All the mice were weighted every day. The faeces were collected and the fecal moisture content was calculated. At Day 17 after gavage, all the mice were fasted but had free access to water for 24 h. At Day 18, all mice were administrated with 0.2 mL ice water via gavage containing 10% activated carbon. The mice in each group were divided into two groups, the defecation times of the first tarry stool of five mice were observed after the administration of activated carbon ice water. The remaining five mice were sacrificed 30 min after gavage, and their plasma was collected. The small intestine from the pylorus to the ileocecal junction was taken and the length of the small intestine and the forward distance of activated carbon in the small intestine were measured. The progradation rate was calculated following published procedures, progradation rate (%) = length of gastrointestinal (GI) transit (cm)/length of small intestine (cm) × 100% [20]. The protocol for these experiments was approved by the Animal Ethics Committee of Chongqing Medical University in 5 March 2015 and the animal permit number is SYXK (Yu) 2017-0001.

2.3. Detection for Serum MTL, Gas, ET, AchE, SP, and VIP Levels

The plasma was left to settle for 1 h and then centrifuged at 4500 rpm/min for 15 min. The serum levels of MTL, Gas, ET, SS, AChE, SP, and VIP were measured with relevant kits (Nanjing Jiancheng Bioengineering Institute, Nanjing, China).

2.4. Detection of MPO, NO, MDA, and GSH Levels in Small-Intestine Tissue

Small-intestine tissues were homogenized and the levels of MPO, NO, MDA, and GSH were measured with relevant kits (Nanjing Jiancheng Bioengineering Institute, Nanjing, China).

2.5. Histopathology of the Small Intestine

Small intestine tissue with a size of 0.5 cm2 was taken and immediately placed into 10% formalin for 48 h. Tissue samples were dehydrated, cleared via xylene, immersed in wax, embedded, sectioned, and stained via H&E. Their morphology was observed under an optical microscope (BX43, Olympus, Tokyo, Japan).

2.6. Quantitative PCR (qPCR) Assay

The total RNA from the small intestine was extracted while following the instructions of the Trizol kit (Thermo Fisher Scientific, Inc., Waltham, MA, USA). Both the purity and concentration of total RNA were measured via ultramicrospectrophotometer and the RNA concentration was standardized to one level (1 μg/μL). An RNA sample (1 μg/μL) was mixed with 1 μL (oligo) primer dT and 10 μL ultrapure water (Thermo Fisher Scientific, Inc., Waltham, MA, USA) and then mixed at 65 °C for 5 min. Then, the system was MIXED with 1 μL Ribolock RNase Inhibitor, 2 μL 100 mM dNTP mix, 4 μL 5×Reaction buffer, and 1 μL Revert Aid M-mu/v RT, respectively. The whole 20 μL mixture was used to synthesize cDNA at 42 °C for 60 min, and 70 °C for 5 min. The target genes (Table 1, Thermo Fisher Scientific, Inc., Waltham, MA, USA) were reversely transcribed and amplified. The reaction conditions were: 95 °C degeneration for 15 min, 60 °C annealing for 1 h, 95 °C extension for 15 min, for a total of 40 cycles. GAPDH was used as a housekeeping gene and the relative expression level of the target gene was calculated via 2−ΔΔCT method [21].

2.7. Statistical Analysis

The standard deviation was obtained after calculating the data of each group. Then, the significant differences (p < 0.05) between the data of each group were analyzed by one-way ANOVA with Duncan’s multiple range tests, this analysis used the SAS v9.1 statistical software (SAS Institute Inc., Cary, NC, USA).

3. Results

3.1. Isolation and Identification of LP-CQPC10

The lane of the strain shows a band with about 1500 bp (Figure 1), meeting the expectation of amplification fragment length. BLAST (Basic Local Alignment Search Tool) from NCBI was used to compare sequences. The results showed that LF-CQPC10 was lactic acid bacteria with a homology of 99% with Lactobacillus plantarum CQPC10 (LP-CQPC10) (Gene Bank, NC_010610.1).

3.2. Defecation of Mice

In this study, 11 kinds of lactic acid bacteria were found, including five kinds of Lactobacillus plantarum and six kinds of Lactobacillus fermentum. As shown in Table 2, the LP-CQPC10 showed higher survival rates in pH 3.0 artificial gastric juice and 0.3% bile salt. LP-CQPC10 had good anti gastric acid and bile salt effects, and was worthy of further probiotic potential experiments.

3.3. Defecation of Mice

As shown in Table 3, at Day 14, the weight, amount, and water content between groups did not significantly change. After activated carbon caused constipation, except in the mice in the normal group, other mice had significantly reduced defecation amount, weight, and water content. The reduction in the control group was highest, while that in the LF-CQPC010-H group was the lowest. The indices in the LF-CQPC010-L were significantly higher than those in the LB group.

3.4. Defecation Time of the First Black Stool

To evaluate the influence of LF-CQPC10 on the defecation of mice induced by activated carbon, the defecation times of the first black stool were recorded for all mice after the mice received activated carbon via gavage for the last time. As shown in Figure 2, the time in the control group was the longest, which was significantly (p < 0.05) longer than those in the normal group. For the other three groups, although the time was longer than in the normal group, only the model group showed a significant difference (p < 0.05). The defecation time of the first tarry stool in the mice that were administrated with LF-CQPC10-H was significantly shorter than in the group administrated with LF-CQPC10-L and LB.

3.5. Activated Carbon Progradation Rate in the Small Intestine

At 30 min after 10% activated carbon ice water administration via gavage, the mice were sacrificed in order to observe the forward distance of the activated carbon in the small intestine, and thus calculate the progradation rate. As shown in Table 4, the length of the small intestine between each group did not show a significant difference, suggesting that activated carbon modeling does not influence the small intestine length. The progradation rate in the control group was significantly lower than that in the normal group (p < 0.05). The activated carbon progradation rates in mice from LB, LF-CQPC10-L, and LF-CQPC10-H groups were significantly improved as compared to those of the control group (p < 0.05), and the rate of the LF-CQPC10-H group was the closest to that of the normal group. This suggests that LF-CQPC10 could promote small intestine peristalsis, accelerate the forward speed of activated carbon in the small intestine, reduce the detention time in the small intestine, and improve constipation. The concentration was positively correlated to effectiveness.

3.6. Serum MTL, Gas, ET, SS, AchE, SP, and VIP Levels

As shown in Table 5, the serum MTL, Gas, ET, AchE, SP, and VIP levels in mice of the normal group were highest; however, the SS level was the lowest. However, those in the control group follow opposite trends. When compared to the model group, MTL, Gas, ET, Ach E, SP, and VIP levels in the LB, LF-CQPC10-L and LF-CQPC10-H groups are significantly improved (p < 0.05), and the SS level is significantly reduced (p < 0.05), especially in the LF-CQPC10-H group.

3.7. MPO, NO, MDA, and GSH Levels in the Small-Intestine Tissue

The GSH levels in the control group were the lowest, while the levels of MPO, NO, and MDA were the highest (Table 6). However, the normal group showed the contrary trend. LB, LF-CQPC10-L, and LF-CQPC10-H significantly improved the GSH level, while reducing the MPO, NO, and MDA levels in the constipation mice group (p < 0.05). When compared to LB and LF-CQPC10-L, LF-CQPC10-H greatly improved the GSH level and decreased MPO, NO, and MDA levels.

3.8. Morphological Observation of Small-intestine Tissue

As shown in Figure 3, the intestinal villus in the normal group was orderly arranged without rupture or shrinkage; however, the opposite result was found in the control group. Although the intestinal villus in the LB, LF-CQPC10-L, and LF-CQPC10-H groups showed rupture or shrinking to a certain extent, it was still more complete than in the control group. Moreover, the morphology of the intestinal villi in the LF-CQPC10-H group was consistent with that of the normal group.

3.9. mRNA Expression Levels of Cu/Zn-SOD, Mn-SOD, and CAT in Small-Intestine Tissue

As shown in Figure 4, the expression of Cu/Zn-SOD, Mn-SOD, and CAT is the highest in the normal group. After constipation is induced by activated carbon, their expression was significantly reduced (p < 0.05). LB, LF-CQPC10-L, and LF-CQPC10-H significantly up-regulated the expression of Cu/Zn-SOD, Mn-SOD, and CAT (p < 0.05), particularly LF-CQPC10-H.

3.10. mRNA Expression Levels of c-Kit and SCF in Small-Intestine Tissue

As shown in Figure 5, c-Kit and SCF mRNA expression was highest in the normal group. Treatment with lactic acid bacteria up-regulated this expression and the capability of LF-CQPC10-H on the regulation was stronger than that of LB and LF-CQPC10-L.

3.11. mRNA Expression Levels of TRPV1 and GDNF in Small-Intestine Tissue

As shown in Figure 6, GDNF expression in the normal group was strongest, while TRPV1 expression was weakest. After induction of constipation, GDNF expression decreased in the control group, while TRPV1 expression increased. LB, LF-CQPC10-L, and LF-CQPC10-H could all up-regulate the expression of GDNF and down-regulate the expression of TRPV1. Moreover, the LF-CQPC10-H capability of up-regulation and down-regulation was higher than that of LB and LF-CQPC10-L.

3.12. mRNA Expression Levels of nNOS, eNOS, and iNOS in Small-Intestine Tissue

The expression of NOS1 (nNOS) and NOS3 (eNOS) in the normal group was highest, while it was the lowest in NOS2 (iNOS) (Figure 7). After treatment with activated carbon, both nNOS and eNOS expression significantly decreased (p < 0.05), while the iNOS expression significantly increased (p < 0.05). Lactic acid bacteria inhibited the influence of activated carbon on the expression. The influence of LF-CQPC10-H on nNOS and eNOS was stronger than LB and LF-CQPC10-L. However, the effect of LF-CQPC10-H on iNOS expression was lower than in LB and LF-CQPC10-L.

3.13. mRNA Expression Levels of AQP3 and AQP9 in Small-Intestine Tissue

As shown in Figure 8, AQP3 expression was lowest in the normal group, while AQP9 was highest. The expression trend of AQP3 and AQP9 was opposite in the control group. The effect of LF-CQPC10-H on AQP3 and AQP9 was closest to the normal group. AQP3 was significantly lower than in mice that were treated with LB and LF-CQPC10-L (p < 0.05), while AQP9 was significantly higher than in mice treated with LB and LF-CQPC10-L (p < 0.05).

4. Discussion

Constipation can influence normal life and long-term constipation will induce other diseases, eventually severely threatening health [4]. Better colonization of probiotics in the intestines will play a better role in probiotics; Probiotics need to enter more intestines, which required good anti gastric acid and bile salt, the survival rates in pH 3.0 artificial gastric juice and 0.3% bile salt could preliminarily determine whether lactic acid bacteria have probiotic potential [
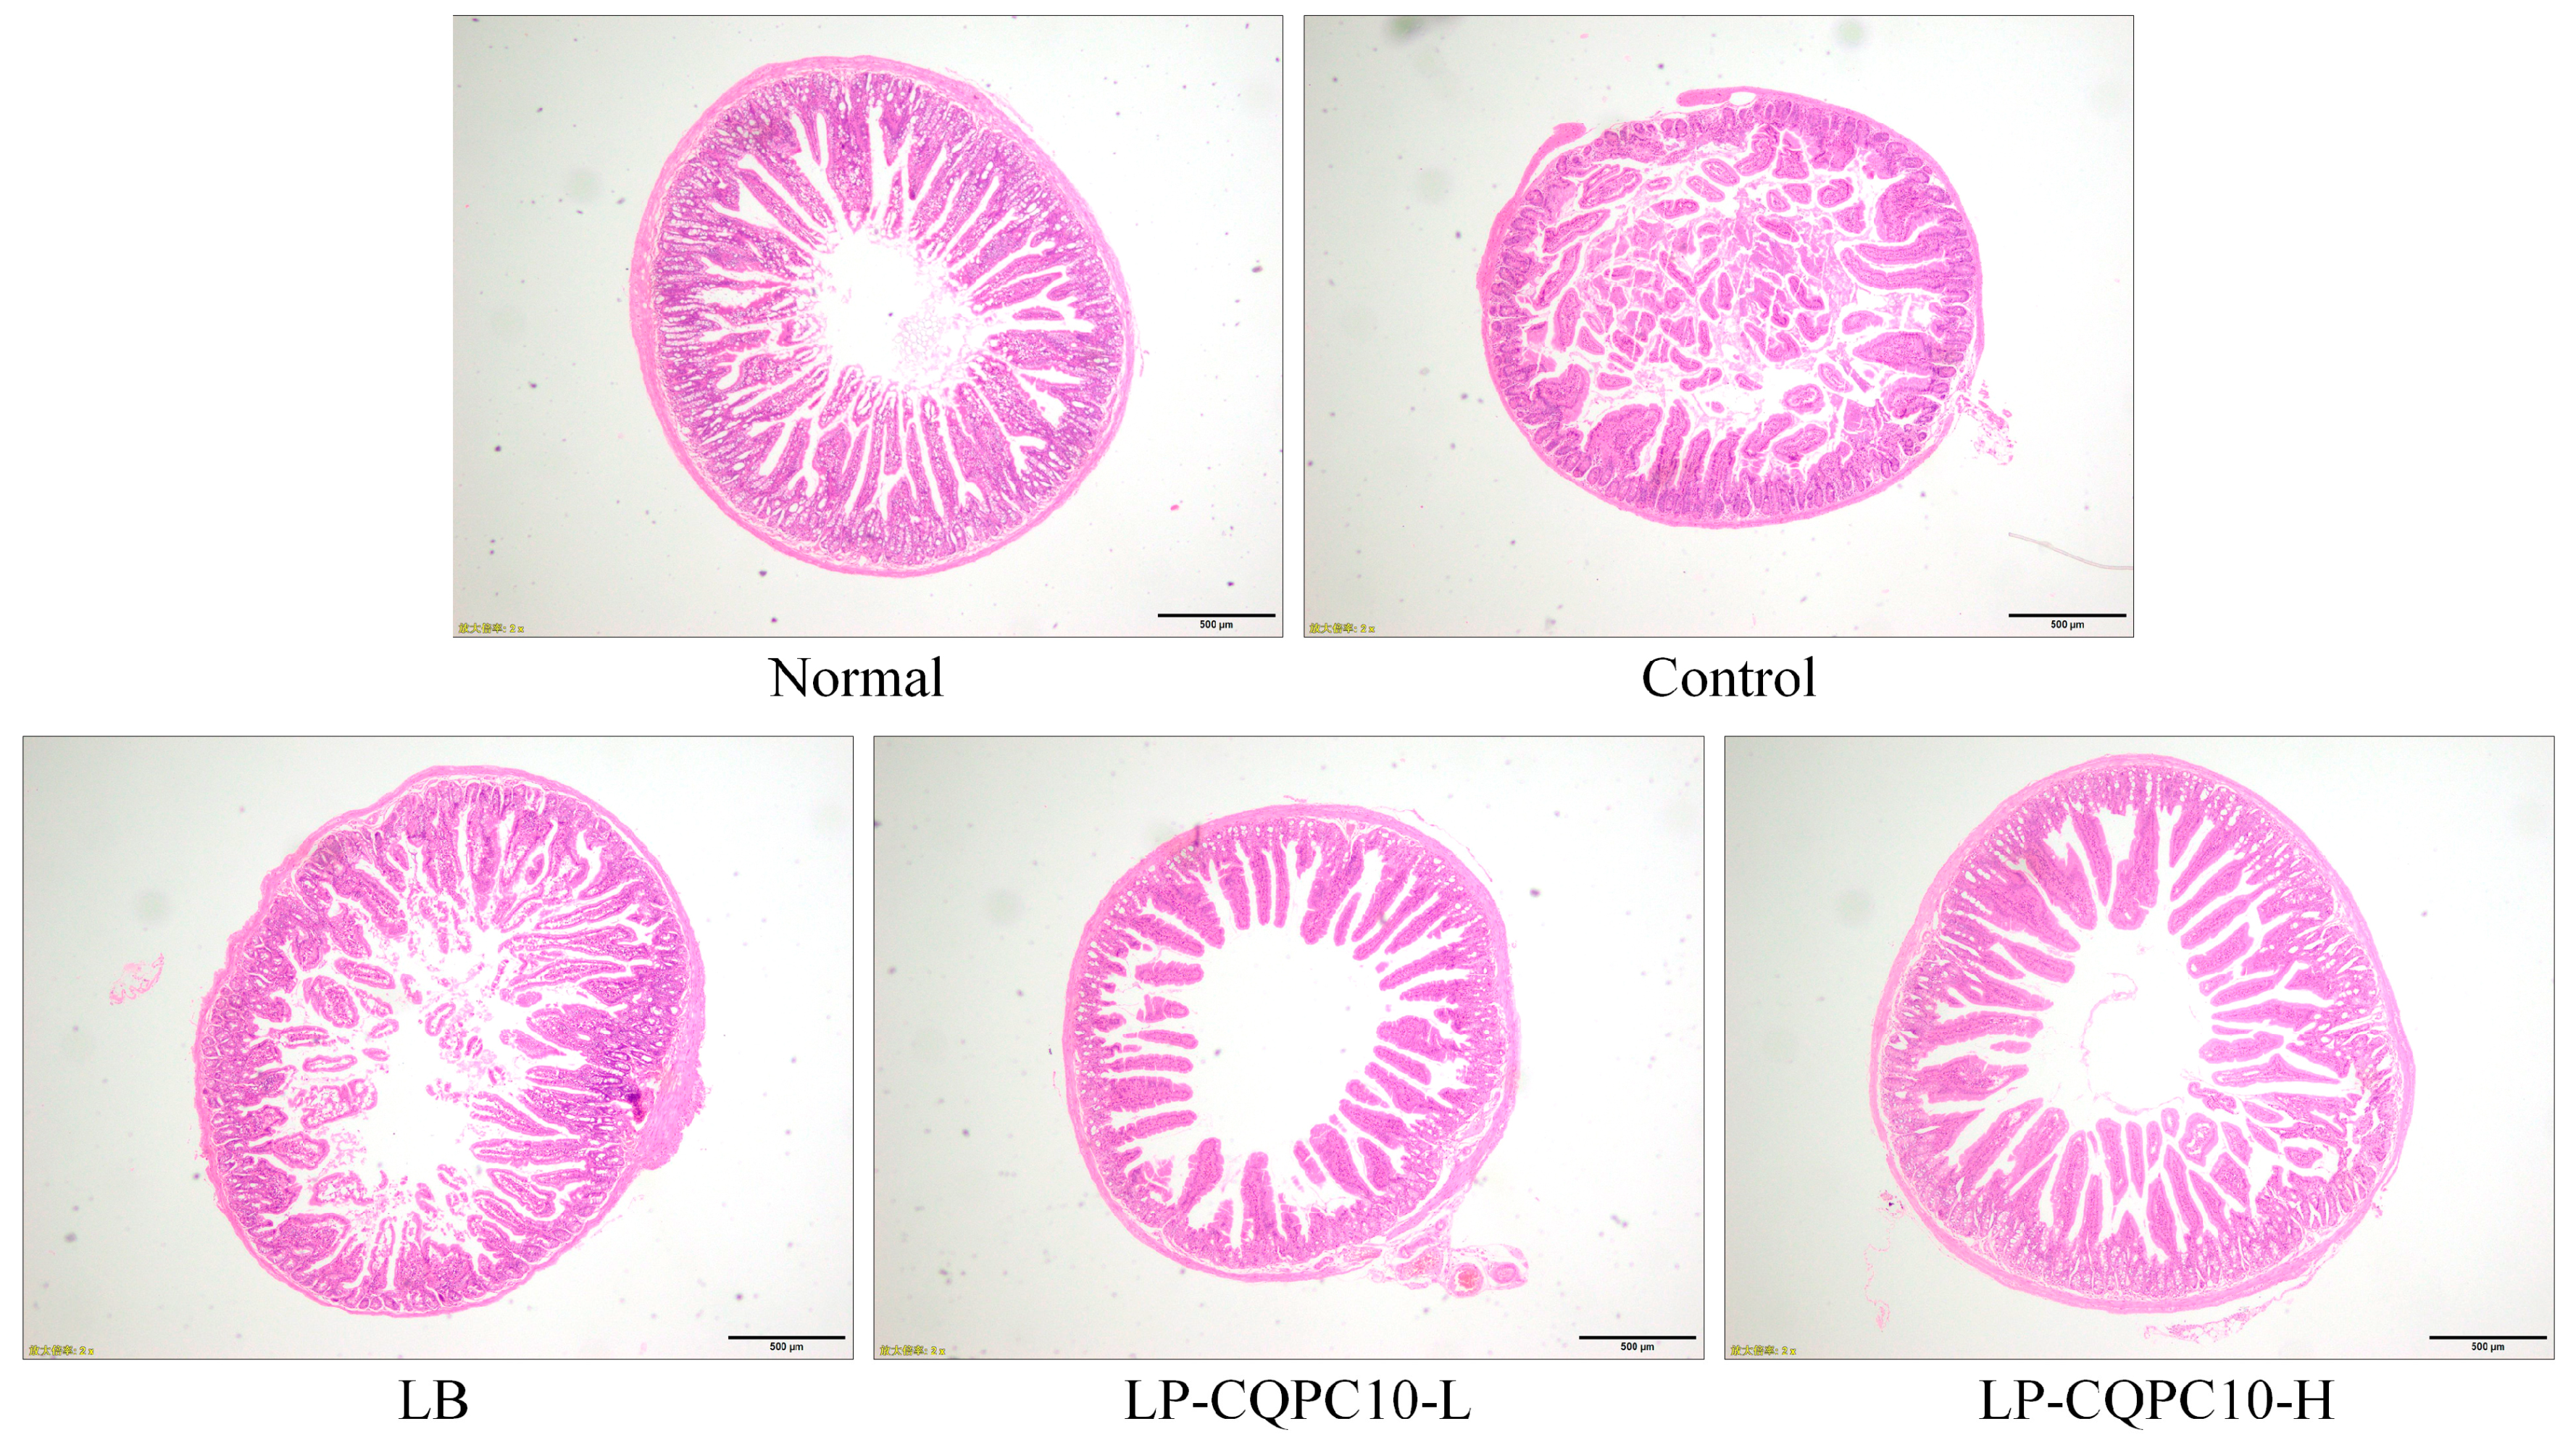
6]. In this study, LP-CQPC10 had the better in vitro anti gastric acid and bile salt than commercial used LB. LP-CQPC10 is a kind of strain that might have potential for probiotics. The level of harmful microorganisms increases in response to constipation and the intestinal wall tissue is injured. When this happens, peristalsis will be negatively influenced. Slow intestinal tract peristalsis is one of the causes of constipation [6]. Thus, the integrity of intestinal villi is very important for the evaluation of constipation, which can be preliminarily judged via pathological observation [17]. In this study, LF-CQPC10 was preliminarily shown to have an inhibitory effect on constipation.
Observation of the faeces status is the most direct method. Constipation can lead to a decrease of the defecation amount, and the faeces are dry [
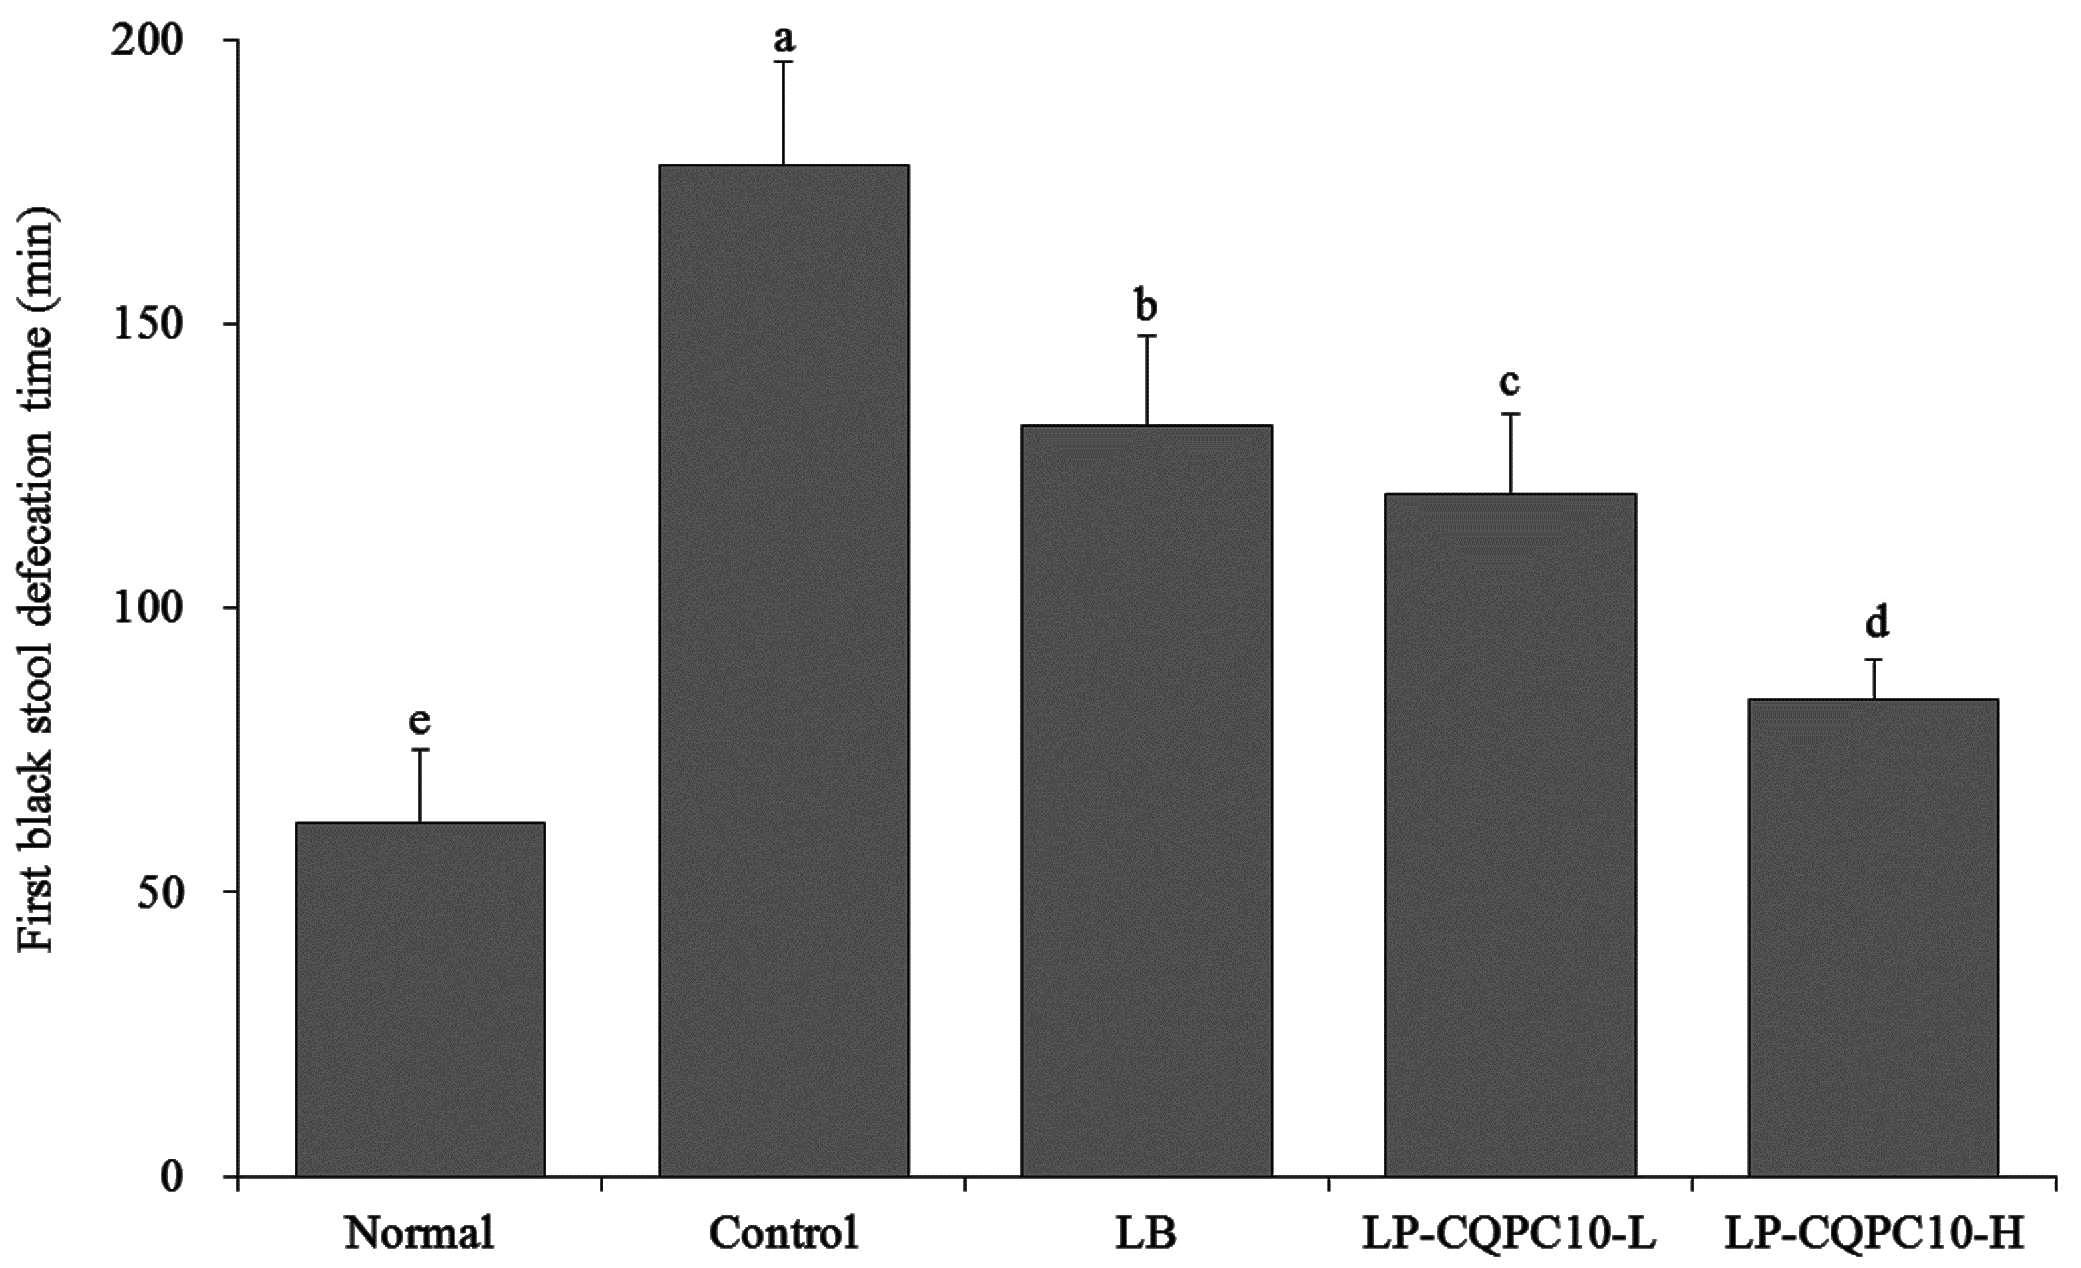
4]. In this study, we found that LF-CQPC10 could significantly remit these effects. The effectiveness was superior to that of the commonly used LB. Furthermore, the defecation time of the first tarry stool was used to evaluate the severity of the resulting constipation. Peristalsis was slowed down and the detention time in the intestinal tract elongated [17]. In this study, the time in the control group was longer than in other groups, and the time in the LF-CQPC10 group was significantly decreased, thus showing constipation remission.
It has been reported that the neurotransmitter level will change in some patients with constipation (such as MTL, Gas, ET, SS, Ach, SP, and VIP). MTL has been used to evaluate gastrointestinal tract peristalsis and it has been widely considered to promote the mobility of the gastrointestinal tract, while decreased release will slow peristalsis [22]. Gas is an important gastrointestinal hormone, which has been shown to promote gastric secretion, improve peristalsis, accelerate gastric emptying, and promote pyloric sphincter relaxation [23]. Currently, AchE has been considered as one of two neurotransmitters that play a very important role in the motility of the intestinal tract. AchE promotes peristalsis by binding to the receptor [24]. SP is an excitatory transmitter in gastrointestinal motor neurons. It greatly promotes the shrinkage of the smooth muscle in the digestive tract, stimulates water and electrolyte secretion in the small intestine and colonic mucosa, and promotes peristalsis [25]. The obtained results indicated that MTL, Gas, AchE, and SP levels in the model group were significantly lower than in the normal group; however, the neurotransmitter levels significantly increased in the LP-CQPC10 group. This suggests that the decrease in these levels was related to the constipation. The increase in the levels by LP-CQPC10 indicated that it could remit the constipation. ET is a multi-functional peptide that plays a very important role in cardiovascular and intestinal tract function. SS can inhibit the release of gastrointestinal hormones, slow down gastric emptying, and reduce smooth muscle contraction, which might cause constipation [26]. VIP is an inhibitory neurotransmitter that stimulates peristalsis and promotes gastrointestinal motility [27]. The SS level was highest in the model group, while it was significantly decreased in the LP-CQPC10 group (p < 0.05), suggesting that LP-CQPC10 could have a preventive effect on constipation.
In the metabolism, superoxide anions (O2) and oxygen radicals participate in physiological reactions in the body. Imbalance will greatly increase O2 and oxygen radicals, which will disorder the metabolism [
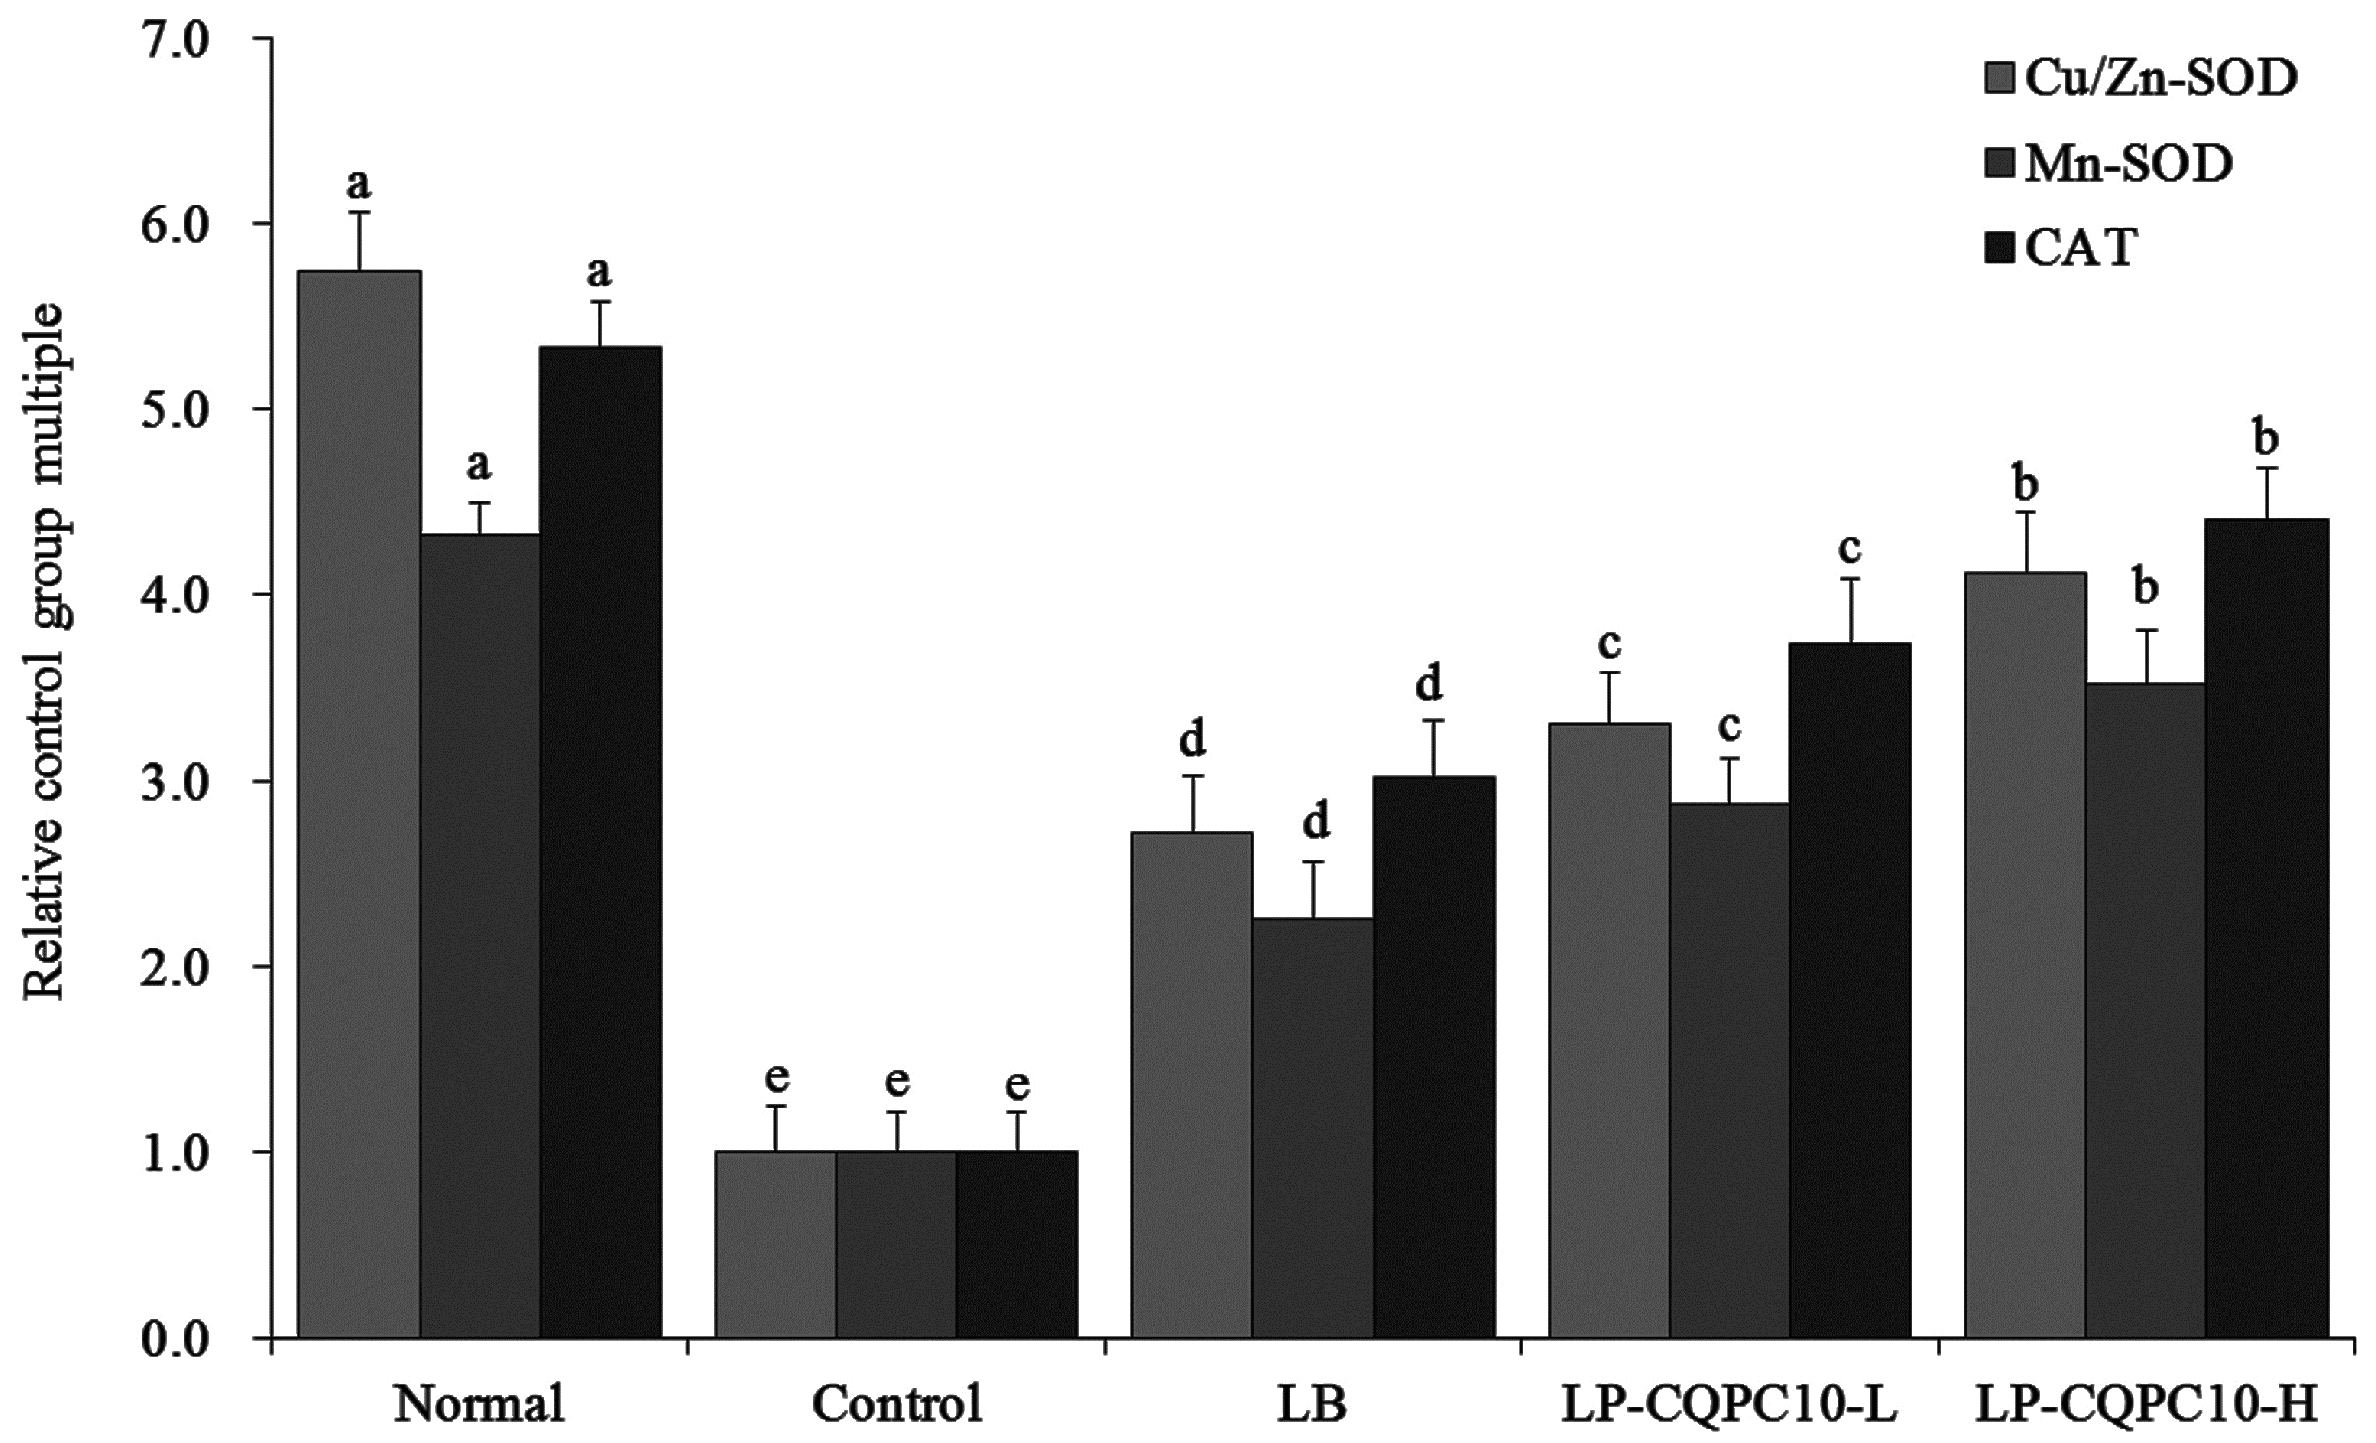
28]. It has been reported that the Cu/Zn-SOD activity in patients with constipation is lower than in normal people. The likely reason is that long-term retention and stimulation of hard faeces causes inflammation in the intestinal tract [29]. Mn-SOD can reduce the activity under inflammation [30]. SOD can transform harmful superoxide radicals into hydrogen peroxide. Although hydrogen peroxide is still harmful to the body, CAT can degrade it into water. SOD and CAT will form into an oxidation resistant chain to remit the damage to the intestinal tract that is caused by constipation [31]. The results of our study indicate that LP-CQPC10 could effectively remit the reduced activity of Cu/Zn-SOD, Mn-SOD, and CAT caused by constipation.
Cajal cells (ICC) are a type of special mesenchymal cells. Colon ICC amount, morphological change, and abnormality of the cellular network structure will slow the peristalsis rate, further leading to slow transit constipation [32]. C-Kit is one of the specific markers for ICC, and SCF is the natural ligand of the C-kit receptor [33]. It has been reported that ICC density in the small intestine of patients with constipation is decreased, indicating that reduced ICC is related to the down-regulation of the c-Kit gene in the sigmoid colon, and reduced c-kit protein and mRNA expression [34]. The results showed that the mRNA expression of both c-Kit and SCF in the LP-CQPC10 group was significantly increased (p < 0.05), suggesting that LP-CQPC10 could increase the ICC amount and thus remit constipation.
TRPV1 is closely related to defecation and activation of TRPV1 could trigger the release of neurotransmitters, thus leading to intestinal motility dysfunction. The increase in TRPV1 expression is an important manifestation of intestinal injury and the damage that is caused by gastrointestinal tract diseases can increase TRPV1 expression in patients with constipation [35]. GDNF regulates ganglion cells and aids the repair of the damaged intestinal tract, while also preventing constipation. Constipation is related to the intestinal nervous system, leading to muscular tension and weak gastrointestinal motility [36]. Regulation of TRPV1 and GDNF expression is one of the important mechanisms to remit constipation. LP-CQPC10 also exerts such an effect of constipation remission.
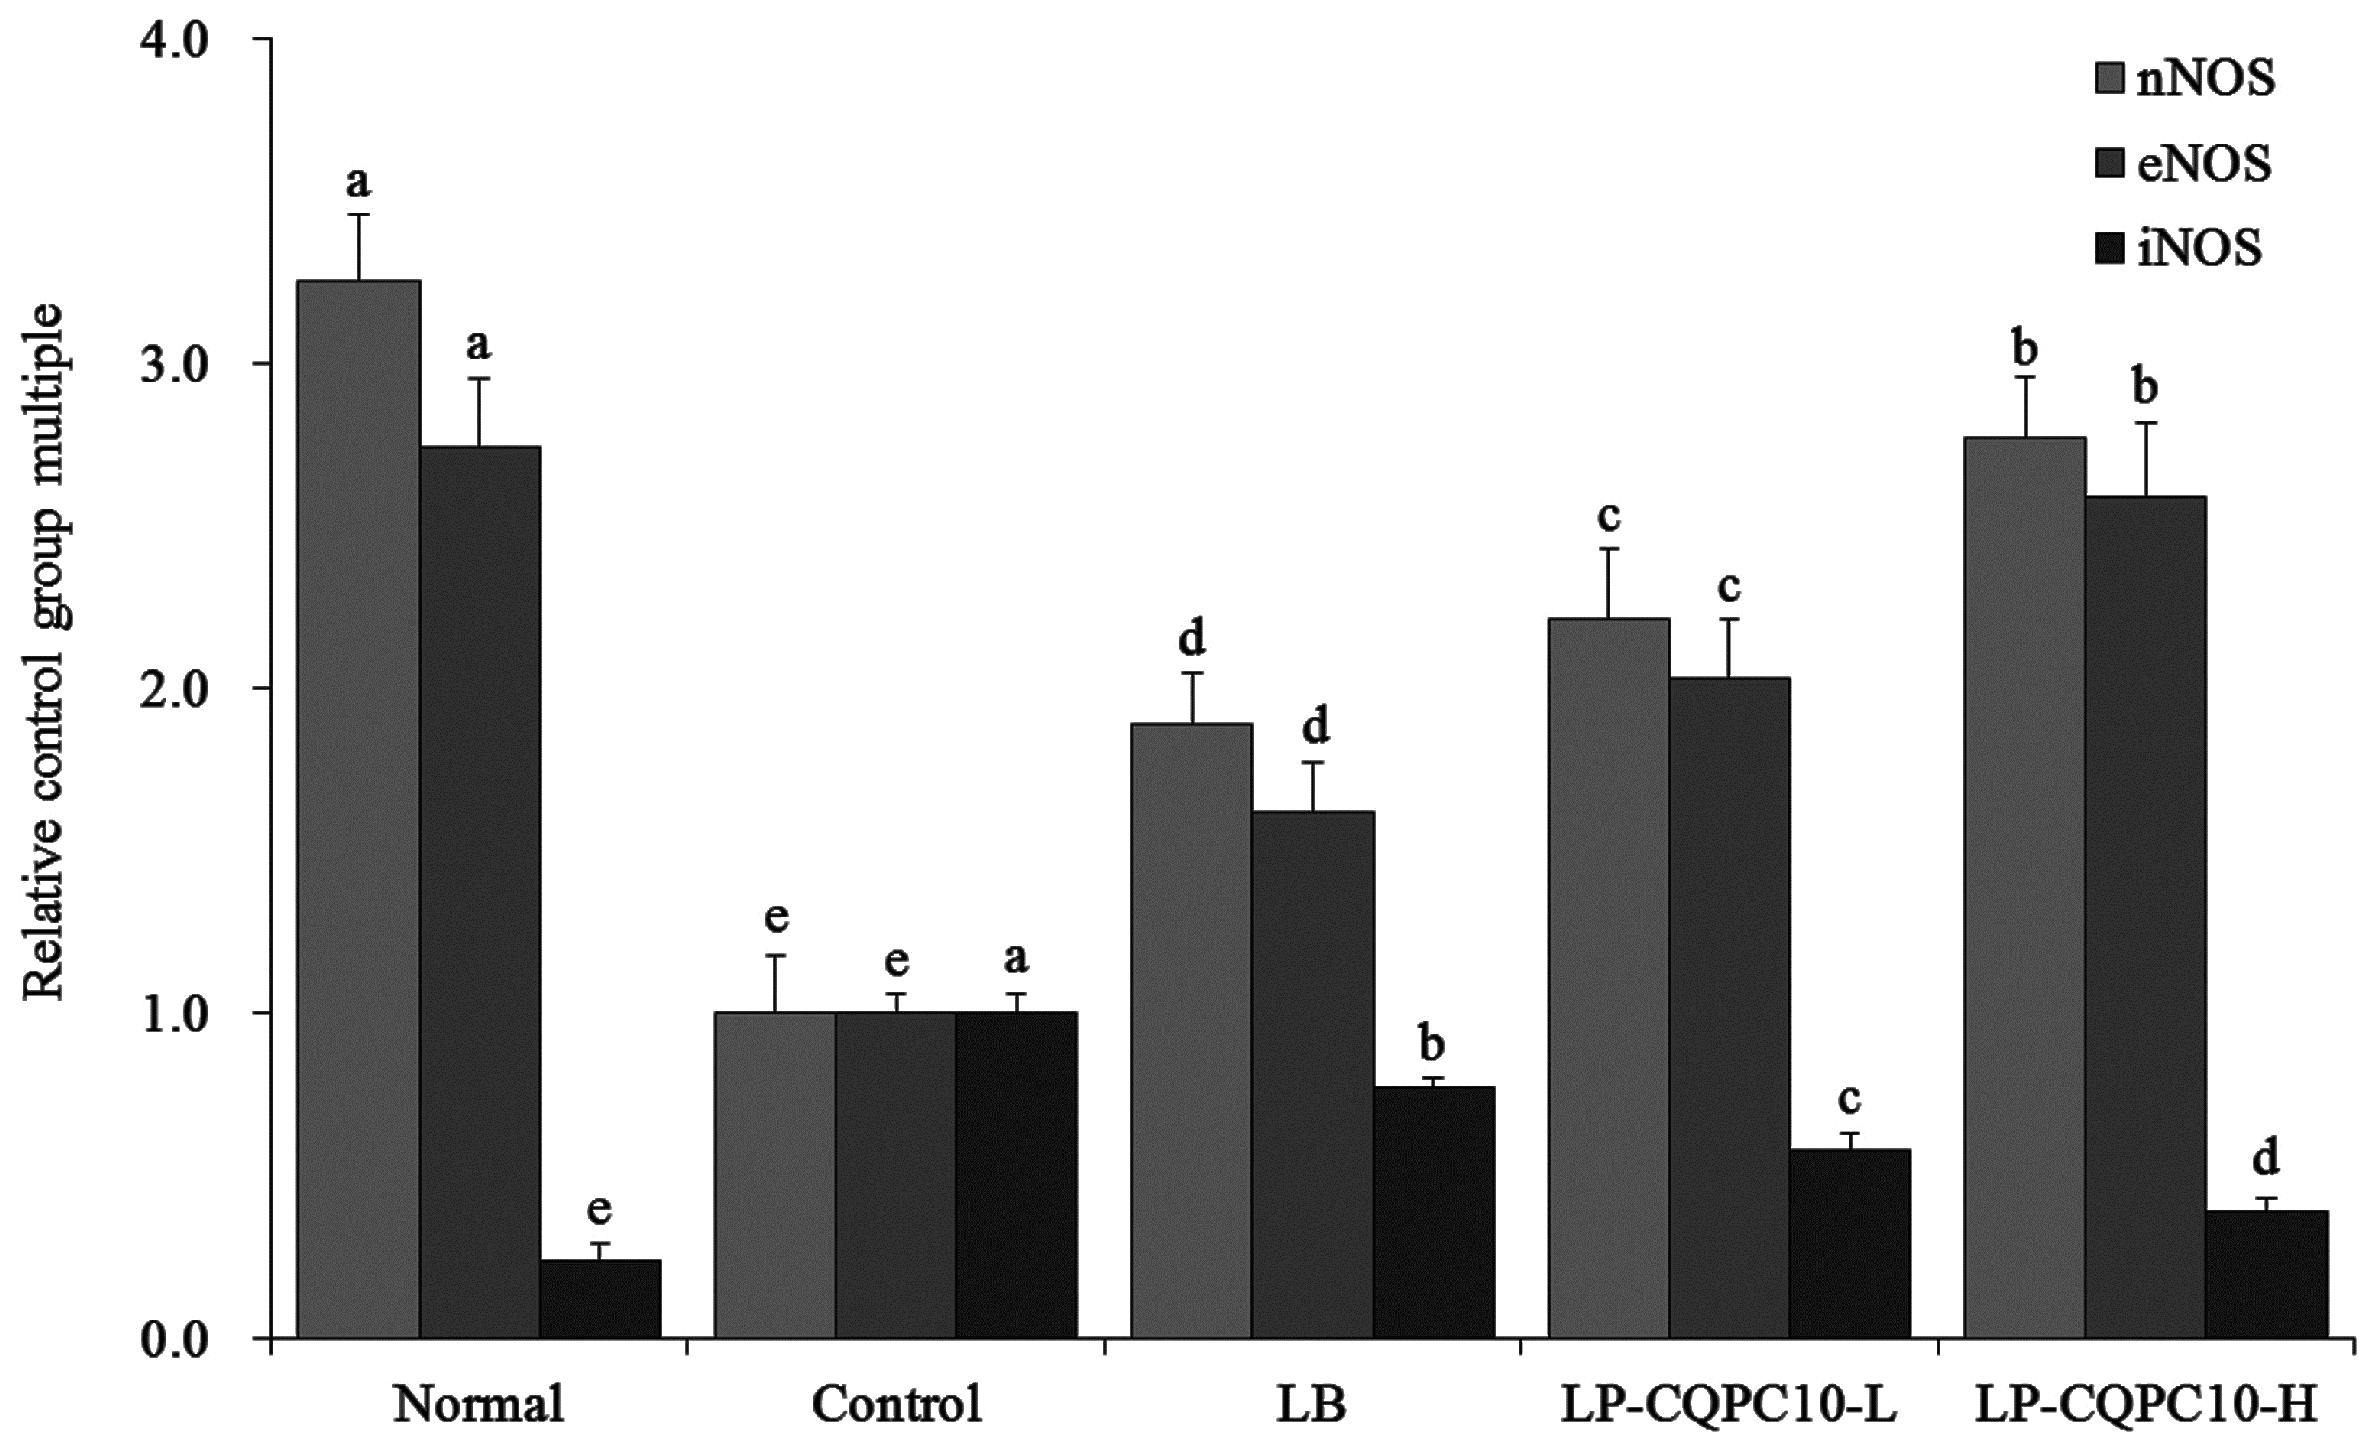
NOS participates in the regulation of gastrointestinal motility. An increase in NOS will lead to an increase in the NO content, influencing intestinal function and leading to constipation [37]. Continuous increase of NO can cause a more severe colonic motility disorder [38]. Endothelial dysfunction can cause constipation and the decrease in NO bioavailability is an important factor for this dysfunction [39]. NO is synthesized via NOS catalysis. Three subtypes for NOS have been described, including NOS1 (nNOS), NOS2 (iNOS), and NOS3 (eNOS) [40]. Under normal physiological conditions, NO in vascular endothelial cells mainly originates from eNOS, whose main effect is the regulation of the normal physiological function [41]. The expression of nNOS is greatly decreased in the small intestine of animals with constipation [42]. iNOS is not expressed under the resting-state, while a high level of iNOS and NO will be generated when the body is injured or under other pathological conditions [43]. A decrease in NO content by controlling NOS is a feasible method to control constipation [42]. Here, we found that LP-CQPC10 could significantly up-regulate the expression of eNOS and nNOS, down-regulate expression of iNOS, and remit constipation.
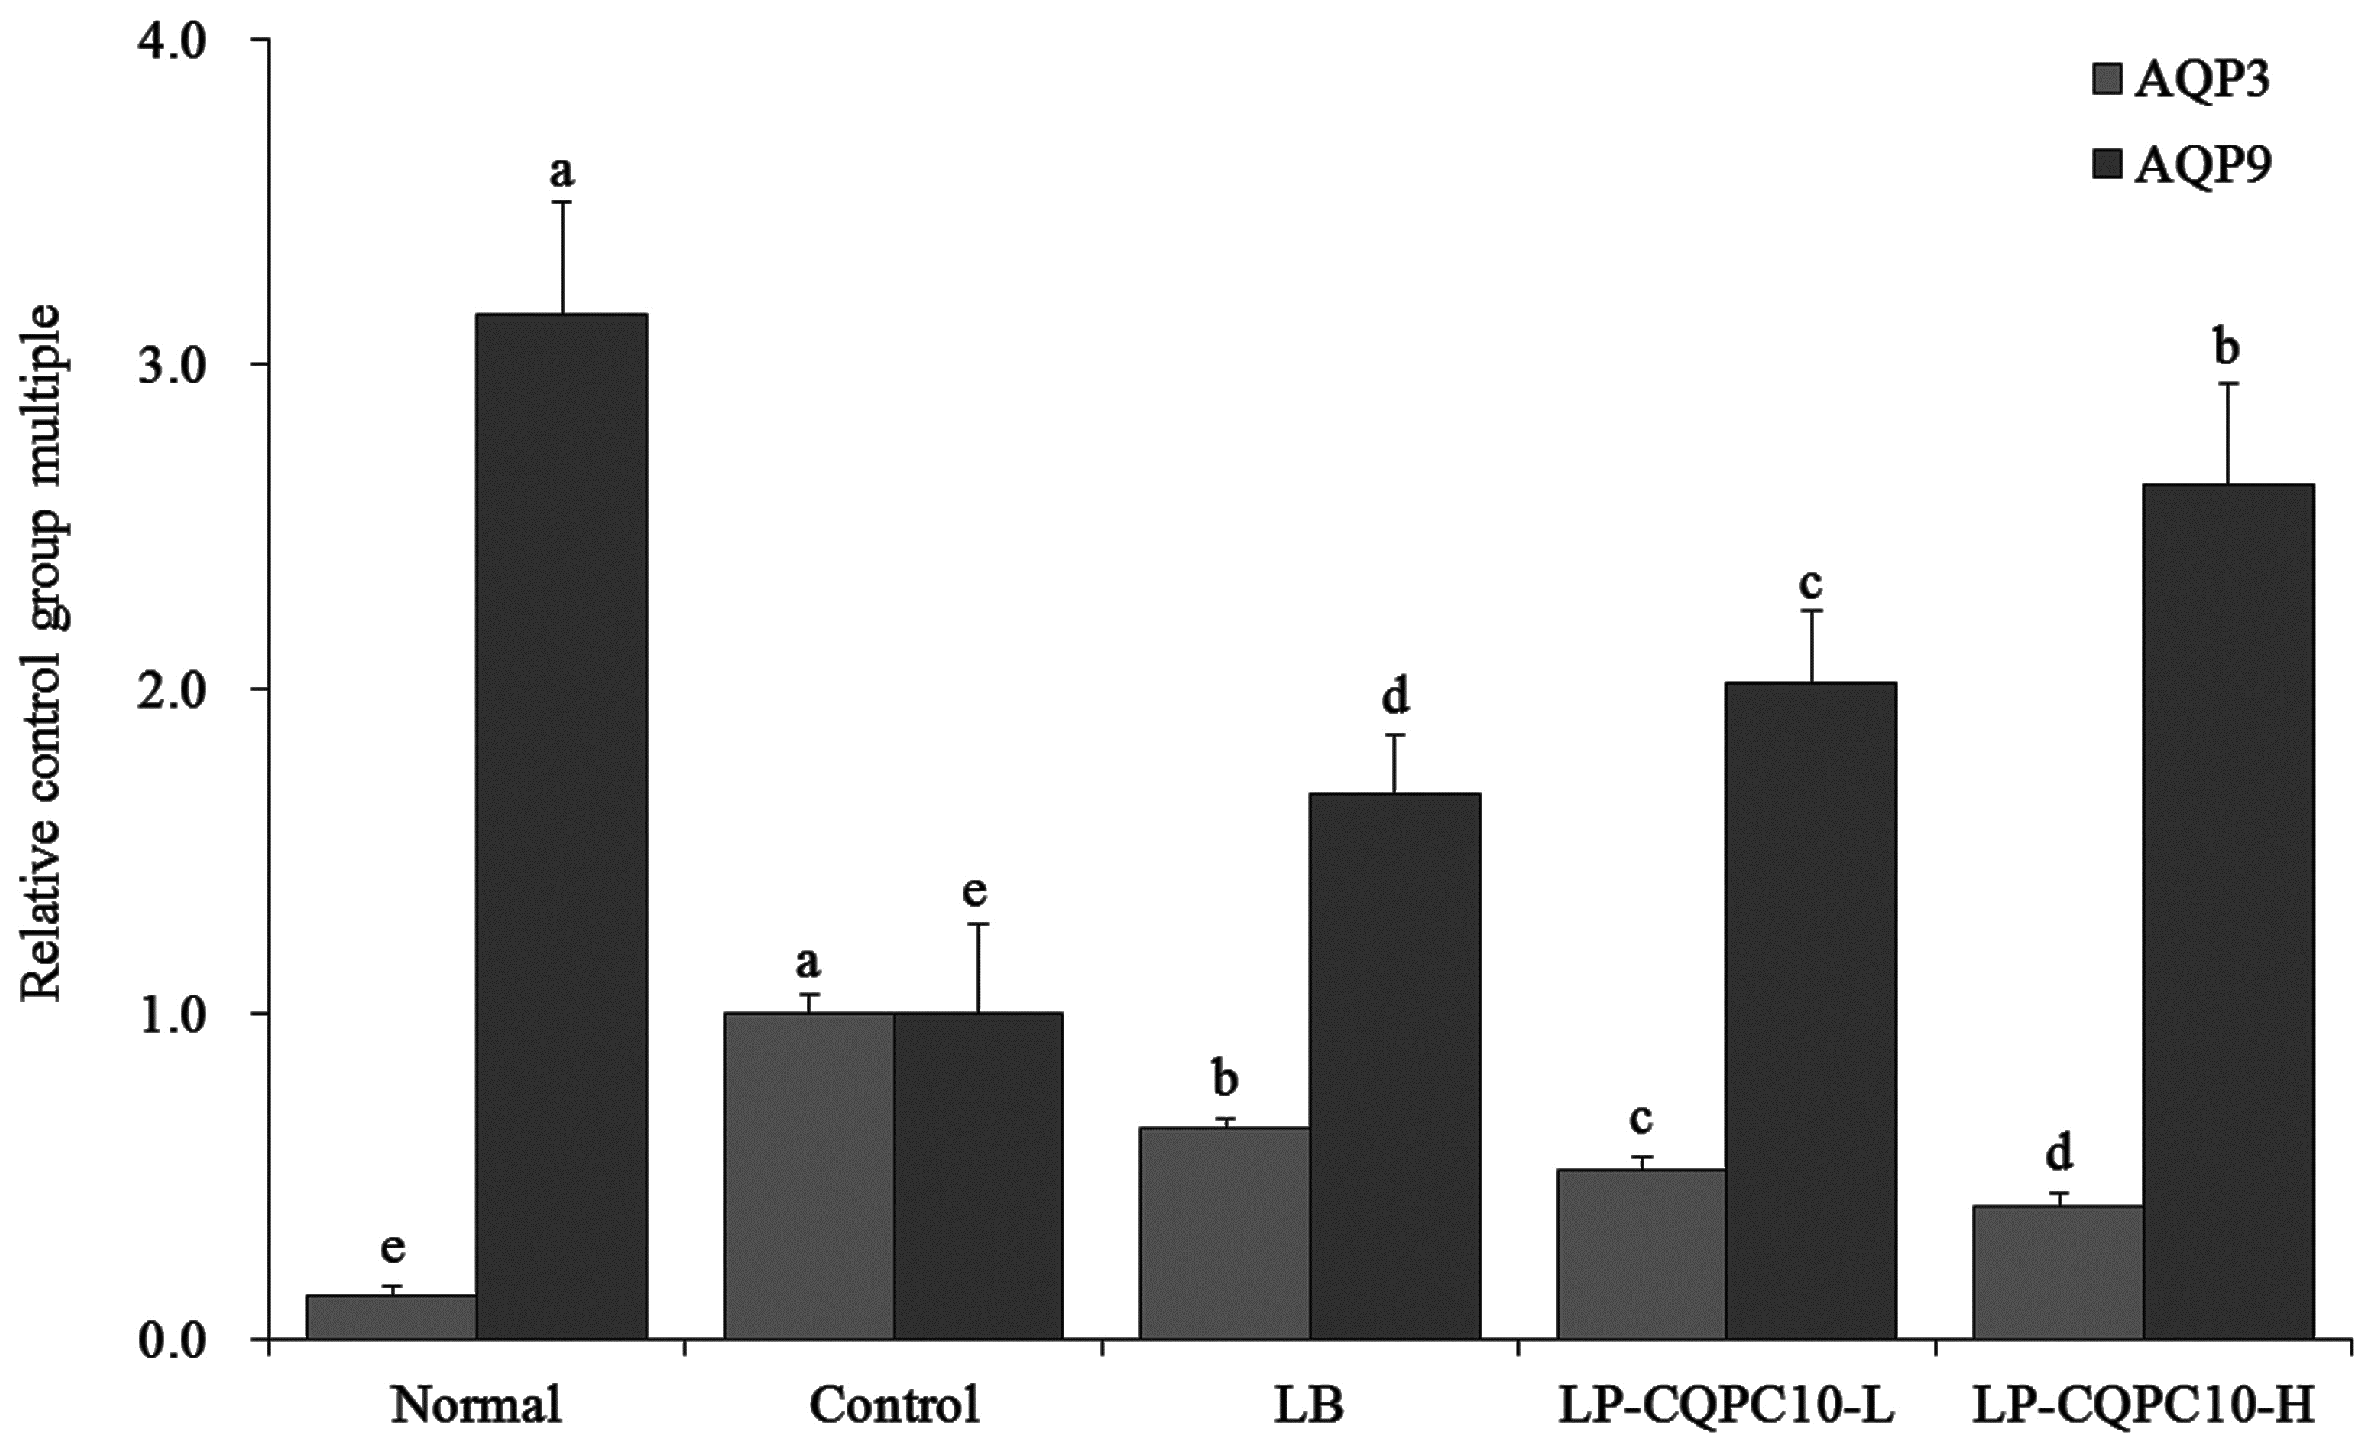
Aquaporin (AQP) has been reported to specifically transport water and some AQPs could participate in constipation by influencing the over-absorption of water in the colon and/or reduce the secretion of intestinal juice [44]. AQP3 in constipation rats has been reported to be significantly increased when compared to normal mice, and AQP3 participated in the water absorption of the colon in the enteric cavity. This suggested that the overexpression of AQP3 aggravated the water adsorption of colonic mucosa, leading to constipation [45,46]. AQP9 in the intestinal tract of constipated rats was significantly reduced. AQP9 participated in the secretion of colonic mucus, protected the mucous membrane, and promoted defecation. This suggested that AQP9 was expressed at a low level and the secretion of goblet cell mucus was reduced, leading to constipation [46]. LP-CQPC10 could remit the influence of constipation on AQPs, reduce the expression of AQP3, and increase the expression of AQP9.

5. Conclusions

This study investigated the effect of LP-CQPC10 that was isolated from Sichuan Paocai on experimentally generated constipation (induced with activated carbon). The results indicate that LP-CQPC10 could remit the influence of constipation on defecation. The results of serum indices and small intestine clarified the effect of LP-CQPC10 on the constipation inhibition and the mechanism was further elucidated via molecular biological tests. LP-CQPC10 improved the intestinal motility function, maintain intestinal health, inhibit the influence of constipation on intestinal nerve, and improve the normal physiological capability. The effect of LP-CQPC10 is positively correlated with bacterial dose, and the effect on the constipation is superior to that of the commonly used LB. The results of this study can guide the application of probiotics.

Author Contributions

J.Z. and X.Z. performed the majority of the experiments and wrote the manuscript; B.C., X.L., J.M., Y.P. and J.-L.S. contributed to the data analysis; X.Z. and Z.Y. designed and supervised the study and checked the final manuscript.

Funding

This research was funded by the Open Fund of Beijing Advanced Innovation Center for Food Nutrition and Human Health [20161001], Foundation for University Key Teacher by the Department of Education of Guangxi Zhuang Autonomous Region [GRJ[2018]18] and Chongqing Research Program of Basic Research and Frontier Technology [cstc2016jcyjA0339], China.

Conflicts of Interest

The authors declare no conflict of interest.

References

  1. Chen, G.; Yu, W.H.; Zhang, Q.S.; Song, P.; Zhang, B.B.; Liu, Z.; You, J.G.; Li, H. Research of Sichuan Paocai and Lactic Acid Bacteria. Adv. J. Food Sci. Technol. 2014, 6, 1–5. [Google Scholar]
  2. Yang, J.X.; Zhang, L.L.; Jiang, H.Y.; He, Z.F. Isolation and identification of lactic bacteria in pickled vegetavles from Meishan city. Food Sci. 2015, 36, 158–163. [Google Scholar]
  3. Liang, H.; Yin, L.; Zhang, Y.; Chang, C.; Zhang, W. Dynamics and diversity of a microbial community during the fermentation of industrialized Qingcai paocai, a traditional Chinese fermented vegetable food, as assessed by Illumina MiSeq sequencing, DGGE and qPCR assay. Ann. Microbiol. 2018, 68, 111–122. [Google Scholar] [CrossRef]
  4. Qian, Y.; Song, J.-L.; Yi, R.; Li, G.; Sun, P.; Zhao, X.; Huo, G. Preventive effects of Lactobacillus plantarum YS4 on constipation induced by activated carbon in mice. Appl. Sci. 2018, 8, 363. [Google Scholar] [CrossRef]
  5. Chen, X.; Zhao, X.; Wang, H.; Yang, Z.; Li, J.; Suo, H. Prevent effects of Lactobacillus fermentum HY01 on dextran sulfate sodium-induced colitis in mice. Nutrients 2017, 9, 545. [Google Scholar] [CrossRef] [PubMed]
  6. Chen, X.; Zhang, J.; Yi, R.; Mu, J.; Zhao, X.; Yang, Z. Hepatoprotective effects of Lactobacillus on carbon tetrachloride-induced acute liver injury in mice. Int. J. Mol. Sci. 2018, 19, 2212. [Google Scholar] [CrossRef] [PubMed]
  7. Chen, X.; Tan, F.; Yi, R.; Mu, J.; Zhao, X.; Yang, Z. Effects of Lactobacillus on mice with diabetes induced by high-fat diet with streptozotocin (STZ). Appl. Sci. 2018, 8, 1249. [Google Scholar] [CrossRef]
  8. Huang, Y.; Luo, Y.B.; Zhai, Z.Y.; Zhang, H.X.; Yang, C.X.; Tian, H.T.; Li, Z.; Feng, J.N.; Liu, H.; Hao, Y.L. Characterization and application of an anti-Listeria bacteriocin produced by Pediococcus pentosaceus 05-10 isolated from Sichuan Pickle, a traditionally fermented vegetable product from China. Food Control 2009, 20, 1030–1035. [Google Scholar] [CrossRef]
  9. Liu, A.; Li, X.; Pu, B.; Ao, X.; Zhou, K.; He, L.; Chen, S.; Liu, S. Use of psychrotolerant lactic acid bacteria (Lactobacillus spp. and Leuconostoc spp.) Isolated from Chinese Traditional Paocai for the Quality Improvement of Paocai Products. J. Agric. Food Chem. 2017, 65, 2580–2587. [Google Scholar] [CrossRef] [PubMed]
  10. Liu, W.L.; Zhang, L.W.; Shi, J.; Yi, H.X. Effect of complex food environment on production of enteriocin IN 3531 with Enterococcus faecium IN3531 as a starter in Chinese fermentation Paocai making. Adv. Mater. Res. 2014, 429–432. [Google Scholar] [CrossRef]
  11. Garciamarengoni, N.; Menezesalbuquerque, D. Quantification of intestinal bacteria, operating cost and performance of fingerlings Nile tilapia subjected to probiotics. Latin Am. J. Aquatic Res. 2017, 43, 367–373. [Google Scholar]
  12. Nichols, A.W. Probiotics and athletic performance: A systematic review. Curr. Sports Med. Rep. 2007, 6, 269–273. [Google Scholar] [CrossRef] [PubMed]
  13. Ianiro, G.; Pizzoferrato, M.; Franceschi, F.; Tarullo, A.; Luisi, T.; Gasbarrini, G. Effect of an extra-virgin olive oil enriched with probiotics or antioxidants on functional dyspepsia: A pilot study. Eur. Rev. Med. Pharmacol. Sci. 2013, 17, 2085–2090. [Google Scholar] [PubMed]
  14. Balcazar, J.L.; Blas, I.D.; Ruiz-Zarzuela, I.; De, B.I.; Ruiz-Zarzuela, I.; Vendrell, D.; Gironés, O.; Muzquiz, J.L. Enhancement of the immune response and protection induced by probiotic lactic acid bacteria against furunculosis in rainbow trout (Oncorhynchus mykiss). Pathog. Dis. 2013, 51, 185–193. [Google Scholar]
  15. Pavan, S.; Desreumaux, P.; Mercenier, A. Use of mouse models to evaluate the persistence, safety, and immune modulation capacities of lactic acid bacteria. Clin. Diagn. Lab. Immunol. 2003, 10, 696–701. [Google Scholar] [CrossRef] [PubMed]
  16. Chen, X.Y.; Song, J.L.; Hu, Q.; Wang, H.W.; Zhao, X.; Suo, H.Y. Positive enhancement of Lactobacillus fermentum HY01 on intestinal movements of mice having constipation. Appl. Biol. Chem. 2018, 61, 39–48. [Google Scholar] [CrossRef]
  17. Zhao, X.; Yi, R.K.; Qian, Y.; Park, K.Y. Lactobacillus plantarum YS-3 prevents activated carbon-induced constipation in mice. J. Med. Food 2018, 21, 575–584. [Google Scholar] [CrossRef] [PubMed]
  18. Zhao, X.P.; Xiao, X.Y.; Cai, R.; Tan, Z.J.; Li, D.D. The progress in research of constipation-related gut microbes. Chin. J. Microecol. 2014, 10, 1236–1241. [Google Scholar]
  19. Liu, S.Y.; Xiao, J.; Suo, H.Y. Screening and identification of resistant lactobacillus in traditional pickles. Food Mach. 2017, 7, 26–30. [Google Scholar]
  20. Yi, R.K.; Ji, N.; Zhao, X.; Park, K.Y. Preventive effects of Malvae verticilate and Perilla frutescens var. japonica leaf on activated carbon induced constipation in ICR mice. Biomed. Res. 2017, 28, 5257–5264. [Google Scholar]
  21. Zhao, X.; Sun, P.; Li, G.J.; Yi, R.K.; Qian, Y.; Park, K.Y. Polyphenols in Kuding tea help prevent HCl/ethanol-induced gastric injury in mice. Food Funct. 2018, 9, 1713–1725. [Google Scholar] [CrossRef] [PubMed]
  22. Setchell, K.D.; Brown, N.M.; Zimmer-Nechemias, L.; Brashear, W.T.; Wolfe, B.E.; Kirschner, A.S.; Heubi, J.E. Evidence for lack of absorption of soy isoflavone glycosides in humans, supporting the crucial role of intestinal metabolism for bioavailability. Am. J. Clin. Nutr. 2002, 76, 447–453. [Google Scholar] [CrossRef] [PubMed]
  23. Wang, L.; Hu, L.; Xu, Q.; Yin, B.; Fang, D.; Wang, G.; Zhao, J.; Zhang, H.; Chen, W. Bifidobacterium adolescentis exerts strain-specific effects on constipation induced by loperamide in BALB/c mice. Int. J. Mol. Sci. 2017, 18, 318. [Google Scholar] [CrossRef] [PubMed]
  24. Furchgott, R.F.; Zawadzki, J.V. The obligatory role of endothelial cells in the relaxation of arterial smooth muscle by acetylcholine. Nature 1980, 288, 373–376. [Google Scholar] [CrossRef] [PubMed]
  25. Tzavella, K.; Riepl, R.L.; Klauser, A.G.; Voderholzer, W.A.; Schindlbeck, N.E.; Müller-Lissner, S.A. Decreased substance P levels in rectal biopsies from patients with slow transit constipation. Eur. J. Gastroenterol. Hepatol. 1996, 8, 62–63. [Google Scholar] [CrossRef]
  26. Gibson, G.R.; Roberfroid, M.B. Dietary modulation of the human colonic microbiota: Updating the concept of prebiotics. Nutr. Res. Rev. 2004, 125, 1401–1412. [Google Scholar] [CrossRef] [PubMed]
  27. Milner, P.; Crowe, R.; Kamm, M.A.; Lennard-Jones, J.E.; Burnstock, G. Vasoactive intestinal polypeptide levels in sigmoid colon in idiopathic constipation and diverticular disease. Gastroenterology 1990, 99, 666–675. [Google Scholar] [CrossRef]
  28. Sindhu, S.; Akhter, N.; Kochumon, S.; Thomas, R.; Wilson, A.; Shenouda, S.; Tuomilehto, J.; Ahmad, R. Increased expression of the innate immune receptor TLR10 in obesity and type-2 diabetes: Association with ROS-mediated oxidative stress. Cell. Physiol. Biochem. 2018, 45, 572–590. [Google Scholar] [CrossRef] [PubMed]
  29. Kruidenier, L.; van Meeteren, M.E.; Kuiper, I.; Jaarsma, D.; Lamers, C.B.; Zijlstra, F.J.; Verspaget, H.W. Attenuated mild colonic inflammation and improved survival from severe DSS-colitis of transgenic Cu/Zn-SOD mice. Free Radic. Biol. Med. 2003, 34, 753–765. [Google Scholar] [CrossRef]
  30. Švagelj, D.; Terzić, V.; Dovhanj, J.; Švagelj, M.; Cvrković, M.; Švagelj, I. Superoxide dismutases in chronic gastritis. APMIS 2016, 124, 252–256. [Google Scholar] [CrossRef] [PubMed]
  31. Rtibi, K.; Grami, D.; Selmi, S.; Amri, M.; Sebai, H.; Marzouki, L. Vinblastine, an anticancer drug, causes constipation and oxidative stress as well as others disruptions in intestinal tract in rat. Toxicol. Rep. 2017, 4, 221–225. [Google Scholar] [CrossRef] [PubMed]
  32. Sanders, K.M.; Koh, S.D.; Ward, S.M. Interstitial cells of cajal as pacemakers in the gastrointestinal tract. Ann. Rev. Physiol. 2006, 68, 307–343. [Google Scholar] [CrossRef] [PubMed]
  33. Farrugia, G. Interstitial cells of Cajal in health and disease. Neurogastroenterol. Motil. 2010, 20, 54–63. [Google Scholar] [CrossRef] [PubMed]
  34. Lyford, L.; He, C.L.; Soffer, E.; Hull, T.L.; Strong, S.A.; Senagore, A.J.; Burgart, L.J.; Young-Fadok, T.; Szurszewski, J.H.; Farrugia, G. Pan-colonic decrease in interstitial cells of Cajal in patients with slow transit constipation. Gut 2002, 51, 496–501. [Google Scholar] [CrossRef] [PubMed] [Green Version]
  35. Geppetti, P.; Trevisani, M. Activation and sensitisation of the vanilloid receptor: Role in gastrointestinal inflammation and function. Br. J. Pharmacol. 2004, 141, 1313–1320. [Google Scholar] [CrossRef] [PubMed]
  36. Shah, V.; Lyford, G.; Gores, G.; Farrugia, G. Nitric oxide in gastrointestinal health and disease. Gastroenterology 2004, 126, 903–913. [Google Scholar] [CrossRef] [PubMed]
  37. Tomita, R.; Igarashi, S.; Fujisaki, S.; Tanjoh, K. The effects of neurotensin in the colon of patients with slow transit constipation. Hepatogastroenterology 2007, 54, 1662–1666. [Google Scholar] [PubMed]
  38. Xiao, H.; Tang, L. Progress of research on relationship between neuronal nitric oxide synthase and gastrointestinal motility disorders. Chin. J. Gastroenterol. 2017, 22, 700–702. [Google Scholar]
  39. Forrest, A.; Parsons, M. The enhanced spontaneous activity of the diabetic colon is not the consequence of impaired inhibitory control mechanisms. Autonom. Autacoid Pharmacol. 2003, 23, 149–158. [Google Scholar] [CrossRef]
  40. Vannini, F.; Kashfi, K.; Nath, N. The dual role of iNOS in cancer. Redox Biol. 2015, 6, 334–343. [Google Scholar] [CrossRef] [PubMed]
  41. Luo, Y.; Zhao, Y.; Li, X.; Zhao, J.; Zhang, W. ZNF580 mediates eNOS expression and endothelial cell migration/proliferation via the TGF-β1/ALK5/Smad2 pathway. Mol. Cell Biochem. 2014, 393, 199–207. [Google Scholar] [CrossRef] [PubMed]
  42. Tan, L.; Tan, Z.R.; Huang, X.; Qin, L.R. The expression of different kinds of NOS in the colon of slow transit constipation rats. Chin. J. Gastroenterol. Hepatol. 2011, 1, 64–66. [Google Scholar]
  43. Sugiura, H.; Okita, S.; Kato, T.; Naka, T.; Kawanishi, S.; Ohnishi, S.; Oshida, Y.; Ma, N. Protection by taurine against INOS-dependent DNA damage in heavily exercised skeletal muscle by inhibition of the NF-κB signaling pathway. Adv. Exp. Med. Biol. 2013, 775, 237–246. [Google Scholar] [PubMed]
  44. Yin, S.H.; Zhao, K.; Ding, J.H.; Zhang, B.; Zhao, Y. The expression and significance of hAQP9 in rectal mucosa of patients with constipation. J. Beijing Norm. Univ. (Nat. Sci.) 2010, 4, 465–467. [Google Scholar]
  45. Yuan, W.T.; Yang, H.F.; Zhang, Z.Y.; Liu, J.B. Expression and significance of aquaporin 3 and aquaporin 9 in colonic mucosa of patients with functional constipation. Chin. J. Gastrointest. Surg. 2008, 11, 57–60. [Google Scholar]
  46. Geng, X.S.; Luo, C.H.; Xiao, Q.P.; Yuan, Y.; Zhao, B.; Zhang, Z.Q.; Nie, M.; Ye, S.F. Experimental study on effect of Changrun Formula in regulating expression of AQP3 and AQP9 in colon mucosa of functional constipation rats. China J. Tradit. Chin. Med. Pharm. 2016, 31, 4699–4703. [Google Scholar]
Figure 1. The 16S rDNA agarose gel electrophoresis of PCR amplified product of Lactobacillus plantarum CQPC10. M: 2000 bp DNA Ladder; 0: negative control group; 1: Lactobacillus plantarum CQPC10.
Applsci 08 01498 g001
Figure 2. First black stool defecation time of the mice. Values presented are the mean ± standard deviation. a–e Mean values with different letters in the same bars are significantly different (p < 0.05) according to Duncan’s multiple-range test. LB: Lactobacillus bulgaricus (1.0 × 10⁹ colony-forming unit (CFU)/kg body weight (bw)); LP-CQPC10-L: Lactobacillus plantarum CQPC10 (1.0 × 10⁸ colony-forming unit (CFU)/kg body weight (bw)); LP-CQPC10-H: Lactobacillus plantarum CQPC10 (1.0 × 10⁹ colony-forming unit (CFU)/kg body weight (bw)).
Applsci 08 01498 g002
Figure 3. Morphological observation of small-intestine tissue in mice with activated carbon-induced constipation. LB: Lactobacillus bulgaricus (1.0 × 10⁹ colony-forming unit (CFU)/kg body weight (bw)); LP-CQPC10-L: Lactobacillus plantarum CQPC10 (1.0 × 10⁸ colony-forming unit (CFU)/kg body weight (bw)); LP-CQPC10-H: Lactobacillus plantarum CQPC10 (1.0 × 10⁹ colony-forming unit (CFU)/kg body weight (bw)).
Applsci 08 01498 g003
Figure 4. mRNA expression levels of Cu/Zn-SOD, Mn-SOD and CAT in the small-intestine tissue of mice. Values presented are the mean ± standard deviation. a–e Mean values with different letters in the same bars are significantly different (p < 0.05) according to Duncan’s multiple-range test. LB: Lactobacillus bulgaricus (1.0 × 10⁹ colony-forming unit (CFU)/kg body weight (bw)); LP-CQPC10-L: Lactobacillus plantarum CQPC10 (1.0 × 10⁸ colony-forming unit (CFU)/kg body weight (bw)); LP-CQPC10-H: Lactobacillus plantarum CQPC10 (1.0 × 10⁹ colony-forming unit (CFU)/kg body weight (bw)).
Applsci 08 01498 g004
Figure 5. mRNA expression levels of c-Kit and CSF in the small-intestine tissue of mice. Values presented are the mean ± standard deviation. a–e Mean values with different letters in the same bars are significantly different (p < 0.05) according to Duncan’s multiple-range test. LB: Lactobacillus bulgaricus (1.0 × 10⁹ colony-forming unit (CFU)/kg body weight (bw)); LP-CQPC10-L: Lactobacillus plantarum CQPC10 (1.0 × 10⁸ colony-forming unit (CFU)/kg body weight (bw)); LP-CQPC10-H: Lactobacillus plantarum CQPC10 (1.0 × 10⁹ colony-forming unit (CFU)/kg body weight (bw)).
Applsci 08 01498 g005
Figure 6. mRNA expression levels of TRPV1 and GDNF in the small-intestine tissue of mice. Values presented are the mean ± standard deviation. a–e Mean values with different letters in the same bars are significantly different (p < 0.05) according to Duncan’s multiple-range test. LB: Lactobacillus bulgaricus (1.0 × 10⁹ colony-forming unit (CFU)/kg body weight (bw)); LP-CQPC10-L: Lactobacillus plantarum CQPC10 (1.0 × 10⁸ colony-forming unit (CFU)/kg body weight (bw)); LP-CQPC10-H: Lactobacillus plantarum CQPC10 (1.0 × 10⁹ colony-forming unit (CFU)/kg body weight (bw)).
Applsci 08 01498 g006
Figure 7. mRNA expression levels of nNOS, eNOS, and iNOS in the small-intestine tissue of mice. Values presented are the mean ± standard deviation. a–e Mean values with different letters in the same bars are significantly different (p < 0.05) according to Duncan’s multiple-range test. LB: Lactobacillus bulgaricus (1.0 × 10⁹ colony-forming unit (CFU)/kg body weight (bw)); LP-CQPC10-L: Lactobacillus plantarum CQPC10 (1.0 × 10⁸ colony-forming unit (CFU)/kg body weight (bw)); LP-CQPC10-H: Lactobacillus plantarum CQPC10 (1.0 × 10⁹ colony-forming unit (CFU)/kg body weight (bw)).
Applsci 08 01498 g007
Figure 8. mRNA expression levels of AQP3 and AQP9 and CAT in the small-intestine tissue of mice. Values presented are the mean ± standard deviation. a–e Mean values with different letters in the same bars are significantly different (p < 0.05) according to Duncan’s multiple-range test. LB: Lactobacillus bulgaricus (1.0 × 10⁹ colony-forming unit (CFU)/kg body weight (bw)); LP-CQPC10-L: Lactobacillus plantarum CQPC10 (1.0 × 10⁸ colony-forming unit (CFU)/kg body weight (bw)); LP-CQPC10-H: Lactobacillus plantarum CQPC10 (1.0 × 10⁹ colony-forming unit (CFU)/kg body weight (bw)).
Applsci 08 01498 g008
Table 1. Sequences of primers used in this study.
Gene NameSequence
Cu/Zn-SODForward: 5′-GAAGAGAGGCATGTTGGAGA-3′
Reverse: 5′-CCAATTACACCACGAGCCAA-3′
Mn-SODForward: 5′-TTCAATAAGGAGCAGGGAC-3′
Reverse: 5′-CAGTGTAAGGCTGACGGTTT-3′
CATForward: 5′-GGAGGCGGGAACCCAATAG-3′
Reverse: 5′-GTGTGCCATCTCGTCAGTGAA-3′
c-KitForward: 5′-CATAGCCCAGGTAAAGCACAAT-3′
Reverse: 5′-GAACACTCCAGAATCGTCAACTC-3′
SCFForward: 5′-TCAGGGACTACGCTGCGAAAG-3′
Reverse: 5′-AAGAGCTGGCAGACCGACTCA-3′
TRPV1Forward: 5′-CCGGCTTTTTGGGAAGGGT-3′
Reverse: 5′-GAGACAGGTAGGTCCATCCAC-3′
GDNFForward: 5′-GGGGTATGGAGAAGTTGGCTAG-3′
Reverse: 5′-CTATGAGAATGCTGCCGAAAA-3′
nNOSForward: 5′-GAG AGG ATT CTG AAG ATG AGG-3′
Reverse: 5′-TTG CTA ATG AGG GAG TTG TTC-3′
eNOSForward: 5′-TGT TTG TCT GCG GCG ATG T-3′
Reverse: 5′-GGG TGC GTA TGC GGC TTG TC-3′
iNOSForward: 5′-CAT TGG AAG TGA AGC GTT TCG-3′
Reverse: 5′-CAC AGA ACT GAG GGT ACA-3′
AQP3Forward: 5′-CCT CTG GAC ACT TGG ATA TGA T-3′
Reverse: 5′-GGG ACG GGG TTG TTG TAG-3′
AQP9Forward: 5′-CTC CTG ATT ATT GTC ATT GC-3′
Reverse: 5′-ATC CAC CAG AAG TTG TTT-3′
GAPDHForward: 5′-TGC ACC ACC AAC TGC TTA G-3′
Reverse: 5′-GAT GCA GGG ATG ATG TTC-3′
Cu/Zn-SOD: cuprozinc-superoxide dismutase; Mn-SOD: manganese superoxide dismutase; CAT: catalase; SCF: stem cell factor; TRPV1: transient receptor potential cation channel subfamily V member 1; GDNF: glial cell-derived neurotrophic factor; nNOS: neuronal nitric oxide synthase; eNOS: endothelial nitric oxide synthase; iNOS: inducible nitric oxide synthase; AQP3: Aquaporin-3; AQP9: Aquaporin-9; GAPDH: glyceraldehyde-3-phosphate dehydrogenase.
Table 2. Abilities of stanins to resist artificial gastric acid and bile salt.
GroupsSurvival Rate in pH 3.0 Artificial Gastric Juice (%)Survival Rate in 0.3% Bile Salt (%)
LB34.18 ± 1.924.68 ± 0.31
LP-CQPC1096.77 ± 2.8311.23 ± 1.10
Values presented are the mean ± standard deviation. LB: Lactobacillus bulgaricus; LP-CQPC10: Lactobacillus plantarum CQPC10.
Table 3. Stool status of mice treated with soybean milk during the experiment.
GroupsNormalControlLBLP-CQPC10-LLP-CQPC10-H
1–14 d (lactic acid bacteria administration period but not induction of constipation)
Stool weight (g)1.08 ± 0.04 a1.09 ± 0.05 a1.06 ± 0.06 a1.08 ± 0.05 a1.03 ± 0.06 a
Particle count of stool44 ± 4 a45 ± 3 a43 ± 4 a44 ± 2 a45 ± 4 a
Water content of stool (%)50 ± 4 a49 ± 5 a52 ± 5 a51 ± 3 a52 ± 3 a
15–17 d (lactic acid bacteria administration period, induction of constipation)
Stool weight (g)1.12 ± 0.05 a0.52 ± 0.09 e0.78 ± 0.05 d0.84 ± 0.03 c0.93 ± 0.04 b
Particle count of stool52 ± 3 a23 ± 5 d35 ± 4 c41 ± 4 b,c48 ± 3 b
Water content of stool (%)51 ± 3 a20 ± 5 d31 ± 3 c36 ± 4 b,c44 ± 2 b
Values presented are the mean ± standard deviation. a–d Mean values with different letters in the same row are significantly different (p < 0.05) according to Duncan’s multiple-range test. LB: Lactobacillus bulgaricus (1.0 × 10⁹ colony-forming unit (CFU)/kg body weight (bw)); LP-CQPC10-L: Lactobacillus plantarum CQPC10 (1.0 × 10⁸ colony-forming unit (CFU)/kg body weight (bw)); LP-CQPC10-H: Lactobacillus plantarum CQPC10 (1.0 × 10⁹ colony-forming unit (CFU)/kg body weight (bw)).
Table 4. Gastrointestinal (GI) transit in mice with activated carbon-induced constipation.
GroupsLength of Small Intestine (cm)Length of GI Transit (cm)Activated Carbon Progradation Rate (%)
Normal43.3 ± 2.2 a41.8 ± 2.3 a96.5 ± 2.2 a
Control43.4 ± 2.4 a14.2 ± 2.6 e32.7 ± 2.4 e
LB43.7 ± 2.6 a26.8 ± 2.5 d61.3 ± 2.3 d
LP-CQPC10-L43.5 ± 1.7 a31.3 ± 2.0 c72.0 ± 1.8 c
LP-CQPC10-H43.6 ± 2.4 a37.9 ± 2.2 b86.9 ± 2.2 b
Values presented are the mean ± standard deviation. a–e Mean values with different letters in the same row are significantly different (p < 0.05) according to Duncan’s multiple-range test. LB: Lactobacillus bulgaricus (1.0 × 10⁹ colony-forming unit (CFU)/kg body weight (bw)); LP-CQPC10-L: Lactobacillus plantarum CQPC10 (1.0 × 10⁸ colony-forming unit (CFU)/kg body weight (bw)); LP-CQPC10-H: Lactobacillus plantarum CQPC10 (1.0 × 10⁹ colony-forming unit (CFU)/kg body weight (bw)).
Table 5. MTL, ET, SS, AchE, and Gas serum levels in mice with activated carbon-induced constipation.
Levels (pg/mL)NormalControlLBLF-CQPC10-LLF-CQPC10-H
MTL205.3 ± 17.3 a56.7 ± 5.9 e83.6 ± 14.1 d122.3 ± 11.8 c178.2 ± 15.3 b
Gas131.2 ± 12.5 a32.0 ± 3.9 e61.3 ± 8.3 d81.4 ± 5.1 c102.3 ± 7.7 b
ET42.1 ± 3.3 a4.6 ± 0.8 e12.3 ± 1.1 d23.6 ± 2.1 c32.6 ± 2.5 b
SS25.7 ± 2.6 e90.3 ± 5.6 a62.3 ± 3.6 b46.7 ± 3.2 c33.7 ± 1.6 d
AchE53.2 ± 3.3 a7.6 ± 2.1 e23.4 ± 2.4 d34.7 ± 2.1 c41.8 ± 2.4 b
SP88.6 ± 4.9 a26.7 ± 3.5 e50.3 ± 3.5 d61.3 ± 2.4 c69.7 ± 3.0 b
VIP84.6 ± 2.3 a22.7 ± 3.2 e40.3 ± 2.8 d53.6 ± 2.9 c73.1 ± 3.0 b
Values presented are the mean ± standard deviation. a–e Mean values with different letters in the same row are significantly different (p < 0.05) according to Duncan’s multiple-range test. LB: Lactobacillus bulgaricus (1.0 × 10⁹ colony-forming unit (CFU)/kg body weight (bw)); LP-CQPC10-L: Lactobacillus plantarum CQPC10 (1.0 × 10⁸ colony-forming unit (CFU)/kg body weight (bw)); LP-CQPC10-H: Lactobacillus plantarum CQPC10 (1.0 × 10⁹ colony-forming unit (CFU)/kg body weight (bw)). MTL, motilin; Gas, gastrin; ET, endothelin; SS, somatostatin; AchE, acetylcholinesterase; SP, substance P; and VIP, vasoactive intestinal peptide.
Table 6. MPO, NO, MDA, and GSH levels in the small-intestine tissue of mice with activated carbon-induced constipation.
GroupMPO (mU/mg)NO (μmol/gprot)MDA (nmol/mg)GSH (μmol/mg)
Normal3.3 ± 0.4 e0.4 ± 0.1 e0.5 ± 0.1 e11.3 ± 0.5 a
Control22.6 ± 2.1 a2.3 ± 0.3 a2.1 ± 0.3 a4.4 ± 0.5 e
LB15.3 ± 1.7 b1.7 ± 0.3 b1.6 ± 0.3 b6.7 ± 0.3 d
LF-CQPC10-L11.8 ± 1.4 c1.2 ± 0.2 c1.2 ± 0.2 c7.2 ± 0.2 c
LF-CQPC10-H8.2 ± 0.9 d0.7 ± 0.1 d0.8 ± 0.2 d9.7 ± 0.4 b
Values presented are the mean ± standard deviation. a–e Mean values with different letters in the same row are significantly different (p < 0.05) according to Duncan’s multiple-range test. LB: Lactobacillus bulgaricus (1.0 × 10⁹ colony-forming unit (CFU)/kg body weight (bw)); LP-CQPC10-L: Lactobacillus plantarum CQPC10 (1.0 × 10⁸ colony-forming unit (CFU)/kg body weight (bw)); LP-CQPC10-H: Lactobacillus plantarum CQPC10 (1.0 × 10⁹ colony-forming unit (CFU)/kg body weight (bw)). MPO: myeloperoxidase; NO: nitric oxide; GSH: glutathione; MDA: malondialdehyde.

