1. Introduction
Soil moisture plays a key role in the hydrological cycle by controlling processes, such as evapotranspiration, runoff, and recharge of aquifers, just to mention some of them [
1,
2,
3]. Therefore, soil water content data are very useful for the application and evaluation of hydrological models that yield to irrigation programming and optimization [
4]. Hydrological models are essential tools for estimating water resources and floods in the current situation, as well as in relation to different scenarios of global climate change and/or under different land uses [
5].
Several methodologies have been developed to determinate soil moisture, both in the field and in the laboratory: gravimetric measurements, optical spectroscopy, continuous wave acoustics, electric resistance blocks, tensiometers, and neutron probes, among others [
6,
7,
8,
9]. Recently, the use of capacitive sensors has increased [
10], since they offer a good cost-benefit in relationship when compared to other devices, like the ones that are based on reflectometry in the time domain, which was considered as one of the most accurate methods for estimating the water content of soils so far [
11,
12].
Optical fiber sensors have been used to measure many parameters, such as temperature, curvature, vibration, displacement, pressure, refractive index, electric field, magnetic field, relative humidity, and gases due to their ability to work as transducers [
13]. There exist many different types of fibers that are suitable for sensing applications: silica optical fibers, plastic fibers, or photonic crystal fibers are some common ones.
Microstructured optical fibers (MOFs) present great sensing potential and they have shown improved properties over traditional optical fiber sensors overcoming some of their handicaps [
14,
15,
16]. For example, several pure silica suspended-core fibers have been used in temperature and curvature sensing [
17], gas sensing [
18], or relative humidity (RH) sensing [
19].
Fiber based optical Fabry–Pérot (FP) interferometers are a quite popular optical fiber sensor configuration due to their compactness, simple configuration, flexibility in tuning sensitivity, and dynamic range. This structure presents robustness and multiplexing capability. The FP cavity transfer function consists of an interference pattern that depends on the cavity length and of the refractive index of the cavity, or more precisely, the effective indices of the different modes that are supported by the fiber interferometer. Actually, FP cavities fabricated with MOFs are structures that are commonly used for sensing: a hybrid structure that used a MOF, a hollow-core fiber, and a single mode fiber (SMF) was developed for high-temperature sensing [
20], whereas a chitosan FP cavity was fabricated for relative humidity (RH) measurements [
21] and also compact FP cavities for humidity between 40% and 95% were reported [
22].
Nanocoated based sensors have experienced a great development during the last decades [
23]. Furthermore, new chemical deposition techniques, such as sputtering [
24], enable precisely customizing the morphology and thickness of the deposited thin film coatings, and as a consequence, the final properties (sensitivity, kinetics) of the sensor. Sputtering depositions are commonly used to create a homogeneous layer on the surface of a pure silica optical fiber [
25,
26].
Finally, not many works have been reported up to date measuring real soil moisture with optical fibers: cascade fiber Bragg gratings (FBG) sensors were employed to monitor temperature and soil moisture simultaneously [
27], hetero-core spliced optical fiber SPR sensor [
28], and a summary of the most common techniques employed in humidity sensing [
29] were reported.
In this work, an optical fiber sensor based on a sputtering deposition on a MOF is presented for real moisture measurements and compared simultaneously with a commercial capacitive sensor. The operation principle of the humidity optical sensor has been previously reported by authors [
19] showing in detail the construction process of an optimized sensing head and its performance towards humidity variations. In the present paper, the authors propose, for the first time, a sensor that has been adapted and used for measurements in real soil conditions. Moreover, the authors also present a comparison between the performance of microstructured optical fiber sensors, a commercial capacitive sensor, and a comparison of both devices against gravimetric measurements, showing the pros and cons of every type of sensors (and remarking the advantages of fiber optic against commercial capacitive ones). It is worth remarking that the aim of this work is not to present the optical sensing head in detail, as it is fully described in [
19], but to show a real comparison between commercial capacitive soil moisture sensors and the application of the optical sensing head for the same purpose.
2. Materials and Methods
A Decagon 10HS capacitive sensor (Meter Group Inc., Pullman, WA, USA) was used as reference for the soil moisture measurements. This capacitive device is a frequency domain reflectometry (FDR) based electrical sensor. Its operation principle consists of measuring the dielectric constant or permittivity of the soil to calculate its humidity content. It performs soil moisture measurements within a big volume of soil (~6.5 dm3) with great moisture range and it is designed for any soil composition.
Its measurements have been compared with an optical fiber Fabry-Pérot interferometer that was fabricated by splicing a single mode fiber (SMF) to a cleaved four-bridge MOF, as shown in [
19]. As shown in [
19], the MOF–FP optical fiber core was used as the substrate in a SnO
2 coating-DC-Sputter deposition process. SnO
2 can be deposited on the walls of the air holes of the short section of the MOF as well as on the top of the sensor head due to the particular structure of the MOF that is used. SnO
2 coating is highly sensitive to humidity changes of the surrounding environment [
30].
The interaction between SnO
2 and H
2O molecules is due to the phenomena called physisorption by means of the adsorption/desorption of these molecules [
31]. The molecules of water interact just with the surface of the deposited SnO
2 thin film.
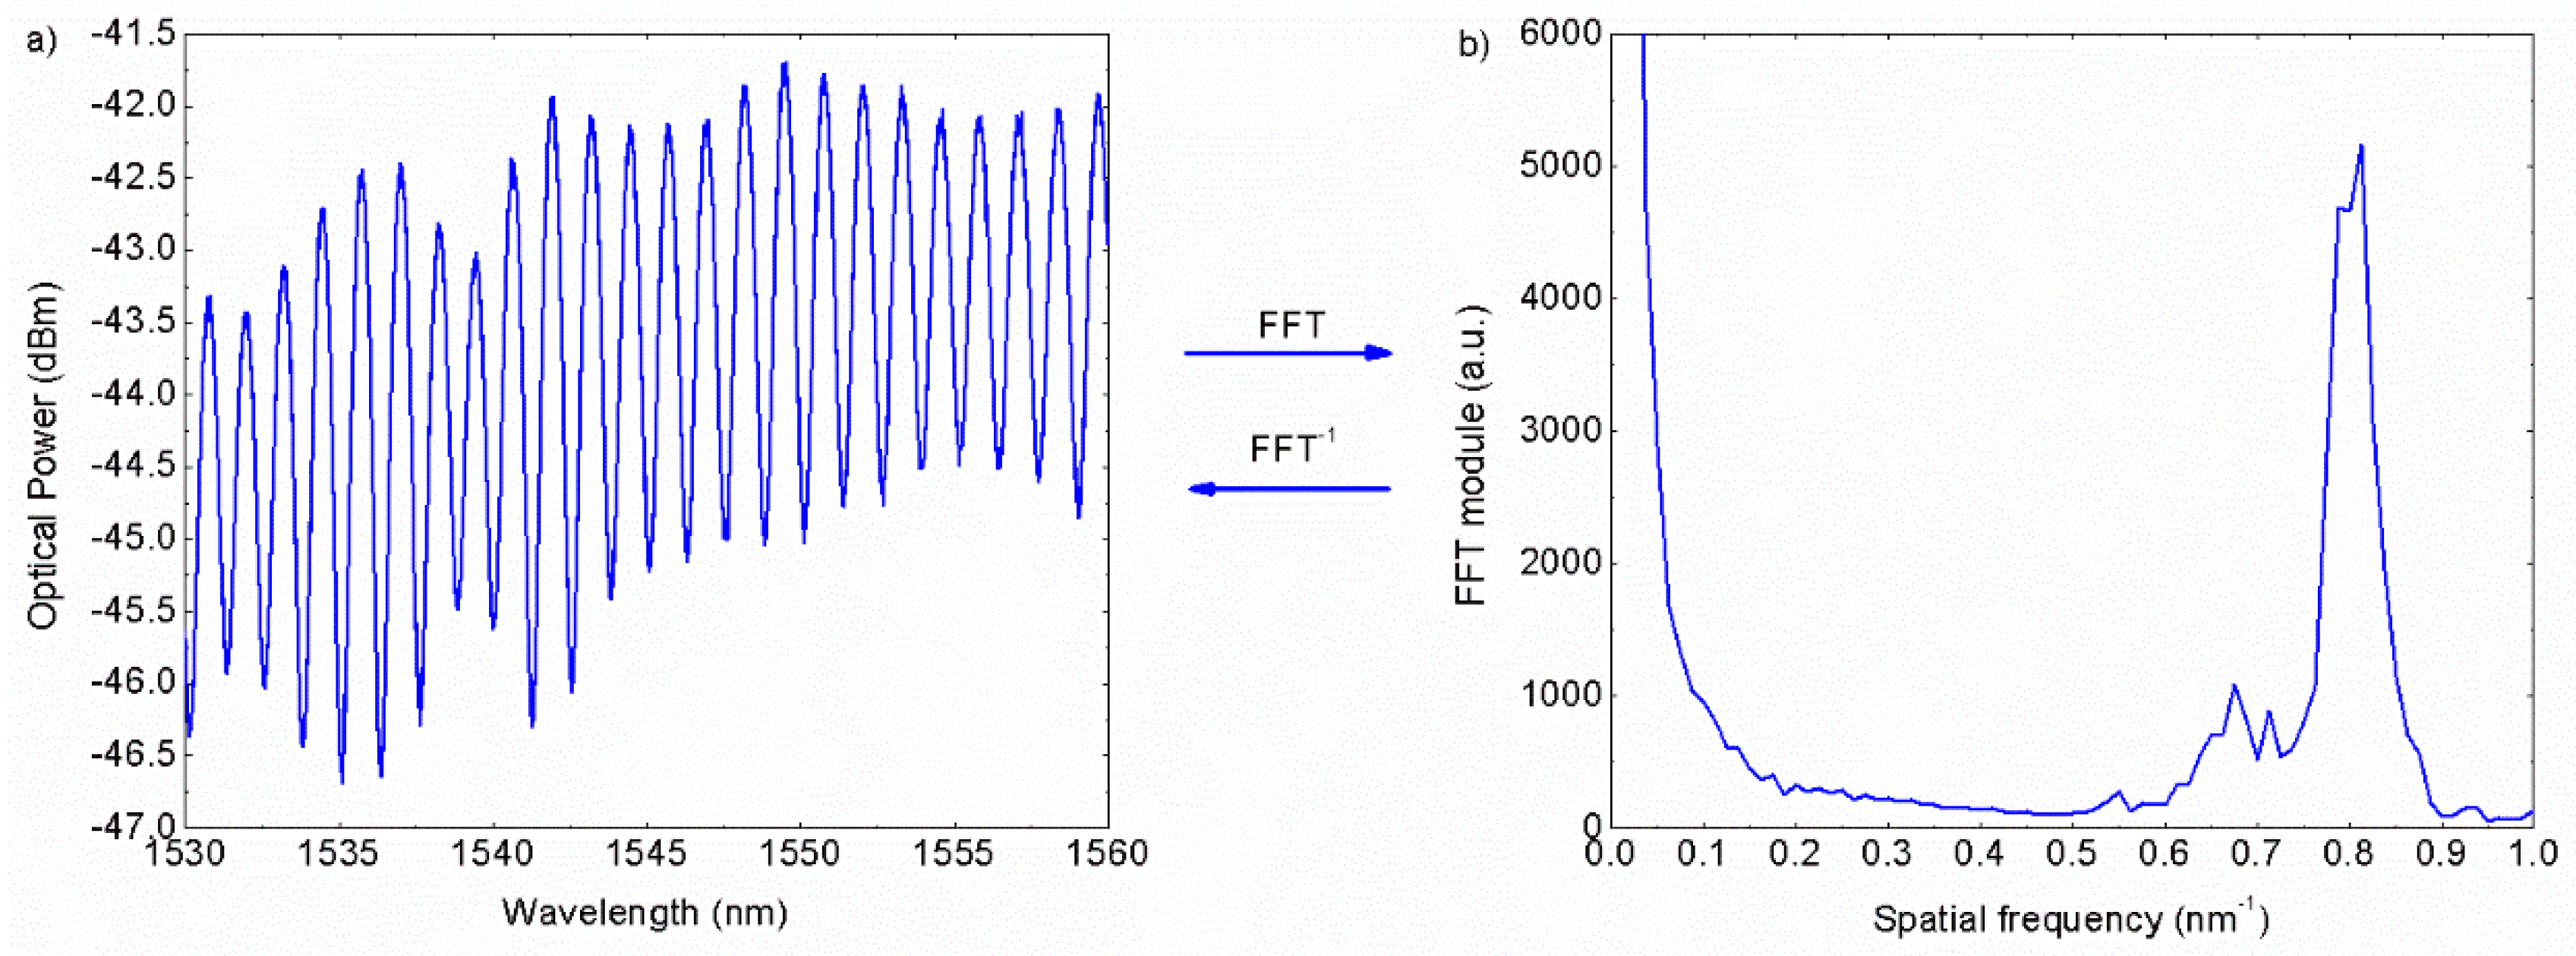
The MOF cavity length determines the periodicity of the sensor optical spectrum interference obtained following (1). Where Δ
λ: optical spectrum wavelength spacing,
λ: working wavelength,
n: refractive index, and
d: MOF cavity length [
32].
In this particular case, the MOF length used was ~700 μm showing an interference period of 1.24 nm, as
Figure 1a shows (after a 10 min SnO
2 deposition).
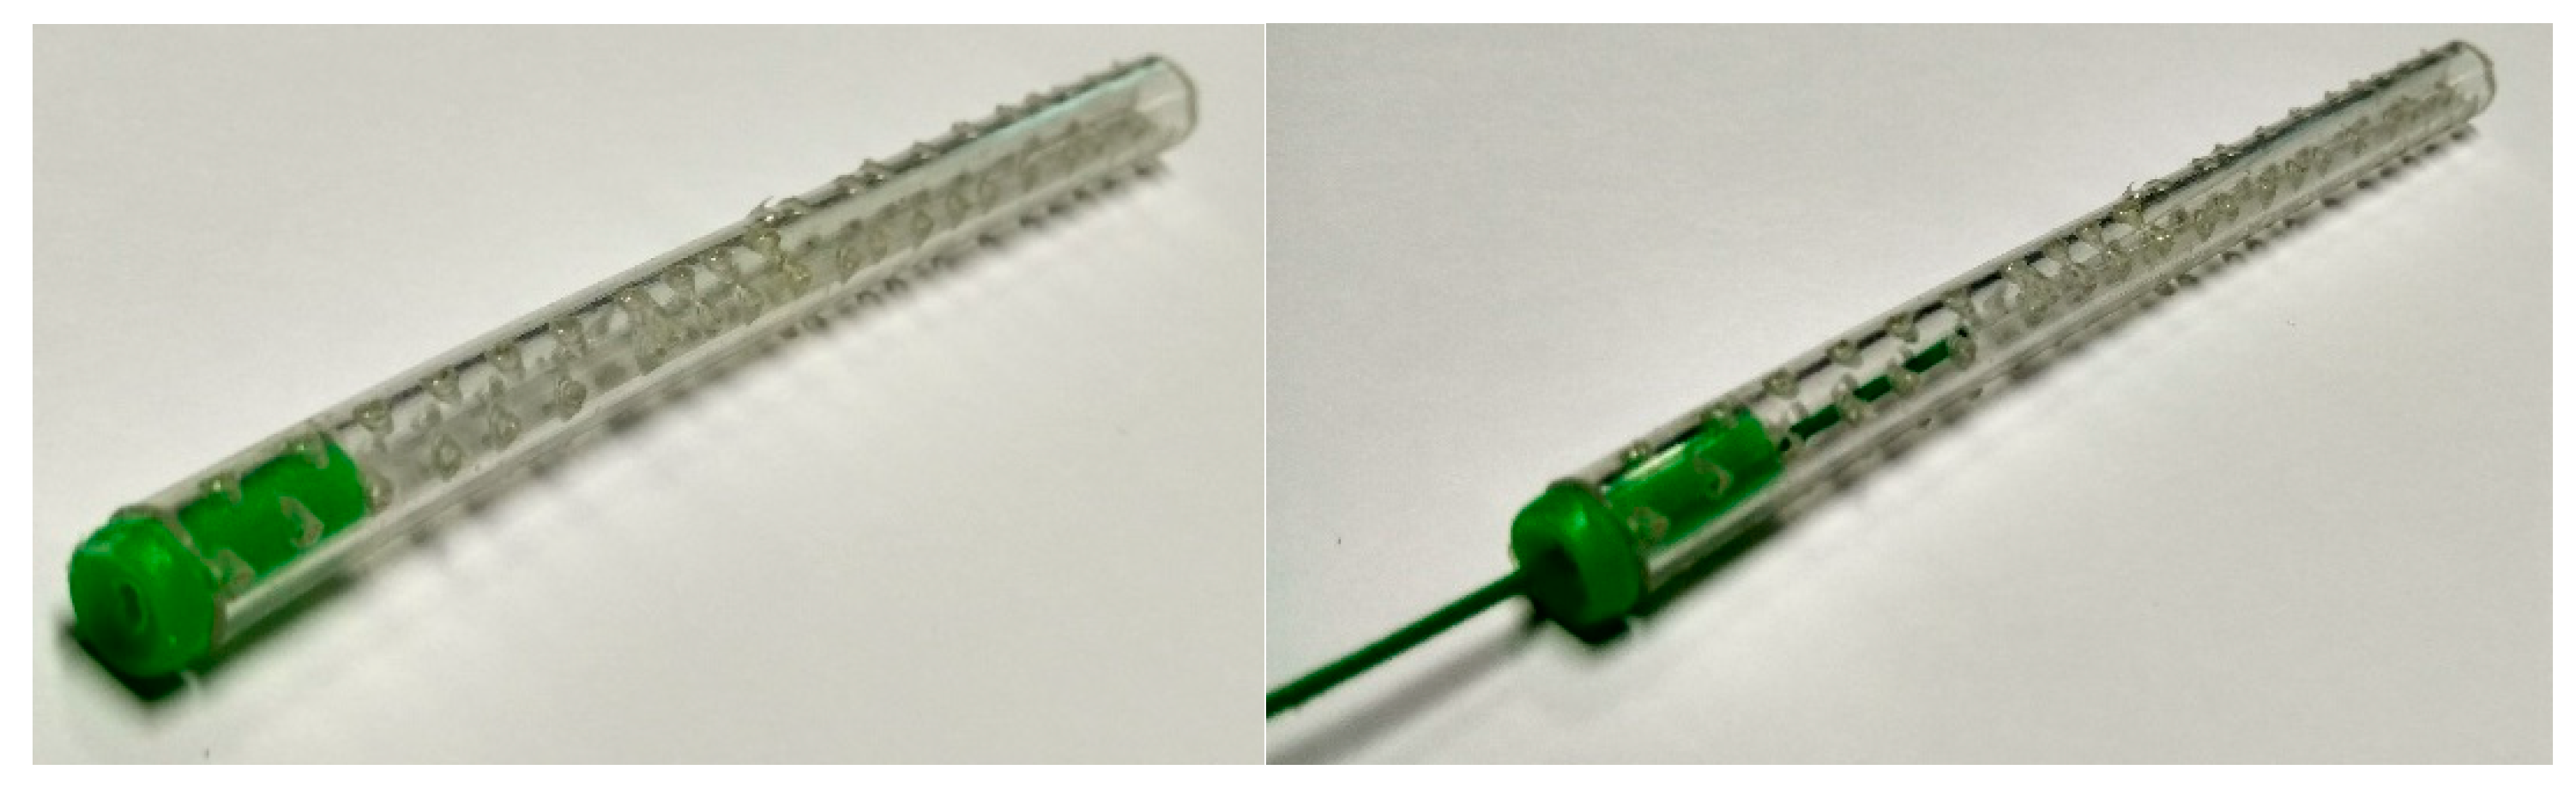
As it can be inferred, the sensing head is very fragile and, moreover, dust inside the MOF holes and in contact with the SnO
2 deposition could lead to measurement errors. In order to avoid this scenario, a protective cap was developed: it consists of a polyvinylchloride (PVC) tube with four arrays of drilled holes (1 mm of diameter) each 5 mm and a cap in one of its ends enabling the access of the optical fiber.
Figure 2 shows the real pictures of the protective cap and the final sensor installed inside the cap.
This PVC protection prevents the optical sensor from any damage during installation as well as undesired elements polluting the sensing material, creating a cavity inside the tube permeable to humidity, so that it can be measured.
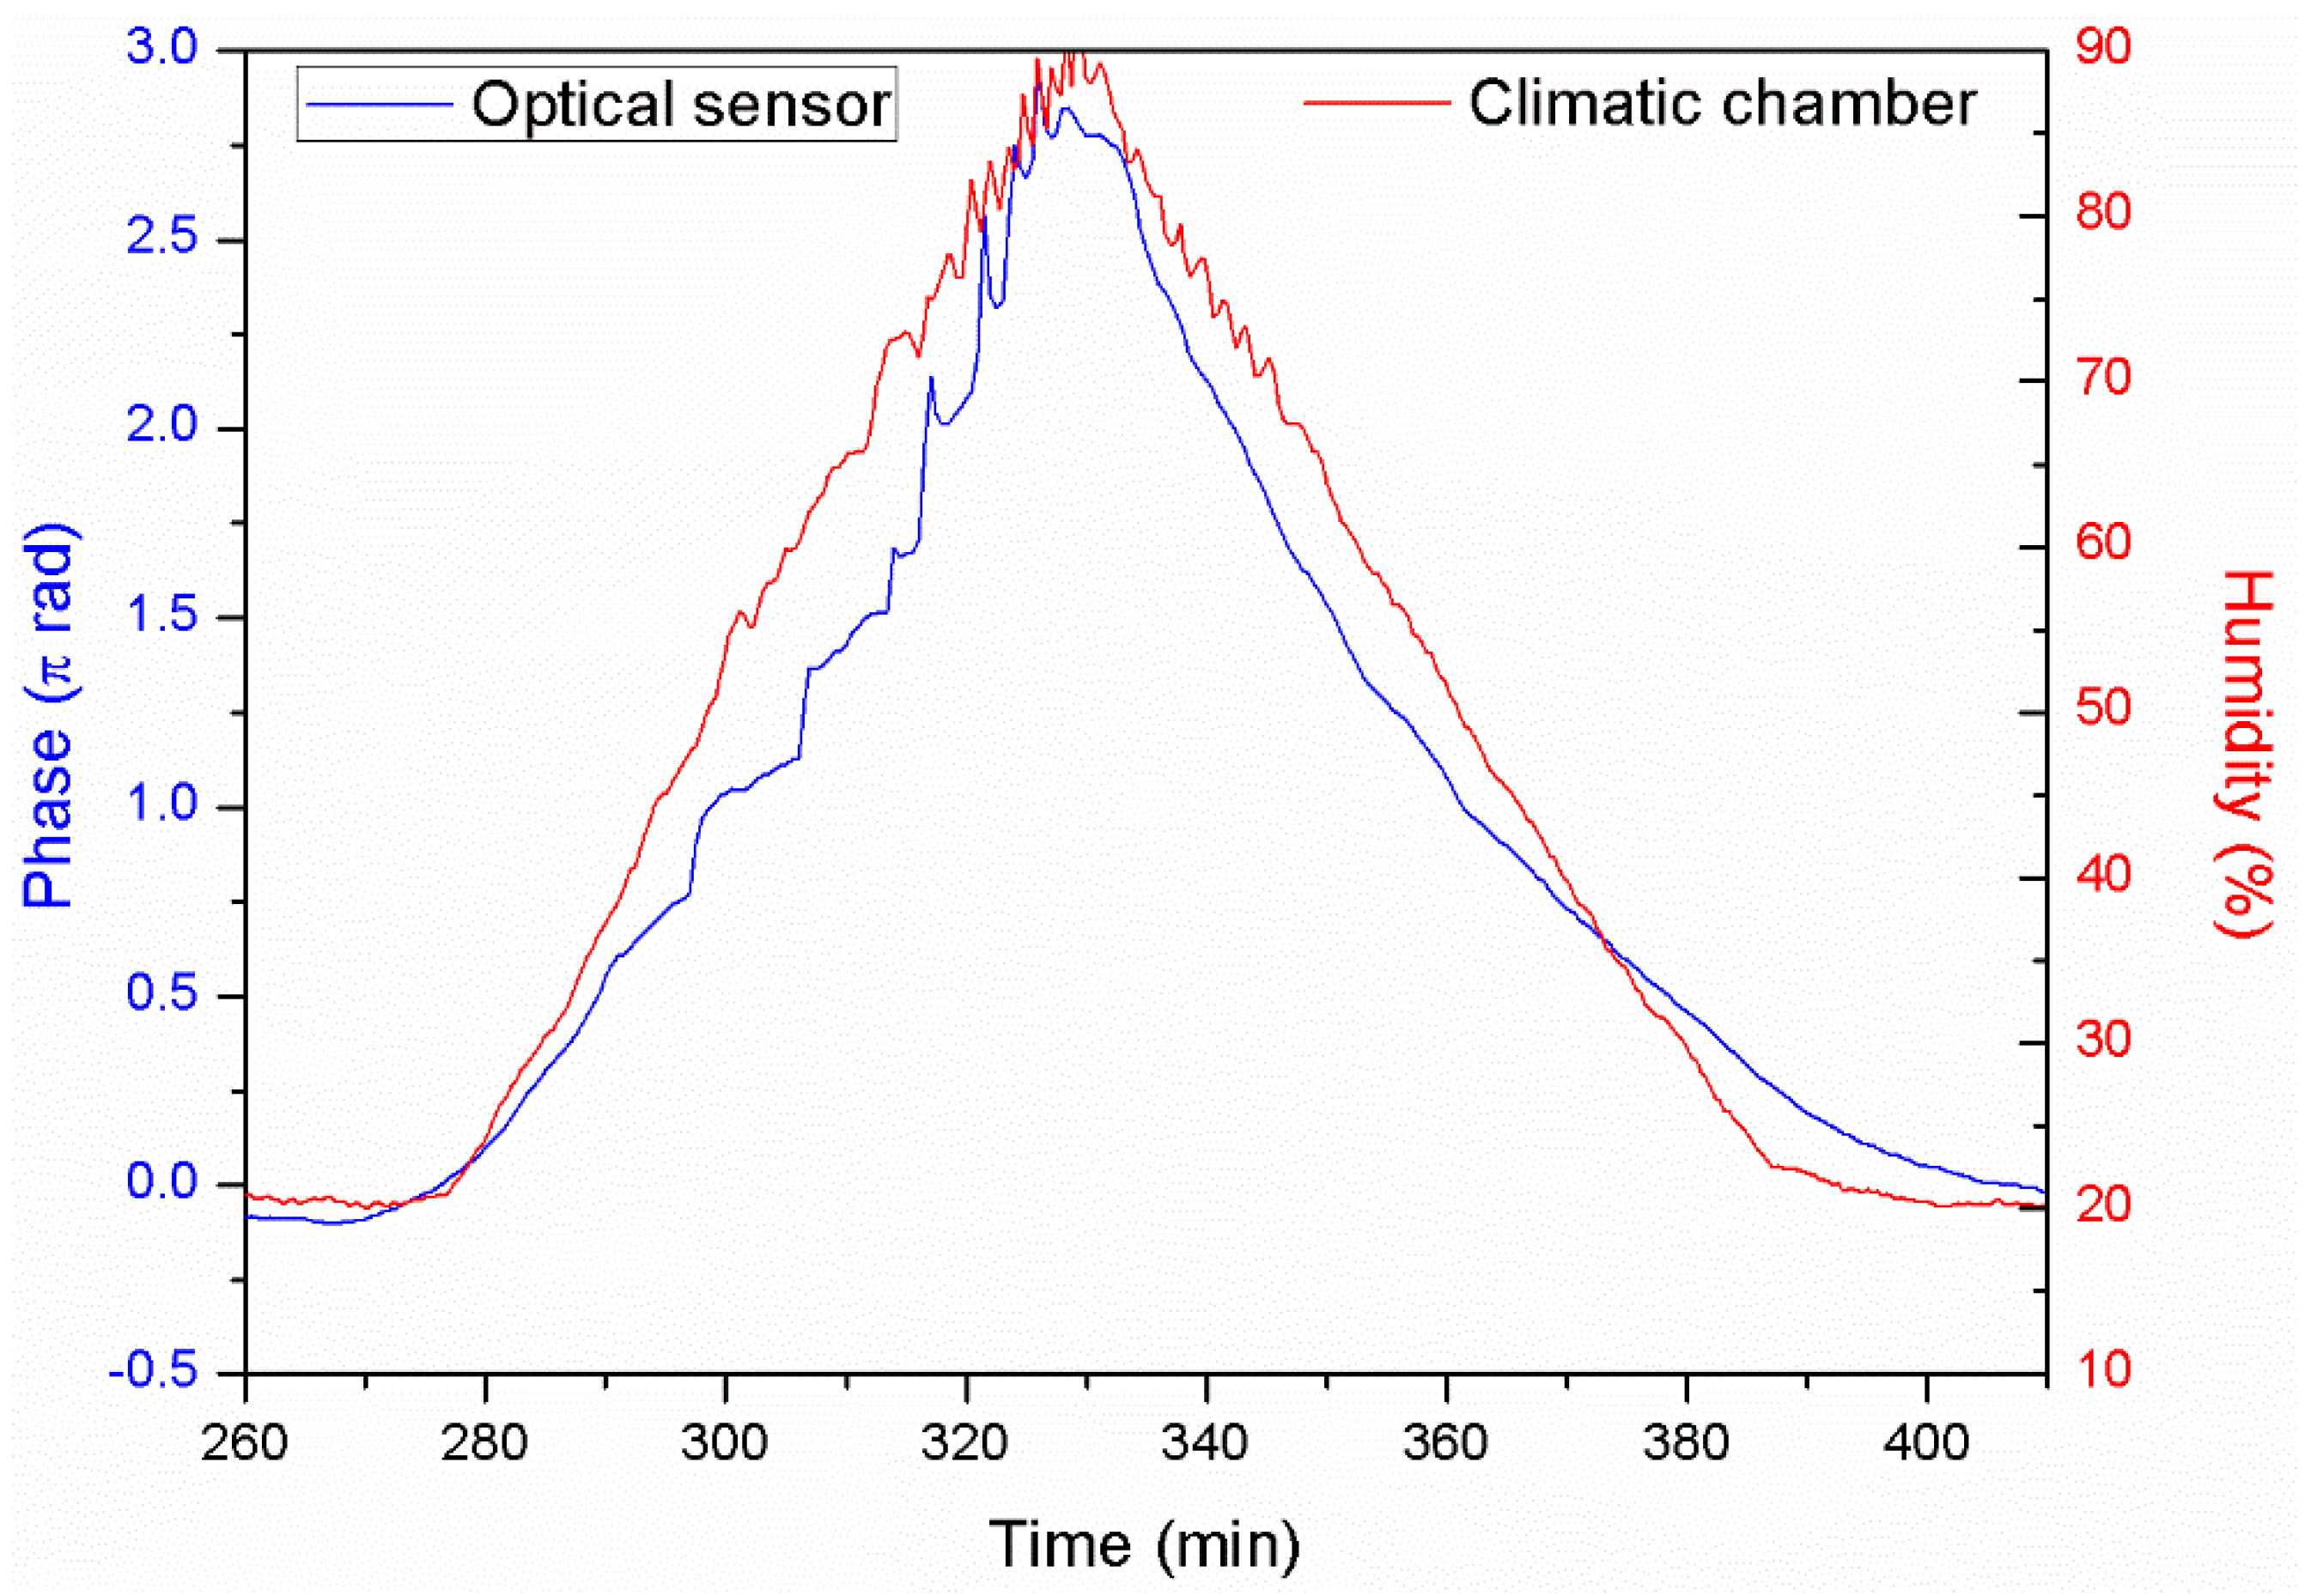
The influence of the protective cap was verified before the installation in the soil in order to verify the correct behavior of the sensing head. The protected sensing head was inserted in a climatic chamber where humidity ranges from 20% to 90% were applied at constant temperature of 25 °C. Results are shown in
Figure 3.
These results show a correct performance of the sensing head towards humidity changes, but with a reduction of its sensitivity in comparison with the case where no protective cap is employed. The delay of the sensors in relation with the climatic chamber is due to the small hysteresis effect induced by the tube. This performance can be improved by optimizing the sputtering deposition time or through the design of a three-dimensional (3D) printed protective cap to achieve optimal results, as shown in [
19].
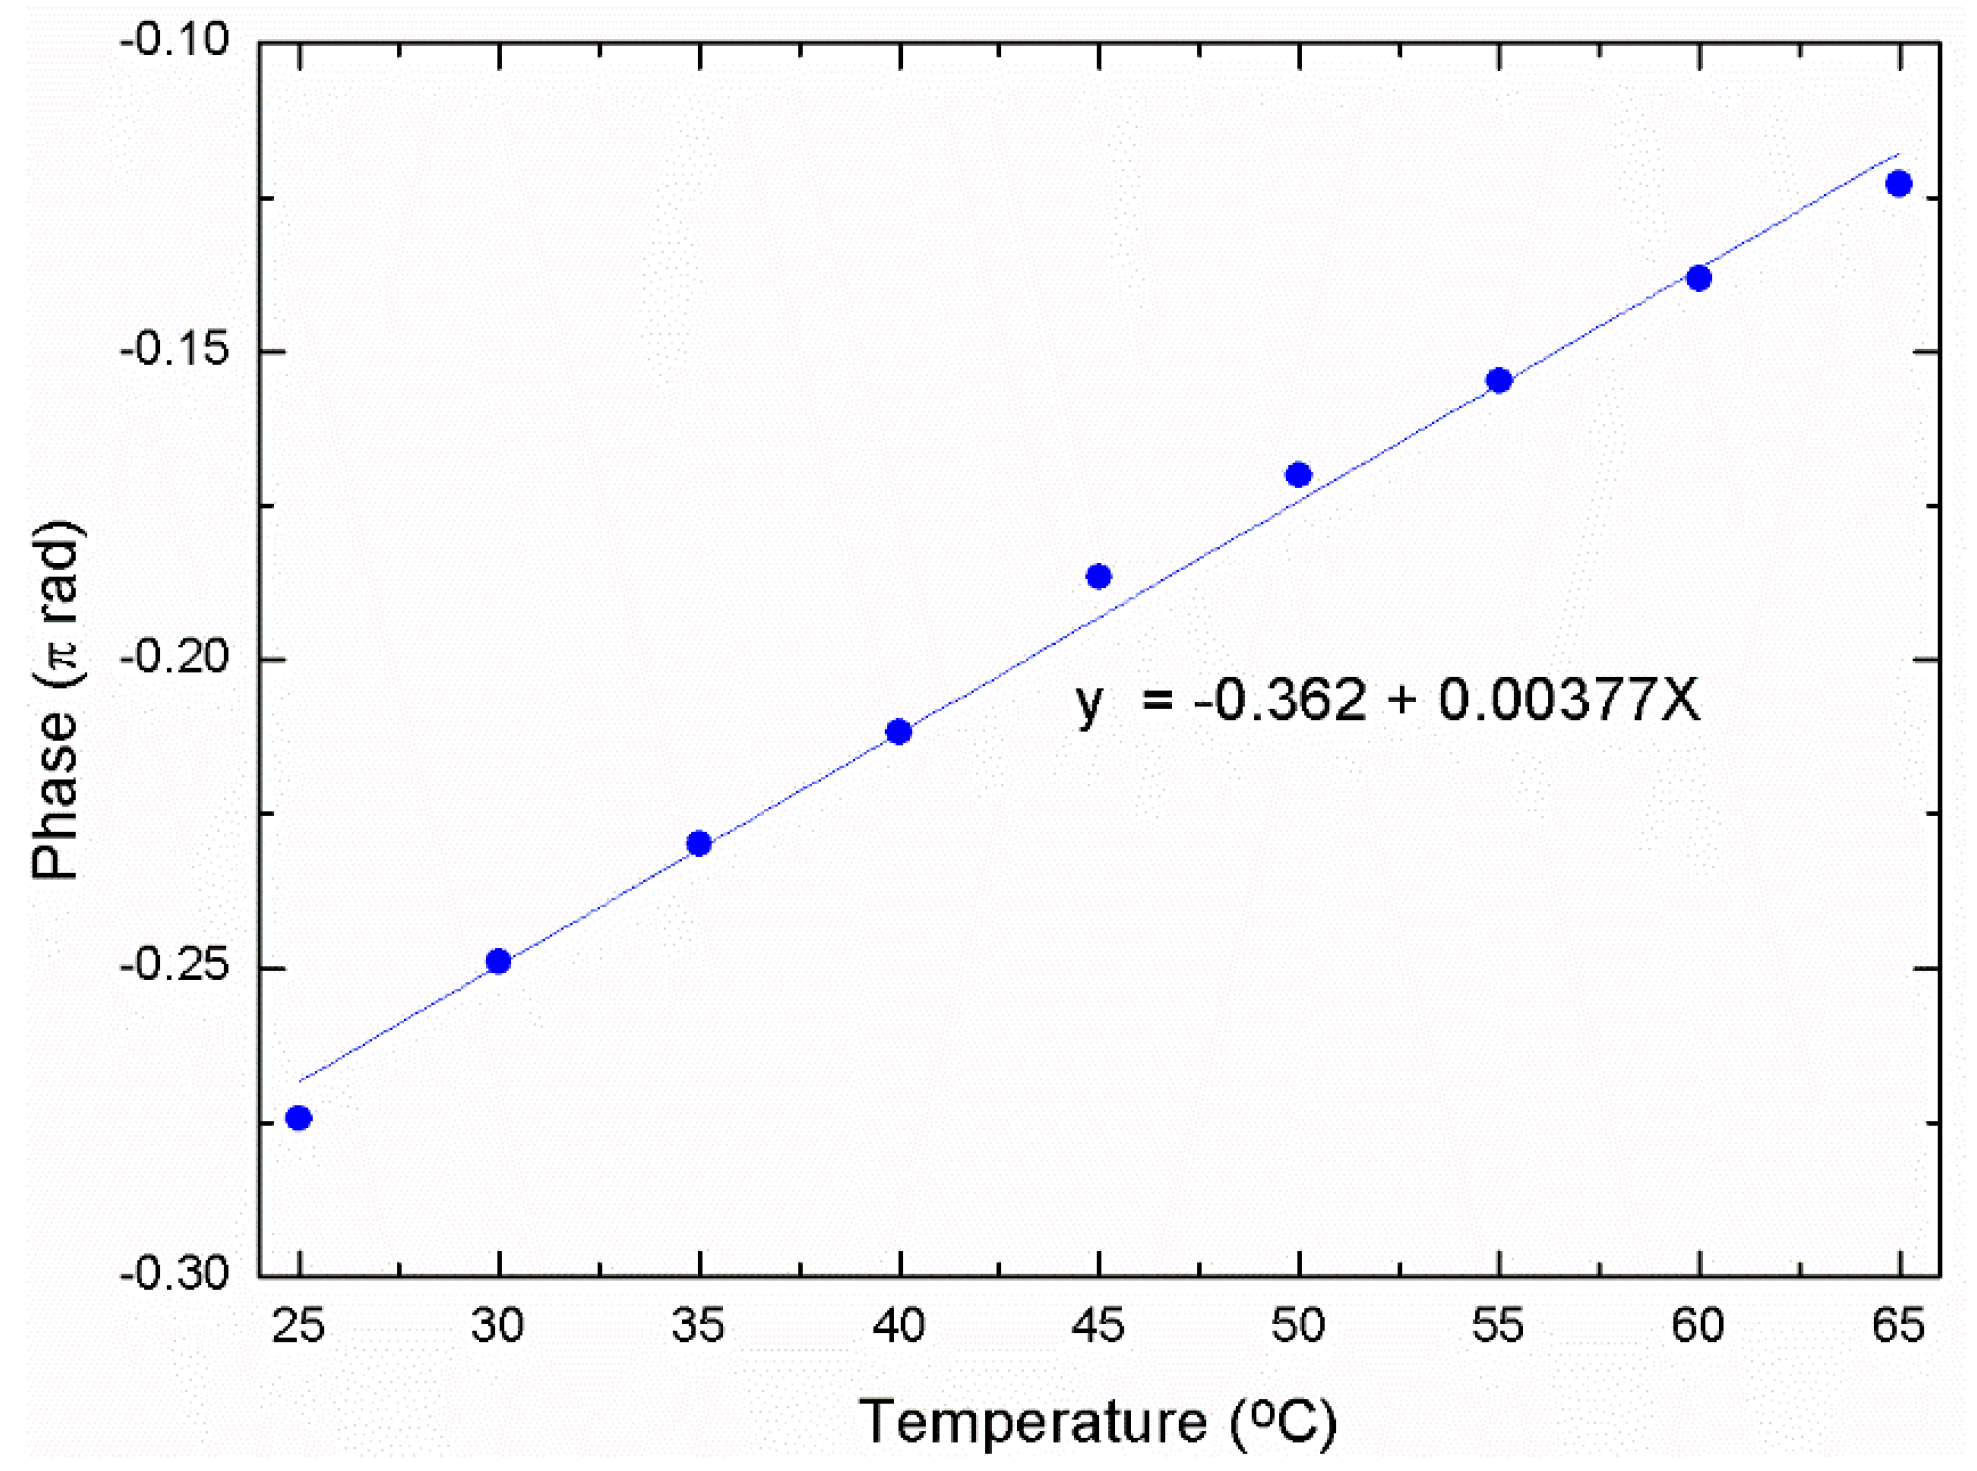
A commercial FBG (sensitivity of 10 p.m./°C) was also monitored at the same time in order to measure the temperature variations inside the soil sample and compensate the optical sensor’s deviations. Temperature variations affect directly on a FP cavity as they modify the cavity length due to the thermal expansion of the silica. These variations produce a wavelength shift or analogously a FFT phase shift. Once known the variation of temperature through the FBG and the sensitivity of the MOF sensing head to temperature variations it can be directly compensated by subtracting the wavelength shift–FFT phase shift to the MOF’s results.
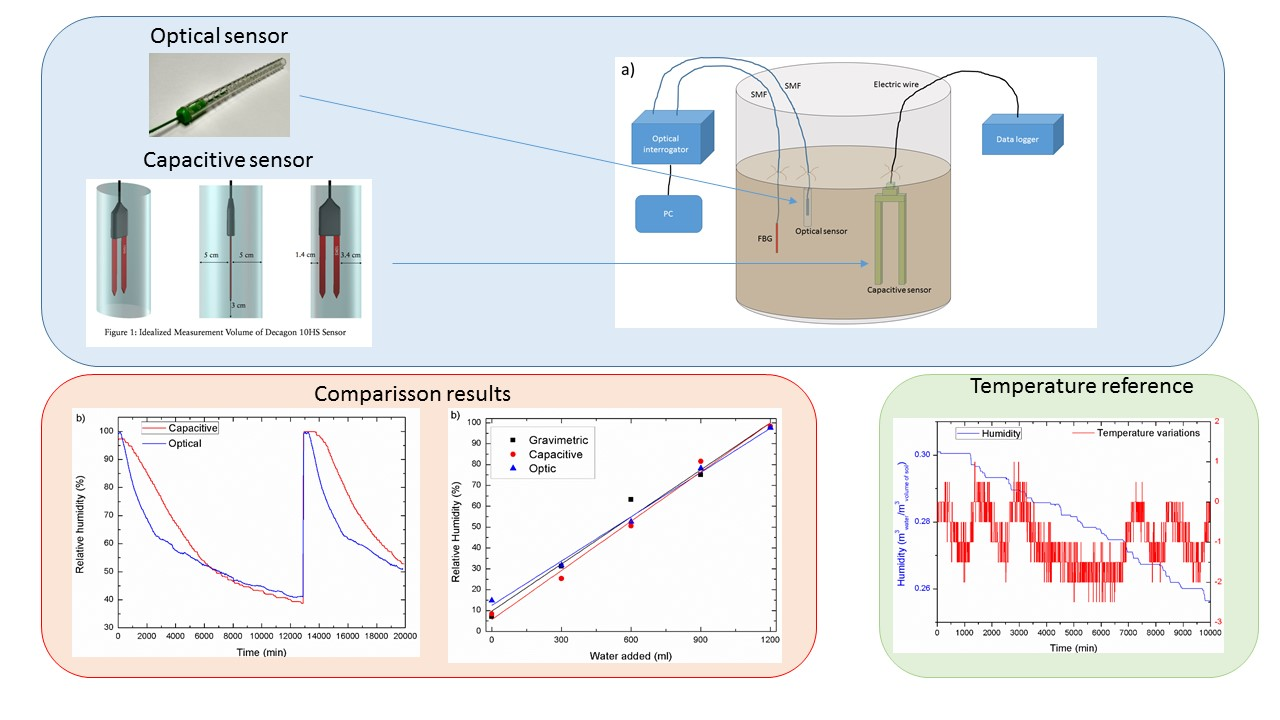
A commercial interrogator equipment for FBGs based sensors (SM125, SMARTEC, Lugano, Switzerland) was used to illuminate the network and also to analyze the spectra of the signals reflected from the sensors. The interrogating equipment has a sampling frequency of 1 Hz [
33], four different channels, and is remotely controlled through a MATLAB software (MathWorks, Natick, MA, USA) that also executes a FFT real time analysis. This analysis consists of tracking the FFT phase corresponding to the FFT module main component located at 0.8 nm
−1, as shown in in
Figure 1b. The main advantage of this technique is the negligible influence of noise (high frequency components) and signal amplitude undesired variations. Moreover, choosing correctly the MOF lengths, several FP sensors could be multiplexed within a single optical interrogators channel through common optical couplers, as it has been demonstrated by authors in [
34,
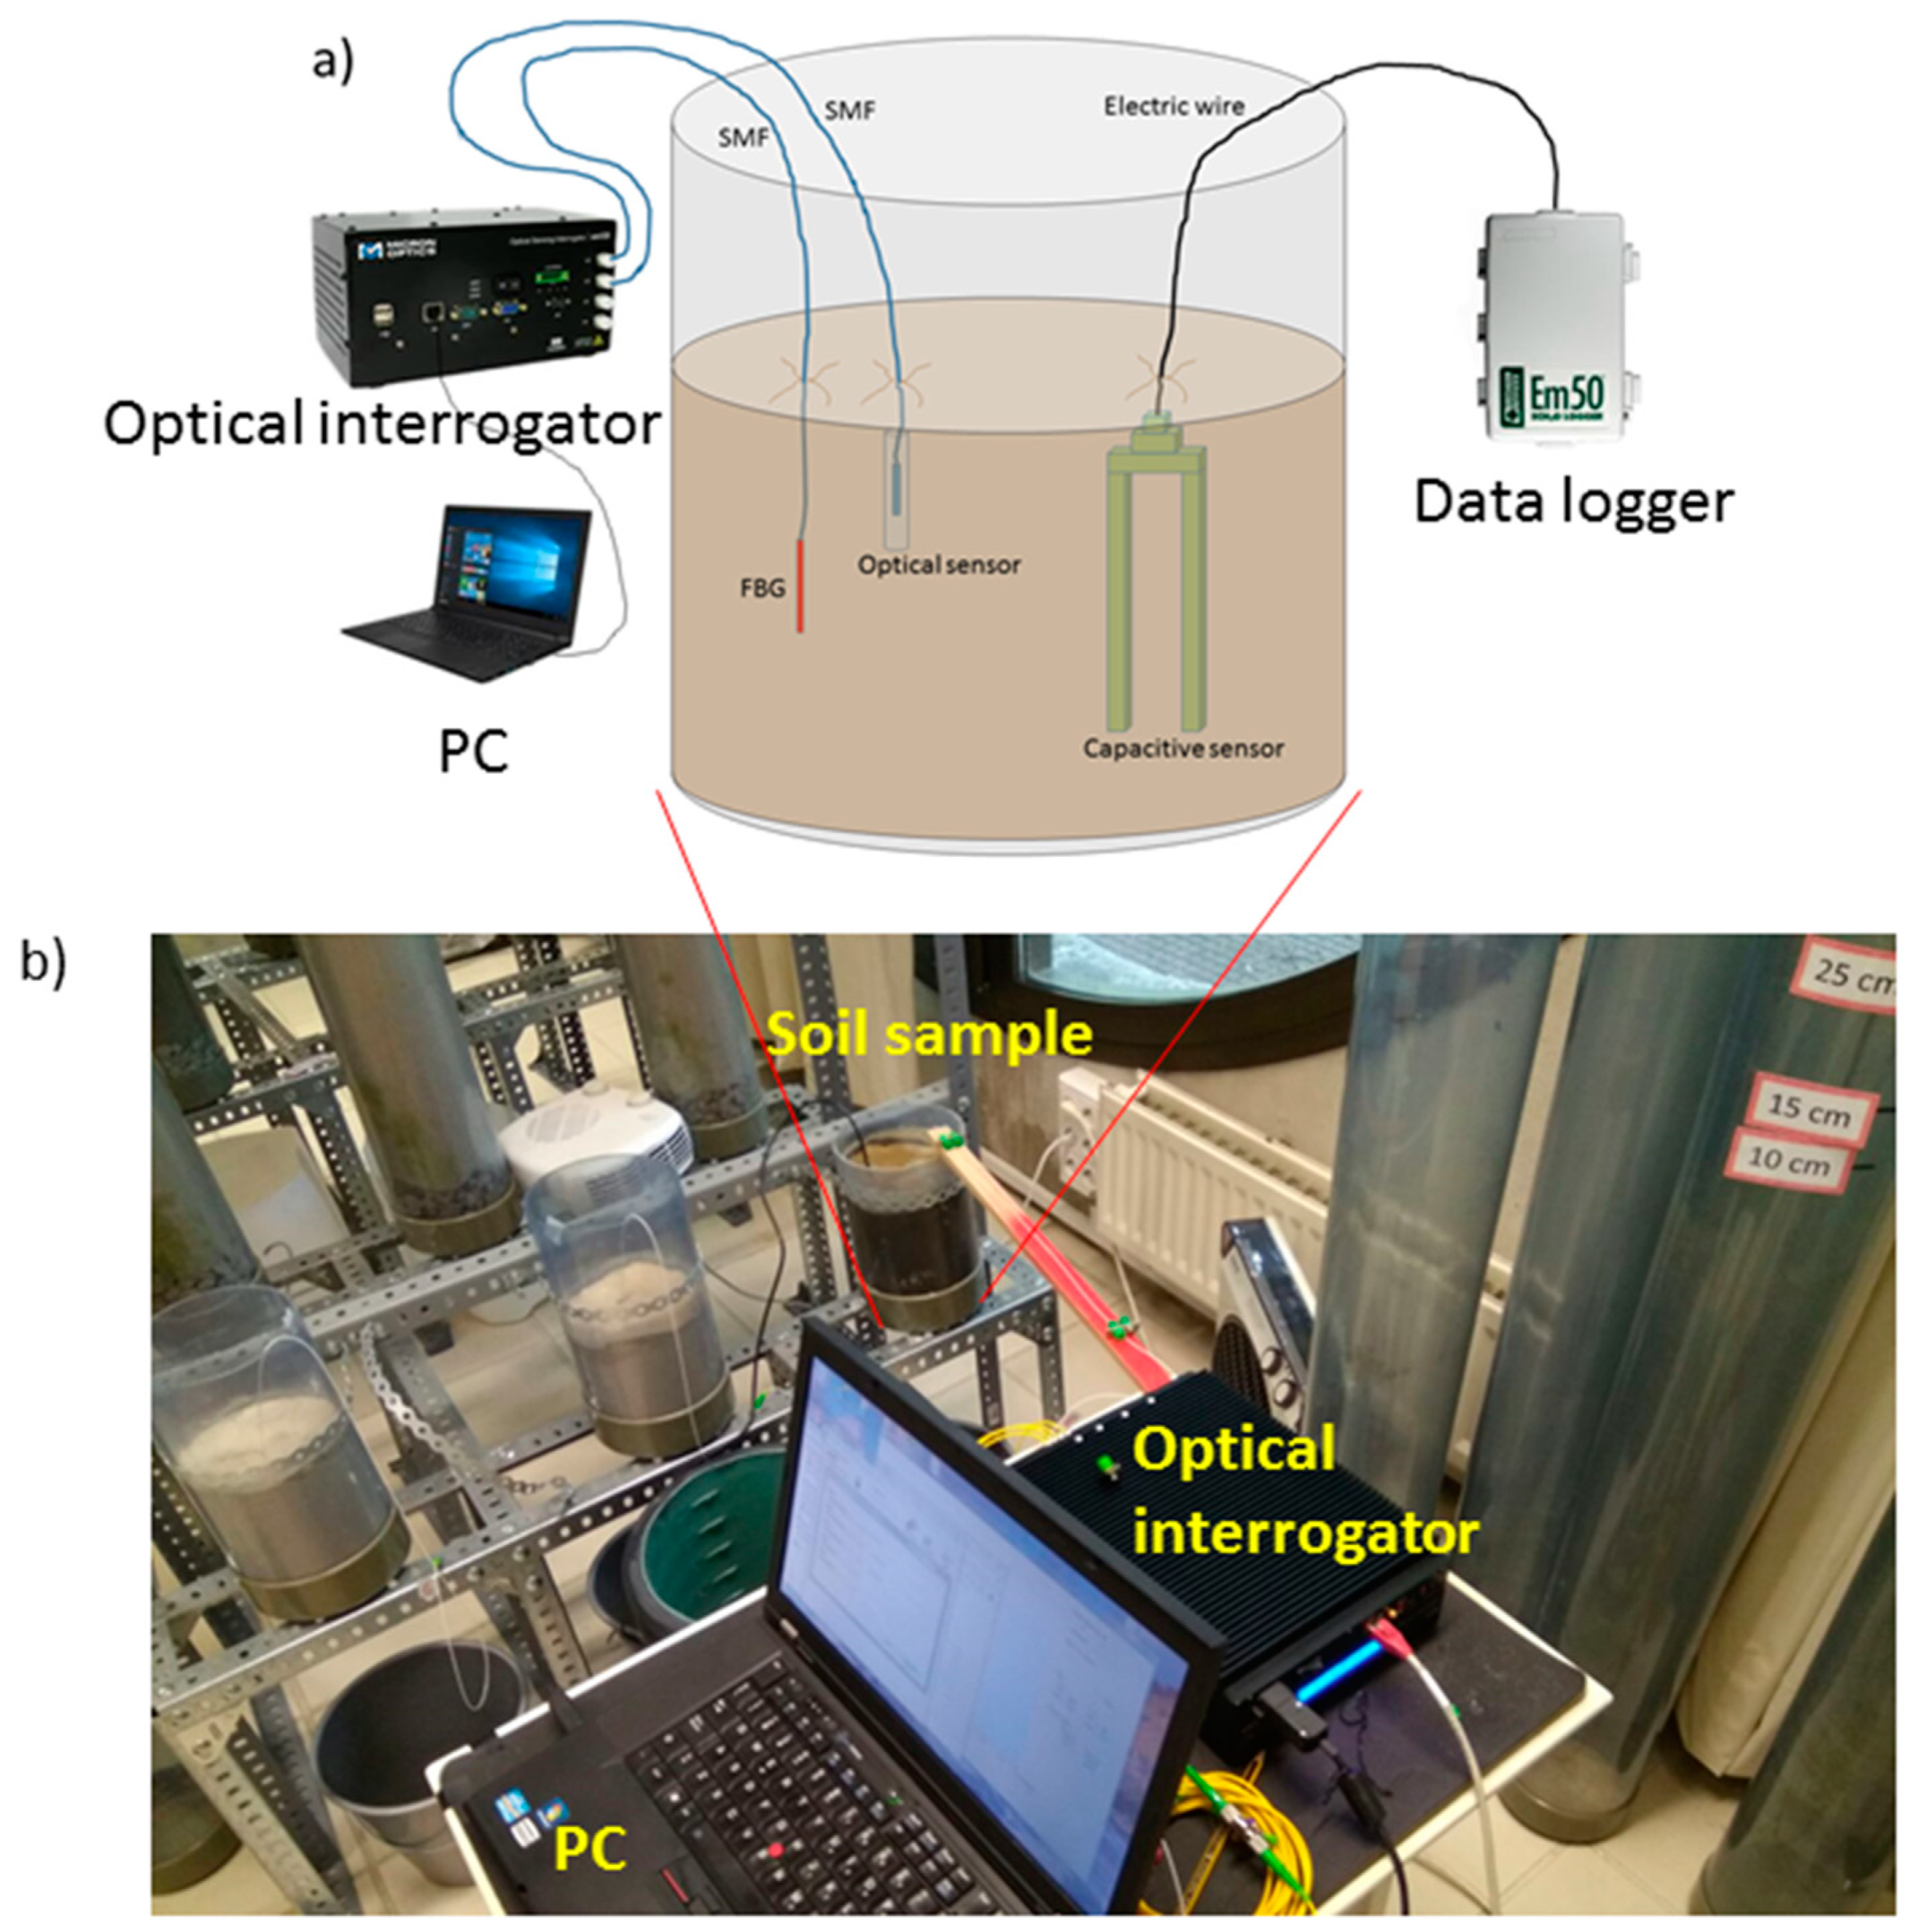
35]. The three sensors where buried in the soil, as
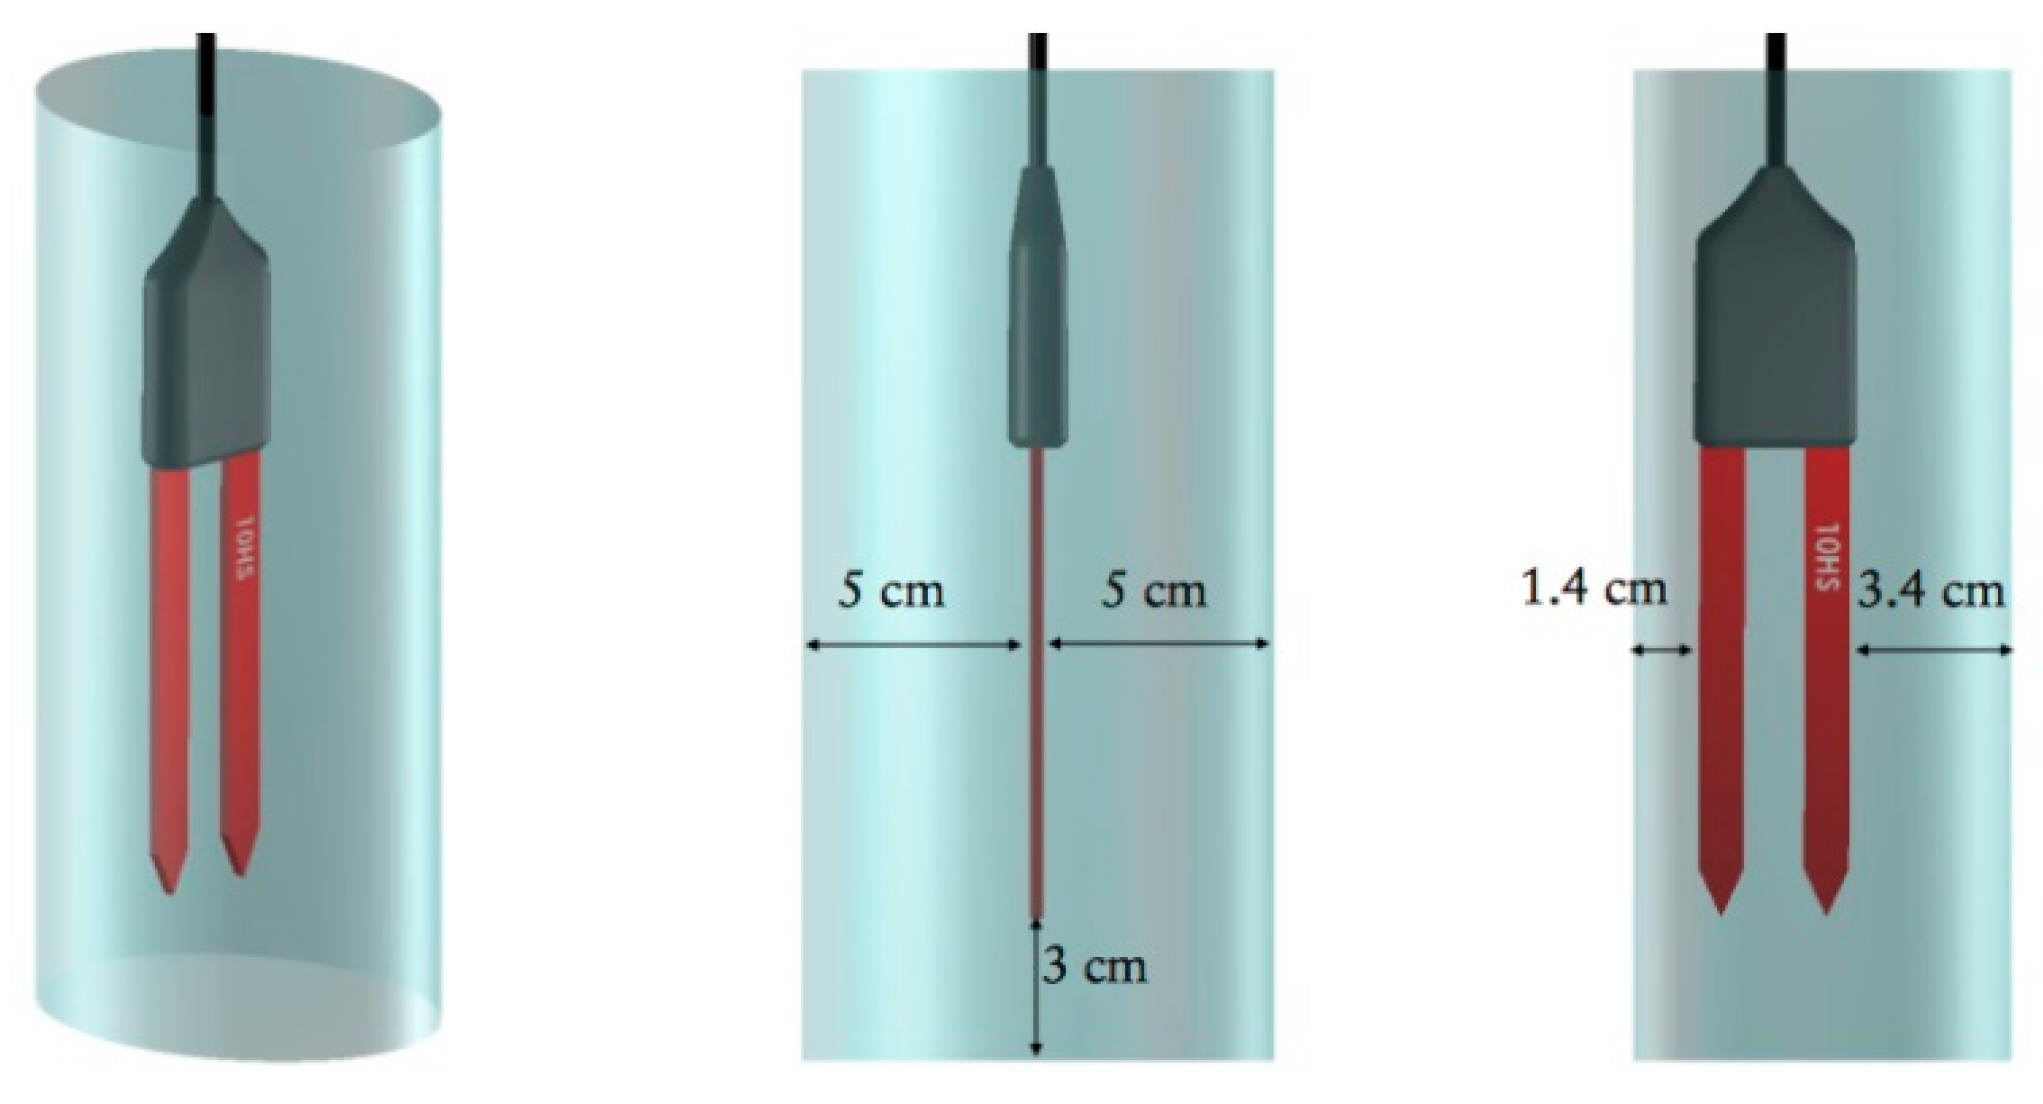
Figure 4 illustrates.
The optical sensors were placed at the same radial distance from the soil center as the capacitive sensor and buried ~10 cm deep (trying to be at the mid depth of the capacitive sensor). In this study, two different types of soil were tested in order to check the performance of the optical sensor in comparison with the capacitive one. The first porous media was a silica sand specified for use in pool filters, water purification, and sports fields. The soil texture was defined as sand [
36], 100% sand. The second one was a mix of 50% weight of the silica sand and 50% weight of a contrasting natural soil texture classified as clay loam, 28% sand, 36% silt, and 36% clay [
36].
4. Discussion
Results shown in
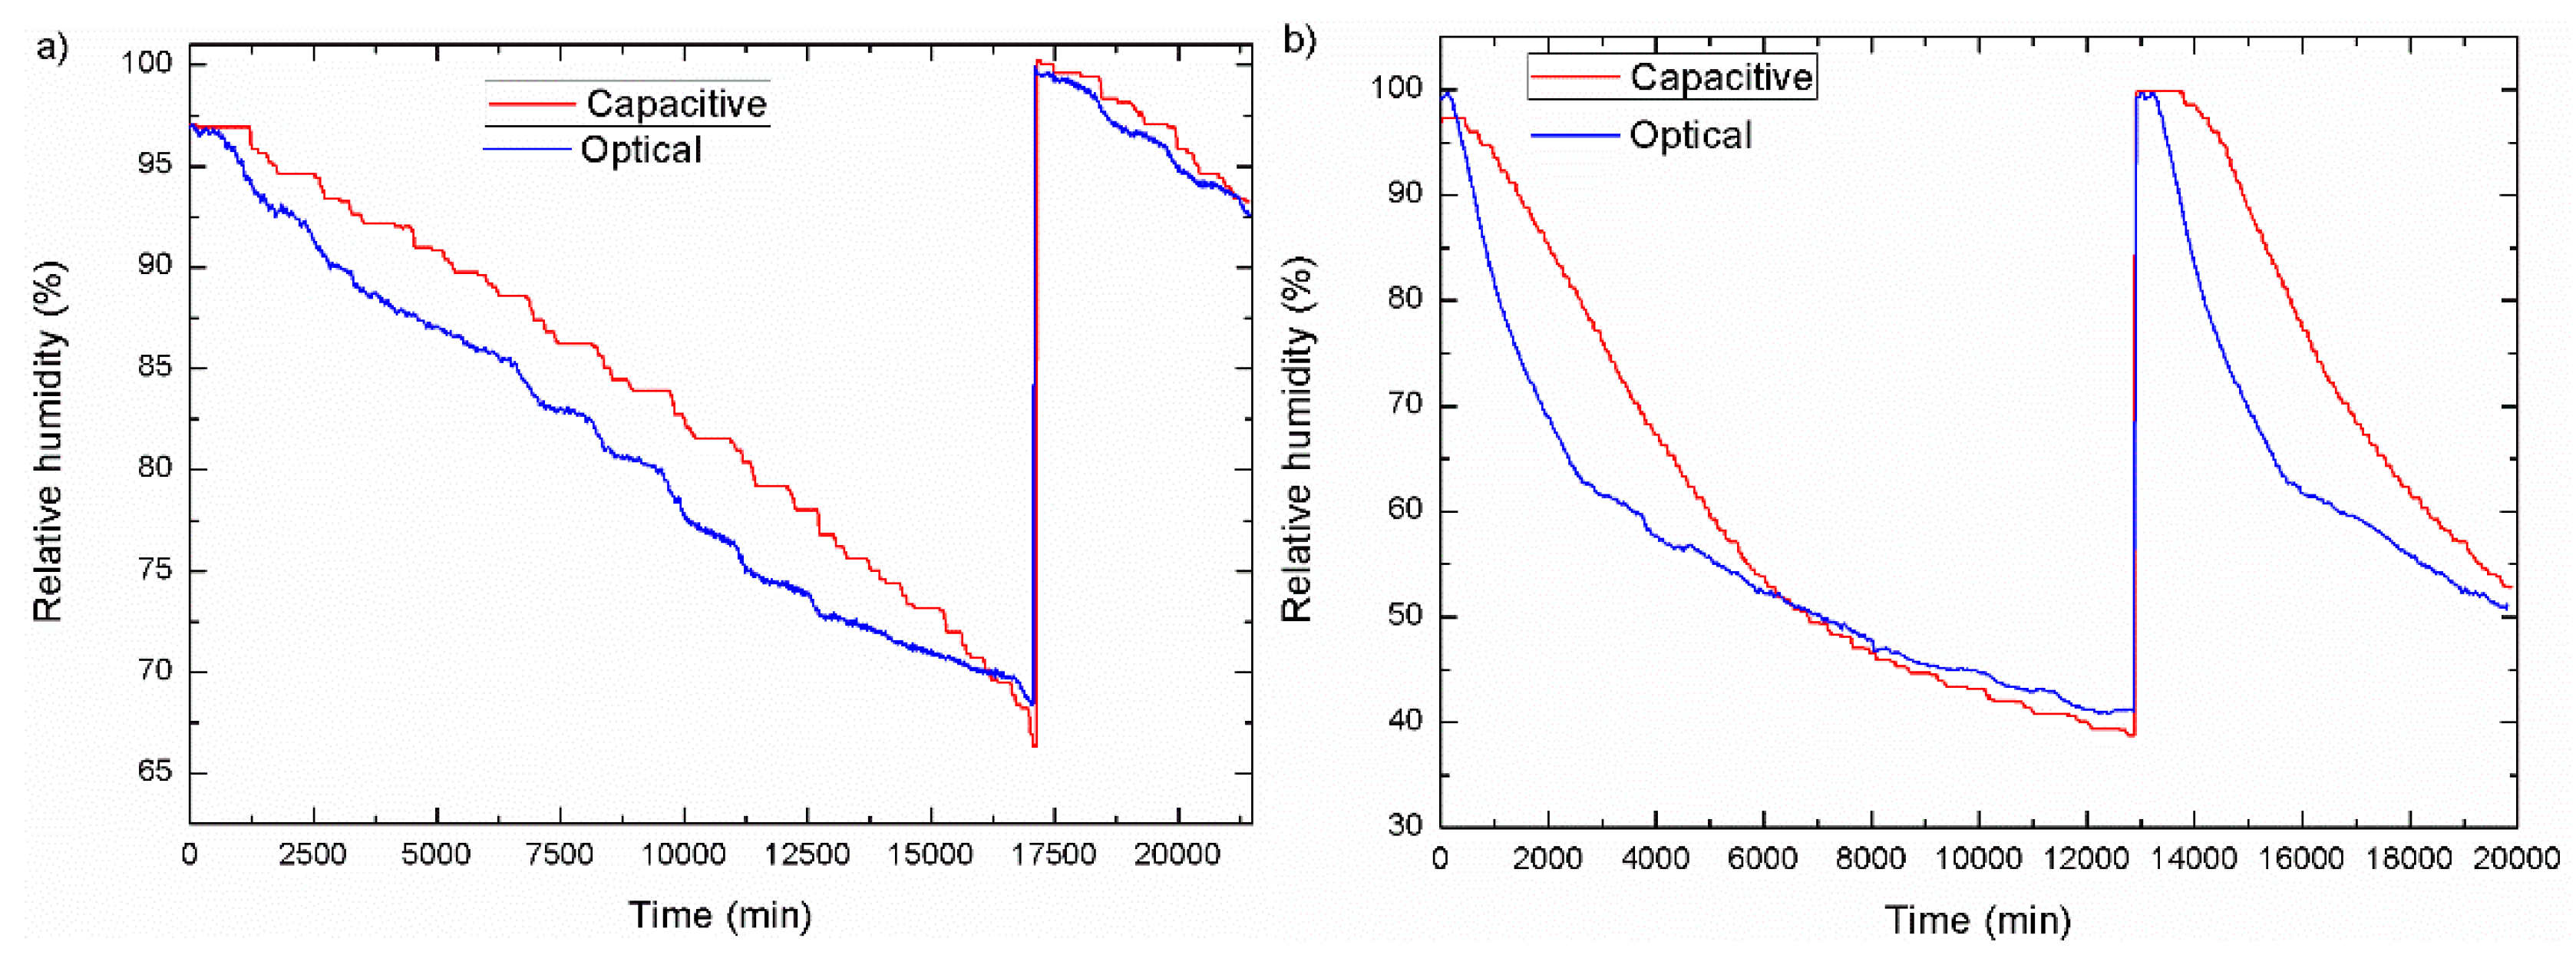
Section 3 in overall show an agreement between capacitive sensors, MOF–FP optical sensors, and gravimetric measurements in (two) different types of soil.
One of the main differences between capacitive and optical results can be seen in
Figure 5. There, it can be noticed differences in the time response to humidity changes between both sensors. It is due to two important factors: devices size and type of measurements. On the one hand, capacitive sensors that are used in this study have dimensions of 14.5 cm × 3.3 cm × 0.7 cm and they give us volumetric measurements by measuring the dielectric constant of the soil, as shown in
Figure 10. On the other hand, MOF-FP based sensors have very reduced dimensions (0.7 mm × 125 μm) without the protective cap. This cap is a cylinder 4 cm long having 0.8 cm of radius. The sensing head measures the humidity that is directly in contact with it. Therefore, it can be concluded that capacitive sensors are field sensors in opposition to point optical sensors. Due to this difference, the optical sensor is very sensitive to point humidity changes very close to the sensing head while capacitive measures all of the humidity comprised around it, being less sensitive to local variations.
Table 1 shows the measured errors between optical—capacitive sensors and optical sensor—gravimetric measurements. As previously commented, gravimetric measurements present great variations due to the employed technique and its variability depending on the measuring conditions. Therefore, the errors measured between optical or capacitive sensors and gravimetric in some points (i.e., in
Figure 9b) at 63% RH in gravimetric measurements) are higher than expected, as can be seen in the case of the maximum error between optical sensor and gravimetric measurement.
Another difference shown in the results from capacitive and optical sensors in
Figure 6 and
Figure 7 is a measuring error when humidity is close to 0%. This is due to the different nature of the sensors. On the one hand, capacitive sensors measure the dielectric constant of the soil and therefore the content of water in soil: moisture. On the other hand, optical sensors measure refractive index variations that are produced by the presence of soil moisture. Relative humidity can be described, as follows:
where
Pw is the water vapor pressure and
Pws is the water vapor pressure in saturation and it is a function of temperature [
28].
The term humidity usually makes reference to the presence of water in gaseous form, but it is often used to refer to expressions that are related to water vapor characteristics and in the field of measurement, there are various terms associated with such water vapor measurements. In addition, the term moisture is frequently interchanged with humidity even though the actual definition of moisture refers to the water in liquid form that may be present in solid materials [
37]. Since humidity is a measure of water in gaseous state present in the environment, water vapor found in a gas mixture behaves in accordance with the gas laws and the amount of pressure it exerts equates to the partial pressure of the water vapor components in the gas mixture, as defined by Dalton’s law [
37].
To set a reference between capacitive sensors and optical sensors when the soil is saturated, the air in holes inside the soil (and therefore the cavity created by the optical sensor) is saturated too, and as a conclusion, both of the sensors show 100% of humidity and relative humidity, respectively.
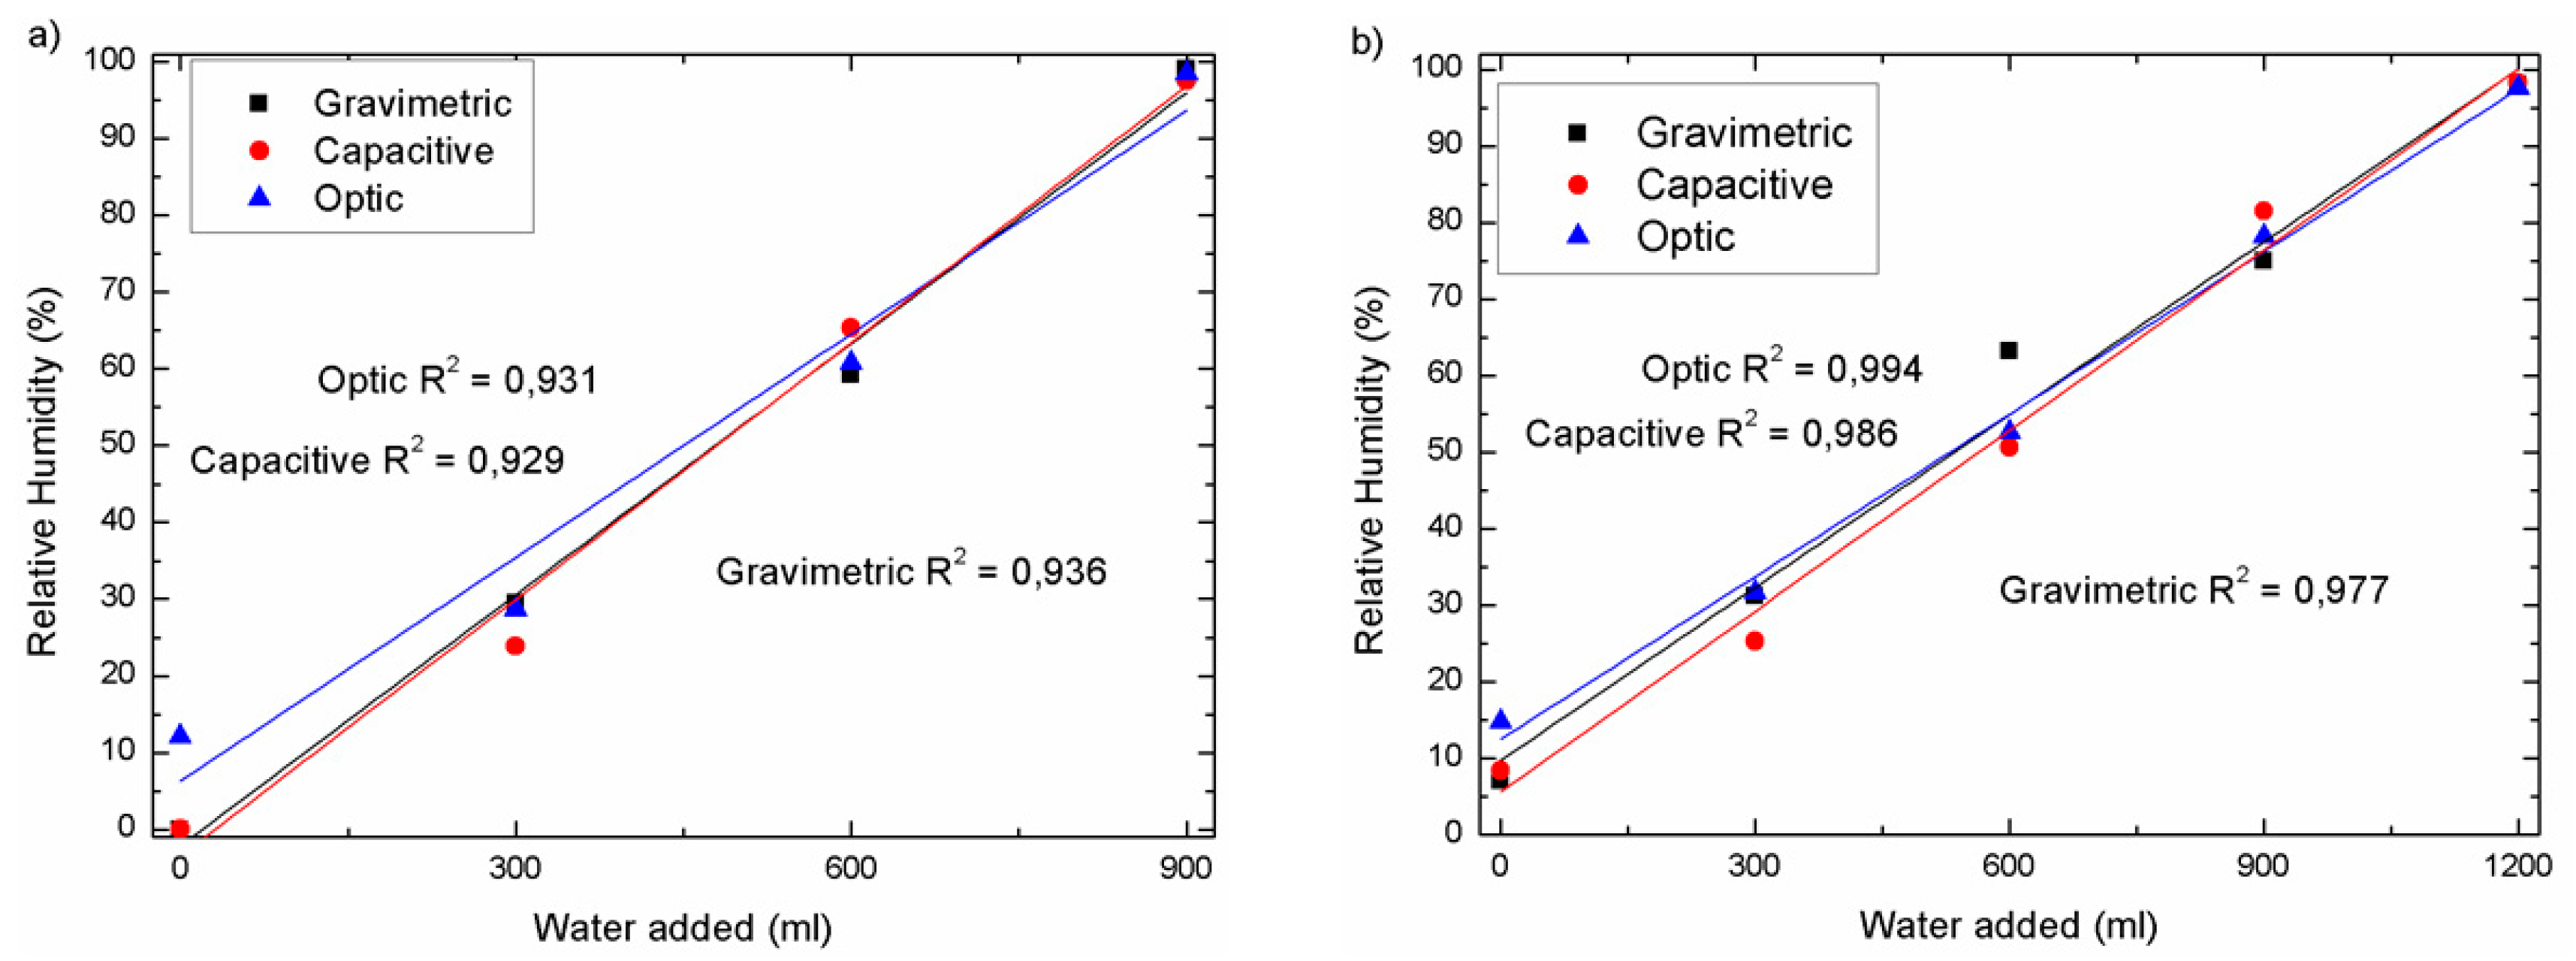
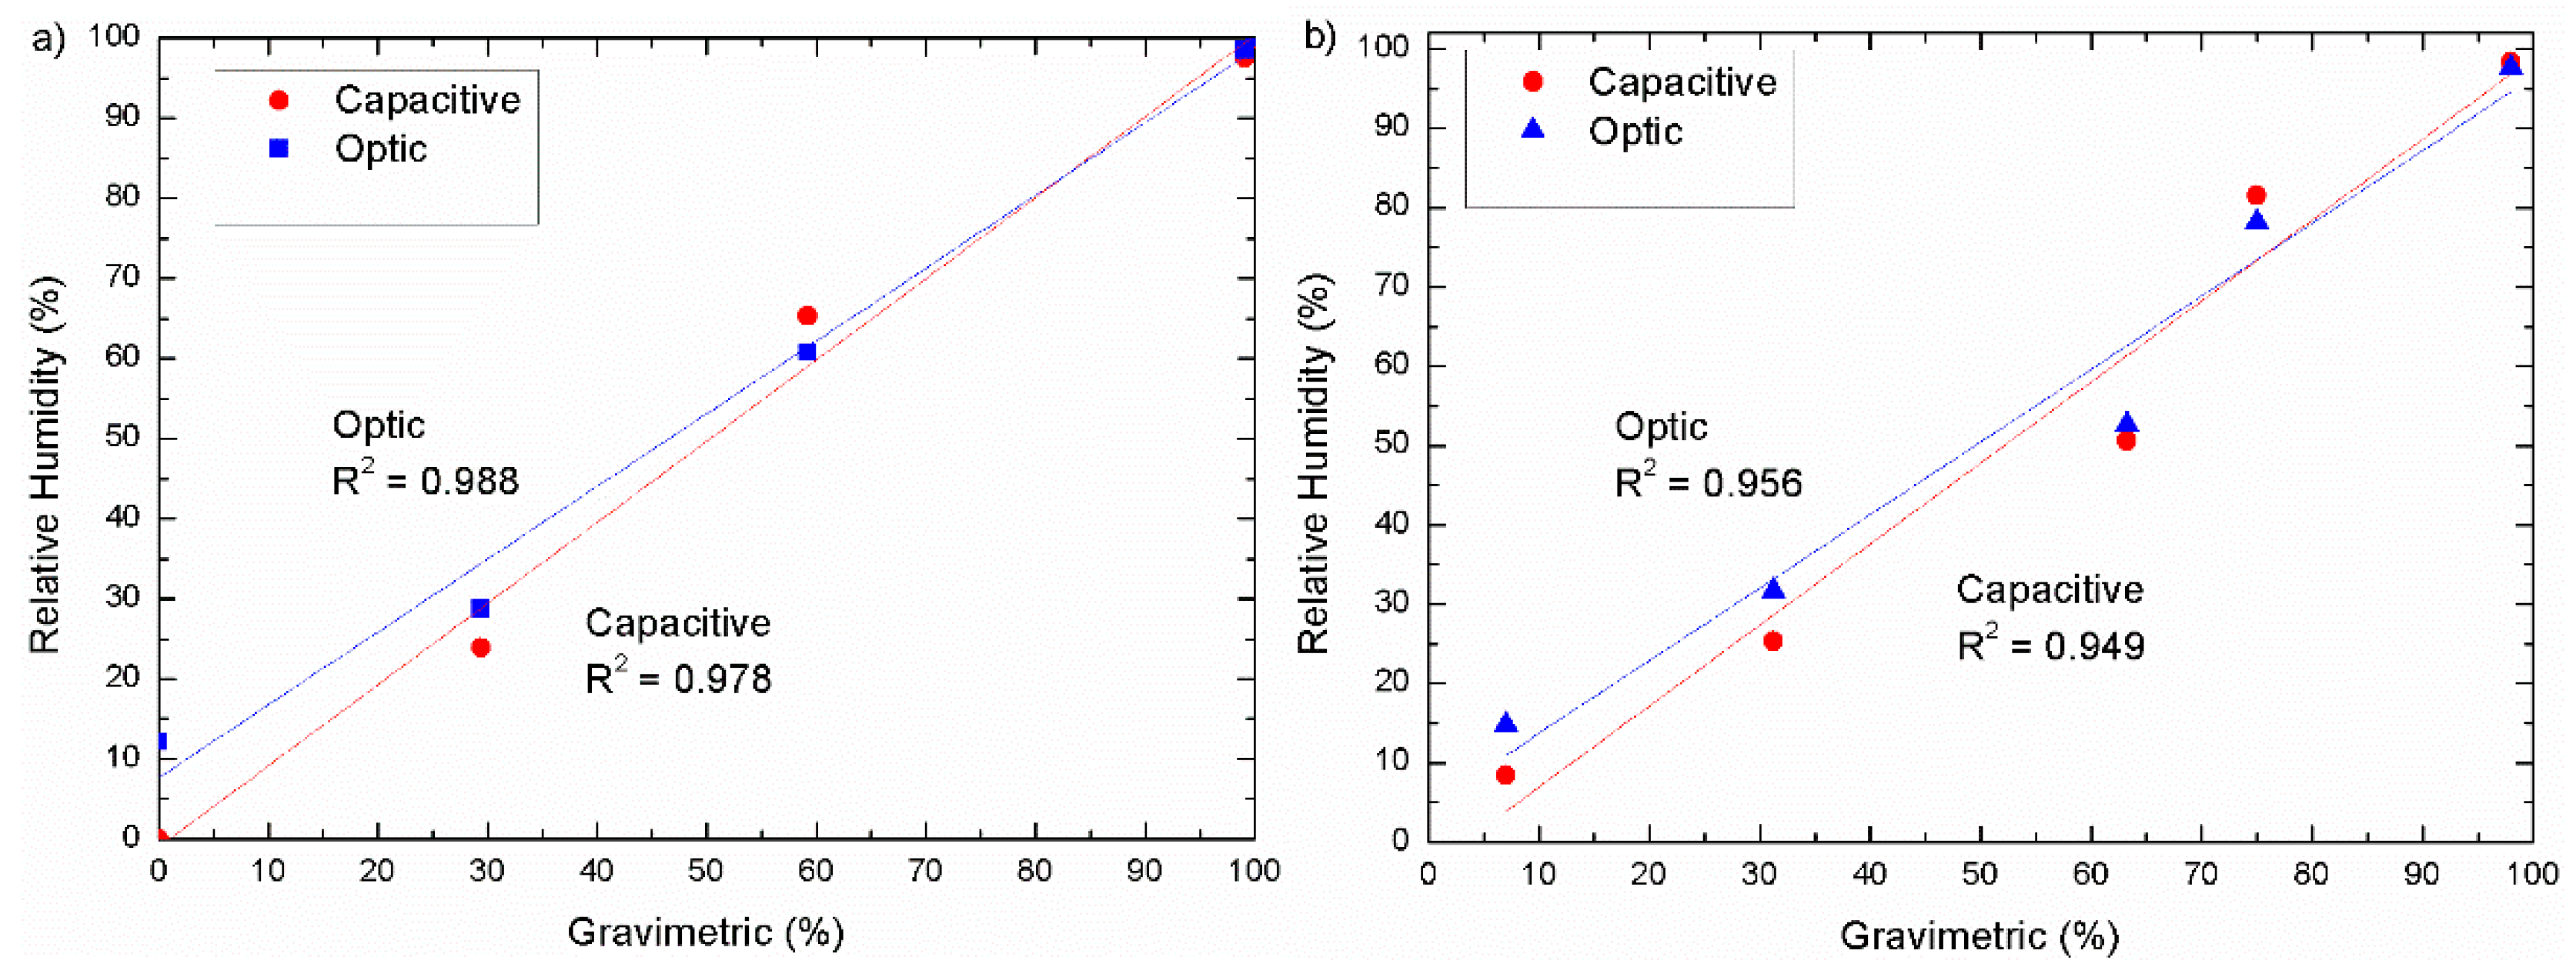
As can be seen in
Figure 8 and
Figure 9, both of the sensors work similarly in high humidity scenarios. The difference arises when the soil approaches to 0% humidity. Due to the nature of the optical sensor and its operation principle measuring the water present in air it becomes impossible to reach 0% of relative humidity while capacitive sensor can reach such low values. As a conclusion, the optical sensor is not suitable for environments of very low humidity (under 15%).
Additionally, as can be noticed in
Figure 8, both of the graphs present different x-axe length. This is due to the fact that, Soil2, as a result of its composition, is able to retain more water than Soil1, and therefore, an additional 300 mL was needed to reach the saturation stage.
The last difference in the results can be seen in the X axis of
Figure 7a,b.
Figure 7a shows the results of the natural evaporation process in indoor conditions. As it can be seen, there is a very slow kinetic and humidity decreased ~30% in 12 days. To accelerate this process, for Soil2 measurements (
Figure 7), two heating fans where placed close to the sample. Temperature variations were compensated as explained before. A significant difference can be seen as the humidity decreased ~60% in 9 days.
An important aspect to comment is the difficulty to perform accurate gravimetric measurements as they are very dependent on the experiment conditions. It has been demonstrated that the optical sensor can be used as a reference to measure moisture above 15%, avoiding imprecise gravimetric measurements. As previously commented, below this level, optical sensor decreases its sensitivity due to its measuring working principle.
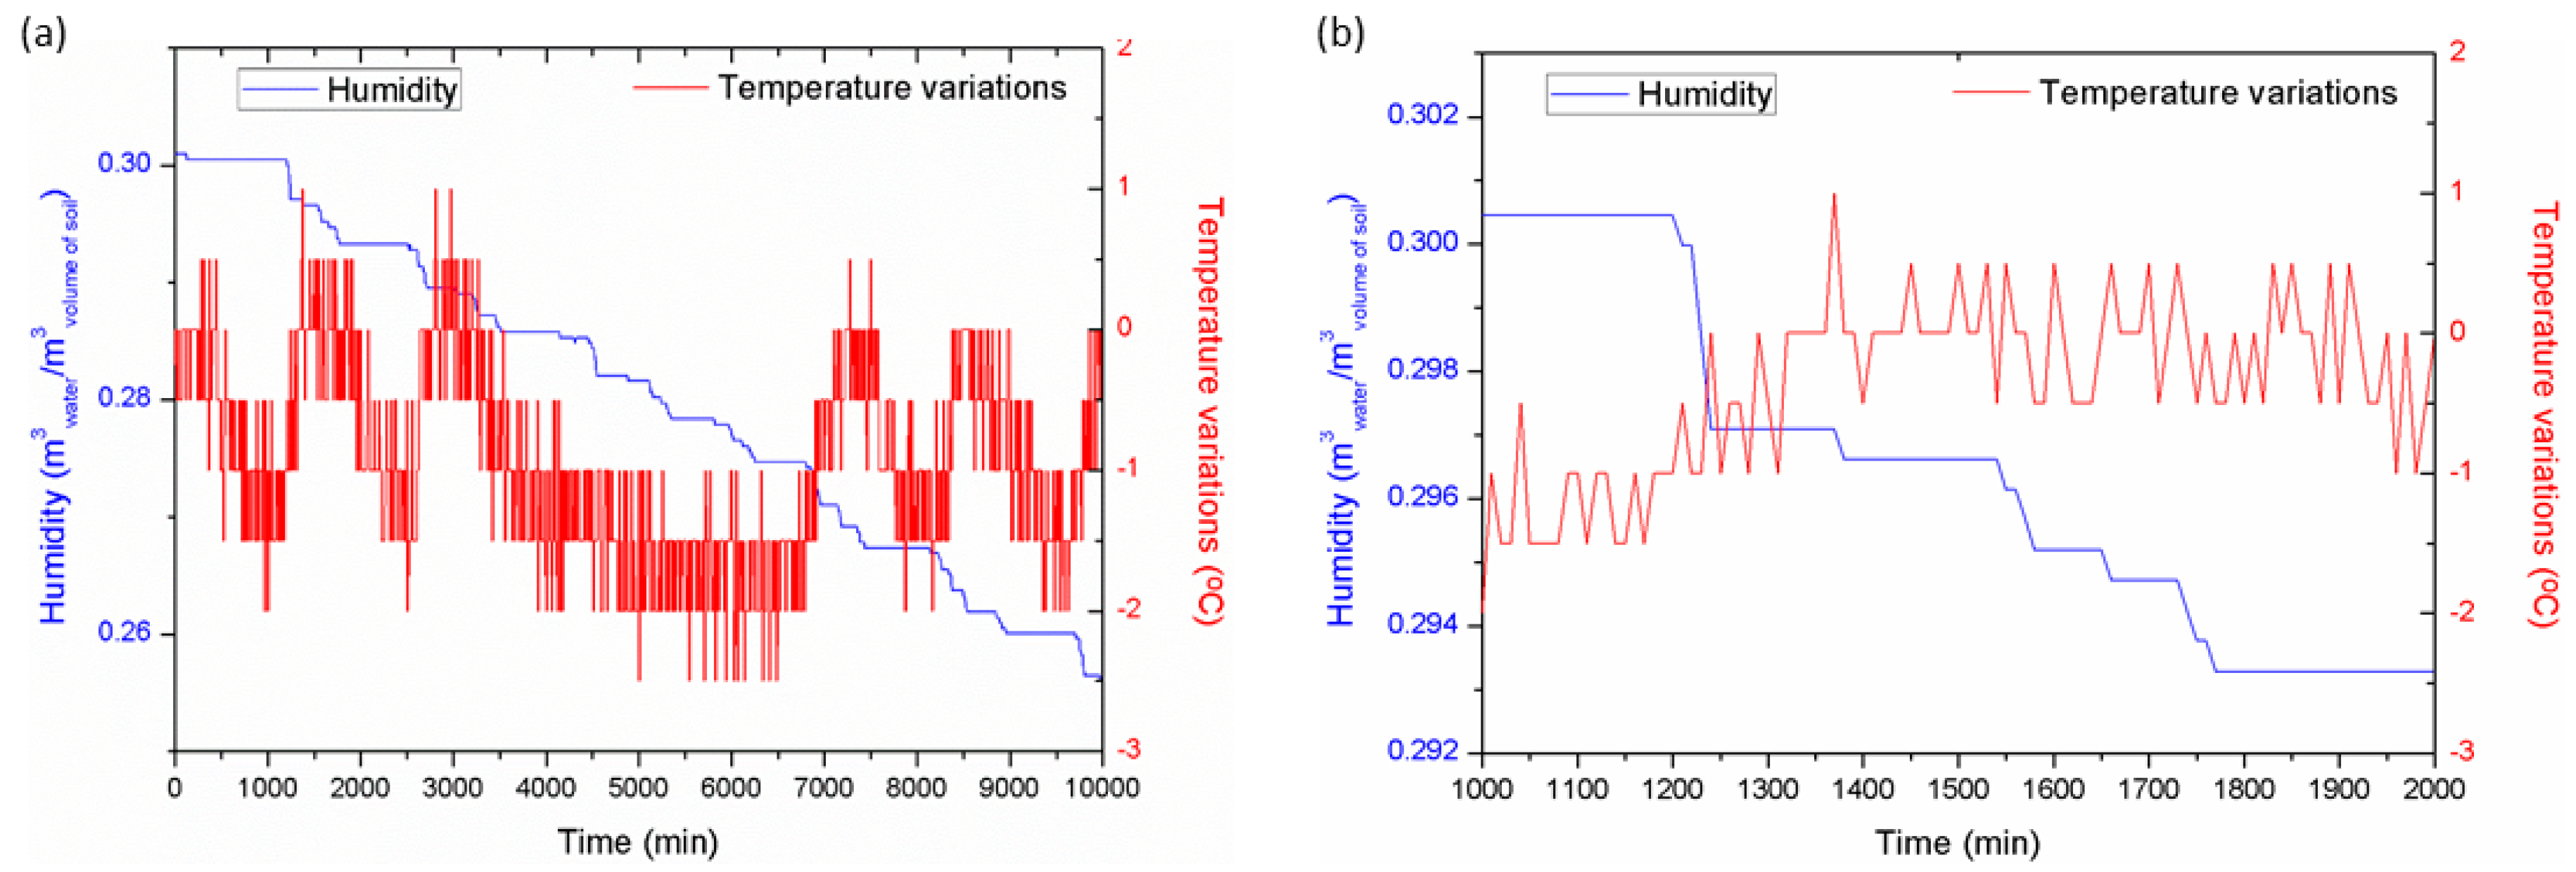
As commented in
Section 3.3, soil temperature close to the optical sensor location has been monitored. Results shown in
Figure 6 show a good agreement between the dynamics of humidity and temperature. Temperature shows oscillations of 2 °C depending on the time of the day. During day hours temperature rises and when sun sets (soil sample was at direct exposition of sun light) it decreases ~2 °C. Humidity results follows the same trend, showing great variations (decreasing humidity) during the day and slower ones at night. These variations agree temporarily with temperature, showing bigger slopes during sunshine hours.
5. Conclusions
In this study, a fiber optical sensor based in a microstructured optical fiber has been proposed and demonstrated for first time for soil moisture measurements. The optical sensing head is based on a Fabry-Pérot cavity made of a microstructured optical fiber with a SnO2 sputtering thin film acting as sensitive layer and it was temperature and humidity characterized in a climatic chamber before its installation in soil. A comparison between a commercial capacitive FDR and the optical sensor has been carried out in two different types of soils during two weeks. The optical interrogation of the MOF–FP sensing head was carried out through the FFT technique, which avoids noise and amplitude variations’ influence and enables multiplex several sensors within a single optical interrogator’s channel. Results show a good agreement between capacitive and optical measurements in the range 15–100% humidity and also match with gravimetric analysis. For humidity below 15%, the optical sensor’s sensitivity decreases significantly. Soil moisture can be measured with MOF–FP sensors with the advantages that they offer in comparison with traditional capacitive sensors: immunity to temperature variations (compensated), point measurements (against field measurements), and high multiplexing capability.
These particular characteristics lead to a new set of local applications that capacitive sensors are unable to attend, such as monitoring the soil moisture distribution (radial distance) in a local irrigation point performing measurements each centimeter. Moreover, due to the versatility of the sensing heads to be customized depending on the target application, different sensing heads with different purposes (such as dissolved pollutants, volatile organic compounds, solid or dissolved ferromagnetic elements can be detected by the correctly selection of the deposited chemical agent) can be multiplexed within the same optical interrogator, reducing the relative economic cost of the system and leading to complex real time (also high sampling rate applications) multiparameter monitoring schemes.


 ,
, 


