Evaluation Model of Demand-Side Energy Resources in Urban Power Grid Based on Geographic Information
by

Feifan Chen
1,*, 
Shixiao Guo
1,
Yajing Gao
2,*,
Wenhai Yang
3,
Yongchun Yang
1,
Zheng Zhao
4 and
Ali Ehsan
5 1
State Key Laboratory of Alternate Electrical Power System with Renewable Energy Sources, North China Electric Power University, Baoding 071003, China
2
China Electricity Council Electric Power Development Research Institute, Beijing 100031, China
3
Huaneng Power International, Inc., Beijing 100031, China
4
Department of automation, North China Electric Power University, Baoding 071003, China
5
College of Electrical Engineering, Zhejiang University, Hangzhou 310027, China
*
Authors to whom correspondence should be addressed.
Appl. Sci. 2018, 8(9), 1491; https://doi.org/10.3390/app8091491
Submission received: 23 July 2018
/
Revised: 17 August 2018
/
Accepted: 27 August 2018
/
Published: 29 August 2018
(This article belongs to the Special Issue Solar Power System Planning & Design: Resource Assessment, Site Evaluation, System Design, Production Forecasting and Feasibility Studies)
Abstract
:Featured Application
This paper contributes to guiding government planners and DSER investors to compare and select various DSER, furthermore, they can make a relatively reasonable planning scheme or investment scheme. Meanwhile, it provides a strong support for the long-term optimization planning and medium-term optimization aggregation of DSER, which is conducive to the development and utilization of DSER.
Abstract
In the context of current energy shortage and environmental degradation, the penetration rate of demand-side energy resources (DSER) in the power grid is constantly increasing. To alleviate the problems concerning the energy and environment, it is of tremendous urgency to develop and make effective use of them. Therefore, this paper proposes the evaluation model of DSER in urban power grid based on geographic information, and a variety of demand-side energy resources in a region is evaluated. Firstly, as for five kinds of DSER, revolving wind power generation (WG), photovoltaic power generation (PV), electric vehicle (EV), energy storage (ES), and flexible load, the commonality indexes and individuality indexes of all kinds of resources are selected based on geographic information. The commonality indexes are common indexes of all DSER, and the individuality indexes are unique indexes of all DSER. Then the weight of each subindex under the commonality and individuality indexes are determined by analytic hierarchy process (AHP) and entropy weight method, respectively. Finally, weighted overlay are made according to the weights and quantized values of each index, and a comprehensive score is obtained from the commonality indexes and individuality indexes upon various demand-side energy resources in the region. The result depicts that the proposed evaluation model of demand-side energy resources is of well practicability and effectiveness, which is beneficial to the planning of the city and the power grid. Most of all, such model provides a strong support for the long-term optimization planning and the medium-term optimization aggregation of DSER.
1. Introduction
In the context of current energy shortage and environmental degradation, the proportion of energy resources, such as distributed generation, ES and flexible load, is increasing in the power grid; these resources are widespread existent on the demand side, thus are called demand-side energy resources (DSER). In China, the National Development and Reform Commission and other departments have issued a series of policies on distributed photovoltaic (PV) and decentralized wind power generation (WG) since 2007. DSER plays an increasingly important role in the transformation of new energy systems in China. By the end of 2017, the newly installed capacity of PV in China is 53.06 million kilowatts, and the cumulative installed capacity is 130.25 million kilowatts. The cumulative installed capacity of ES is 28.9 million kilowatts, an increase of 19%. In addition, according to the global distributed energy technology report, the installed capacity of global distributed energy in 2017 is about 132.4 million kilowatts. At the same time, to support the development of energy resources such as WG and distributed PV, many countries have formulated relevant policies. Brazil, Canada, Spain, the United States and other countries have formulated a localization rate policy for WG equipment. The European Union (EU) has set a target that renewable energy will account for 27% of the energy demand structure in 2030, promoting PV development. Nowadays, urban power grids are facing severe challenges including increasing load density, increasing peak and valley difference, shortage of power grid construction land and difficulties in raising funds for construction. At the same time, DSER receives attention from all sectors of society and policy support from the government, and its penetration rate in the power grid, especially in the urban power grid, is constantly increasing, providing a huge potential for the implementation of various demand-side projects. At this time, how to fully tap and exploit the potential of DSER, furthermore, ensuring their participation in the planning, construction, and operation of urban power grids, has become a key issue in solving the current difficulties existing in urban power grids [1,2,3,4,5].
It can be seen that the rational development and the effective use of DSER will have a far-reaching impact on China’s energy power industry. The evaluation model of demand-side energy resources can be used to explore the status, characteristics, and development prospects of DSER. It is an important tool to develop and use DSER rationally. Therefore, the establishment of an evaluation model of demand-side energy resources is very important for the development and utilization of DSER as well as the energy power industry.
Therefore, many literature works discuss the evaluation of DSER. In literature [6], the meteorological data of Kahnuj in Iran have been measured at an altitude of 10 m, over a four-year period. Also, the monthly, annual and seasonal wind speed variations are investigated, and the economic feasibility is determined of installing wind turbine at the site. Literature [7] proposes a method to simulate a large wind farm and determine its capacity value, taking into account the mechanical failure of the wind turbine and the influence of the transmission system, and evaluate and compare the wind capacity values under different conditions. Literature [8] presents a study of the installation of a hybrid PV-WG system for social interest houses in the city of San Luis Potosi, Mexico. To assess the benefits of the implementation of this type of system, a technological, economic, and environmental evaluation is carried out based on the available renewable energy resources and considering a typical load profile of consumers. Literature [9] obtained a probability model for system power output by analyzing the structural characteristics of the PV power system and by examining its component failure mode and the effect of the component failure mode on the output power. In literature [10], through the analysis of the results of the various operating parameters of large-scale PV, the operation of large-scale grid connected PV grid is mastered. The comprehensive evaluation system is established by using the analytic hierarchy process. In literature [11], the electric vehicle (EV) charging load in a day is calculated by the traffic simulation and evaluated in order to assess the influence of EV charging on the grid system and the applicability of EV in the smart-grid system. Literature [12] proposes a reliability and economic evaluation model of distribution network under large-scale EV’s access. The Monte Carlo method was utilized to evaluate the reliability of distribution network. In literature [13], on the basis of analyzing the traditional site selection program evaluation method, fuzzy analytic hierarchy process (AHP) is proposed to evaluate the EV charging station sitting programs, also the evaluation model algorithms are given, wishing to achieve the optimal program. Literature [14] evaluates the benefits of ES systems applied to renewable intermittent sources like wind. Literature [15] presents a real-time evaluation and simulation approach of ES system based on large renewable-based electricity generation, which can be used for grid support. In literature [16], a AHPPROMETHEE-GAIA method based on the analysis of the characteristics of the existing ES ways is presented. Taking the factors, such as technology maturity, cost, life, efficiency, response speed, and environment as assessment criterion, a comprehensive evaluation for the existing ES ways is made.
All of the above literatures have evaluated DSER, but the evaluation model constructed has only evaluated single DSER without taking a variety of DSER into comprehensive consideration. Therefore, this paper evaluates five kinds of DSER, including WG, distributed PV, EV, ES, and flexible loads. There are many factors to be considered when evaluating the DSER. Firstly, the development of various types of DSER will bring more or less benefits, which reflects the significance of these resources. Also, benefits are the direct purpose of digging deeply into DSER. At the same time, due to the difference in geographic location and development conditions, the development of different DSER varies from region to region. Therefore, resource development, which means proportion of resources currently developed in a certain region to the total resources of the region, is an important index for evaluating the development status of DSER. In addition, the future development potential of DSER is the focus of government and investment institutions, which lays fundamentals for the government to formulate relevant policies and incentives for various types of DSER. The above indexes need to be considered when all kinds of DSER are evaluated, which are defined as commonality indexes. In addition, various DSER have different characteristics. To facilitate the evaluation of the characteristics of DSER, DSER is divided into three groups and the key characteristics of evaluation concern are sorted out, defined as individuality indexes.
The advantages of WG and PV lie in the large range of distribution areas, high development value, almost zero pollution and inexhaustible [17,18]. However, the output of WG and PV are affected by the meteorological conditions such as wind speed and light intensity. The output has characteristics of volatility and intermittency, which increase the difficulty in regulating the peak of conventional power supply in power grid. Therefore, it is necessary to evaluate the output characteristics of WG and photoelectric, and the reliability of WG and photoelectric is also an important role in affecting the stability of the power system.
EV and ES can effectively fulfill the demand-side response and behave interactively with the grid. They can be used to cut peaks and valleys, smooth load fluctuations, and promote the use of intermittent energy resources. Therefore, the peak shaving capacities of EV and ES are particularly important, concerning that they will be connected to the grid in large scale, the reliability of EV and ES resources cannot be ignored as well [19,20].
Flexible loads resources refer to flexible loads that have a power demand response. Demand response technology is one of the core technologies in the smart grid. The application of demand response technology can fully exploit the load-side resources and realize the comprehensive optimization of resources configuration [21]. Different users' response willingness and responsive device capacities are different, such as supermarkets, shopping malls, and hotels and other commercial users with less response willingness and larger response capacity, the residents are the opposite, with greater willingness to respond and smaller response capacity. The response capacities of various users are very different. Therefore, as for flexible loads, features related to response are evaluation-focused.
It can be seen that the current evaluation systems focus on the evaluation of single DSER, and the selected indexes are often individuality indexes of DSER. So, a set of general evaluation system should be set up to evaluate the commonality indexes and individuality indexes of all kinds of DSER. At the same time, these DSER are widespread distributed in the urban power grid, their distribution has natural geographical features and is inseparable from the way of urban planning and partition.
According to the above situation, this paper proposes an evaluation model of DSER based on geographic information. Based on the functional partition of the city, the commonality indexes system and the individuality system are established by analyzing the commonality and individuality of various DSER, and the commonality indexes and individuality indexes are selected separately, that is, each index is defined. Then AHP is used to determine the weight of the commonality indexes. The entropy weight method is used to determine the weight of the individuality indexes. Finally, the comprehensive scores of the commonality indexes and individuality indexes are obtained respectively. The specific process is shown in Figure 1. The comprehensive scores of various DSERs in various regions are favorable for urban and power grid planning, guiding DSER investors and government planners, and providing a strong support for the long-term optimization planning and medium-term optimization aggregation of DSER.
1.1. The Commonality Indexes System of Evaluation Model of DSER
According to the above analysis, benefits as well as resource development and development potential are selected as commonality indexes of DSER, which are the indexes common to all types of DSER, and the abovementioned first-level indexes are further refined to obtain a commonality indexes system of evaluation model of DSER, as shown in Figure 2.
1.2. Selection of Commonality Indexes
(1) Benefits
Benefits are indexes that measure the effects and profits of a project. The benefits of various DSER are evaluated in terms of three aspects of economic benefits, environmental benefits, and social benefits. Taking WG as an example, the specific definitions are shown in Table 1.
- Gwind—The production value of WG in a certain region
- Cwind—The production cost of WG in the region
- Ewind—The amount of carbon dioxide emission reduction due to WG in a certain region
- Sq—The area of the region
- Mwind—The average satisfaction of residents in a certain area to WG, which is quantified by percentile system.
(2) Resource Development
The development of resources is another important index to evaluate DSER. The development of various DSER is measured by Equation (1).
- A2—Resource development
- Ruse—The amount of development of a DSER in a region
- Rsum—The total amount of the DSER in the region
(3) Development Potential
All kinds of DSER must be taken into consideration to settle the long-term development problem, so the development potential is also an essential index for evaluating all kinds of DSER. The development potential of various DSER is evaluated in terms of four aspects upon policy support, sources of funds, benefits, and the amount of surplus resources. The specific definitions are shown in Table 2.
- A11—The economic benefits of a certain DSER
- A12—The environmental benefits of a certain DSER
- A13—The social benefits of a certain DSER
- A2—Resource development, which means proportion of resources currently developed in a certain region to the total resources of the region
- w1—The weight of the economic benefits of the DSER
- w2—The weight of the environmental benefits of the DSER
- w3—The weight of the social benefits of the DSER
2. The Establishment of Individuality Indexes System for DSER
2.1. The Individuality Indexes System of Evaluation Model of DSER
Based on the above analysis, indexes that can represent the characteristics of various types of DSER are selected as individuality indexes. Among them, WG and PV resources share a set of individuality indexes, EV and ES resources share a set of individuality indexes, and flexible load resources use a set of individuality indexes. Output characteristics and reliability are selected as first-level indexes of WG and PV, reliability, peak shaving capacity and discharge performance are selected as first-level indexes of EV and ES, response capacity is selected as first-level indexes of flexible loads. The framework is shown in Figure 3.
2.2. Selection of Individuality Indexes
2.2.1. The Individuality Indexes of WG and PV
(1) Output characteristics
The output characteristics of WG and PV resources are of great importance for the consumption of WG and PV. The day with the maximum load is selected as the typical day. The output characteristics of WG and PV resources are quantified and evaluated in terms of three aspects: daily load rate, peak valley difference, and daily load fluctuation rate [22]. The definitions of the indexes are shown in Table 3.
- Pmax—The maximum load of the typical day
- Pmin—The minimum load of the typical day
- Pav—The average load of the typical day
- S—Standard deviation of load.
(2) Reliability
The maximum daily average load of WG or PV is recorded as P, and 0.8P is defined as the threshold. The reliabilities of WG and PV in a certain region are quantified and evaluated in terms of two aspects: the proportion of days meet the threshold and number of system failures, correspondingly, the definitions of the indexes are shown in Table 4.
- Dth—The number of days in which the average daily load of a year meets the threshold
- B22—The number of system failures in a year
2.2.2. The Individuality Indexes of EV and ES
(1) Reliability
The reliabilities of EV and ES in a certain region are quantified and evaluated in terms of two aspects: power outage time and number of system failures. Such two indexes are represented by the power outage time in one year in a region and the number of failures in the year.
(2) Peak shaving capacity
Realizing peak shaving and valley filling is one of the important goals for developing EV and ES. Therefore, Peak shaving capacity is an important index for evaluating EV and ES, and it is quantified and evaluated in terms of two aspects: battery capacity and charging and discharging speed, correspondingly, the definitions of the indexes are shown in Table 5.
- B41—Total battery capacity in a certain region
- B42—The average time required for a battery to be fully charged of battery once
(3) Discharge performance
A cycle means the ES system undergoes a charge–discharge process. Discharge performances of EV and ES in a certain region are quantified and evaluated in terms of two aspects: cycle life and charge and discharge efficiency, correspondingly, the definitions of the indexes are shown in Table 6.
- B51—The number of cycles the ES system can withstand before retired
- Er—Energy released by an ES system after charging
- Ei—Initial storage energy of ES system
2.2.3. The Individuality Indexes of Flexible Loads
The response capacity of flexible loads is quantified and evaluated in terms of four aspects: users’ willingness, responsive device capacity, response cost, and response success rate. Taking the users’ willingness as an example, users’ willingness in a certain region are quantified from low to high as 1–5, according to different types of users (public, commercial, industrial, and residents). Then, the quantized value upon the user’s willingness of each type of user is multiplied by the proportion of each type of user in the region, and the comprehensive quantized value upon the user’s willingness in the region is obtained. Specific quantization rule is shown in Table 7.
3. Determination of Commonality Indexes Weights and Calculation of Comprehensive Score
3.1. Standardization of Evaluation Indexes
The dimensionlessness in the evaluation index system is the prerequisite for the integration of indexes. If the nondimensionalized value of the index is called the index evaluation value, then the dimensionlessness process is the process of converting the actual value of the index into the evaluation value of the index, and the dimensionlessness method is to eliminate the influence of the primitive variable (index) dimension by the mathematical transformation. When the indexes are nondimensionalized, it is necessary to note that the positive and negative indexes have different effects on the overall target. For example, indexes such as economic benefits, policy support, and response capacity are positive indexes. The higher the index value, the better; the indexes such as power outage time, number of failures, and response cost are negative indexes, the lower the index value, the better.
In summary, the threshold method in the linear nondimensionalization method is used to nondimensionalize the index; threshold method is a dimensionless method to get the index evaluation value through the ratio of the actual value to the threshold of the index. The corresponding formulas are as follows.
Assume that there are m regions, n evaluation indexes, and xij represents the index value of the ith region under the jth index [23].
Positive indexes
Negative indexes
3.2. The Calculation of Weights for Commonality Indexes
Since the commonality indexes such as benefits, resource development, and development potential are indexes shared by the five DSER, and the preference of the decision makers for these indexes is more obvious, the Analytic Hierarchy Process (AHP) is used to evaluate the commonality indexes.
On one hand, the AHP takes the subjective experience judgement of expert scoring into account. On the other hand, the expert judgement is transformed into a mathematical model for quantitative calculation, so that the proportion of each index in the company evaluation index can be calculated. The combination of analysis and calculation is extremely useful for highlighting corporate evaluation in different periods.
The basic idea of the AHP is to build the problem hierarchically based on the decision goal (as is shown in Figure 4). The highest level is the target level, several intermediate levels are the criterion level, and the bottom level is the various options selected for solving the problem, which is called the plan level [24,25].
The weights of indexes are determined by AHP as follows:
(1) Compare pairs of indexes in the same level, and refer to the number 1–9 and its reciprocal as a scale to define the judgment matrix A, as shown in Table 8.
(2) Calculate consistency ratios and test consistency
where CI—Consistency indicator; RI—Random consistency indicator; CR—Test coefficient; λmax—The maximum eigenvalue of the judgment matrix A; n—The order of the judgment matrix A.
The value of RI is shown in Table 9
When CR < 0.10, the consistency of the judgment matrix is considered acceptable, otherwise the judgment matrix should be properly modified.
(3) The calculation of weight vector W
The weight vector W in AHP is calculated by the eigenvector method, and the weight vector W is multiplied by the judgement matrix A
3.3. The Calculation of the Comprehensive Score upon Commonality Indexes
The comprehensive score upon the commonality indexes of all kinds of DSER can be obtained by weighted overlaying the quantized values of each index and their corresponding weights in a certain region, as shown in formula (7). Suppose there are n commonality indexes,
Taking WG as an example, WAj is the weight of the jth index in the general index of WG, xAj is the quantified value of WG in jth index, and fA is the comprehensive score of the commonality index of WG.
4. Determination of Individuality Indexes Weights and Calculation of Comprehensive Score
4.1. Standardization of Evaluation Indexes
The evaluation indexes are nondimensionalized, same as Section 3.1.
4.2. The Calculation of Weights for Individuality Indexes
Since the individuality indexes upon various DSER are different, and the relative importance of each index is difficult to divide artificially, therefore, the entropy weight method is used to evaluate the individuality index.
Entropy, one of the parameters that characterize the state of matter in thermodynamics, is a measure of the degree of chaos in the system. Entropy method is to use the degree of variation of information entropy to calculate the weight of each index, to evaluate the importance of each index [26].
Assuming that there are m regions, n evaluation indexes, the weights of indexes are determined as follows:
- (1)
- Calculate Pij, the weight of the index values of each region under various indexeswhere i represents the ith region, j represents the jth index, and xij represents the index value of the ith region under the jth index.
- (2)
- Calculate ej, the entropy of each index
- (3)
- Calculate gj, the difference coefficient of each index
- (4)
- Calculate Wj, the weight of each index
4.3. The Calculation of the Comprehensive Score upon Individuality Indexes
The comprehensive score upon the individuality indexes of all kinds of DSER can be obtained by weighted overlaying the quantized values of each index as well as their corresponding weights in a certain region, as shown in formula (12). Suppose there are n individuality indexes,
Taking WG as an example, WBj is the weight of the jth index in the general index of WG, xBj is the quantified value of WG in this index, and fB is the comprehensive score upon the individuality index of WG.
5. Case Analysis
Twenty regions are selected as evaluation objects for example analysis. The schematic diagram is shown in Figure 5.
5.1. Commonality Indexes
5.1.1. Standardization of Indexes
According to Equations (2) and (3), each index value can be processed to obtain the relative value of each index. Taking the commonality indexes of WG as an example, the processed index values are shown in Figure 6.
As can be seen from Figure 6, among the 20 regions, WG in region 2 has the highest economic benefits, however, whose social benefits, resource development and policy support are almost behind those in other regions. The social benefits and funding sources of WG in region 18 are in a leading position, however, the environmental benefits are the lowest, moreover, policy support is not satisfactory.
5.1.2. The Calculation of Weights of Commonality Indexes
According to Equation (6), AHP is used to calculate the weights of benefits, resource development and development potential of the commonality indexes, so are the weights of their respective subindexes. The calculation results are shown in Table 10.
As can be seen from Table 10, the weight of benefits in the commonality indexes is the largest, followed by the weight of development potential, and the weight of resource development is the least. For the subindexes, under the benefit index, the economic benefit accounts for the largest proportion, and under the development potential index, the sources of funds account for the largest proportion.
5.1.3. The Calculation of Comprehensive Score
After calculating the weights of the subindexes under the commonality indexes, the comprehensive scores of the commonality indexes of various DSER in various regions are calculated according to Equation (7). Analyzed results are as follows:
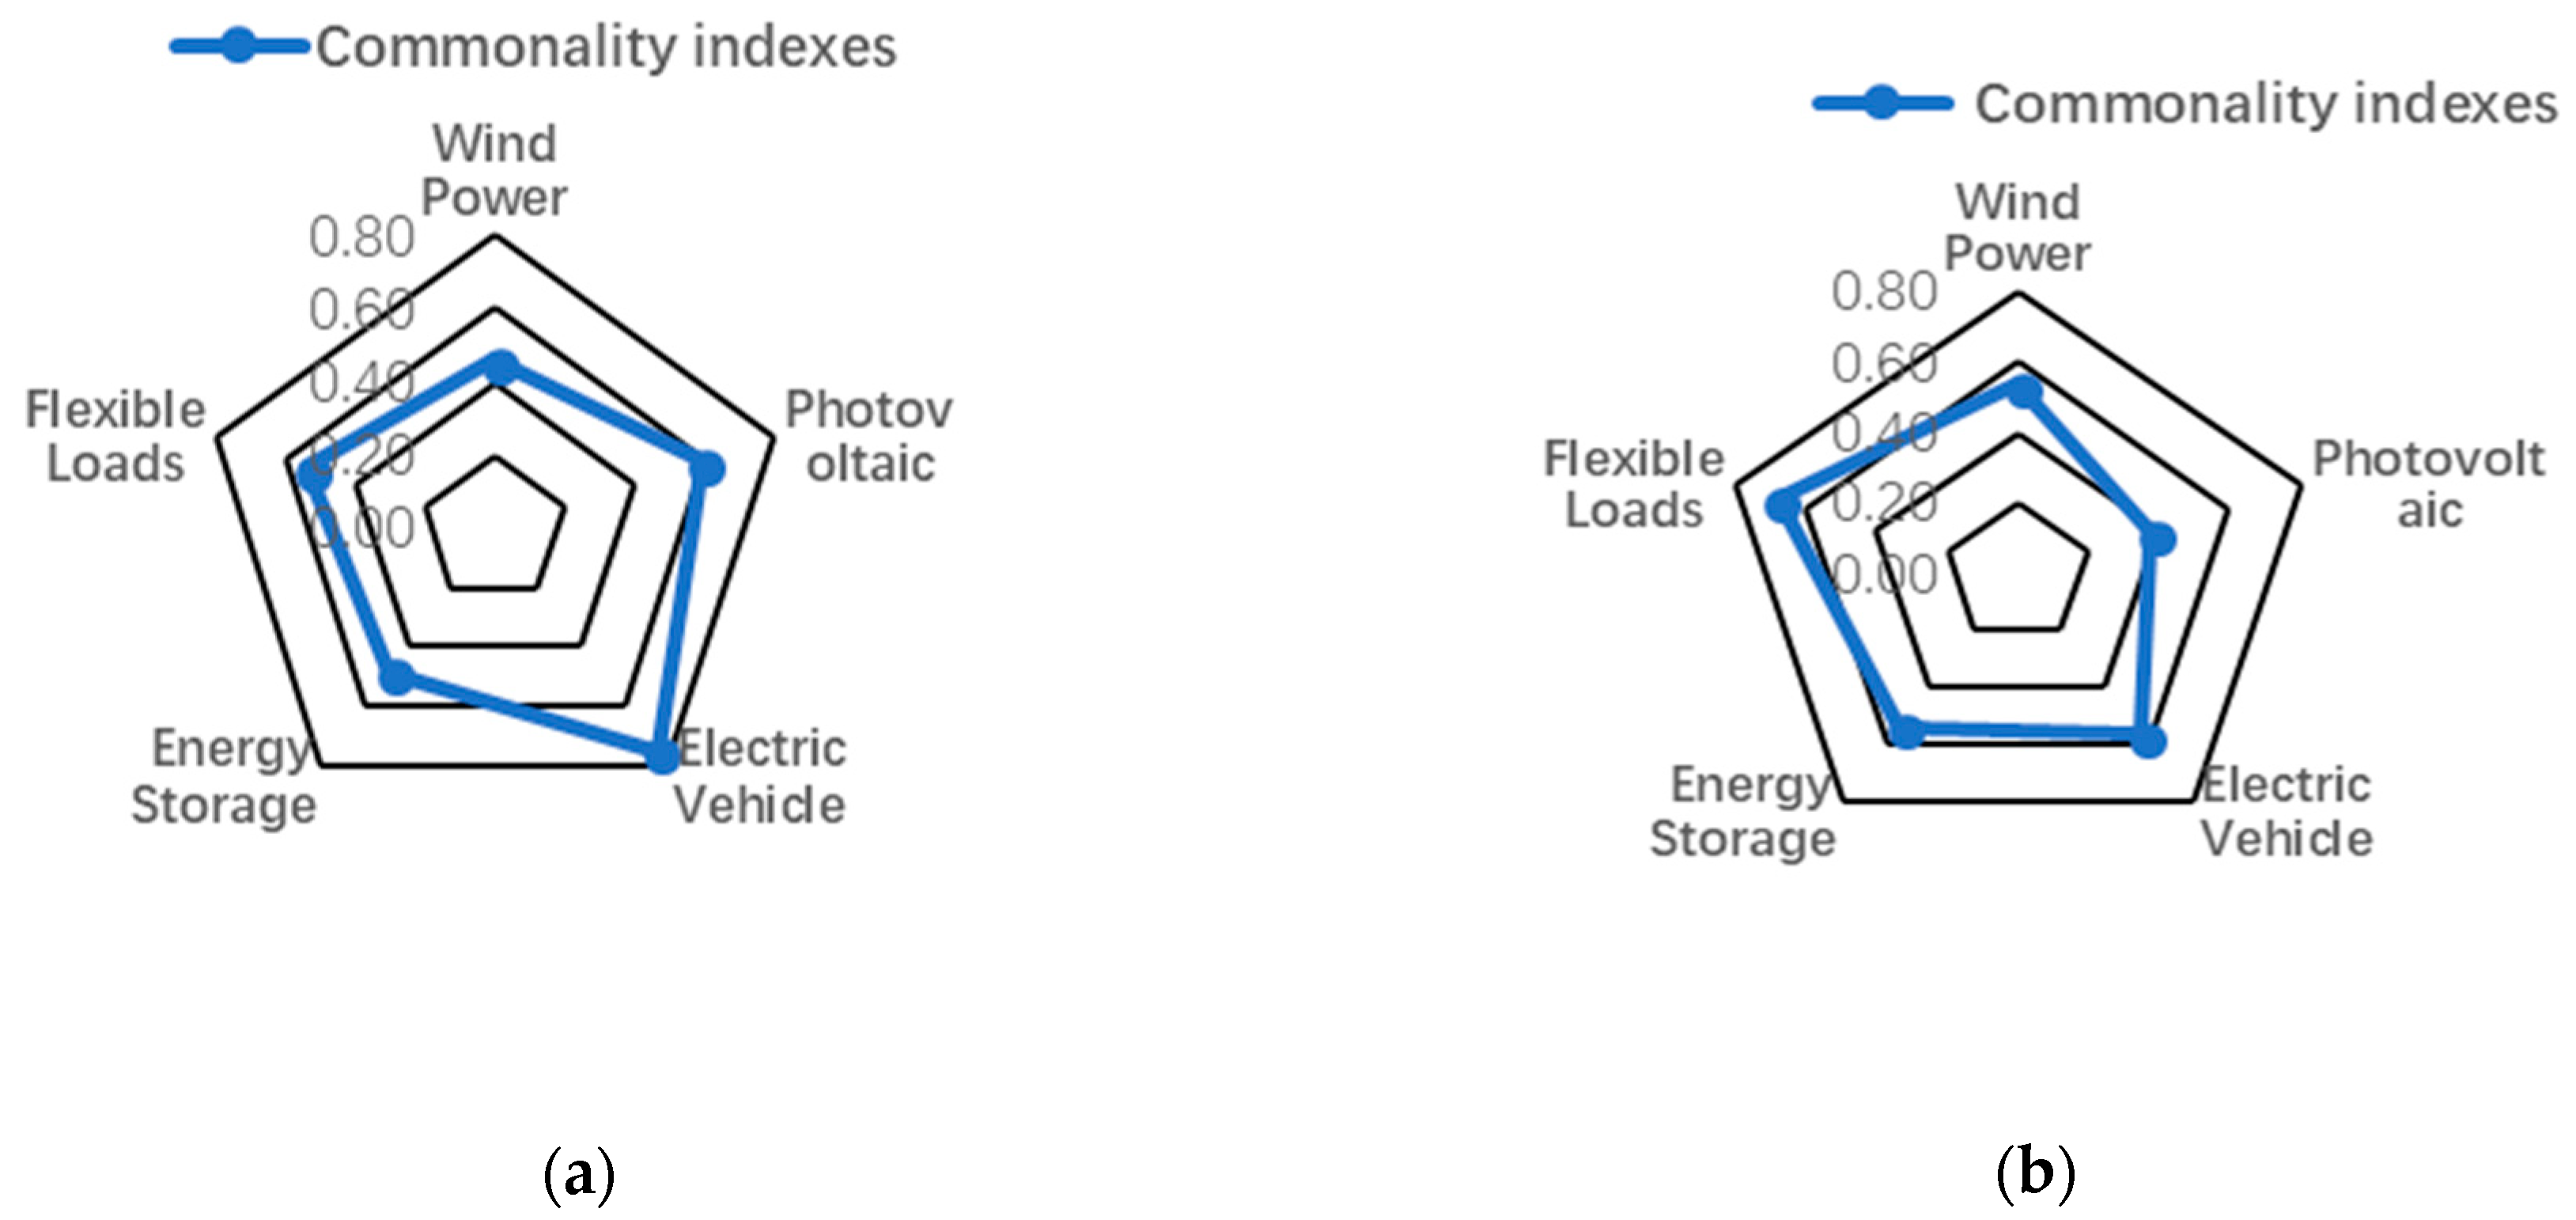
As shown in Figure 7, the scores of commonality indexes of the PV and EV in region 1 are relatively high, but that of WG, flexible load, and ES are in the middle level; the score of flexible loads in region 2 is relatively high, and the score of PV is relatively low. As is shown in Figure 8, the scores of commonality indexes of WG in regions 15 and 17 are relatively high, the scores of WG in regions 5, 7, and 19 are relatively low; the scores of commonality indexes of EV in regions 1, 3, 8, and 15 are relatively high, the scores of EV in regions 6, 12, 16, and 18 are relatively low.
5.2. Individuality Indexes
5.2.1. Standardization of Indexes
According to Equations (2) and (3), each index value can be processed to obtain the relative value of each index. Taking the individuality indexes of WG as an example, the processed index values are shown in Figure 9.
It can be seen from Figure 9 that among the 20 regions, the number of system failures of WG in region 5 is the lowest, but the remaining indexes are in a backward position in the ranking. The daily peak rate and daily load fluctuation rate of WG in region 9 are relatively good, but the system has more failures.
5.2.2. The Calculation of Weights of Individuality Indexes
The entropy weight method is used to calculate the weights of the individuality indexes upon various DSER according to Equations (8) to (11), as shown in Figure 10.
As can be seen in Figure 10, among the individual indexes of WG and PV, the weight of the daily load fluctuation rate is the largest, and the proportion of the number of days meet the threshold accounts for the smallest part. Among the individual indexes of EV and ES, the weight of the power outage time, number of system failures and the battery capacity index is relatively large, and the weight of charge and discharge speed is relatively small. Among the individual indexes of flexible loads, the weight of the response success rate index is the largest, and the response cost index has the smallest weight value.
5.2.3. The Calculation of Comprehensive Score
After calculating the weights of the subindexes under the individuality indexes, the comprehensive scores of the individuality indexes upon various DSER in various regions are calculated according to Equation (12). Analyzed results are as follows:
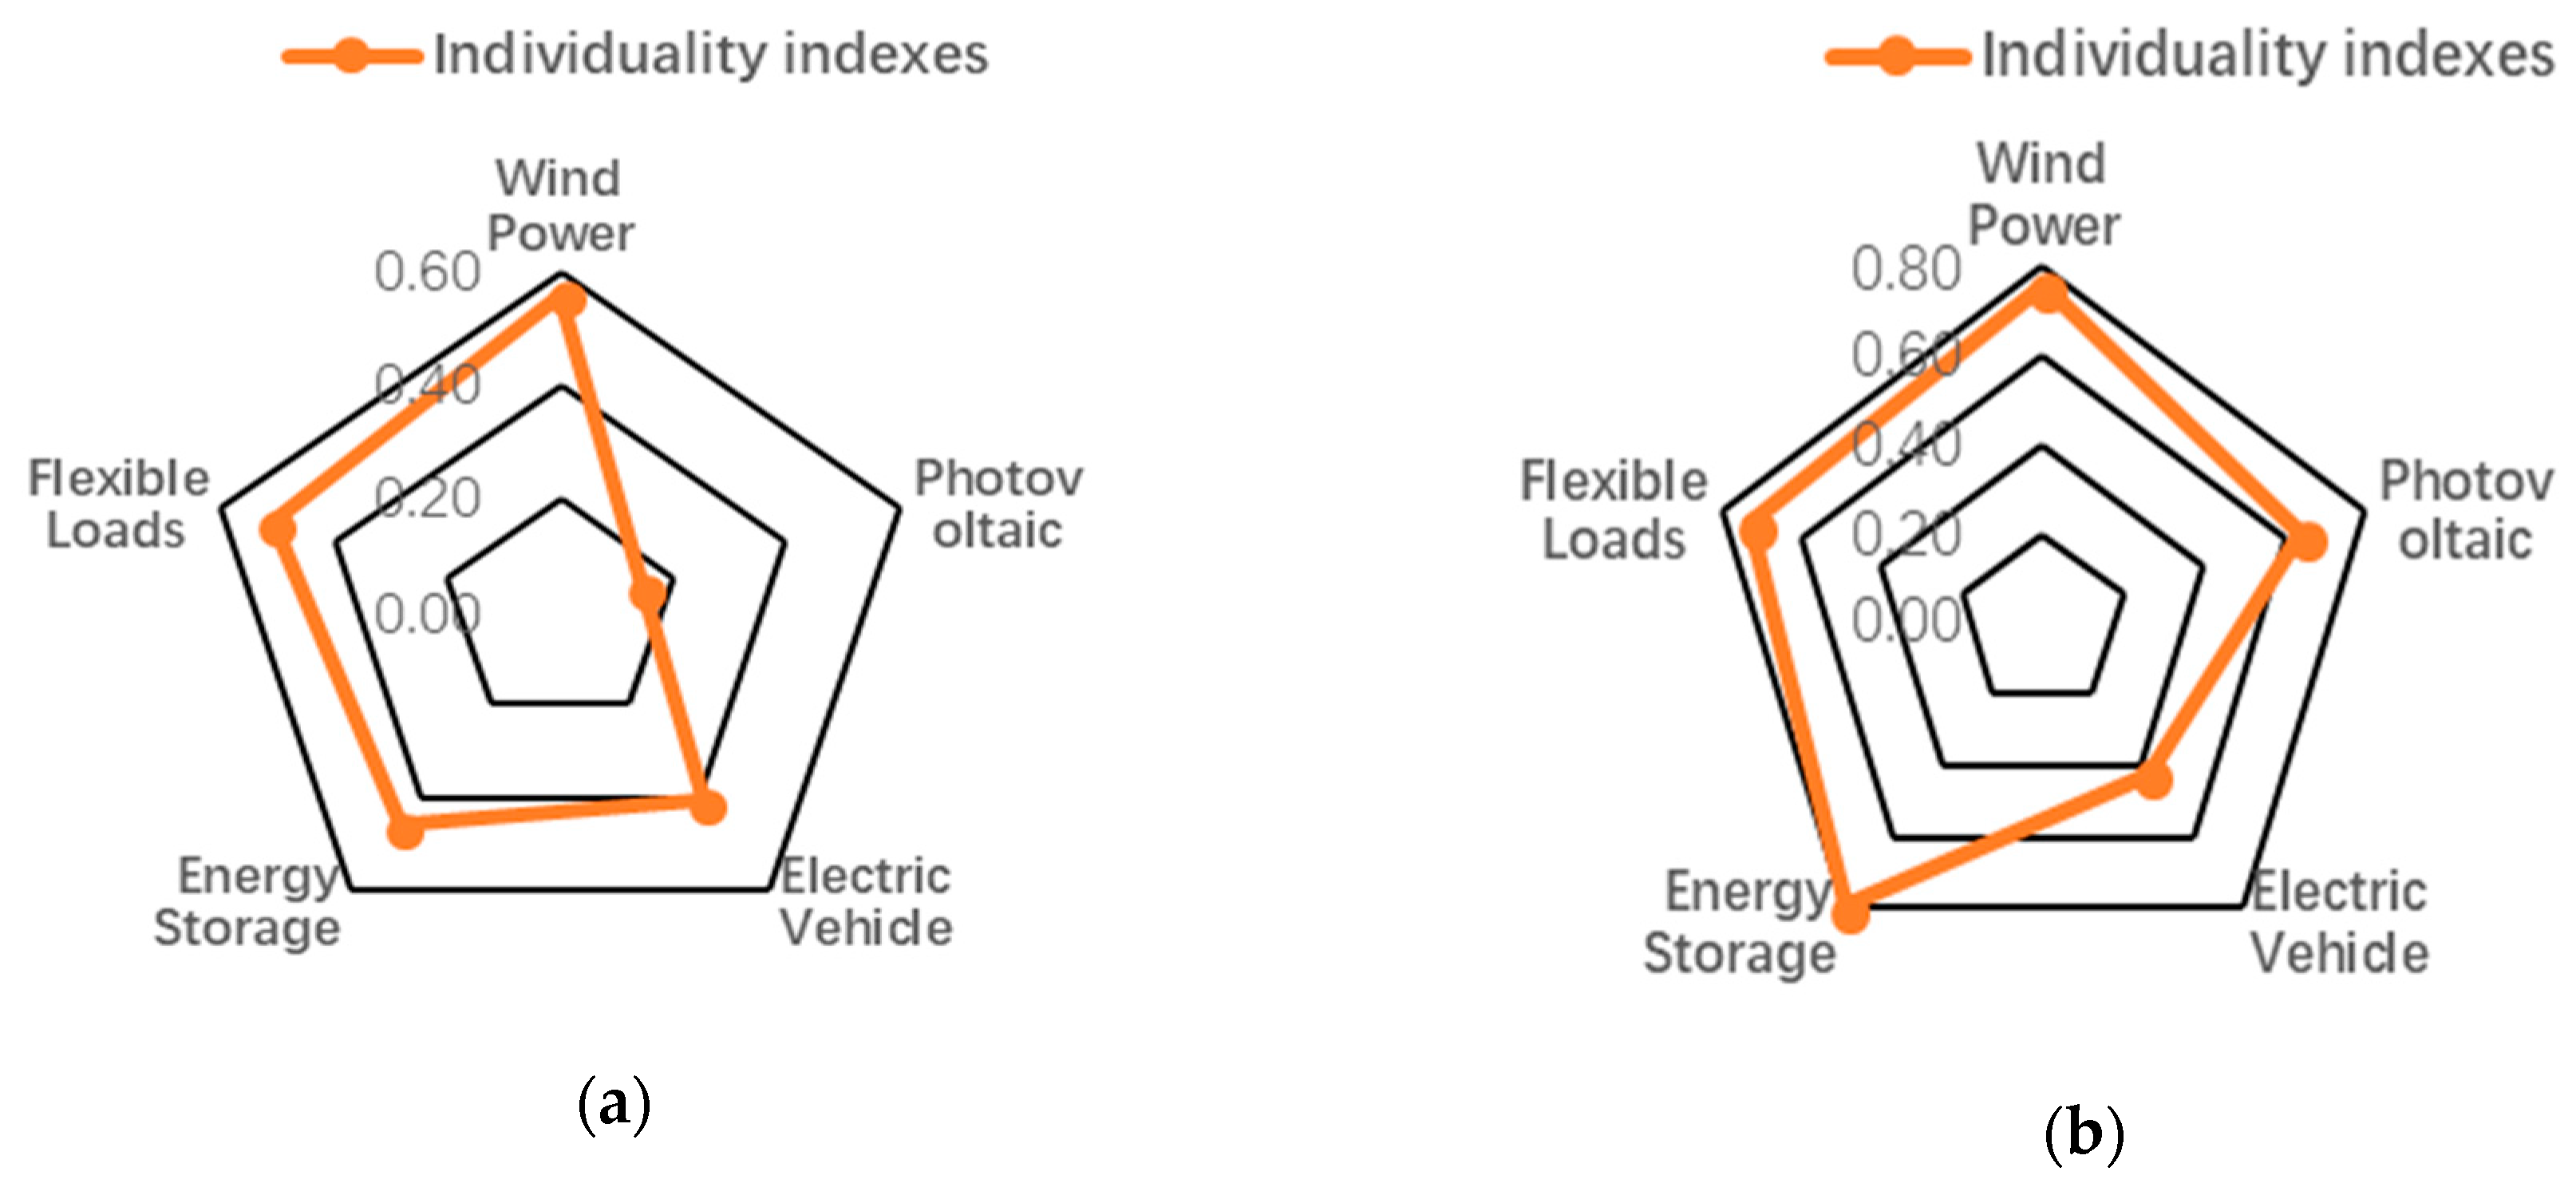
As shown in Figure 11, the score of individuality indexes of the PV in region 1 is relatively low, whereas that of the other DSER are relatively high. The scores of WG, PV, ES, and flexible loads in region 2 are higher than the score of EV. As is shown in Figure 12, the scores of individuality indexes of WG in regions 2 and 4 are relatively high, the scores of WG in regions 5 and 14 are relatively low; the scores of individuality indexes of EV in regions 4, 6, and 13 are relatively high, the scores of EV in regions 16 and 17 are relatively low.
6. Conclusions
To facilitate the decision-making of optimal planning and optimally aggregate utilization of DSER, this paper proposes an evaluation model of DSER based on geographic information, that is, various DSER in a region are evaluated based on geographic information. Firstly, for five kinds of demand-side energy resources of WG, PV, EV, ES, and flexible load, select the evaluation indexes of all kinds of resources and divide all indexes into commonality indexes and individuality indexes. Then, AHP is used to determine the weight of each subindex under the commonality indexes, and the entropy weight method is used to determine the weight of each subindex under the individuality indexes. Finally, weighted overlay is acquired according to the weights and quantized values of each index, and a comprehensive score is obtained for the commonality indexes and individuality indexes of various DSER in a region. The following conclusions are obtained through the cases analysis.
- The evaluation results of commonality indexes are helpful to understand the development status and prospects of DSER, which is conducive to the future development and long-term optimization planning of DSER.
- The evaluation results of individual indexes are helpful to understand the respective characteristics of DSER, which is conducive to achieving a good interaction between the DSER and the power grid, providing support for the medium-term optimization aggregation of the DSER.
- The evaluation model of DSER based on geographic information proposed in this paper has good practicability and effectiveness, which matches the development of DSER with urban planning as well as power grid planning, providing a theoretical basis for the subsequent development of DSER.
Author Contributions
The author F.C. carried out the main research tasks and wrote the full manuscript, S.G. participated in the revision of the manuscript, and Y.G. proposed the original idea, analysed and double-checked the results and the whole manuscript. W.Y. contributed to data processing and to writing and summarizing the proposed ideas, Y.Y. and Z.Z. provided technical and financial support throughout, while A.E. modified the English grammar.
Funding
The Nature Science Foundation of China (51607068); The Fundamental Research Funds for the Central Universities (2018MS082); The Fundamental Research Funds for the Central Universities (2017MS090).
Acknowledgments
This work is supported in part by the Nature Science Foundation of China (51607068), the Fundamental Research Funds for the Central Universities (2018MS082) and the Fundamental Research Funds for the Central Universities (2017MS090).
Conflicts of Interest
The authors declare no conflict of interest.
References
- Paliwal, N.K.; Mohanani, R.; Singh, N.K.; Singh, A.K. Demand side energy management in hybrid microgrid system using heuristic techniques. In Proceedings of the 2016 IEEE International Conference on Industrial Technology, Taipei, Taiwan, 14–17 March 2016; pp. 1910–1915. [Google Scholar]
- Ehsan, A.; Yang, Q. Optimal integration and planning of renewable distributed generation in power distribution networks: A review of analytical techniques. Appl. Energy 2017, 210, 44–59. [Google Scholar] [CrossRef]
- Gohla-Neudecker, B.; Wagner, U.; Hamacher, T. Analysis of renewable energy grid integration by range extension technologies of BEVs. In Proceedings of the 2013 International Conference on Clean Electrical Power (ICCEP), Alghero, Italy, 11–13 June 2013; pp. 155–162. [Google Scholar]
- Amamra, S.; Meghriche, K.; Cherifi, A.; Francois, B. Multilevel Inverter Topology for Renewable Energy Grid Integration. IEEE Trans. Ind. Electron. 2017, 64, 8855–8866. [Google Scholar] [CrossRef] [Green Version]
- Fang, X.; Yang, Q.; Wang, J.; Yan, W. Coordinated dispatch in multiple cooperative autonomous islanded microgrids. Appl. Energy 2017, 162, 40–48. [Google Scholar] [CrossRef]
- Soltani, N.; Fazelpour, F. Evaluation of wind energy potential and economics for the city of Kahnuj in Kerman Province, Iran. In Proceedings of the 2016 IEEE 16th International Conference on Environment and Electrical Engineering (EEEIC), Florence, Italy, 6–8 June 2016; pp. 1–6. [Google Scholar]
- Sulaeman, S.; Benidris, M.; Mitra, J. Evaluation of wind power capacity value including effects of transmission system. In Proceedings of the 2015 North American Power Symposium (NAPS), Charlotte, NC, USA, 4–6 October 2015; pp. 1–6. [Google Scholar]
- Ospino-Castro, A.; Peña-Gallardo, R.; Rodríguez, A.H.; Segundo-Ramírez, J.; Muñoz-Maldonado, Y.A. Techno-economic evaluation of a grid-connected hybrid PV-WG system in San Luis Potosi, Mexico. In Proceedings of the 2017 IEEE International Autumn Meeting on Power, Electronics and Computing (ROPEC), Ixtapa, Mexico, 8–10 November 2017; pp. 1–6. [Google Scholar]
- Li, H.; Ding, J.; Huang, J.; Dong, Y.; Li, X. Reliability evaluation of PV power systems with consideration of time-varying factors. J. Eng. 2017, 13, 1783–1787. [Google Scholar] [CrossRef]
- Hong, F.; Si, C. A study of evaluation system based on large scale photovoltaic power generation. In Proceedings of the 2016 IEEE 11th Conference on Industrial Electronics and Applications (ICIEA), Hefei, China, 5–7 June 2016; pp. 2507–2510. [Google Scholar]
- Ito, T.; Iwafune, Y.; Hiwatari, R. Evaluation of EV charging load contributing to stabilize PV output with consideration for rapid charge. In Proceedings of the 2012 IEEE PES Innovative Smart Grid Technologies (ISGT), Washington, DC, USA, 16–20 January 2012; pp. 1–6. [Google Scholar]
- Chen, L.; Zhang, H.; Lin, X.; Yu, M.; Zhang, Z. Reliability and economic evaluation model of power distribution network under large scale EV’s access. In Proceedings of the 2017 IEEE 3rd International Future Energy Electronics Conference and ECCE Asia (IFEEC 2017-ECCE Asia), Kaohsiung, Taiwan, 3–7 June 2017; pp. 2042–2047. [Google Scholar]
- Meng, W.; Kai, L.; Songhui, Z. Evaluation of Electric Vehicle Charging Station Sitting Based on Fuzzy Analytic Hierarchy Process. In Proceedings of the 2013 Fourth International Conference on Digital Manufacturing & Automation, Qingdao, China, 29–30 June 2013; pp. 568–571. [Google Scholar]
- Faias, S.; Santos, P.; Matos, F.; Sousa, J.; Castro, R. Evaluation of energy storage devices for renewable energies integration: Application to a Portuguese wind farm. In Proceedings of the 2008 5th International Conference on the European Electricity Market, Lisboa, Portugal, 28–30 May 2008; pp. 1–7. [Google Scholar]
- Cha, S.T.; Zhao, H.; Wu, Q.; Østergaard, J.; Nielsen, T.S.; Madsen, H. Evaluation of energy storage system to support Danish island of Bornholm power grid. In Proceedings of the 2012 10th International Power & Energy Conference (IPEC), Ho Chi Minh City, Vietnam, 12–14 December 2012; pp. 242–247. [Google Scholar]
- Wei, L.; Hou, J.; Qin, T.; Yuan, Z.; Yan, Y. Evaluation of grid energy storage system based on AHP-PROMETHEE-GAIA. In Proceedings of the 2016 35th Chinese Control Conference (CCC), Chengdu, China, 27–29 July 2016; pp. 9787–9792. [Google Scholar]
- Liu, J.; Wang, J.; Hu, Y.; Guo, J.; Zhang, B. Analysis of wind power characteristics of typical wind farm in Inner Mongolia area. In Proceedings of the 2017 29th Chinese Control and Decision Conference (CCDC), Chongqing, China, 28–30 May 2017; pp. 6721–6725. [Google Scholar]
- Kang, S.W.; Yoon, H.S.; Kim, S.B.; Baatarbileg, A.; Sakong, J.; Lee, G.M. Regional generation characteristics of MW photovoltaic power plants in Jeju Island. In Proceedings of the 2018 5th International Conference on Renewable Energy: Generation and Applications (ICREGA), Al Ain, United Arab Emirates, 26–28 February 2018; pp. 52–55. [Google Scholar]
- Sun, S.; Yang, Q.; Yan, W. A novel Markov-based temporal-SoC analysis for characterizing PEV charging demand. IEEE Trans. Ind. Inf. 2018, 14, 156–166. [Google Scholar] [CrossRef]
- Psola, J.H.; Henke, M.; Pandya, K. Characteristics of energy storage in smart grids. In Proceedings of the 2014 Ninth International Conference on Ecological Vehicles and Renewable Energies (EVER), Monte-Carlo, Monaco, 25–27 March 2014; pp. 1–7. [Google Scholar]
- Gao, C.; Li, Q.; Li, H.; Zhai, H.; Zhang, L. Methodology and Operation Mechanism of Demand Response Resources Integration Based on Load Aggregator. Autom. Electr. Power Syst. 2013, 37, 78–86. [Google Scholar]
- Gao, Y.; Sun, Y.; Yang, W.; Xue, F.; Sun, Y.; Liang, H.; Li, P. Study on Load Curve’s Classification Based on Nonparametric Kernel Density Estimation and Improved Spectral Multi-manifold Clustering. Power Syst. Technol. 2018, 42, 1605–1612. [Google Scholar]
- Jiao, L. On Methods of Standardization Management of Index. J. Anhui Agrotech. Teach. Coll. 1999, 3, 9–12. [Google Scholar]
- Goyal, R.K.; Kaushal, S. Deriving crisp and consistent priorities for fuzzy AHP-based multicriteria systems using non-linear constrained optimization. Fuzzy Optim. Decis. Mak. 2018, 17, 195–209. [Google Scholar] [CrossRef]
- Naveed, Q.N.; Qureshi, M.R.N.; Alsayed, A.O.; Muhammad, A.; Sanober, S.; Shah, A. Prioritizing barriers of E-Learning for effective teaching-learning using fuzzy analytic hierarchy process (FAHP). In Proceedings of the 2017 4th IEEE International Conference on Engineering Technologies and Applied Sciences (ICETAS), Salmabad, Bahrain, 29 November–1 December 2017; pp. 1–8. [Google Scholar]
- Hamid, T.; Al-Jumeily, D.; Hussain, A.; Mustafina, J. Cyber Security Risk Evaluation Research Based on Entropy Weight Method. In Proceedings of the 2016 9th International Conference on Developments in eSystems Engineering (DeSE), Liverpool, UK, 31 August–2 September 2016; pp. 98–104. [Google Scholar]
Figure 1.
Flow chart for calculating the composite score. The Establishment of Commonality Indexes System for demand-side energy resources (DSER).
Figure 1.
Flow chart for calculating the composite score. The Establishment of Commonality Indexes System for demand-side energy resources (DSER).

Figure 2.
The framework of the commonality indexes.

Figure 3.
The framework of the individuality indexes.

Figure 4.
Hierarchical structure.

Figure 5.
The schematic diagram of 20 regions.

Figure 6.
Value of commonality indexes of wind power generation (WG) in 20 regions.

Figure 7.
The comprehensive scores of commonality indexes of various DSER in a certain region. (a) The score of various DSER in region 1; (b) The scores of various DSER in region 2.
Figure 7.
The comprehensive scores of commonality indexes of various DSER in a certain region. (a) The score of various DSER in region 1; (b) The scores of various DSER in region 2.

Figure 8.
The comprehensive scores of commonality indexes in various regions. (a) The scores of WG in various regions; (b) The scores of electric vehicle (EV) in various regions.
Figure 8.
The comprehensive scores of commonality indexes in various regions. (a) The scores of WG in various regions; (b) The scores of electric vehicle (EV) in various regions.

Figure 9.
Value of individuality indexes of WG in 20 regions.

Figure 10.
The weight of individuality indexes of various DSER. (a) The weight of indexes of WG; (b) The weight of indexes of photovoltaic (PV); (c) The weight of indexes of EV; (d) The weight of indexes of energy storage (ES); (e) The weight of indexes of flexible loads.
Figure 10.
The weight of individuality indexes of various DSER. (a) The weight of indexes of WG; (b) The weight of indexes of photovoltaic (PV); (c) The weight of indexes of EV; (d) The weight of indexes of energy storage (ES); (e) The weight of indexes of flexible loads.

Figure 11.
The comprehensive scores of individuality indexes of various DSER in a certain region. (a) The score of various DSER in region 1; (b) The scores of various DSER in region 2.
Figure 11.
The comprehensive scores of individuality indexes of various DSER in a certain region. (a) The score of various DSER in region 1; (b) The scores of various DSER in region 2.

Figure 12.
The comprehensive scores of individuality indexes in various regions. (a) The scores of WG in various regions; (b) The scores of EV in various regions.
Figure 12.
The comprehensive scores of individuality indexes in various regions. (a) The scores of WG in various regions; (b) The scores of EV in various regions.


Table 1.
Definition of benefits.
| Subindex | Definition |
|---|---|
| Economic Benefits | A11 = Gwind/Cwind |
| Environmental Benefits | A12 = Ewind/Sq |
| Social Benefits | A13 = Mwind |
Table 2.
Definition of development potential.
| Subindex | Definition |
|---|---|
| Policy support | According to the relevant documents issued by the government, the support is divided into 1–5 levels from small to large |
| Sources of funds | The amount of funds provided by country for a certain DSER |
| Benefits | w1A11 + w2A12 + w3A13 |
| The amount of surplus resources | 1 − A2 |
Table 3.
Definition of output characteristics.
| Subindex | Definition |
|---|---|
| Daily Load Rate | B11 = Pav/Pmax |
| Peak Valley Difference | B12 = (Pmax − Pmin)/Pmax |
| Daily Load Fluctuation Rate | B13 = S/Pav |
Table 4.
Definition of reliability of WG and PV.
| Subindex | Definition |
|---|---|
| The proportion of the days meet the threshold | B21 = Dth/365 |
| Number of system failures | B22 |
Table 5.
Definition of peak shaving capability.
| Subindex | Definition |
|---|---|
| Battery capacity | B41 |
| Charging and discharging speed | B42 |
Table 6.
Definition of discharge performance.
| Subindex | Definition |
|---|---|
| Cycle life | B51 |
| Charge and discharge efficiency | B52 = Er/Ei |
Table 7.
The rule of quantifying users’ response capacity.
| User Type | User Representative | Quantized Value | |||
|---|---|---|---|---|---|
| Response Willingness | Response Capacity | Response Success Rate | Response Cost | ||
| Public user | office, school, hospital | 1–2 | 1 | 1–2 | 1 |
| Commercial user | supermarket, shopping mall, hotel | 1–2 | 3 | 1–2 | 3–4 |
| Industrial user | spinning | 4 | 4 | 3–4 | 2–3 |
| cement | 3–4 | 4 | 3–4 | 2–3 | |
| steel | 1–2 | 2–3 | 1–2 | 5 | |
| mechanical | 1–2 | 3–4 | 1–2 | 4–5 | |
| Resident user | Residential area | 4–5 | 1 | 4–5 | 1 |
Table 8.
The definition of the scale in the matrix.
| Scale | Meaning |
|---|---|
| 1 | two factors of equal importance |
| 3 | two factors, the former is slightly more important than the latter |
| 5 | two factors, the former is obviously more important than the latter |
| 7 | two factors, the former is mightily more important than the latter |
| 9 | two factors, the former is extremely more important than the latter |
| 2, 4, 6, 8 | the middle value of the above adjacent judgment |
| reciprocal | If the ratio of the importance of factor i to factor j is aij, the ratio of the importance of factor j to the factor i is aji = 1/aij |
Table 9.
Average random consistency.
| n | 1 | 2 | 3 | 4 | 5 | 6 | 7 | 8 | 9 |
|---|---|---|---|---|---|---|---|---|---|
| RI | 0 | 0 | 0.58 | 0.9 | 1.12 | 1.24 | 1.32 | 1.41 | 1.45 |
Table 10.
Weight of commonality indexes.
| Item | First Level Index | Weight | Subindex | Weight |
|---|---|---|---|---|
| Commonality indexes | Benefit | 0.5584 | Economic Benefits | 0.4567 |
| Environmental Benefits | 0.3745 | |||
| Social Benefits | 0.1688 | |||
| Resource development | 0.1220 | |||
| Development potential | 0.3196 | Policy support | 0.2956 | |
| Sources of funds | 0.3554 | |||
| Benefits | 0.1026 | |||
| The amount of surplus resources | 0.2464 |
© 2018 by the authors. Licensee MDPI, Basel, Switzerland. This article is an open access article distributed under the terms and conditions of the Creative Commons Attribution (CC BY) license (http://creativecommons.org/licenses/by/4.0/).
Share and Cite
MDPI and ACS Style
Chen, F.; Guo, S.; Gao, Y.; Yang, W.; Yang, Y.; Zhao, Z.; Ehsan, A. Evaluation Model of Demand-Side Energy Resources in Urban Power Grid Based on Geographic Information. Appl. Sci. 2018, 8, 1491. https://doi.org/10.3390/app8091491
AMA Style
Chen F, Guo S, Gao Y, Yang W, Yang Y, Zhao Z, Ehsan A. Evaluation Model of Demand-Side Energy Resources in Urban Power Grid Based on Geographic Information. Applied Sciences. 2018; 8(9):1491. https://doi.org/10.3390/app8091491
Chicago/Turabian StyleChen, Feifan, Shixiao Guo, Yajing Gao, Wenhai Yang, Yongchun Yang, Zheng Zhao, and Ali Ehsan. 2018. "Evaluation Model of Demand-Side Energy Resources in Urban Power Grid Based on Geographic Information" Applied Sciences 8, no. 9: 1491. https://doi.org/10.3390/app8091491
Note that from the first issue of 2016, this journal uses article numbers instead of page numbers. See further details here.