Strain Ratio as a Quantification Tool in Strain Imaging
by
 ,
,
Roald Flesland Havre
1,2,* ,
,
Jo Erling Riise Waage
3,
Anesa Mulabecirovic
2,4,
Odd Helge Gilja
1,2,4 and
Lars Birger Nesje
1,2,4 1
Department of Medicine, Haukeland University Hospital, 5021 Bergen, Norway
2
National Centre for Ultrasound in Gastroenterology, Haukeland University Hospital, 5021 Bergen, Norway
3
Department of Surgery, Nordsjællands Hospital, 3400 Hillerød, Denmark
4
Department of Clinical Medicine, University of Bergen, 5020 Bergen, Norway
*
Author to whom correspondence should be addressed.
Appl. Sci. 2018, 8(8), 1273; https://doi.org/10.3390/app8081273
Submission received: 22 June 2018
/
Revised: 20 July 2018
/
Accepted: 23 July 2018
/
Published: 1 August 2018
(This article belongs to the Special Issue Ultrasound Elastography)
Abstract
:Featured Application
Strain-based elastography. In this paper, a Real-Time Elastography (Hitachi Medical Corporation, Zug, Switzerland) is used with relevant probes for external and endoscopic applications.
Abstract
Ultrasound-based strain imaging is available in several ultrasound (US) scanners. Strain ratio (SR) can be used to quantify the strain recorded simultaneously in two different user-selected areas, ideally exposed to the same amount of stress. The aim of this study was to evaluate SR variability when assessed in an in-vitro setup with a tissue-mimicking phantom on resected tissue samples and in live tissue scanning with endoscopic applications. We performed an in vivo retrospective analysis of SR variability used for quantification of elastic contrasts in a tissue-mimicking phantom containing four homogenous inclusion in 38 resected bowel wall lesions and 48 focal pancreatic lesions. Median SR and the inter-quartile range (IQR) were calculated for all external and endoscopic ultrasound (EUS) applications. The IQR and median provide a measure of SR variability focusing on the two percentiles of the data closest to the median value. The overall SR variability was lowest in a tissue-mimicking phantom (mean QR/median SR: 0.07). In resected bowel wall lesions representing adenomas, adenocarcinomas, or Crohn lesions, the variability increased (mean IQR/Median: 0.62). During an in vivo endoscopic examination of focal pancreatic lesions, the variability increased further (mean IQR/Median: 2.04). SR variability increased when assessed for different targets with growing heterogeneity and biological variability from homogeneous media to live tissues and endoscopic application. This may indicate a limitation for the accuracy of SR evaluation in some clinical applications.
1. Introduction
Soft tissue elastic properties change in various pathological tissues, such as malignant tumors and inflammatory processes. Strain elastography can be used to quantify this physical feature based on ultrasound imaging. Tissue hardness can be assessed across tissue images describing the Elastic modulus (E), defined as the relationship between the application of local stress and the resulting strain. This can be expressed as:
Since the stress is not recorded as it travels from the stress source through the tissue as it gradually attenuates, calculating the Elastic modulus from strain data alone is not possible. This phenomenon is sometimes referred to as the “inverse problem” of strain elastography [1]. Under similar stress, strain in harder tissue is lower than strain in softer tissue [2,3]. Thus, a comparison between strain in the reference tissue and lesion produces a ratio that increases above one when the focal lesion is harder than the reference tissue. Strain ratio (SR) represents the relative difference in tissue hardness [4]. The definition of SR is:
Hooke’s law states that for small deformations in elastic media, the strain is linearly proportional with the force (stress) applied. However, this is true for isotropic and homogeneous media with near infinite or free border conditions. These conditions are rarely present in biological tissues, which exhibit non-linear elastic properties of different magnitudes due to differences in tissue structure and function. This may be of importance for the accuracy of strain elastography. By restricting the pre-compression and range of compressions (Δ-stress) to a limited interval, the stress–strain relation of the tissues involved may still be regarded as linear.
Vital tissue contains ducts and veins that act as stress dampers, as well as connective tissue and sliding anatomical surfaces that limit and enhance tissue movement, respectively. Unintended movements may cause strain concentration and reduce the accuracy of SR evaluation. Hence, in vivo conditions often do not meet the preconditions of Hooke´s law for elasticity calculation, and may therefore represent limitations and cause strain-imaging artefacts that increase variability and reduce the reproducibility of SR measurements.
SR expresses a momentarily and relative difference in compressibility in two user-selected areas within selected regions of interest in a strain elastogram. SR is dependent on similar stress applications in the two areas compared, and similar stress attenuation in the tissue between the stress source (probe) and the area of interest. The SR measurement method was first introduced as the “fat-lesion ratio” in breast imaging, where an area of subcutaneous fat was used as the reference to mean strain in the lesion under investigation. Using the subcutaneous fat as reference was perhaps as close to a standardized reference tissue as one can get. However, the same preconditions apply, as the tissue constitution between the probe and target lesion, and the probe distance may influence the strain distribution in reference area fat tissue.
The variations in elasticity of biological tissues is not linear with varying pre-compression or stretch of the tissue. For breast and pancreatic tissues, this has been evaluated by force indentation and deformation studies under increasing strength. This implies that the amount of pre-compression and the range of the stress applied influences the strain result and thereby the elastogram. In one study, the authors recommended a pre-compression level less than 0.2–0.4 kPa for breast imaging [5].
Another physical condition that complicates the reproducibility of strain ratios is the temporal variability in a live strain cine-loop. The best phases for acquiring strain data is during the compression and decompression phase, since no strain signal is transmitted when the stress is stable between these two phases. Compression and decompression of vital tissue may be caused by applied pressure from the probe or by natural internal movements from arterial pulsation, heart movements, or even breathing. Some strain elastography platforms provide feedback to the examiner about the phase of compression or decompression on which the image is acquired, enabling the use of SR from similar phases of tissue straining. One study on breast imaging concluded that peak SR performs better than average SR in breast tumor characterization [6].
Several studies reported high accuracy of SR in determining focal breast lesions as malignant or benign. In a meta-analysis, Sadigh et al. reported a sensitivity and a specificity of 88% and 83%, respectively, for SR with a receiver operating characteristic-area under curve (ROC-AUC) of 0.92. Strain elastography with SR has been compared to evaluation using a strain histogram with similar good results [7]. SR was reported to be better than magnetic resonance imaging (MRI) for breast tumor characterization, but the combination of the two modalities had a better ROC-AUC of 0.914 [8]. Furthermore, for the evaluation of axillary lymph nodes in breast cancer patients, a combined evaluation of B-mode ultrasound (US) and Real-Time Elastography (RTE) increased specificity [9]. Also, in the characterization of thyroid nodules as malignant or benign, SR was reported to have sensitivity of 85–89% with specificity of 80–82% in two meta-analyses [10,11]. In trans-rectal applications in prostate and rectal tumors, SR has been used to improve B-mode identification of malignant tumors with adequate accuracy (ROC-AUC > 90%) [12,13].
The aim of this study was to retrospectively compare variability in strain-based elastography quantified by SR, recorded in three different applications using Real-Time Elastography in homogeneous tissue-mimicking media, in resected tissue from bowel lesions, and during the endoscopic ultrasound (EUS) of focal pancreatic lesions. We chose to calculate the inter-quartile range (IQR) and median for all applications based on previous studies, since this has become a much-used quality-indicator in transient- and shear-wave elastography platforms. Our hypothesis is that SR measurement variability would increase substantially from phantom scanning to an endoscopic application on pancreatic lesions, which may limit the usefulness of the method in some applications.
2. Materials and Methods
The SR data in this study were recorded on the Hitachi (Hitachi Medical Corporation, Tokyo, Japan) Extended Combined Autocorrelation Method (ECAM) also known as Real-Time Elastography (RTE) operated on Hitachi HV-900 and Ascendus platforms (version: V16-04 STEP 2). US data were acquired using external linear probes (L54, 9–13 MHz). The phantom used was a standard model made of Zerdine® (US pat no. 5196343) embedded in a firm box including eight spherical inclusions with elasticities of 8, 14, 45, and 80 kPa in a background of 25 kPa (CIRS, model 49, Norfolk, Virginia, USA) (Figure 1).
To study surgical bowel specimens, we collected the specimens in the operation room, washed them, and proceeded directly to scanning in a designated scanning box with the bottom covered with 1 cm of agar. Bowel specimens were then fixated in formalin when attached to the bottom with colored pins, marking the scan-planes. A Hitachi HV-900 scanner was used with a L54 M linear probe, 9–13 MHz. We included 9 specimens from patients with Crohn’s disease (16 sections scanned), 16 patients with adenocarcinomas (18 tumor sections scanned), and 3 patients with adenomas (4 lesion sections scanned). One patient had both an adenocarcinoma and an adenoma. Altogether, 38 sections of separate lesions were included. Histology was the reference standard. For further details on the patients and method, please refer to the original publication [14].
To examine pancreatic lesions, the data were recorded prospectively over a three-year period. We used Hitachi HV-900 with software version V16-04 STEP2. The echoendoscope was a Pentax EG-3870 UTK (Pentax Medical, Hamburg, Germany). We included 48 lesions from 39 patients: 11 adenocarcinomas, 7 malignant neuroendocrine tumors (NETs), 11 benign/indeterminate NET, 8 focal lesions in pancreatitis, 2 microcystic adenomas, and 9 other benign lesions. The reference standard was histology, EUS fine-needle-aspiration (FNA), or follow-up for at least 6 months. For further details and the diagnostic accuracy, please refer to the original publication [15].
Statistical Methods
We used the mean of the median SR values for each class of lesion, the range of values (max–min) and the interquartile range (IQR) for different objects or lesions. The IQR is a measure of the variability based on the two central quartiles from the 25th–75th percentile. The remaining 50% in the eccentric quartiles are not part of the IQR, but are accounted for by the range, representing the gap between the highest and lowest measured value. Kolmogorov–Smirnov’s test was used to determine the distribution of data, and one-way Analysis of variance (ANOVA) or non-parametric tests were used accordingly. We then used the Kruskal–Wallis test for individual samples to compare the median SR, the IQR, and the IQR/median for the three applications of Real-Time Elastography with SR. We also analyzed the difference in median SR, IQR and IQR/median between observer A and B in the phantom and for benign or malignant pancreatic lesions by EUS elastography using one-way ANOVA and t-test. A difference with a p-value < 0.05 was considered statistically significant. We also used the intraclass correlation coefficient (ICC) to calculate inter observer agreement when possible.
All patients had signed a consent form to participate in the two studies that provided SR data for comparison of variability. For statistical analysis, we used SPSS, version 24 (SPSS, IBM, New York, NY, USA). Study protocols as well as patient information and consent forms were approved by the institutional committee for Research in Medicine and Biology. The studies were conducted according to the Helsinki Declaration for Research in Medicine and Biology. A excel file (Microsoft Corporation, Redmond, WA, USA) with the pooled data for phantom inclusions, surgical specimens and pancreatic lesions by entity is included as a Supplementary Materials file.
3. Results
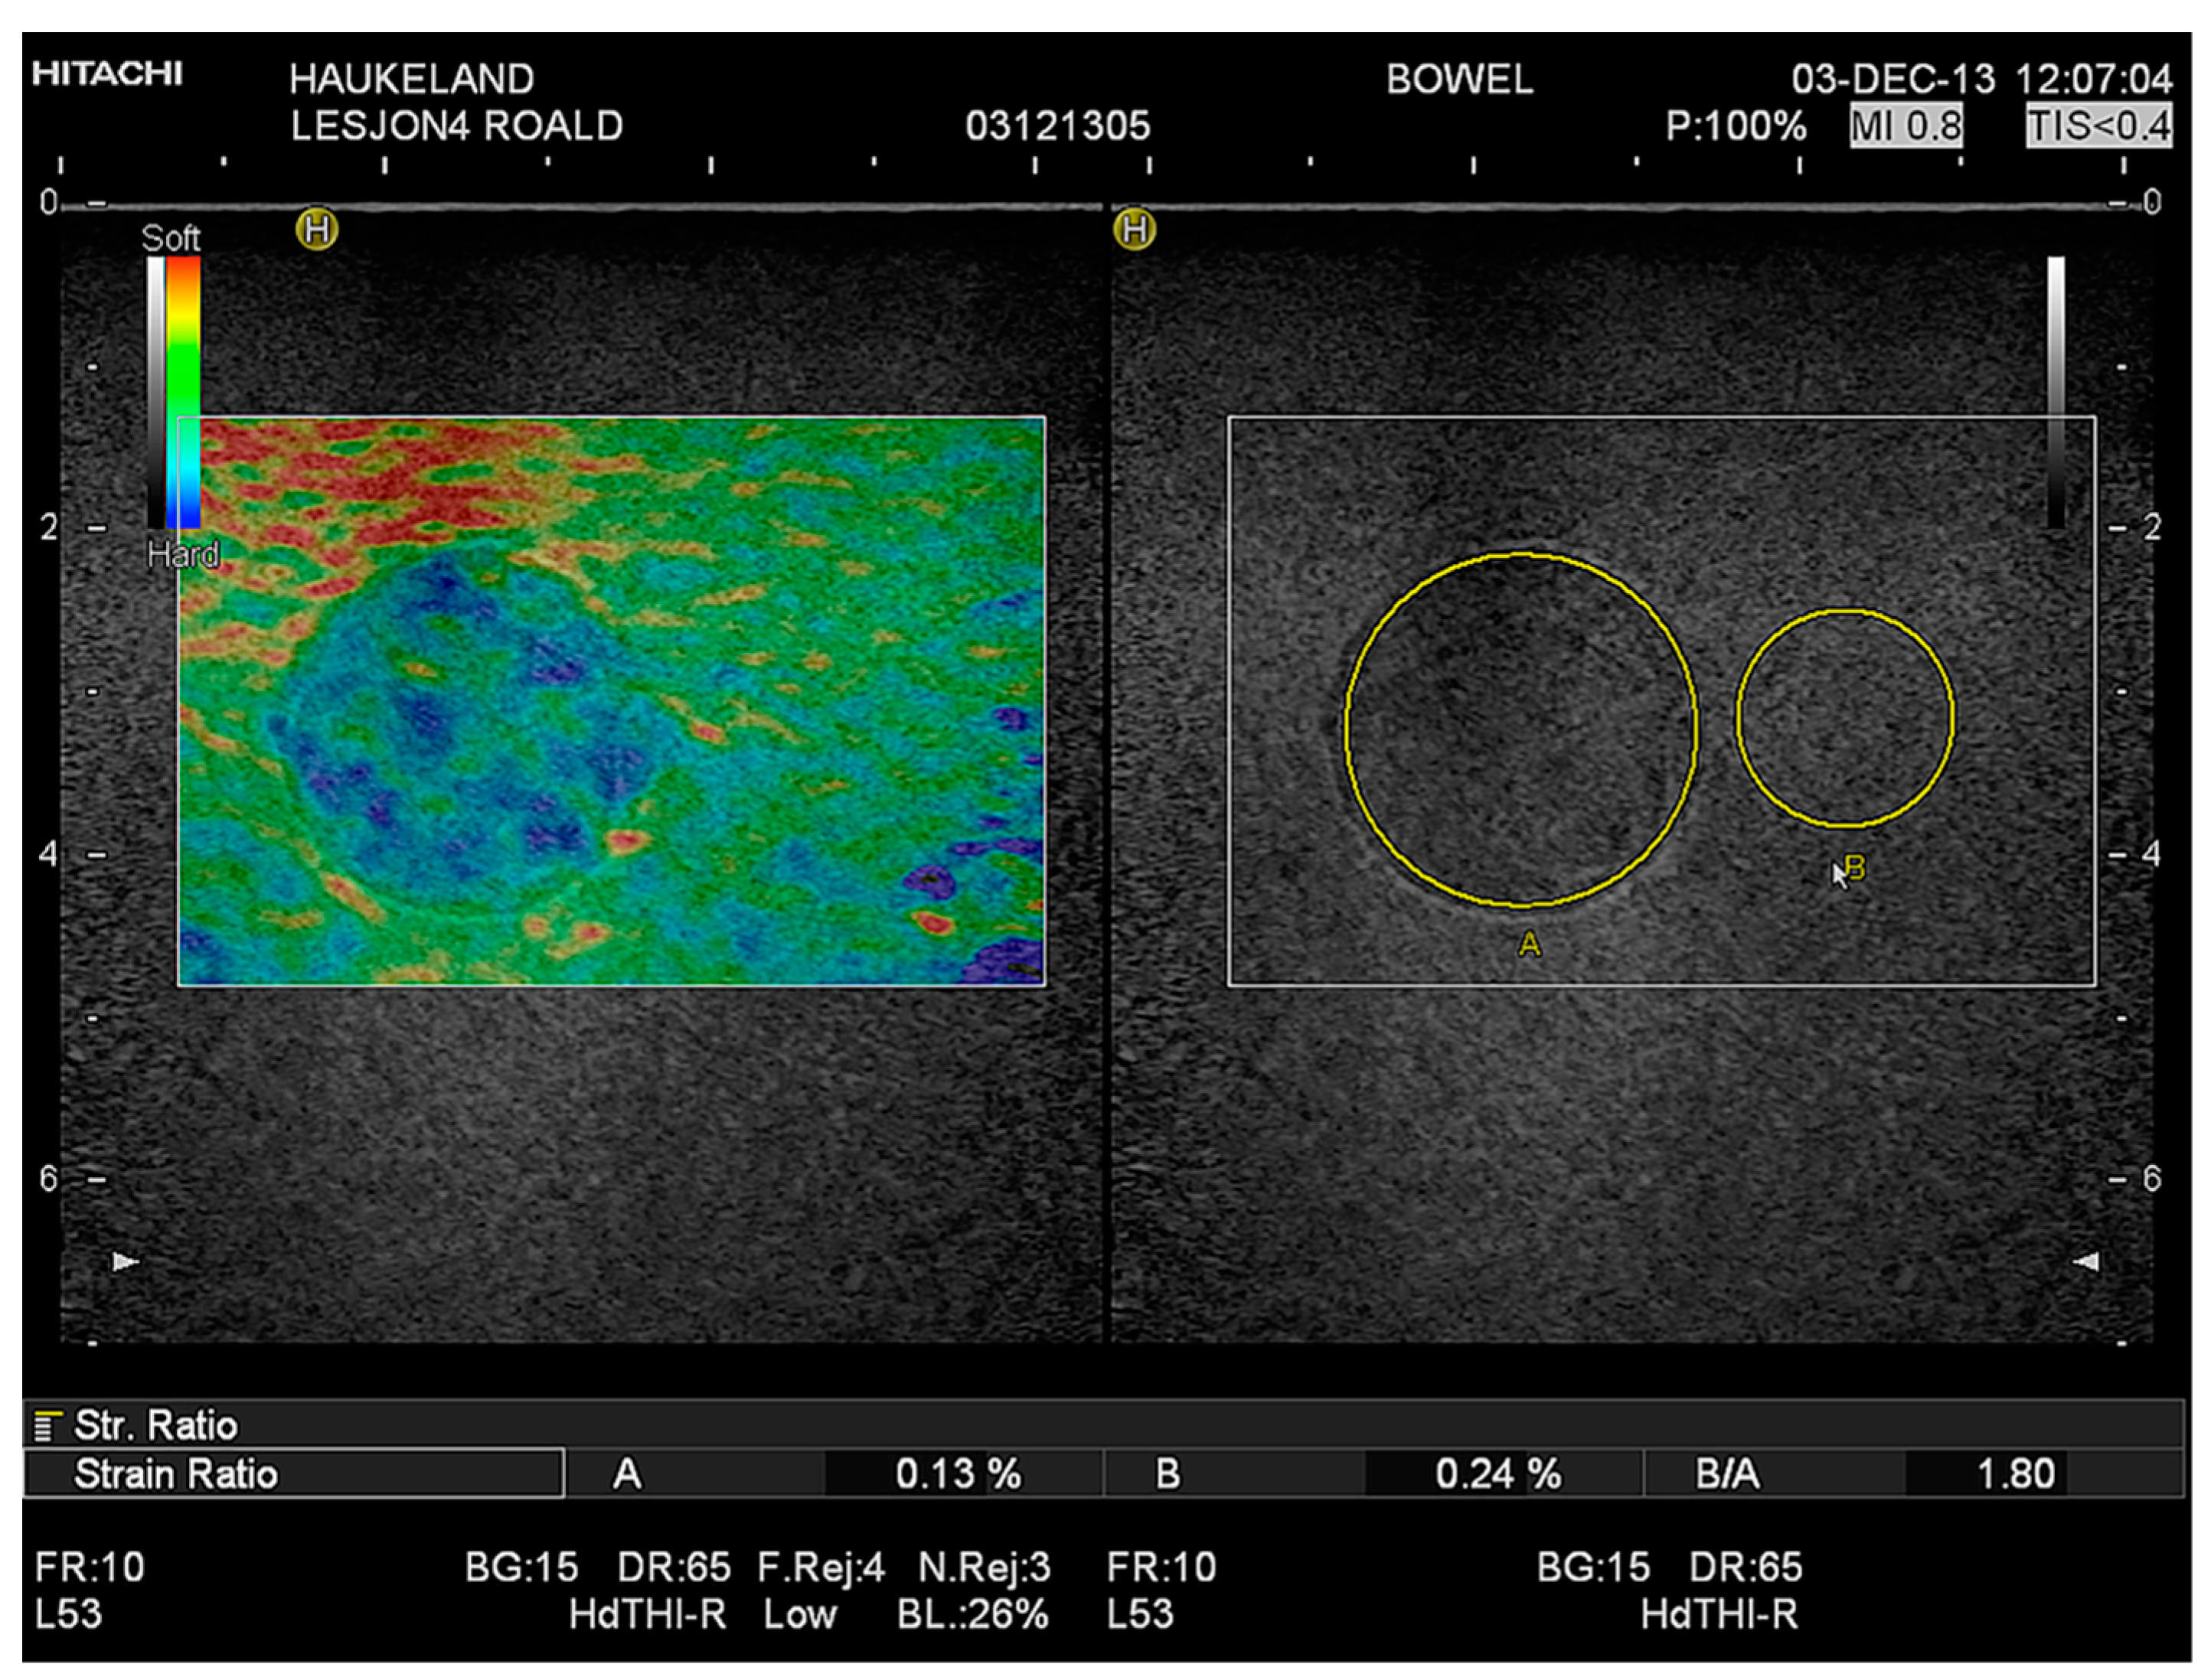
In a homogeneous, tissue-mimicking phantom, four spherical inclusions with elasticity different from the background were examined by two different observers. Observer A had little experience with US scanning and observer B had extensive experience with both phantom and clinical application of US strain imaging methods. An image of inclusion 4 (80 ± 12 kPa) is shown in Figure 2.
In Table 1, the median values of 10 repeated SR measurements are reported for observer A and B, their range and interquartile range (IQR), and the IQR/median. The last measure represents the variability of 50% of the central observations divided by the median value. The common mean value for observers A and B was 0.07. The IQR for all median SR values for all inclusions was ≤0.17.
3.1. Interobserver Variability
The interobserver variability in the phantom lesions expressed by the mean of the SR medians showed no significant difference between the two observers (p = 0.937 ANOVA). The IQR/median SR ranged from 0.063 to 0.156 (mean: 0.101) for observer A who had the least experience, and 0.025–0.073 (mean 0.043) for observer B who had more experience, but the difference was not significant (p = 0.055, ANOVA).
The distributions of median SR and IQR/median were not significantly different between observers A and B. The mean IQR alone was significantly different between observer A, at 0.125 (SD: 0.050), and observer B 0.050 (SD: 0.018) (p = 0.027 ANOVA). The range was not significantly different between the observers. The interobserver agreement assessed by intra-class correlation (ICC) for average measures between observer A and B was 0.661 (p = 0.040).
3.2. Strain Ratio in Surgical Specimens
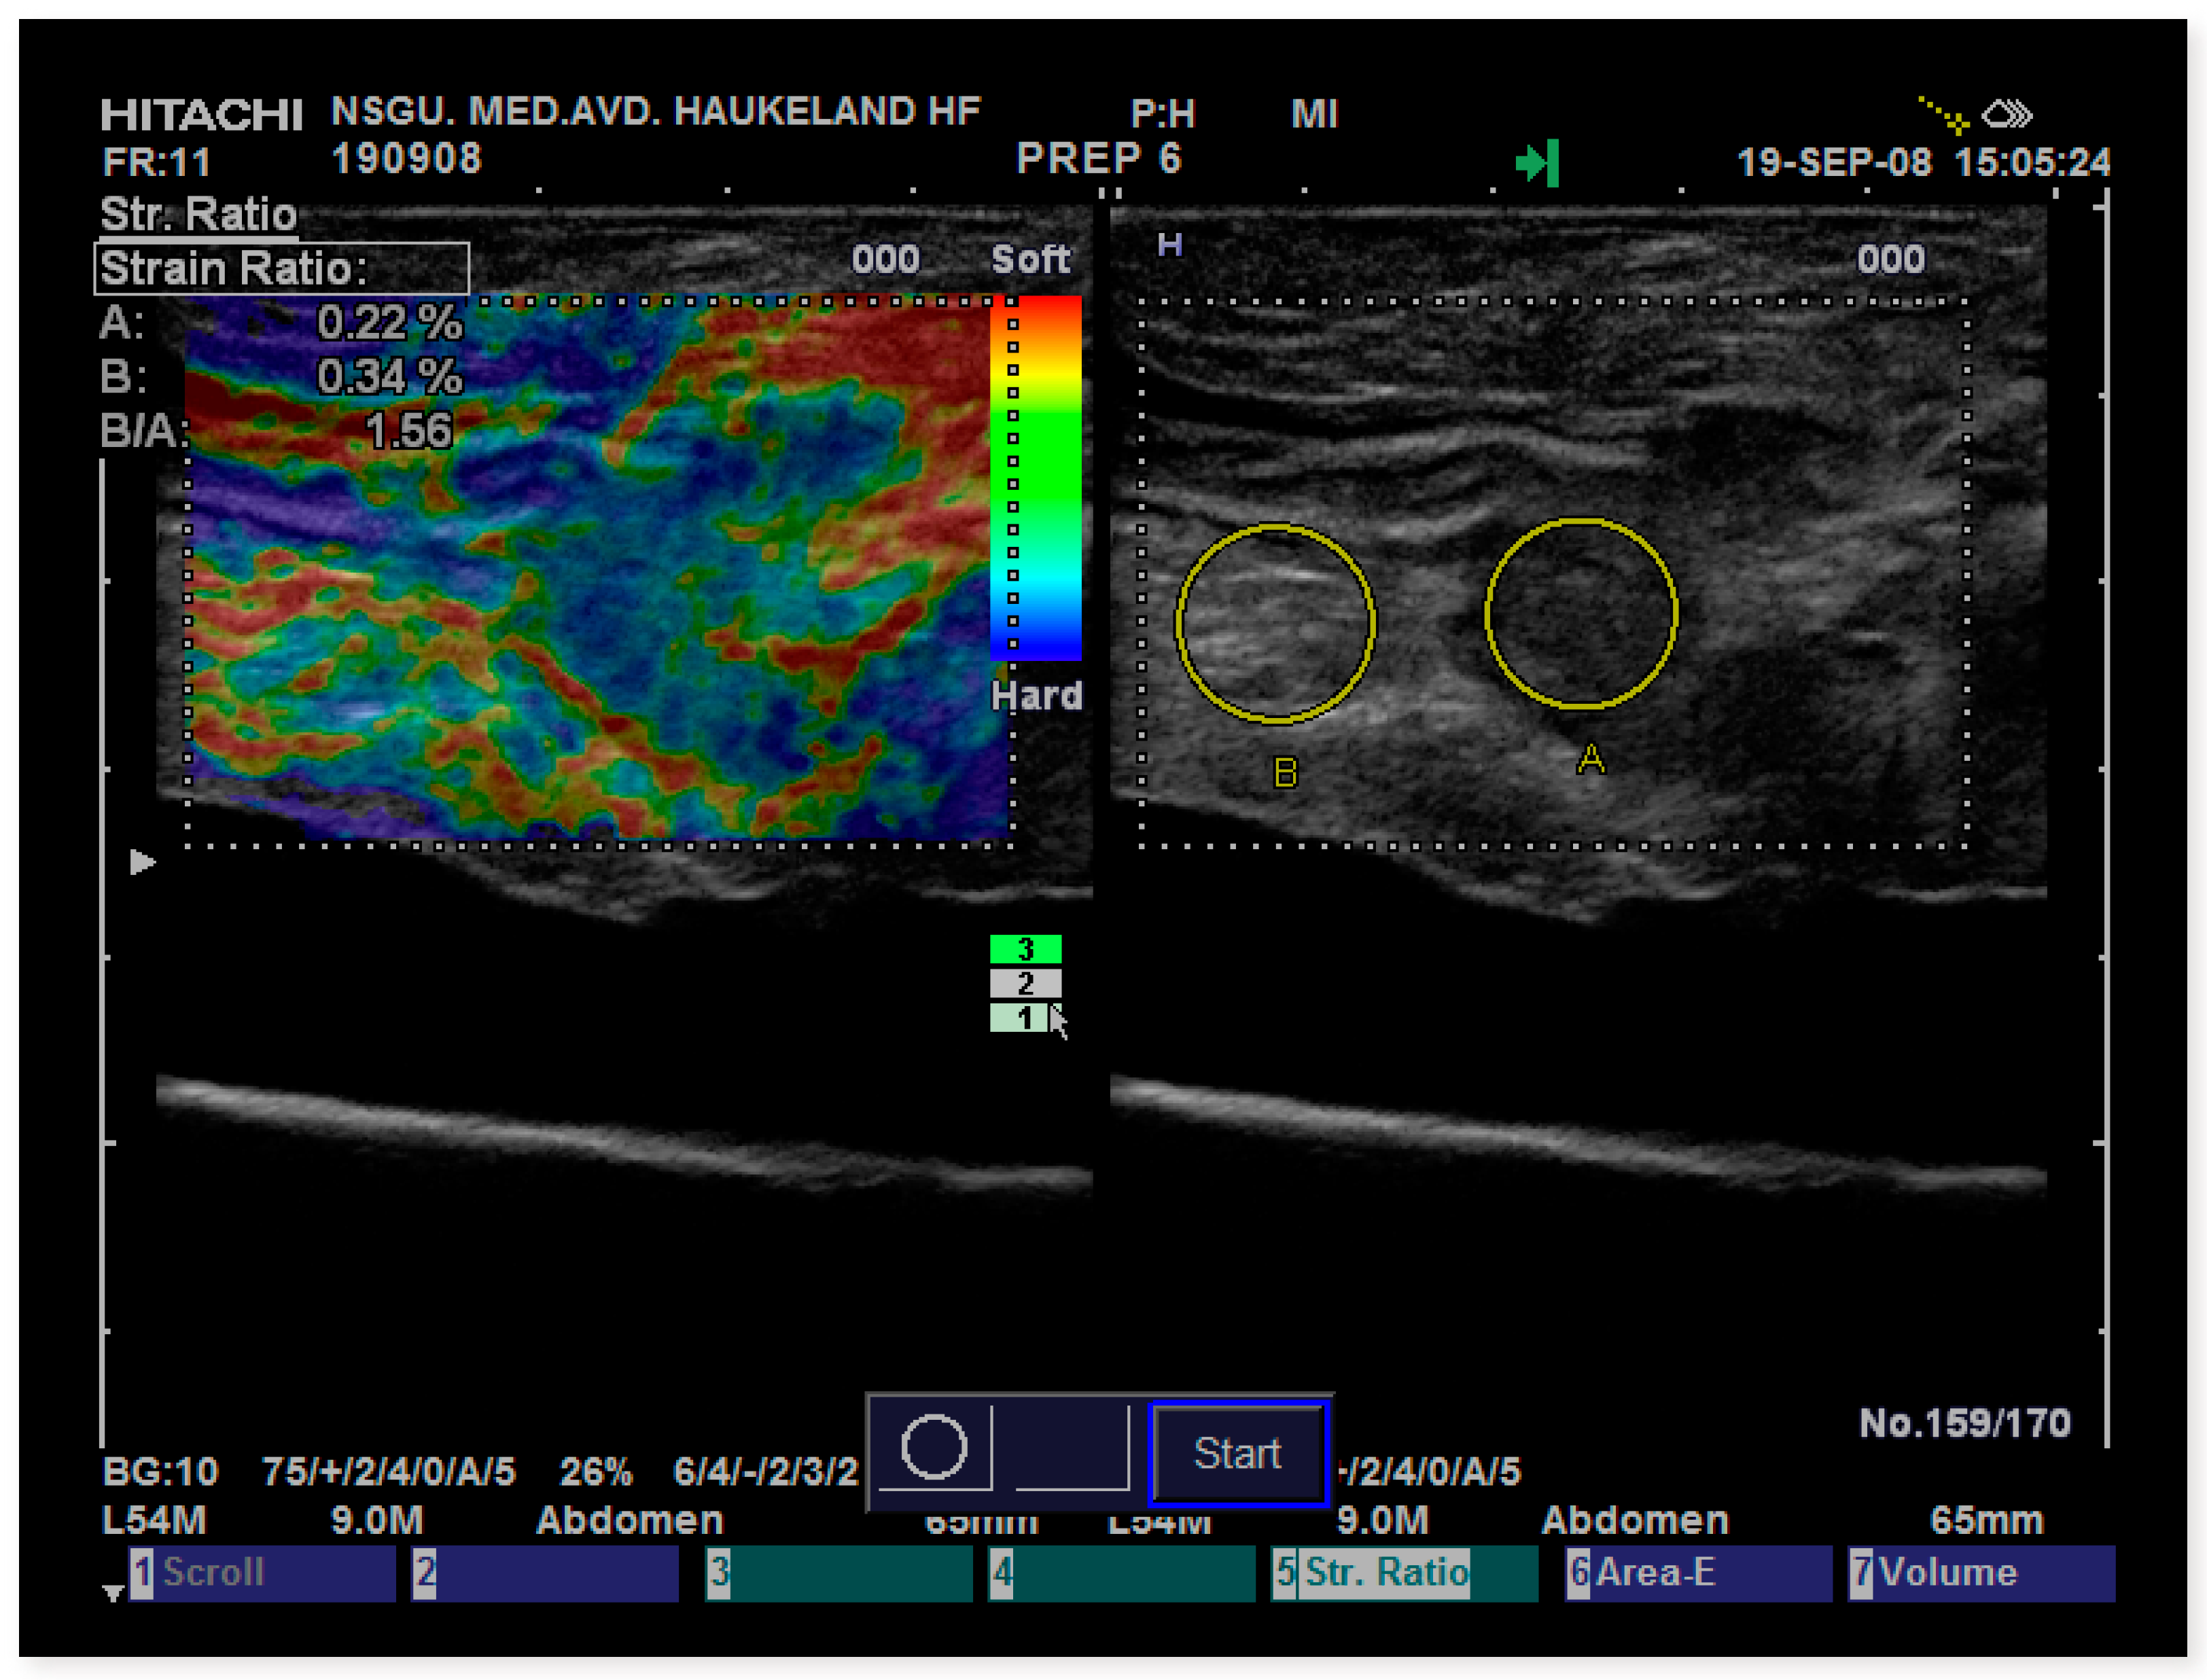
One observer scanned surgically removed bowel specimens including tumors or resected Crohn lesions. The image of a scanned bowel wall with an adenocarcinoma is shown in Figure 3. The data on SR were previously published, but IQR/median was not used as a variability parameter [14]. SR was recorded between the normal bowel wall and peri-colic fat/connective tissue and the lesion of interest. SR results including range, IQR and IQR/median for the entities adenoma, Crohn lesions, and adenocarcinomas are reported in Table 2. Crohn lesions had a wide range in measurements (21.44), but they had the lowest IQR/median of 0.31. For adenocarcinomas, the IQR/median was 0.66 and for adenomas, represented by a limited number (4); the IQR/Median was 0.88. For all SR measurements of resected bowel tissue, the variability expressed by IQR was ≤0.88. The mean IQR/mean in all resected tissue was 0.62.
3.3. Strain Ratios in Live Tissue Using Endoscopic Ultrasound (EUS)
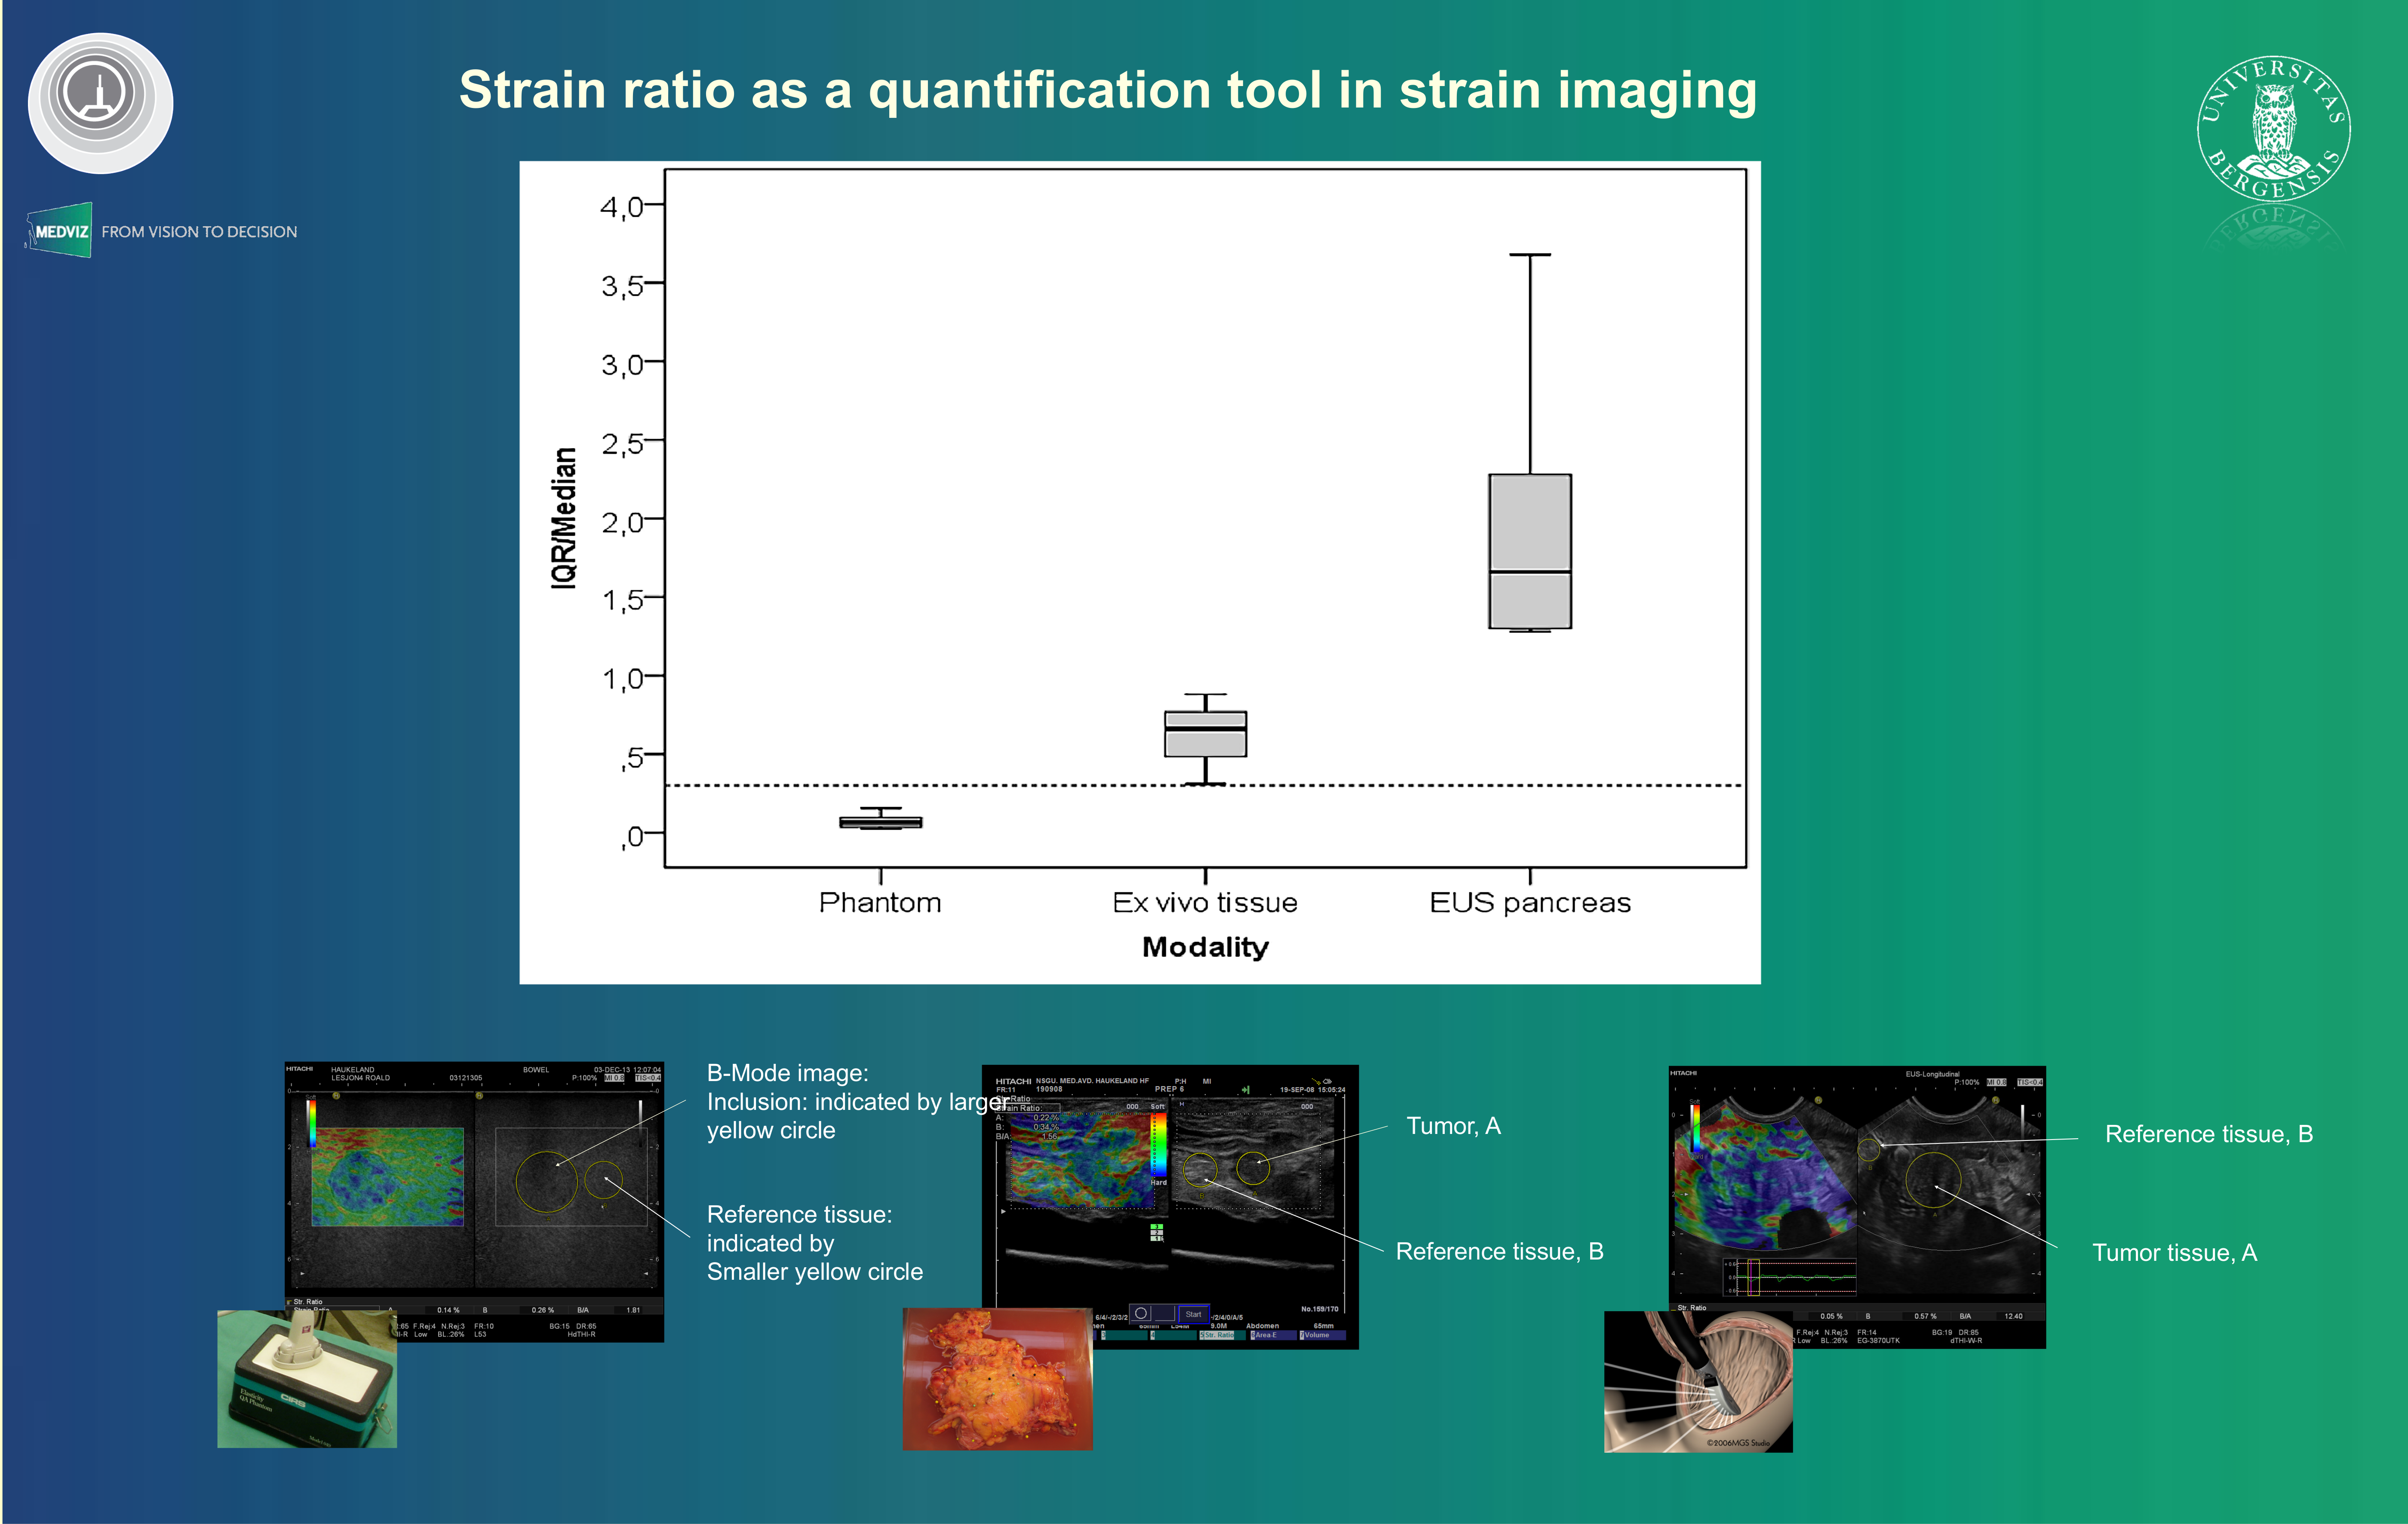
The data on pancreatic lesions representing various focal entities is reported in Table 3. The mean and range of these data had previously been published [15], but the IQR/median was not calculated and was not used as a variability parameter previously. The mean of median SR of the malignant pancreatic lesions was 7.05 (SD 1.85) and for the benign lesions, 2.15 (SD 1.22), (p = 0.035 t-test). For all entities, the IQR was higher than the median SR value, indicating substantial variability. For the malignant lesions the mean IQR/Median SR was 1.79 (SD 0.69) and for the benign lesions the mean IQR/Median SR was 2.21 (SD 1.29). The difference was not significant (p = 0.713, t-test). The mean IQR/Median SR for all pancreatic focal lesions by EUS elastography was 2.04. The IQR/Median SR value for lesions in focal pancreatitis was the highest (3.68), reflecting the large variability observed in focal pancreatitis as well as a relatively low median SR for this entity (0.91).
3.4. IQR/Median SR for Three Applications of Strain Elastography
For the three applications reported here, the IQR/median SR increased from scanning a tissue mimicking phantom to ex-vivo surgical specimens of bowel pathology, and increased further when the strain imaging was performed endoscopically focusing on focal pancreatic lesions. The difference between the IQR/median SR was significant (p = 0.002, Kruskal-Wallis; Figure 4).
3.5. Reference Area Variability
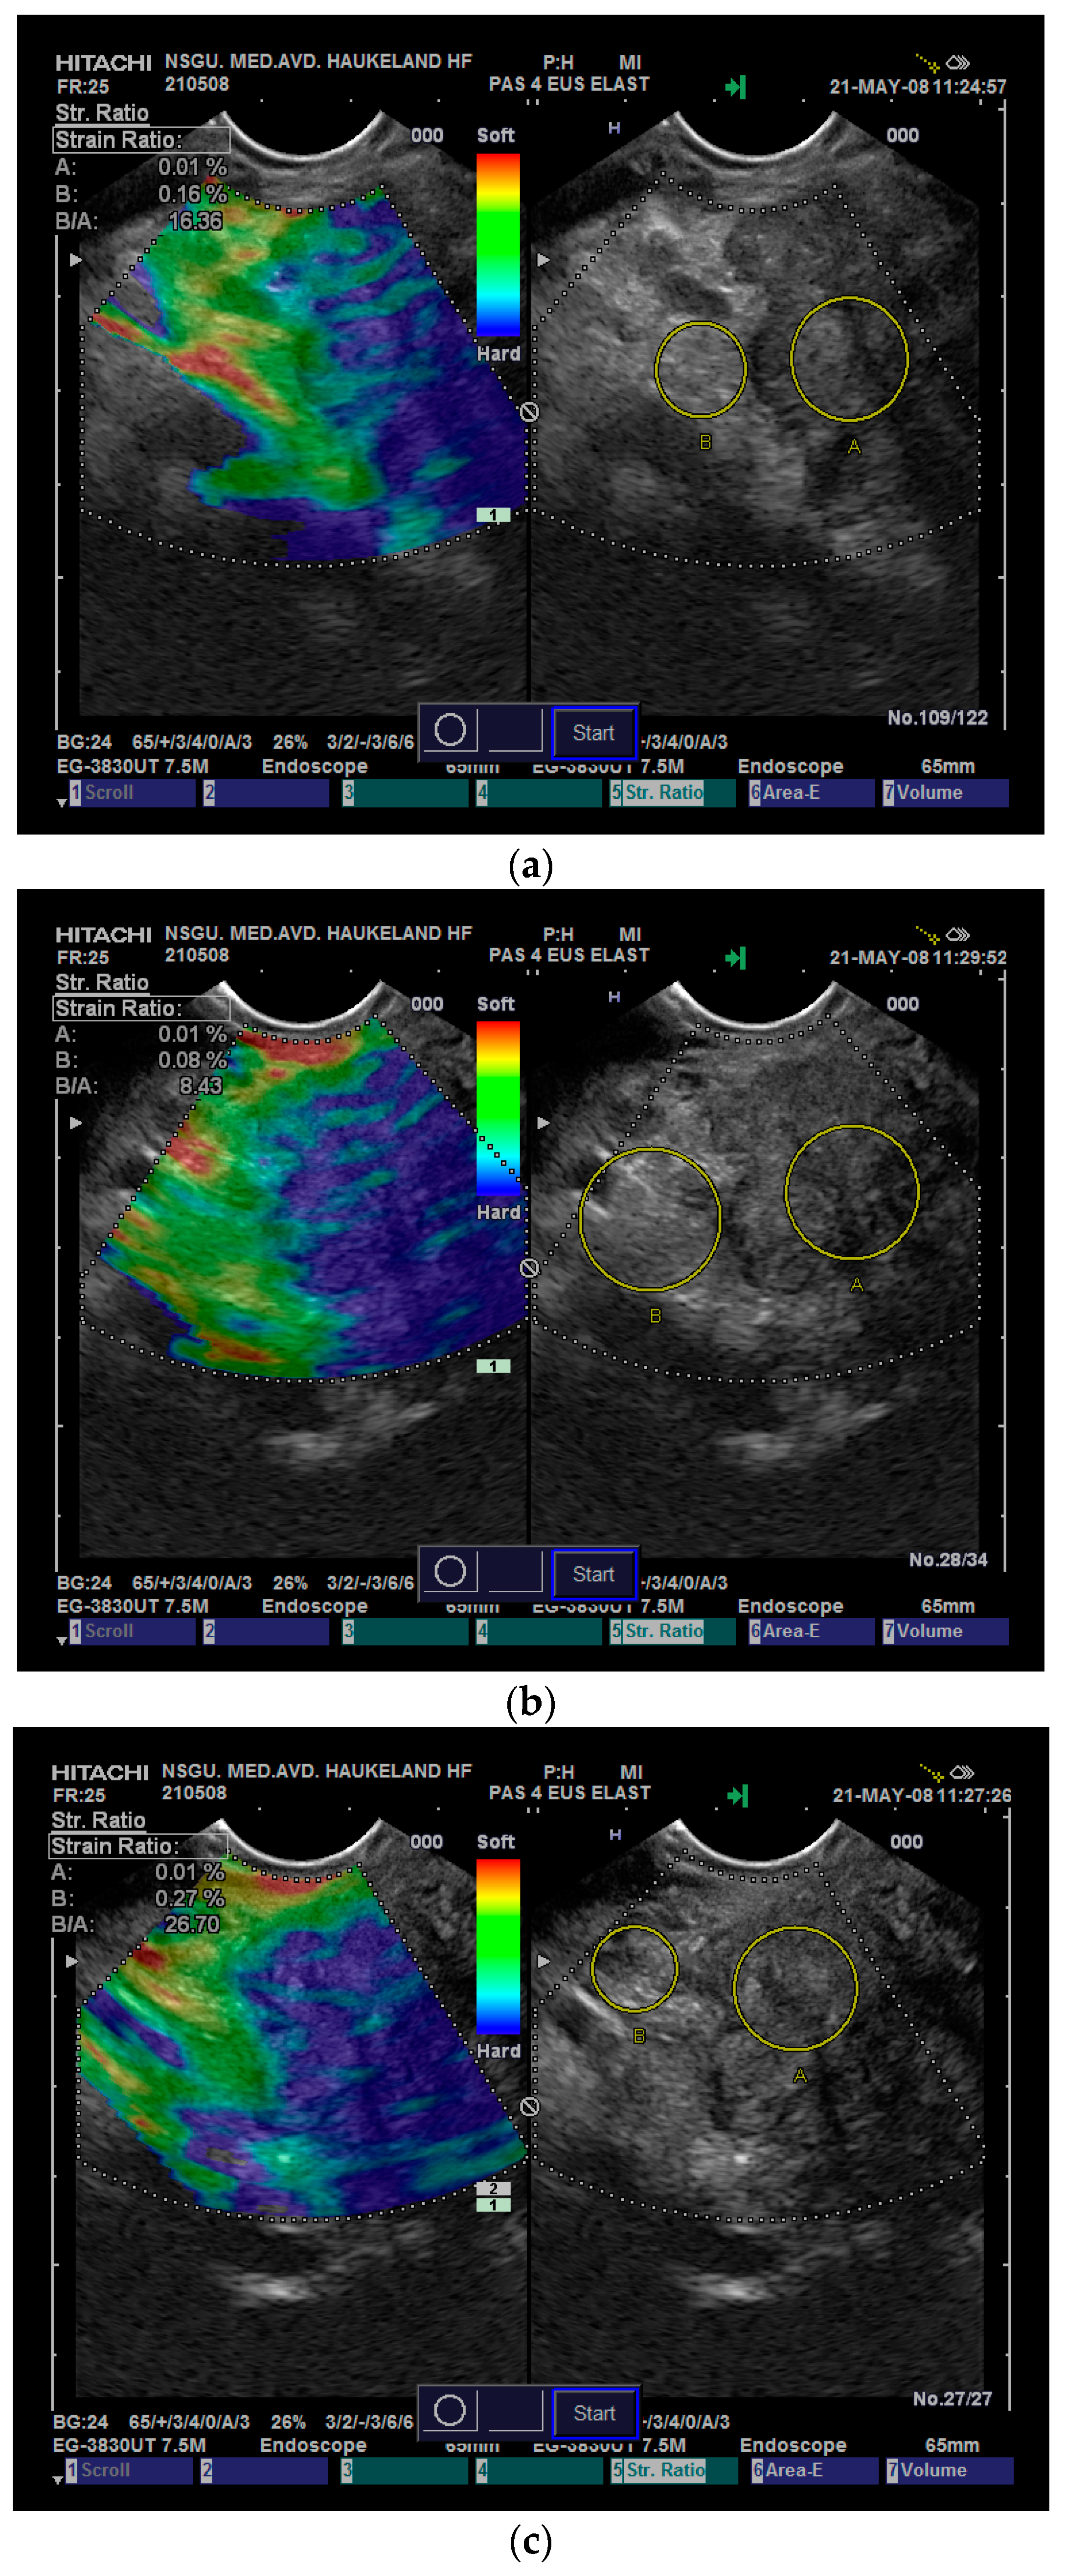
Figure 5a–c demonstrate three different frames of strain images obtained with EUS elastography, including SR measurements of the same pancreatic tumor using slightly different but relevant reference areas. The three SRs obtained ranged from 8.43 to 16.36 to 25.70. All the variation was caused by variability in the reference tissue, in which strain varied between 0.08% to 0.16% to 0.27%. The lesion strain was 0.01% in all images.
4. Discussion
In this paper, we presented SR measurement in a tissue-mimicking phantom and in resected tissue, where the stress was applied by pushing gently with the probe itself, focusing on the measurement variability. We also presented data from EUS elastography of focal pancreatic lesions where arterial pulsations, particularly from the aorta, acted as an internal stress source. We showed that the IQR increased with application to more complex anatomical structures and inability to control the stress source to a level that surpasses the median SR value. The mean value of the IQR/median increased 8.6 times from the phantom (0.07) to resected tissue (0.62) and 28.3 times with endosonographic application (2.04).
When applying strain elastography in an endoscopic application, the strain is dependent on endogenic stress sources, such as aortic pulsation and respiratory movements. These sources may vary considerably between patients and can hardly be standardized. Also, the availability of stable reference tissue that should be subject to similar stress as the lesion, may be hard to find in this application. Moreover, further differences may be caused by variable levels of pre-compression and applied stress caused by the endoscope. Since soft tissues have non-linear elastic properties, the tissue will appear harder with more applied stress or increased pre-compression [5,16]. An endoscopic application is also challenging because the probe is inserted into the gastrointestinal cavity and cannot be controlled directly by the observer’s hands, as is the case with external strain imaging ultrasonography. Lu et al. performed a meta-analysis of EUS elastography in pancreatic lesions evaluated qualitatively with a visual score, strain histograms, SR, contrast enhanced EUS, and EUS FNA. They identified a large range in SR cut-off values based on previous published cut-off values or the ROC curves (3.05 to 24.82). This caused large heterogeneity for the specificity, and three-eighths of the studies were identified as outliers. After removing the outliers, the evaluation for identification of malignant lesions based on qualitative visual scores and strain histograms outperformed the SR-based evaluation (sensitivity: 0.94, specificity: 0.54, diagnostic odds ratio (OR): 29.42 [17]. However, strain elastography and SR-based assessment of rectal tumors using a dedicated radial rectal probe, which allows induction of strain by rapid water-inflation of a balloon around the US probe, was used to improve patient selection for organ-sparing treatment compared to standard multidisciplinary assessment [18].
In our experience, the variability in SR measurements increases when we transitioned from application with good access to relevant reference tissue, which allows for hand-eye coordination of inflicted stress, made possible by the real-time strain-feedback to the examiner on the screen. Selection of the reference area for comparison with a focal lesion also introduces variability that may influence the resulting SR more than the strain variability of the lesion itself, as illustrated in Figure 5. To avoid the variability induced by the reference area, some researchers recorded the strain values in the lesion of interest using the Strain Histogram (SH) function and found that it performed equally as well as the SR in some applications. However, this is dependent on a near standardized application of stress to the lesions of interest. The SH function displays the distribution of the different colors representing different strain intervals in a 256 scale, from no strain (0) to maximum strain (256), as set by the scanner software. From a histogram, quantifying the distribution of recorded strains it is also possible to evaluate if the lesion and reference tissue is homogeneous or heterogeneous by using kurtosis and range. Carlsen et al. showed that the SH (cut-off: 189) performed equally well as SR (cut-off: 1.44) in differentiating malignant from benign breast lesions, but the modality could not improve diagnostics when compared with radiological Breast Imaging-Reporting and Data System in a limited material [7]. The median value of the histogram represents the median hardness of the lesion. Opacic et al. suggested using the median histogram value of the reference tissue divided by the median value of the lesion histogram to create a histogram ratio. In a study of pancreatic lesions, this did not perform better than SR with a ROC-AUC of 0.843 and a cut-off selection yielding a specificity of 98%, a sensitivity of only 50%, and an accuracy of 69% [19]. Unfortunately, we did not record the strain histograms in our studies of surgical specimens and pancreatic lesions as this function was not available at the time.
Visual evaluation of the elastogram is direct and intuitive and requires no post-processing. Several scoring systems for categorical scoring of strain images have been proposed. For breast imaging, the five-point Tsukuba scale was proposed by Itoh et al. [20]. In two meta-analyses, SR measurements were found to differentiate malignant from benign breast lesions better than using the visual scoring range of one to five [21,22]. Amended versions of this visual score have been proposed for other organs, such as for the pancreas and lymph nodes by EUS elastography. Both the continuous visual analog scale (VAS) score and categorical visual scores for endoscopic assessment of rectal tumors has shown comparable results with SR measurements [23]. In a comparative study of SR and the five-point visual elastography breast scale, SR was more accurate. However, the direct visual impression of an experienced examiner using elastography imaging may contain more information than a five-step visual score can comprehend, which is useful in many cases for lesions in doubt. With training, different aspects of the elastogram, such as strain concentration and artefacts caused by veins and natural sliding surfaces, can be recognized. These findings can hardly be recognized by SR, histograms, or other formal quantification methods. One group investigated the use of automated pattern and color recognition of elastography of focal pancreatic lesions in 258 patients. They used an artificial neural network image analysis and information about the histological diagnosis from endoscopic elastography as the input. This improved the accuracy, with a ROC-AUC of 0.94, significantly better compared to using only lesion strain histograms that had a ROC-AUC of 0.85. This evaluation was performed using collected data in a multicenter study [24] but required substantial post-processing. In the future, automated tissue recognition or a material of standardized hardness, serving as a reference within the field-of-view, may be ways to improve SR in endoscopic applications. Also, averaging strain values over several frames or filtering noisy strain areas in the elastograms may improve SR measurements. We may possibly also soon see shear-wave elastography for flexible endoscopes.
Limitations
This study was based on previously recorded strain ratios from a tissue mimicking phantom and real tissues, both in vitro and in vivo. The data are based on different numbers of lesions for each application. For the resected tissue and the EUS elastography of pancreatic focal lesions, all recordings were performed by the same observer, whereas the phantom inclusions were performed by two observers. Because the data on surgical specimens and pancreatic lesions in this study were collected from individual lesions and patients, whereas the phantom inclusions represent only four different cases, this also limits the variability in the phantom SR measurements. The same strain elastography system was used for all scans (Hitachi, Real-Time Elastography), but both scanners and software were upgraded between the scanning of surgical specimens, EUS, and the phantom scanning. The ECAM algorithm was applied throughout all scans, but since elastograms are based on B-mode data, improvements in B-mode images through scanner software upgrades may have influenced the results. The scanning of the phantom was completed with the latest version of the scanner software.
5. Conclusions
SR measurements are useful for quantifying local differences in tissue strain and the evaluation method is well documented for several applications. We showed that SR, as a semi-quantitative method of strain elastography, has increasing variability when used in a tissue mimicking phantom, in resected surgical specimens, and for focal pancreatic lesions examined by endoscopic ultrasound. When the probe does not represent the source of stress or when a stable reference tissue cannot be obtained, SR may be subject to large variability and should be interpreted with caution.
Supplementary Materials
The following are available online at https://www.mdpi.com/2076-3417/8/8/1273/s1, Table 3, Pooled median SR values for phantom inclusions, surgical specimens and pancreatic focal lesions by diagnose.
Author Contributions
R.F.H. and L.B.N. and O.H.G. planned the studies and provided the equipment. L.B.N. and O.H.G. supervised in the collection of data, analyses and writing of the manuscript. R.F.H. collected and analyzed the data and wrote the manuscript. J.E.R.W. was a consultant in performing the elastography study on surgical specimens and pancreatic lesions with Real-Time Elastography. He also prepared the manuscript. A.M. participated in data collection and presented preliminary data at DDW 2016 as well as preparation of the manuscript.
Funding
This research was funded by the Department of Medicine, Haukeland University Hospital and University of Bergen, Institute of Clinical Medicine 1. These institutions provided salary and necessary equipment to perform the experiments described.
Acknowledgments
The studies that are reported data from in this paper were all conceived at the Department of Medicine and the National Centre for Ultrasound in Gastroenterology (NCGU), Haukeland University Hospital. We thank emeritus Svein Ødegaard for his tutoring and guidance and specialist nurse Eva Fosse for her great support during data acquisition. The studies were supported by MedViz, an interdisciplinary research cluster from Haukeland University Hospital, University of Bergen, and Christian Michelsen Research AS. We also express our gratitude to the support and guidance we have received from the application specialists in Hitachi Medical Corporation, Europe. Hitachi Medical Corporation has not provided equipment for free nor has had any influence on the planning, execution or reporting in the studies reported.
Conflicts of Interest
The authors declare no conflict of interest. The founding sponsors had no role in the design of the study; in the collection, analyses, or interpretation of data; in the writing of the manuscript, and in the decision to publish the results.
References
- Aghajani, A.; Haghapanhi, M.; Nikazad, T. The Ultrasound Elastography Inverse Problem and the Effective Criteria. Proc. Inst. Mech. Eng. H 2013, 11, 1203–1212. [Google Scholar] [CrossRef] [PubMed]
- Ophir, J.; Alam, S.K.; Garra, B.S.; Kallel, F.; Konofagou, E.E.; Krouskop, T.; Merritt, C.R.; Righetti, R.; Souchon, R.; Srinivasan, S.; et al. Elastography: Imaging the Elastic Properties of Soft Tissues with Ultrasound. J. Med. Ultrason. 2002, 29, 155. [Google Scholar] [CrossRef] [PubMed]
- Ophir, J.; Cespedes, I.; Ponnekanti, H.; Yazdi, Y.; Li, X. Elastography: A Quantitative Method for Imaging the Elasticity of Biological Tissues. Ultrason. Imaging 1991, 13, 111–134. [Google Scholar] [CrossRef] [PubMed]
- Ueno, E.; Umemoto, T.; Bando, H.; Tohno, E.; Waki, K.; Matsumura, T. New Quantitative Method in Breast Elastography: Fat Lesion Ratio (FLR). In Proceedings of the Radiological Society of North America Scientific Assembly and Annual Meeting, Chicago, IL, USA, 25–30 November 2007. [Google Scholar]
- Umemoto, T.; Ueno, E.; Matsumura, T.; Yamakawa, M.; Bando, H.; Mitake, T.; Shiina, T. Ex Vivo and in Vivo Assessment of the Non-Linearity of Elasticity Properties of Breast Tissues for Quantitative Strain Elastography. Ultrasound Med. Biol. 2014, 40, 1755–1768. [Google Scholar] [CrossRef] [PubMed]
- Le Sant, G.; Ates, F.; Brasseur, J.L.; Nordez, A. Elastography Study of Hamstring Behaviors During Passive Stretching. PLoS ONE 2015, 10. [Google Scholar] [CrossRef] [PubMed]
- Carlsen, J.F.; Ewertsen, C.; Sletting, S.; Talman, M.L.; Vejborg, I.; Bachmann Nielsen, M. Strain Histograms are Equal to Strain Ratios in Predicting Malignancy in Breast Tumours. PLoS ONE 2017, 12. [Google Scholar] [CrossRef] [PubMed]
- Cheng, R.; Li, J.; Ji, L.; Liu, H.; Zhu, L. Comparison of the Diagnostic Efficacy between Ultrasound Elastography and Magnetic Resonance Imaging for Breast Masses. Exp. Ther. Med. 2018, 15, 2519–2524. [Google Scholar] [CrossRef] [PubMed]
- Xu, Y.; Bai, X.; Chen, Y.; Jiang, L.; Hu, B.; Hu, B.; Yu, L. Application of Real-Time Elastography Ultrasound in the Diagnosis of Axillary Lymph Node Metastasis in Breast Cancer Patients. Sci. Rep. 2018, 8, 10234. [Google Scholar] [CrossRef] [PubMed]
- Razavi, S.A.; Hadduck, T.A.; Sadigh, G.; Dwamena, B.A. Comparative Effectiveness of Elastographic and B-Mode Ultrasound Criteria for Diagnostic Discrimination of Thyroid Nodules: A meta-analysis. Am. J. Roentgenol. 2013, 200, 1317–1326. [Google Scholar] [CrossRef] [PubMed]
- Sun, J.; Cai, J.; Wang, X. Real-Time Ultrasound Elastography for Differentiation of Benign and Malignant Thyroid Nodules: A meta-analysis. J. Ultrasound Med. 2014, 33, 495–502. [Google Scholar] [CrossRef] [PubMed]
- Waage, J.E.; Bach, S.P.; Pfeffer, F.; Leh, S.; Havre, R.F.; Odegaard, S.; Baatrup, G. Combined Endorectal Ultrasonography and Strain Elastography for the Staging of Early Rectal Cancer. Colorectal Dis. 2015, 17, 50–56. [Google Scholar] [CrossRef] [PubMed] [Green Version]
- Zhang, Y.; Tang, J.; Li, Y.M.; Fei, X.; Lv, F.Q.; He, E.H.; Li, Q.Y.; Shi, H.Y. Differentiation of Prostate Cancer from Benign Lesions Using Strain Index of Transrectal Real-Time Tissue Elastography. Eur. J. Radiol. 2012, 81, 857–862. [Google Scholar] [CrossRef] [PubMed]
- Havre, R.; Waage, J.E.; Leh, S.; Gilja, O.H.; Ødegaard, S.; Baatrup, G.; Nesje, L.B. Strain Assessment in Surgically Resected Inflammatory and Neoplastic Bowel Lesions. Ultraschall Med. 2014, 35, 149–158. [Google Scholar] [CrossRef] [PubMed]
- Havre, R.F.; Odegaard, S.; Gilja, O.H.; Nesje, L.B. Characterization of Solid Focal Pancreatic Lesions Using Endoscopic Ultrasonography with Real-Time Elastography. Scand. J. Gastroenterol. 2014, 49, 742–751. [Google Scholar] [CrossRef] [PubMed]
- Krouskop, T.A.; Wheeler, T.M.; Kallel, F.; Garra, B.S.; Hall, T. Elastic Moduli of Breast and Prostate Tissues under Compression. Ultrason. Imaging 1998, 20, 260–274. [Google Scholar] [CrossRef] [PubMed]
- Lu, Y.; Chen, L.; Li, C.; Chen, H.; Chen, J. Diagnostic Utility of Endoscopic Ultrasonography-Elastography in the Evaluation of Solid Pancreatic Masses: A meta-analysis and systematic review. Med. Ultrason. 2017, 19, 150–158. [Google Scholar] [CrossRef] [PubMed]
- Waage, J.E.; Leh, S.; Rosler, C.; Pfeffer, F.; Bach, S.P.; Havre, R.F.; Haldorsen, I.S.; Odegaard, S.; Baatrup, G. Endorectal Ultrasonography, Strain Elastography and MRI Differentiation of Rectal Adenomas and Adenocarcinomas. Colorectal Dis. 2015, 17, 124–131. [Google Scholar] [CrossRef] [PubMed] [Green Version]
- Opacic, D.; Rustemovic, N.; Kalauz, M.; Markos, P.; Ostojic, Z.; Majerovic, M.; Ledinsky, I.; Visnjic, A.; Krznaric, J.; Opacic, M. Endoscopic Ultrasound Elastography Strain Histograms in the Evaluation of Patients with Pancreatic Masses. World J. Gastroenterol. 2015, 21, 4014–4019. [Google Scholar] [CrossRef] [PubMed]
- Itoh, A.; Ueno, E.; Tohno, E.; Kamma, H.; Takahashi, H.; Shiina, T.; Yamakawa, M.; Matsumura, T. Breast Disease: Clinical Application of US Elastography for Diagnosis. Radiology 2006, 239, 341–350. [Google Scholar] [CrossRef] [PubMed]
- Gong, X.; Xu, Q.; Xu, Z.; Xiong, P.; Yan, W.; Chen, Y. Real-Time Elastography for the Differentiation of Benign and Malignant Breast Lesions: A meta-analysis. Breast Cancer Res. Treat. 2011, 130, 11–18. [Google Scholar] [CrossRef] [PubMed]
- Sadigh, G.; Carlos, R.C.; Neal, C.H.; Dwamena, B.A. Accuracy of Quantitative Ultrasound Elastography for Differentiation of Malignant and Benign Breast Abnormalities: A meta-analysis. Breast Cancer Res. Treat. 2012, 134, 923–931. [Google Scholar] [CrossRef] [PubMed]
- Waage, J.E.; Rafaelsen, S.R.; Borley, N.R.; Havre, R.F.; Gubberud, E.T.; Leh, S.; Kolbro, T.; Hagen, K.K.; Eide, G.E.; Pfeffer, F. Strain Elastography Evaluation of Rectal Tumors: Inter- and intraobserver reproducibility. Ultraschall Med. 2015, 36, 611–617. [Google Scholar] [CrossRef] [PubMed]
- Saftoiu, A.; Vilmann, P.; Gorunescu, F.; Janssen, J.; Hocke, M.; Larsen, M.; Iglesias-Garcia, J.; Arcidiacono, P.; Will, U.; Giovannini, M.; et al. Efficacy of an Artificial Neural Network-Based Approach to Endoscopic Ultrasound Elastography in Diagnosis of Focal Pancreatic Masses. Clin. Gastroenterol. Hepatol. 2012, 10, 84–90. [Google Scholar] [CrossRef] [PubMed]
Figure 1.
The Zerdine phantom used for scanning with a visualization of the inclusions inside. Red lesions: 8 kPa, yellow: 14 kPa, green: 45 kPa, and blue: 80 kPa in a background of 25 kPa.
Figure 1.
The Zerdine phantom used for scanning with a visualization of the inclusions inside. Red lesions: 8 kPa, yellow: 14 kPa, green: 45 kPa, and blue: 80 kPa in a background of 25 kPa.
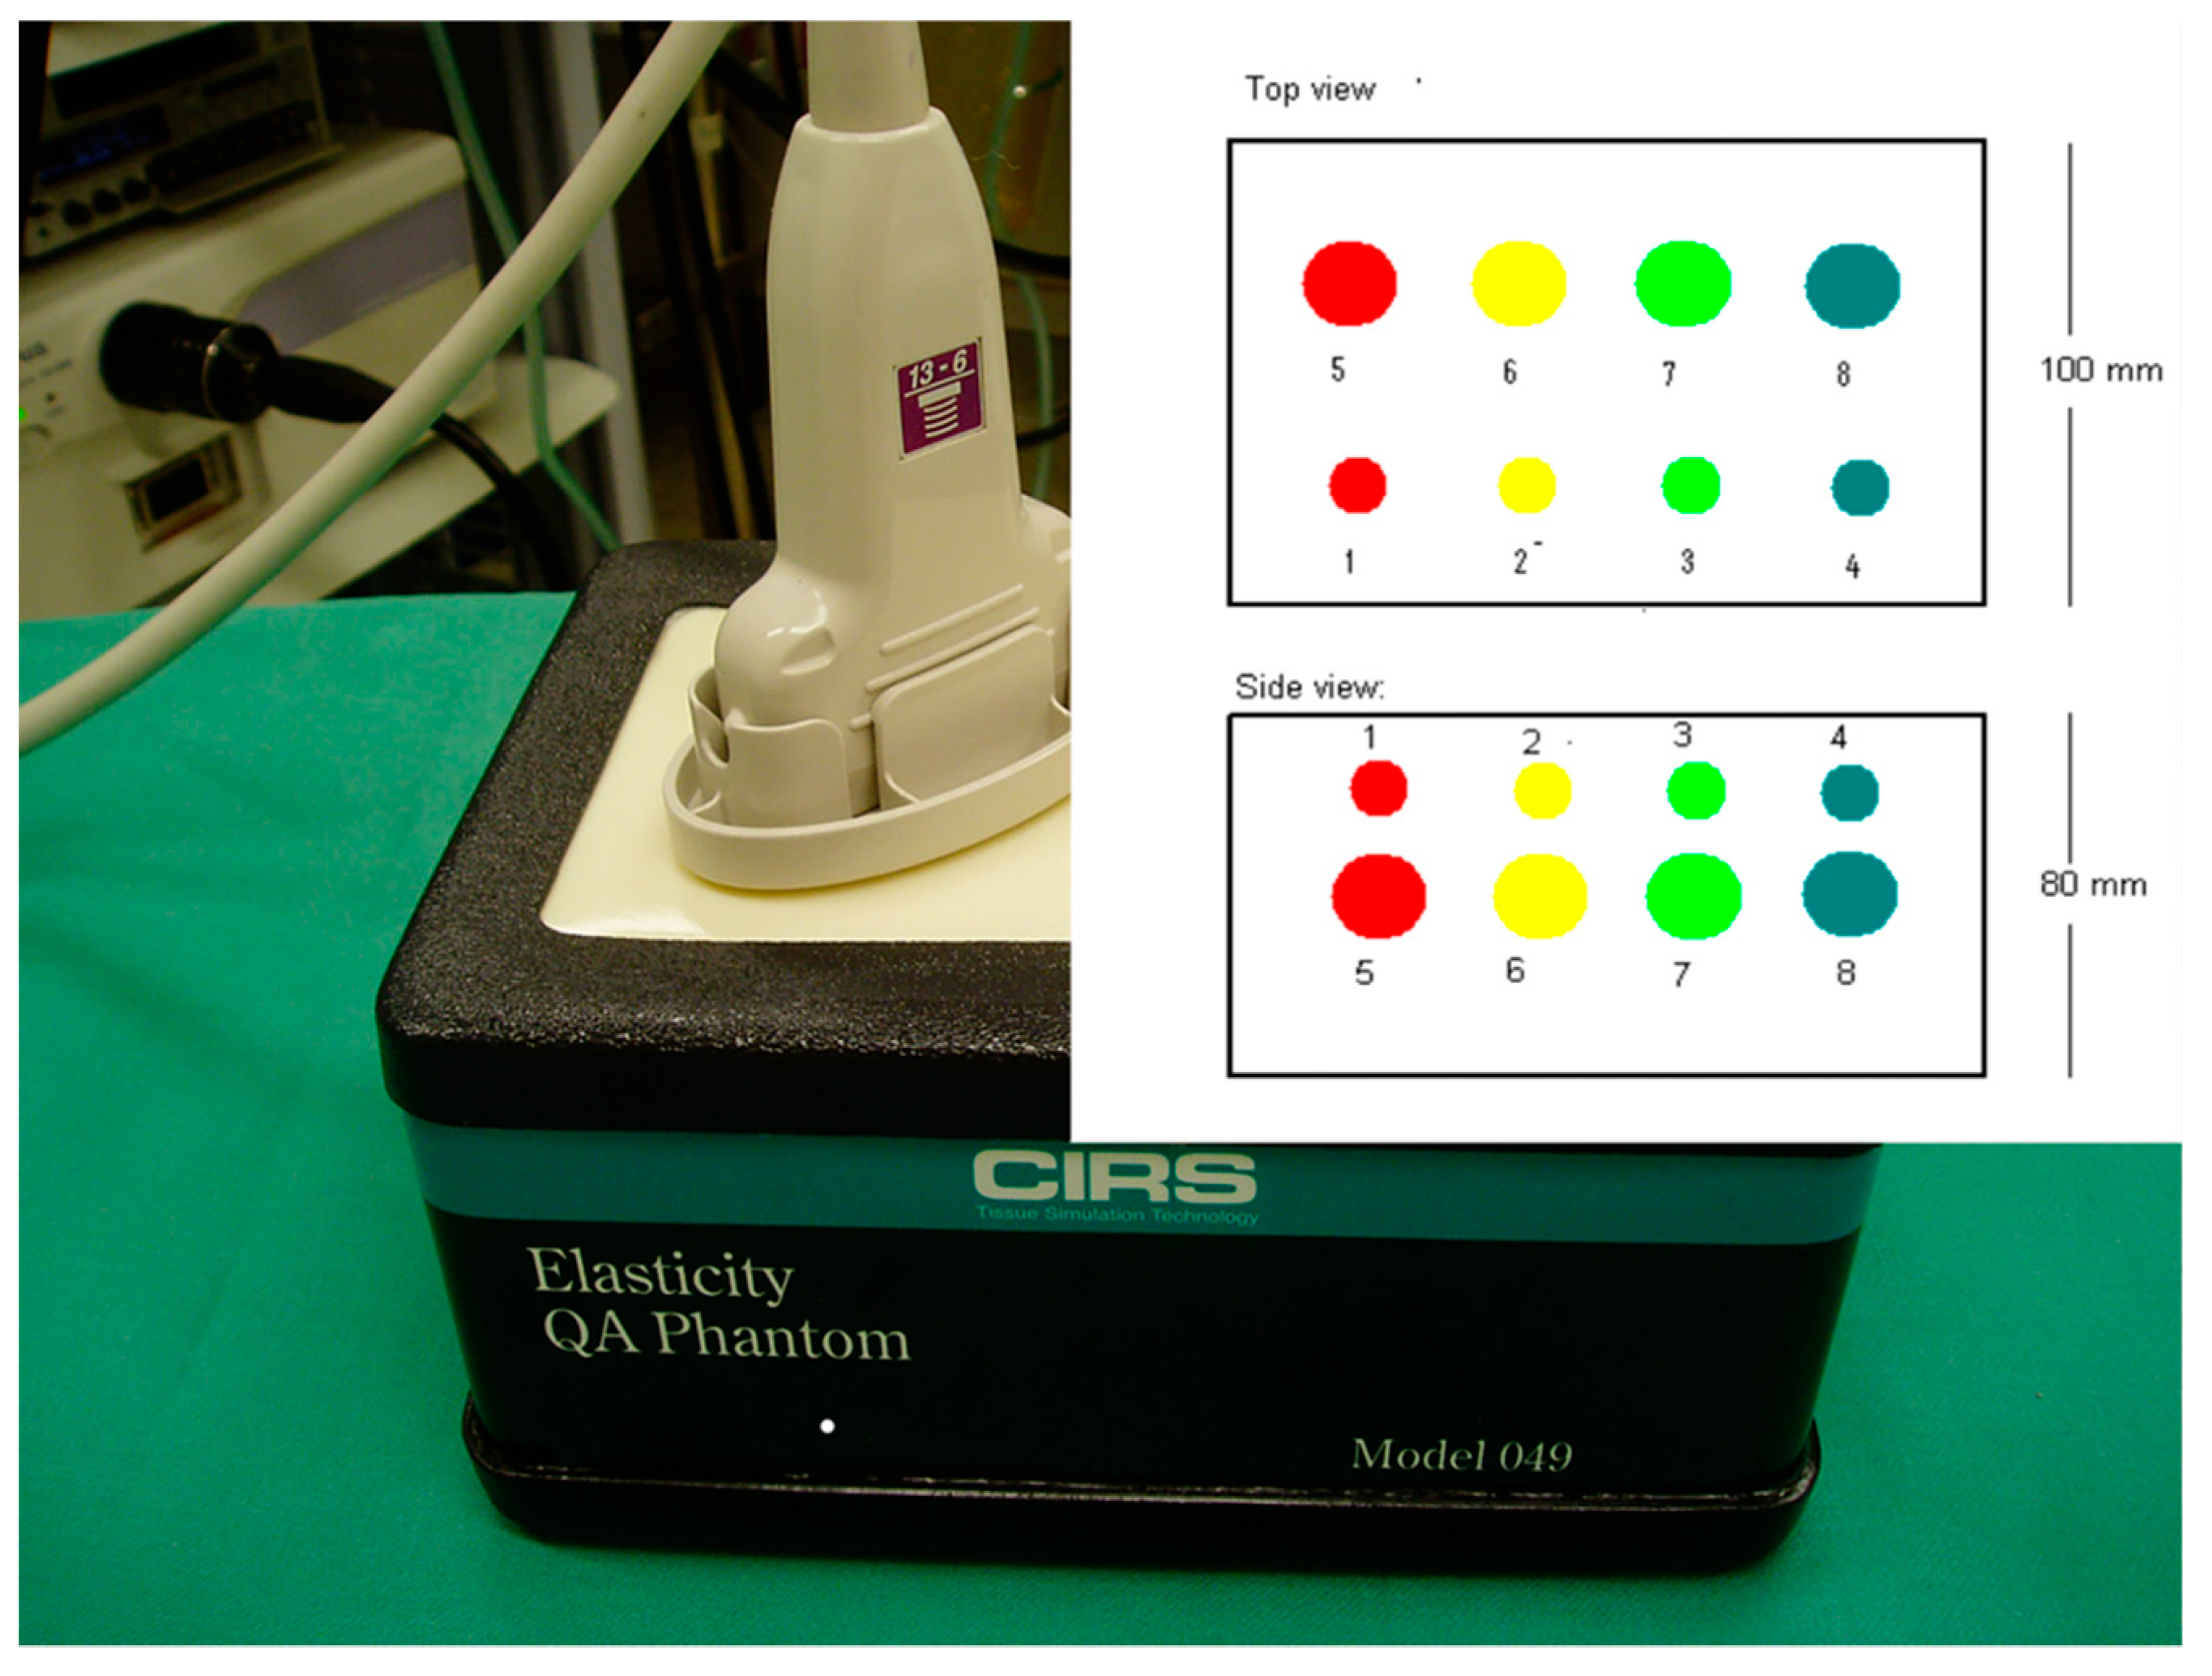
Figure 2.
Elastogram from a tissue-mimicking phantom displaying a spherical inclusion (80 kPa) with a diameter of two cm in a background of 25 kPa. Right side: B-mode image with area markings. A (lesion) and B (reference). Left side: elastogram in color coding. The stress source was working from above in the axial direction. The lesion is speckled and green-blue, whereas the background material is mostly homogeneously green. Between the lesion and the probe, the red color indicates strain concentration between the stress source and the harder lesion. The strain ratio (SR) is mean strain in B/mean strain in A = 1.80.

Figure 3.
Elastogram of a newly resected bowel lesion from the colon containing a malignant tumor (adenocarcinoma). The hypoechoic tumor mass (right) is imaged with a blue-green color indicating harder tissue (left). The SR measured between pericolic fat and connective tissue, as well as part of the proper muscle and the tumor tissue, was 1.56. The lesion and reference are positioned at similar depth and distance from the stress source and the bottom.

Figure 4.
Box plots of the interquartile range (IQR)/median SR for the different applications of strain based elastography (Real-Time Elastography) reported here. There is significant difference between this quality parameter for the three applications (p = 0.002). In liver elastography using Transient Elastography, the suggested maximum IQR/Median Shear-Wave speed for good quality assessment in 10 repeated measurements in the same liver is 0.30, which is marked with the dotted horizontal line.
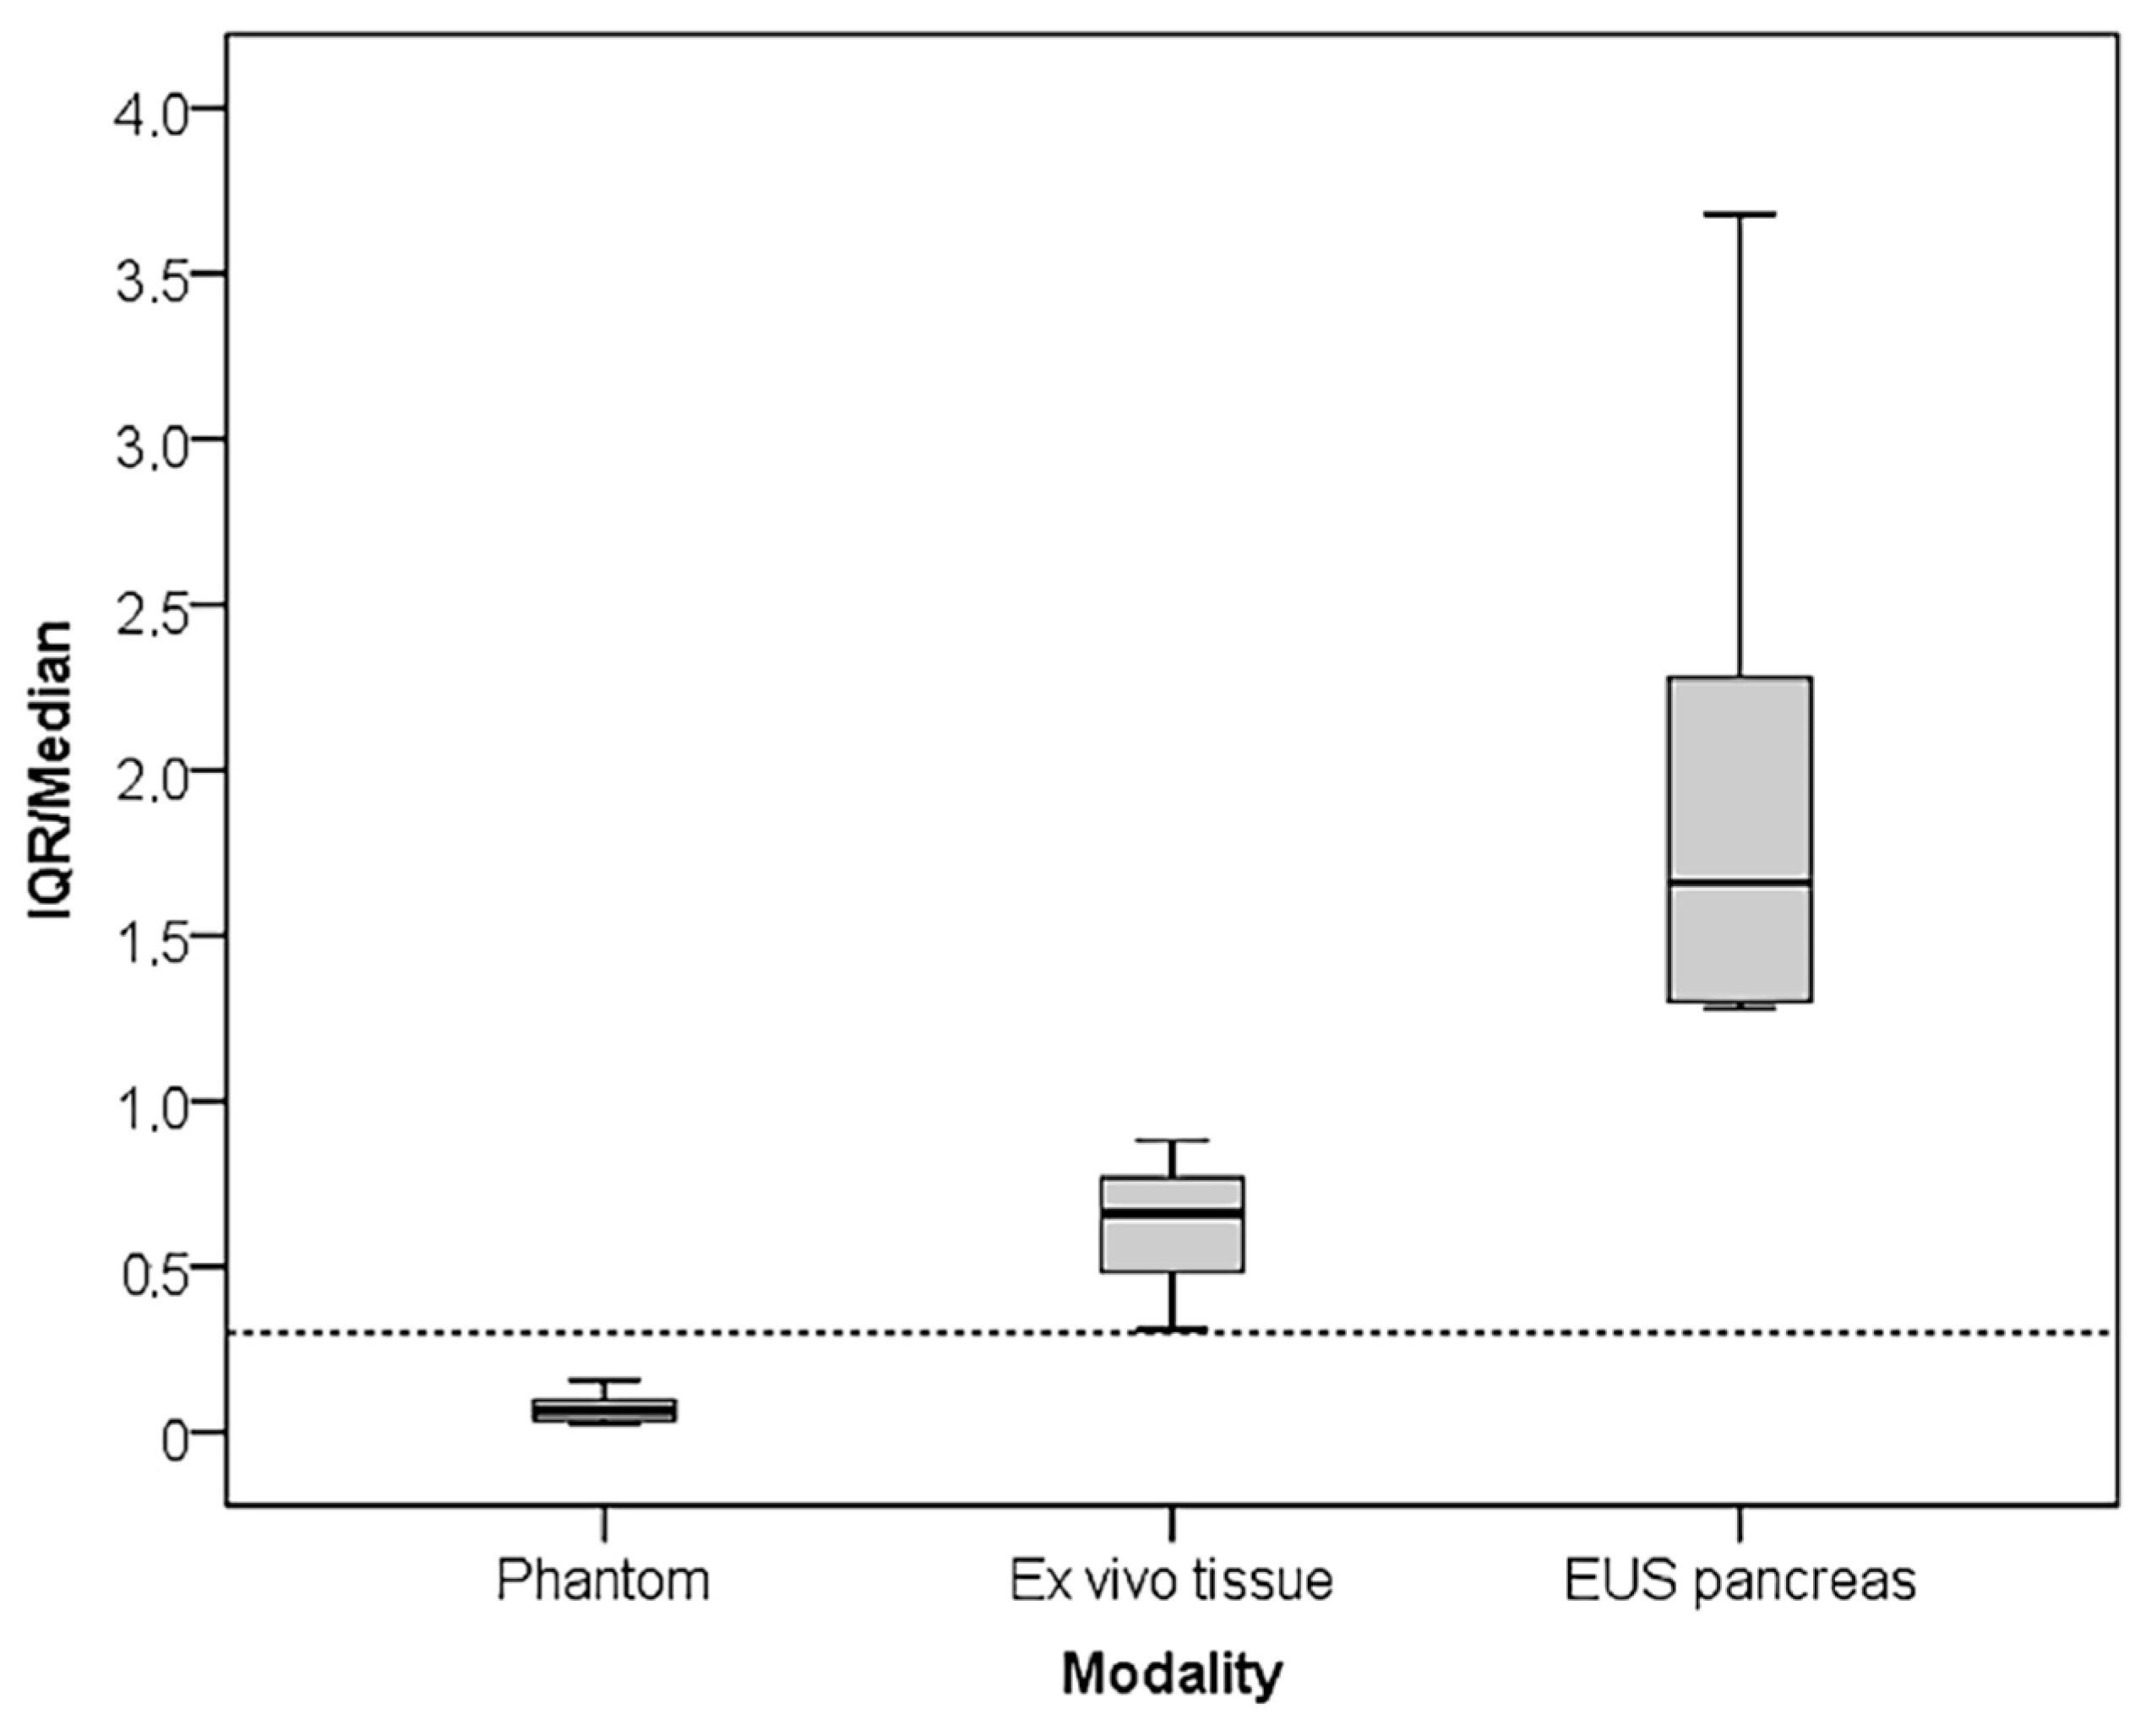
Figure 5.
Three images of the same pancreatic tumor visualized by endoscopic ultrasound (EUS) elastography. Tumor tissue is blue in the elastograms with a predominantly green reference tissue. The position and size of the reference tissue vary slightly between the three different images, and exhibit different strains in all three images: (a) 0.16%; (b) 0.08%; and (c) 0.27%, whereas the strain in the lesion remained at 0.01%. This causes the SR values to vary from 8.43 to 26.7.

Table 1.
Elastography strain ratio (SR) in four inclusions in a tissue-mimicking phantom.
| Lesion Background 25 kPa | 1 8 kPa | 2 14 kPa | 3 45 kPa | 4 80 kPa | ||||
|---|---|---|---|---|---|---|---|---|
| Observer | A | B | A | B | A | B | A | B |
| Median SR | 0.52 | 0.68 | 0.96 | 0.82 | 1.91 | 1.35 | 2.50 | 2.82 |
| Range | 0.09 | 0.08 | 1.04 | 0.10 | 0.18 | 0.11 | 0.91 | 0.24 |
| IQR 1 25–75 | 0.06 | 0.03 | 0.15 | 0.06 | 0.12 | 0.04 | 0.17 | 0.07 |
| IQR/Median | 0.118 | 0.044 | 0.156 | 0.073 | 0.063 | 0.030 | 0.068 | 0.025 |
1 IQR: Inter Quartile Range. Mean IQR/median for phantom lesions: 0.07.
Table 2.
Elastography strain ratio (SR) in resected surgical bowel specimens.
| Entity | Adenoma | Crohn | Adenocarcinoma |
|---|---|---|---|
| Number | 4 | 16 | 18 |
| Median SR | 1.25 | 2.09 | 2.18 |
| Range | 1.38 | 21.44 | 4.53 |
| IQR 1 (25–75) | 1.10 | 0.64 | 1.44 |
| IQR/Median | 0.88 | 0.31 | 0.66 |
1 IQR: Inter Quartile Range. Mean IQR/Median SR for ex vivo tissue: 0.62. Previously published in [14].
Table 3.
Elastography strain ratio of focal pancreatic lesions by Endoscopic Ultrasound (EUS).
| Entity | Neuroendocrine Tumors (NETs) Undetermined or Benign | NET Malignant | Adenocarcinoma | Focal Pancreatitis | Other Benign Lesion |
|---|---|---|---|---|---|
| Number | 11 | 7 | 11 | 8 | 11 |
| Median SR | 2.19 | 5.74 | 8.36 | 0.91 | 3.34 |
| Range | 7.93 | 17.5 | 24.5 | 8.33 | 35.3 |
| IQR 1 (25–75) | 2.80 | 13.1 | 10.9 | 3.55 | 5.53 |
| IQR/Median | 1.28 | 2.28 | 1.30 | 3.68 | 1.66 |
1 IQR: Inter Quartile Range. Mean IQR/Median SR for pancreatic lesions: 2.04. SR data with median values and IQR previously published as box-plots [15].
© 2018 by the authors. Licensee MDPI, Basel, Switzerland. This article is an open access article distributed under the terms and conditions of the Creative Commons Attribution (CC BY) license (http://creativecommons.org/licenses/by/4.0/).
Share and Cite
MDPI and ACS Style
Havre, R.F.; Waage, J.E.R.; Mulabecirovic, A.; Gilja, O.H.; Nesje, L.B. Strain Ratio as a Quantification Tool in Strain Imaging. Appl. Sci. 2018, 8, 1273. https://doi.org/10.3390/app8081273
AMA Style
Havre RF, Waage JER, Mulabecirovic A, Gilja OH, Nesje LB. Strain Ratio as a Quantification Tool in Strain Imaging. Applied Sciences. 2018; 8(8):1273. https://doi.org/10.3390/app8081273
Chicago/Turabian StyleHavre, Roald Flesland, Jo Erling Riise Waage, Anesa Mulabecirovic, Odd Helge Gilja, and Lars Birger Nesje. 2018. "Strain Ratio as a Quantification Tool in Strain Imaging" Applied Sciences 8, no. 8: 1273. https://doi.org/10.3390/app8081273
Note that from the first issue of 2016, this journal uses article numbers instead of page numbers. See further details here.