Article

Full Characterization of a Molecular Cooper Minimum Using High-Harmonic Spectroscopy

1
Department of Physics, The Ohio State University, Columbus, OH 43210, USA
2
Department of Physics and Astronomy, Louisiana State University, Baton Rouge, LA 70803, USA
3
Department of Physics, University of Virginia, Charlottesville, VA 22904, USA
*
Author to whom correspondence should be addressed.
Appl. Sci. 2018, 8(7), 1129; https://doi.org/10.3390/app8071129
Submission received: 14 June 2018 / Revised: 6 July 2018 / Accepted: 9 July 2018 / Published: 12 July 2018
(This article belongs to the Special Issue Attosecond Science and Technology: Principles and Applications)

Abstract

:
High-harmonic generation was used to probe the spectral intensity and phase of the recombination-dipole matrix element of methyl chloride (CH3Cl), revealing a Cooper minimum (CM) analogous to the 3p CM previously reported in argon. The CM structure altered the spectral response and group delay (GD) of the emitted harmonics, and was revealed only through careful removal of all additional contributors to the GD. In characterizing the GD dispersion, also known as the “attochirp”, we additionally present the most complete validation to date of the commonly used strong-field approximation for calculating the GD, demonstrating the correct intensity scaling and extending its usefulness to simple molecules.

1. Introduction

Much of the focus of attosecond science involves the development and calibration of precise measurement techniques in atoms [1]. In recent years, many of these techniques were extended to small molecular systems in high-harmonic generation (HHG) [2] and high-harmonic spectroscopy (HHS) [3,4]. As the field moves toward the investigation of dynamics in more complex targets, it becomes important to determine the applicability of techniques developed for atoms to the molecular case, and when found lacking, to update these methods to properly resolve dynamics. One example of such dynamics which garnered considerable attention in recent years is molecular charge migration [5], in which, following ionization, the electrons in a molecular ion undergo a coherent spatial oscillation, driven entirely by electron correlations. Wörner et al. identified high-harmonic spectroscopy as a promising tool for studying charge migration, with initial experiments in iodoacetylene [6]. There is not, however, a widely accepted paradigm for how dynamical processes, such as charge migration, manifest in attosecond measurement techniques such as HHS. One reasonable approach is to look for changes to known, calibrated structural features in high-harmonic spectra to infer additional information about dynamics.
One such structure, well-known through photoionization, is the Cooper minimum [7] (CM). A CM is a local minimum in the photoionization cross-section at a specific photon energy, caused by a sign change in the bound-free transition dipole of a particular angular momentum channel. CMs were observed through photoionization in a variety of atoms [8] and small molecules [9,10,11] for many years. However, access to the phase behavior associated with the CM was only recently achieved [12] using HHS. In HHS, the recombination-dipole matrix element (RDME) probes the inverse process to single-photon ionization, and additionally preserves the phase of the transition dipole in the spectral phase of the emitted extreme ultraviolet (XUV) radiation. A CM manifests itself in an HHS measurement as both a minimum in the XUV spectral intensity, representing destructive interference between transition-dipole contributions from several angular momentum channels [13], and as a shift in the spectral phase versus energy near the local minimum [12]. Cooper minima in molecular HHG were previously detected in the spectral intensity [14], but not in the spectral phase. Because not all such features can be unambiguously assigned using spectral intensity alone, analysis of the spectral phase can be useful to probe such interactions. Here, we present the first molecular CM phase measurement, derived from measurements of the XUV group delay (GD), for the case of the highest occupied molecular orbital of methyl chloride (CH3Cl), which is analogous to the 3p orbital of argon. As we show, the CH3Cl CM was only clearly revealed through the combined analysis of XUV spectral intensity and phase.
High harmonics generated by an intense laser–atom interaction are known to encode the frequency-dependent sub-cycle emission time in the GD of XUV light, in addition to the spectral-phase contribution from the RDME. In order to carefully remove the emission-time contribution from our measured XUV GD, we calculated the former using a strong-field approximation (SFA) [15], and subtracted the resulting SFA GD from the measured one. This approach was experimentally verified in the context of atomic HHG [16,17,18,19,20], but not for the present case of molecular HHG, and particularly not in the presence of a molecular CM. We studied its applicability to reveal target-specific information about the energy-dependent RDME in methyl chloride through a careful two-step calibration of the interaction intensity. We firstly characterized the intensity scaling of the SFA model in xenon, which is structureless in the relevant energetic region, by fitting the measured GD to the SFA prediction. We then extended the intensity calibration to HHG in methane (CH4), which is also structureless, and which has an ionization potential (IP) very similar to that of methyl chloride ( I P X e = 12.13   eV ,   I P C H 4 = 12.61   eV ,   I P C H 3 C l = 11.26   eV [21]). Finally, by comparing the HHG GD in methane and methyl chloride, we could isolate the contribution of the chlorine substitution to the RDME. This provides a robust method for isolating and diagnosing the signature of a CM without the need for complicated species-dependent calculations.

2. Materials and Methods

2.1. Experimental Details

All measurements presented here were obtained by frequency converting chirped-pulse-amplified Ti:sapphire pulses at a 1-kHz repetition rate into mid-infrared (MIR) pulses, using a commercial optical parametric amplifier (OPA; HE-TOPAS Prime, Light Conversion, Vilnius, Lithuania). The pulses were ~65 fs in duration at a central wavelength of 1650 nm. Our motivation for working with MIR wavelengths was twofold. Firstly, with HHG spectra composed of odd harmonic orders of the driving field, the spacing in the XUV frequency comb scales as the inverse of the laser wavelength, and thus, MIR sources allow for a finer energetic sampling. Secondly, because the HHG cut-off energy scales proportionally with the ponderomotive energy (i.e., quadratically with the wavelength), the MIR driving field provides a wider range of experimentally accessible energies relative to Ti:sapphire wavelengths. For intensity scans, a waveplate/polarizer pair was inserted into the beam for flexible control over the pulse energy.
GD measurements were performed using the reconstruction of attosecond beating via interference of two-photon transitions (RABBITT) method [22,23]. The RABBITT apparatus is based on a Mach–Zehnder interferometer, in which a majority of the MIR driving beam is delivered to a pulsed gas valve (Even-Lavie, 200-μm nozzle diameter) in a 400-mm reflective focal geometry to create HHG, and a small amount of the MIR is retained in the other arm of the interferometer. The molecular density in the gas pulse was estimated to be ~1018 cm−3. In all cases, the molecules were probed in unaligned conditions, so any effects due to the permanent dipole [24] of methyl chloride were neglected due to angle averaging. The XUV light was propagated through a 200-nm aluminum filter to remove the remaining MIR, before being refocused into a home-built magnetic-bottle electron spectrometer (MBES). The MIR arm was recombined and focused, along with the XUV, in a gas jet in the MBES with variable delay, and the RABBITT interaction retrieved information about the XUV spectral phase from oscillations in the population of photoelectron sidebands at the energies of even harmonics. Neon was chosen as the detection gas due to its relatively uniform photoionization cross-section, and its GD contribution across the energetic range of interest (~30–70 eV) [25].

2.2. High-Harmonic Spectral Analysis

In this section, we outline how to use RABBITT as a spectroscopic probe of the XUV generation gas. At its core, RABBITT is a measurement of the discrete difference in the spectral phase of the photoelectron wavepacket ionized by the XUV comb in the detection gas. The discrete phase difference between the (q − 1)th and (q + 1)th harmonics appeared as a phase offset in the intensity oscillation of the qth sideband at twice the driving frequency ω 0 .
S q ( τ X U V M I R ) = α + β cos ( 2 ω 0 Δ τ X U V M I R + Δ φ q X U V + Δ φ q a t ) ,
where Δ τ X U V M I R is the time delay between the XUV and MIR fields, Δ φ q X U V = φ q + 1 φ q 1 is the offset containing the relative phase information between neighboring odd harmonics, Δ φ q a t is the atomic phase contribution of the detection gas, and α and β are fit constants. The phase of this sideband oscillation was converted to the measured GD using a discrete derivative approximation,
τ q = d φ ( ω ) d ω | ω = q ω 0 Δ φ ( q ω 0 ) Δ ( q ω 0 ) = ( Δ φ q X U V + Δ φ q a t ) 2 ω 0 = τ q X U V + τ q a t ,
due to the 2 ω 0 spacing inherent to the odd-harmonic comb. The delay contribution from the high-harmonic process alone was then obtained by subtracting the known contributions from the filter, τ f i l t , [26] and the detection gas, τ q a t = Δ φ q a t / 2 ω 0 [25,27]:
τ H H G = τ q τ f i l t τ q a t .
The resulting phases of all sidebands were then concatenated to retrieve the GD of the full harmonic spectrum relative to an offset.
In our measurements, we observed that the GDs of molecular targets had a trend similar to that of their atomic counterparts, over which smaller target-specific features were superimposed. This is consistent with quantitative rescattering (QRS) theory [28] and similar factorizations [29], which showed that the complex HHG spectrum signal (i.e., including intensities and phases) can be decomposed into the product of a normalized HHG spectrum, H H G r e f , from a reference (atomic) system, an ionization rate, Γ , for both the target and reference, and the target’s photoelectron scattering cross-section, σ t a r g e t , directly in the spectral domain:
H H G t a r g e t ( q ω ) = H H G r e f ( q ω ) × Γ t a r g e t Γ ref × σ t a r g e t ( q ω ) .
Normalizing the spectra removed the contributions of Γ t a r g e t and Γ r e f , such that the ratio of the HHG spectral envelopes revealed σ t a r g e t . In Section 3, it was confirmed experimentally that the reference was well approximated by the corresponding semiclassical SFA [28] (e.g., as defined in the Lewenstein model [15]). Since the GD is defined as the energy derivative of the harmonic phases, from the equation above, we deduced that,
τ H H G = τ r e f + τ t a r g e t τ S F A + τ t a r g e t ,
where τ t a r g e t is, therefore, the target-specific GD information we wanted to extract.
Similar to the filter and detection-gas contributions, knowledge of the generic τ S F A —the derivative of which is also known as the “attochirp” [20]—would allow one to access the target-specific information. Following the treatment of Lewenstein [15], the attochirp was parameterized using the target IP, laser frequency ( ω ), and laser intensity ( I 0 ). While the first two parameters were known with very good precision, the intensity in HHG focus, as estimated by standard techniques, was too imprecise to be useful in removing the attochirp. Instead, we developed a high-precision algorithm to determine I 0 , and then proceeded with the attochirp removal. In the semiclassical SFA model, the HHG phase is defined as the classical action in atomic units [15]:
S S F A [ p , t i , t r ] ( q ω 0 ) = t i t r ( [ p + A ( t ) ] 2 2 + I P ) d t + q ω 0 t r ,
where A is the laser potential vector, p is the electron canonical momentum, and t i and t r are the ionization and recombination times, respectively. Taken together with the stationary phase condition,
p , t i , t r S S F A = 0 ,
Equation (7) could be solved numerically in the complex plane.
We combined the GD definition and the stationary phase condition:
τ S F A ( q ω 0 ) = d S S F A d ( q ω o ) = p , t 0 , t r S S F A ( p , t 0 , t r ) ( q ω 0 ) + S S F A ( q ω 0 ) = t r
and recovered that, in the absence of additional GDs, τ S F A corresponded to the time of recollision for the returning electron [18,20], although this interpretation was clouded in the case where additional features beyond the SFA were present in the GD [12]. In the experiments reported here, with a 1650-nm driving wavelength, t r spanned several femtoseconds. When τ S F A dominated over τ t a r g e t , τ S F A could be treated as the sole contributor, and could be used to fit to the precise value of the laser intensity. For instance, using a least-squares minimization, the reconstructed experimental laser intensity is given by
I 0 = argmin I 0 , t o f f s e t q ( τ H H G ( q ω 0 ) t r ( q ω 0 ) + t o f f s e t ) 2 E B ( q ω 0 ) 2 ,
where E B ( q ω ) is the measurement error bar for harmonic q , and is used to weight the degree of confidence in each data point. The error bars come from multiple fits taken across the full width of the harmonic sideband (from 50% to 50%), and are weighted by the corresponding intensity to each fit. Here, t o f f s e t was introduced to account for the fact that the RABBITT GD was measured up to an unknown constant [22]; only I 0 was considered physically meaningful from the fit.
Obviously, the smaller τ t a r g e t is compared to τ S F A , the more precise the intensity reconstruction of Equation (9) will be. In cases where the τ t a r g e t cannot be neglected compared to τ S F A , an alternative reference gas can be used for calibrating the intensity, as discussed above. In Section 3.2, we describe the successful use of this strategy in analyzing the Cooper minimum in methyl chloride.

3. Results and Discussion

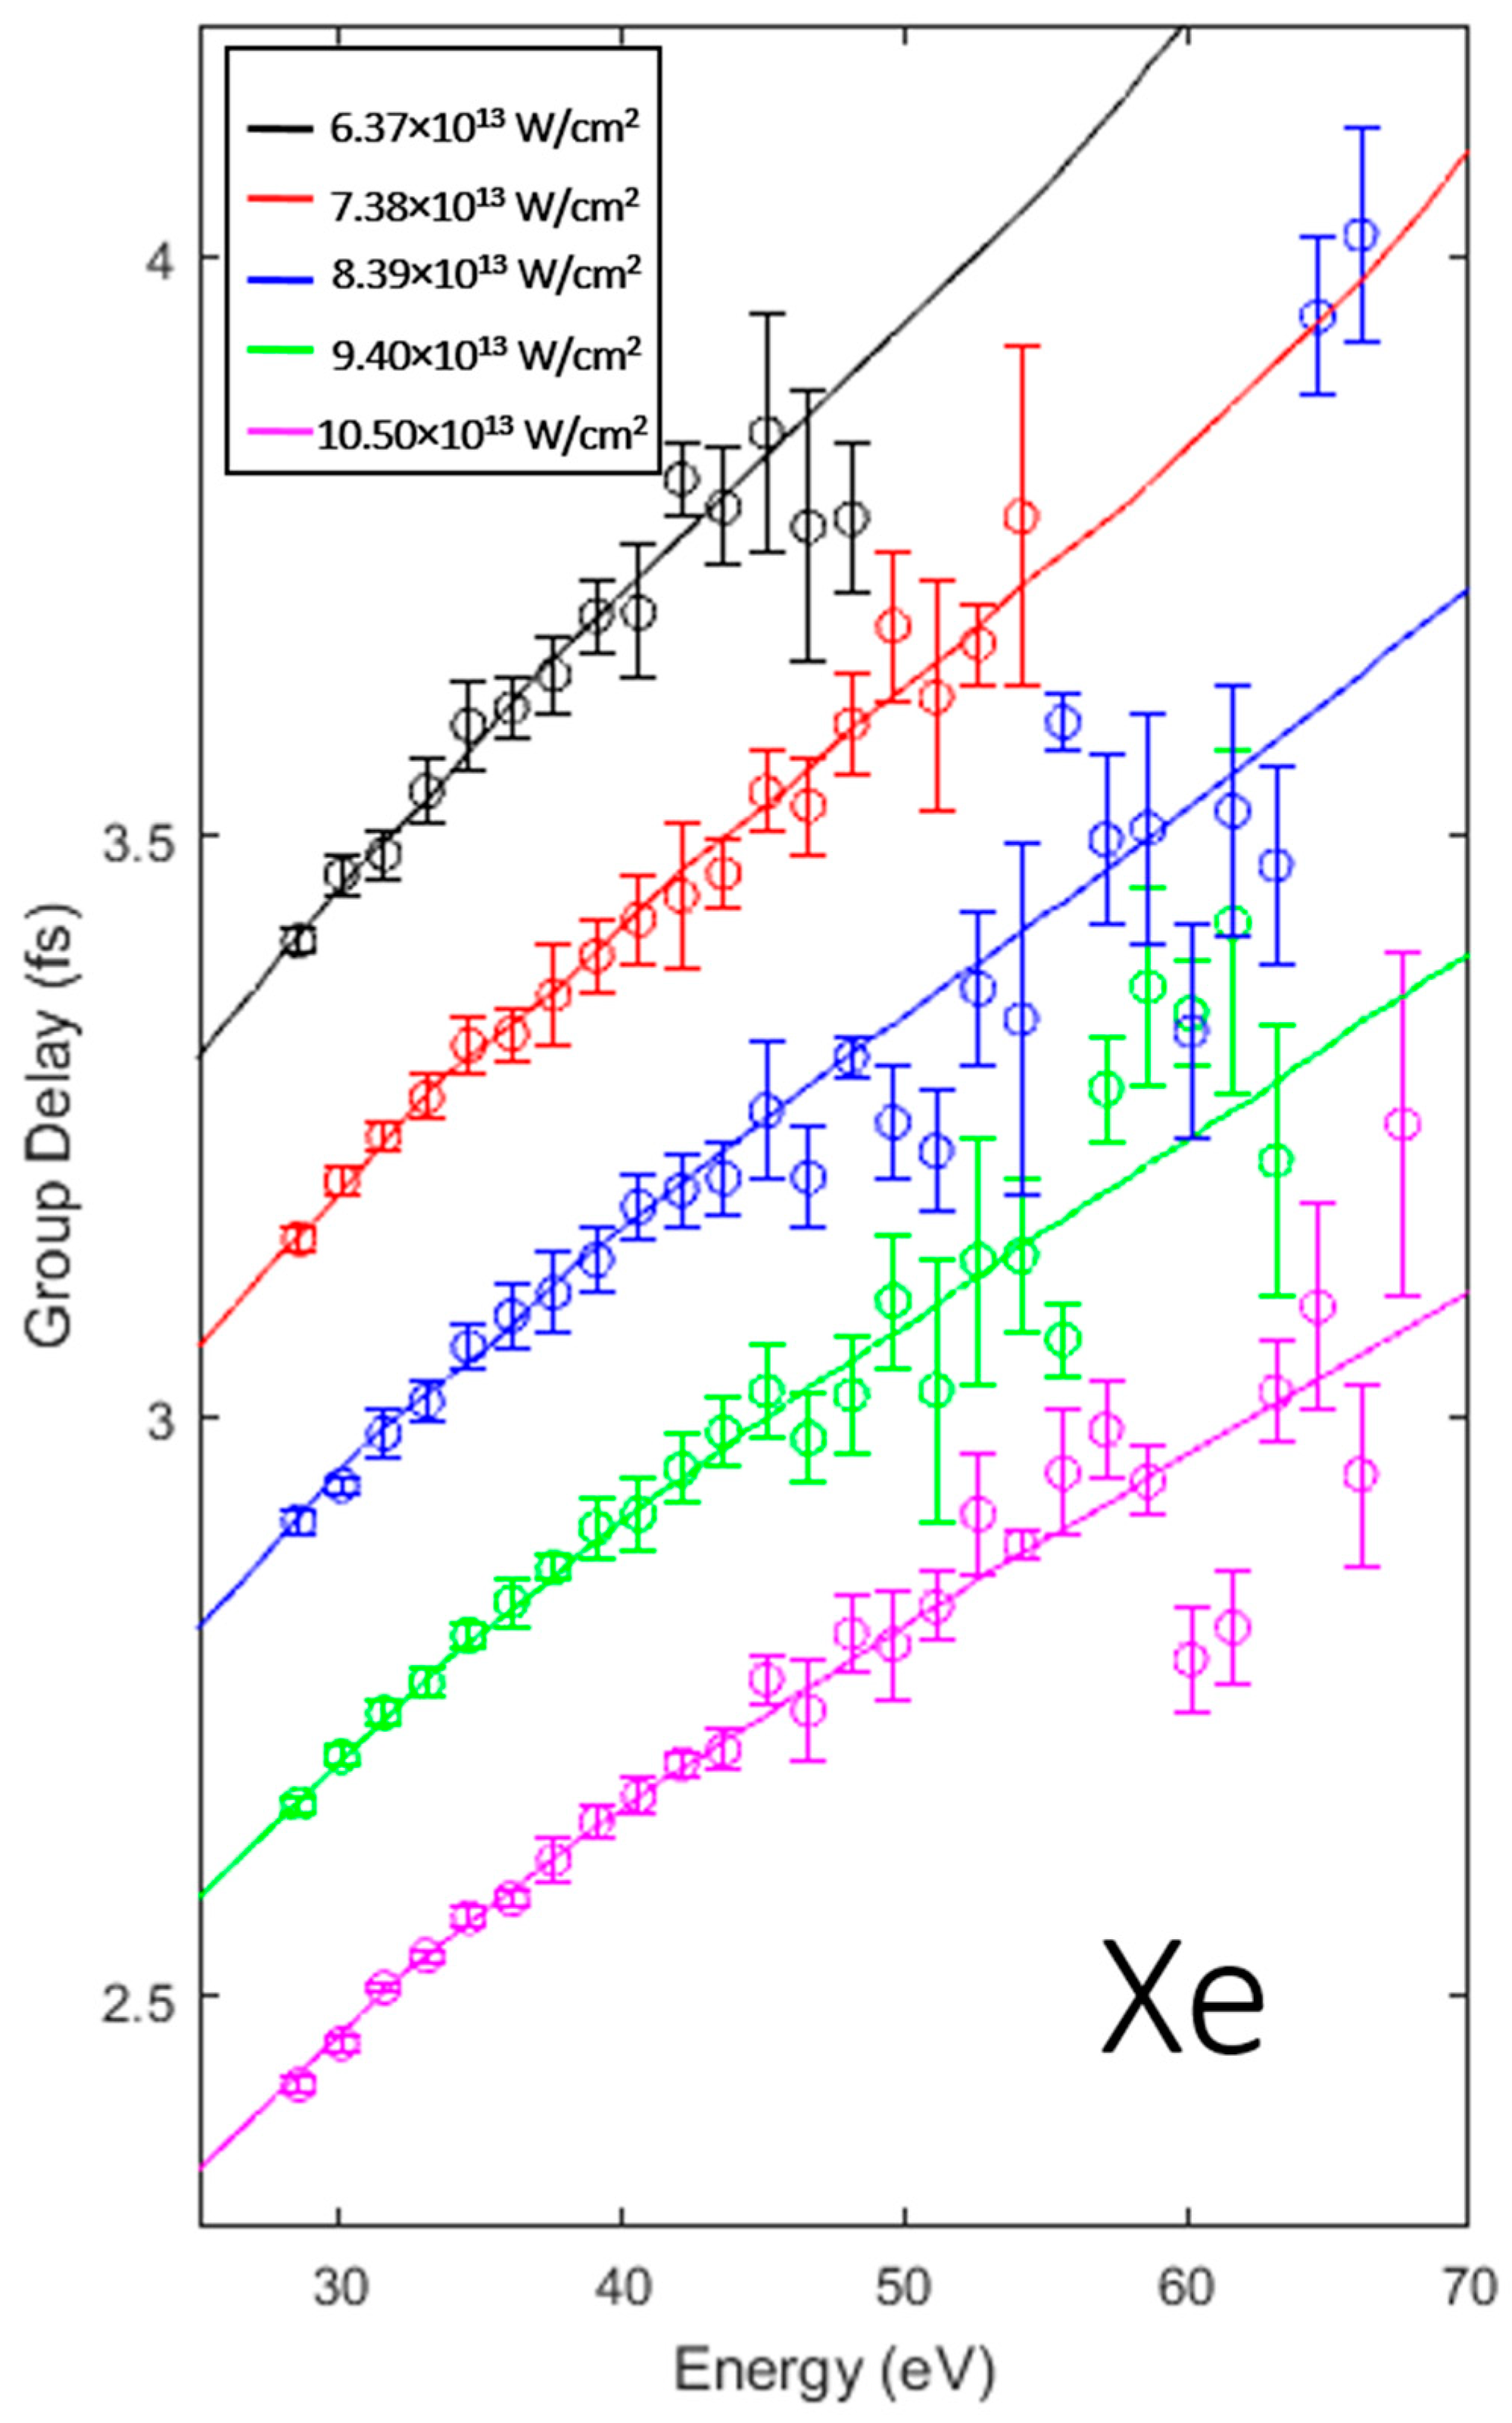
3.1. Intensity Scaling and Calibration

Before applying the SFA attochirp removal to the CM of methyl chloride, we first confirmed its validity in the case it was initially meant to describe: the ionization of an atomic target. Xenon was chosen due to its low ionization energy relative to the other noble gases, which provided a better comparison to these molecular targets. Shown in Figure 1 are the τ H H G values resulting from HHG in xenon at five intensities ranging from 6.37 × 10¹³ to 10.50 × 10¹³ W/cm2, and the fitted recombination times (of which the derivative is the attochirp [20]) plotted as solid lines. For all scans, the GD from the aluminum filter and atomic detection gas were removed before fitting for the attochirp, such that only the laser intensity and an arbitrary offset were involved in the fitting. Because the focal geometry was unchanged when using different input powers, the laser intensity was expected to scale linearly with the measured power. This was tested by fitting the SFA intensity to the curve with the lowest energy, and, for the remainder of the datasets, by scaling using the measured input power, such that their ratios were fixed by the experiment. Details of the quality of the fit can be found in Appendix A, where it is shown that all datasets were, within experimental error, of zero deviation from the calculated SFA.
Next, we extended the SFA to the molecular case. The applicability of the SFA emission time to HHG in polyatomic molecules is nontrivial; along with distortion of the GD from the CM, interference between multiple ionization centers [30] or multiple orbitals can affect the GD [31,32]. Furthermore, an implicit assumption in the SFA calculation is that the electron, following tunneling ionization, is unaffected by the ionic potential. The application of this assumption to species with a larger spatial extent is unclear, and it may break down in the case of molecules where the hole density is comparable in size to the electron trajectory. For molecules much smaller than the electron’s excursion length (up to several nm for MIR driving fields), we expect this assumption to remain valid; the experiment confirmed its validity for methane.
Figure 2 shows τ H H G at varying laser intensities in methane. As discussed above, the attochirp fitting is best done for targets with negligible contribution to the GD beyond the SFA. Because we did not expect the CM in methyl chloride to be negligible compared to the SFA contribution, we calibrated in a gas with a similar molecular structure to simultaneously maximize the HHG spectral intensity and GD comparisons. Methane was chosen to represent the singular structural dissimilarity of the chlorine substitution to methyl chloride, thus demonstrating that any feature in methyl chloride beyond the SFA was related entirely to the addition of the chlorine atom. Once again, the lowest-intensity dataset was fitted for the laser intensity and the arbitrary shift which minimized the argument of Equation (9), and all other datasets were scaled for intensity by the ratios of their measured input powers, and were fitted only for the arbitrary shift, t o f f s e t . As with the xenon result, the quality of the fits is discussed in Appendix A, again demonstrating good agreement with the SFA, and validating its use in describing methane as a reference gas.

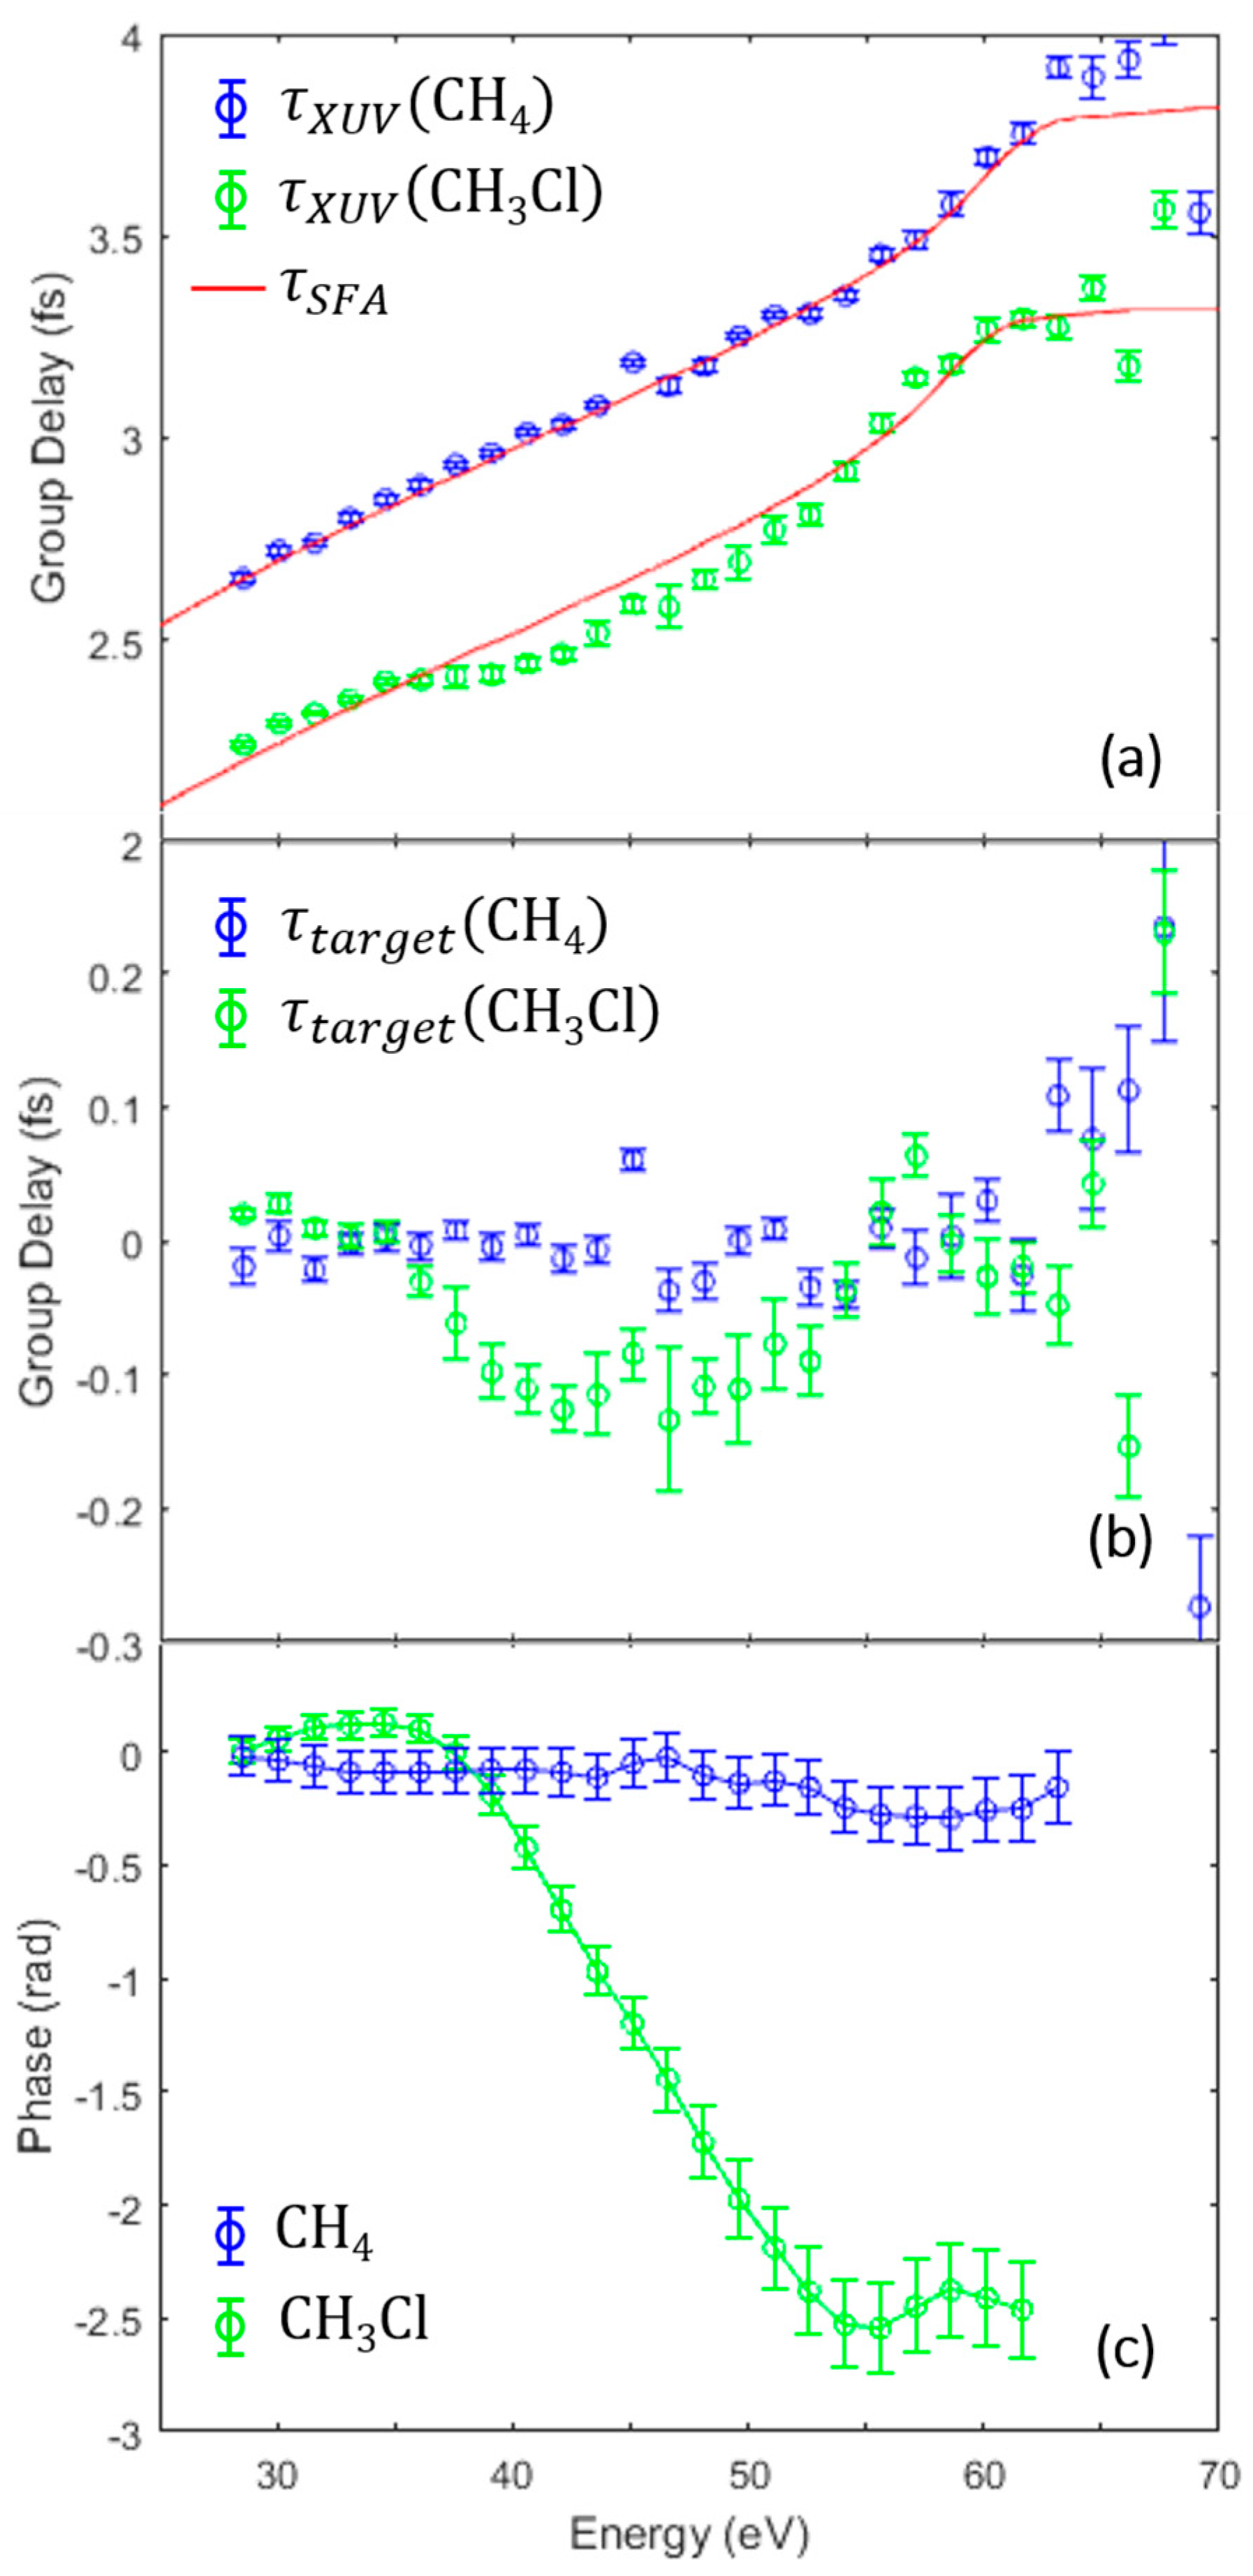
3.2. Identifying the Cooper Minimum in Methyl Chloride

In order to compare methane to methyl chloride, the spectra and RABBITT scans were recorded in identical conditions. We firstly discuss the normalized spectra, which are shown in Figure 3a. As was discussed in Section 2.2, we normalized the spectral intensities to remove the contributions from Γ t a r g e t and Γ r e f , and extracted the CM cross-section from the ratio of the envelopes in H H G C H 3 C l and H H G C H 4 . The envelopes were obtained by finding harmonic peaks and smoothing the result with a second-order Savitzky–Golay filter, and they appear in Figure 3a as solid lines. The yields were not expected to be the same; to keep conditions identical, HHG was optimized for methyl chloride to avoid saturating ionization in either sample. In the range of ~35–55 eV, methane generated a considerably larger yield, before the signal for the two species agreed once again in the harmonic cut-off. Because identical focal conditions were used (see the intensity scan discussion above), and because the two targets had similar IPs, we expected nearly the same cut-off energy. The ratio of the normalized envelopes is shown in Figure 3b with the maximum suppression occurring around 42.4 eV. Such suppression was previously seen in chlorinated molecules [14], and was attributed to a CM. Here, we note that, unlike the HHG spectra from di- and tetra-chloromethane, the spectrum of methyl chloride alone does not show an unambiguous minimum in the harmonic intensities. Identifying the methyl chloride structure as a CM required, therefore, further validation from the calibrated spectral intensity ratio and from the methyl chloride GD for a full characterization.
Shown in Figure 4 are the GDs of methane and methyl chloride (a) after removal of the atomic and filter delays ( τ H H G ), and (b) after further removal of τ S F A ( τ t a r g e t ). This comparison was necessary due to the ambiguous interpretation of GD as emission time in the SFA model; in the presence of additional features beyond the SFA, the fit was poorly conditioned. Thus, under identical conditions, we fitted to the SFA intensity of methane, applied the same intensity to methyl chloride, and removed the same attochirp from both measurements. While they were not entirely consistent near the cut-off, from 25–60 eV they agreed well but for a ~120-as reduction centered near 42 eV; this is similar to the CM measured in argon [12], though shifted in energy, which seems sensible given the analogous electronic similarity between the highest occupied molecular orbital (HOMO) of methyl chloride and the ground state of argon. In fact, the methyl chloride HOMO was calculated [9] as having approximately 80% of its population in the chlorine p orbital.
With only the contribution from the angle-integrated RDME remaining, we integrated the delay-corrected GD to retrieve the phase variation across the interaction up to an arbitrary shift. Overall, we found a variation of approximately 2.6 radians across ~15 eV, shown in Figure 4c, consistent with previous calculations for argon [13,33,34], in which the coupled time-dependent Schrödinger equation and Maxwell’s wave equations were solved [35,36] using an angular momentum-dependent pseudopotential [25]. This supports the idea that the methyl chloride HOMO largely features chlorine p characteristics, with the C–Cl bond ultimately filling the shell to complete the analogy to argon. In the argon picture, the d channel underwent a π phase shift across the minimum, and interfered with the outgoing s channel. In methyl chloride, although l was no longer a precise quantum number, the similarity to the argon CM suggests that s-like and d-like angular momentum channels interfered in the outgoing wavefunction, with a minimum in the d-like channel. This was additionally measured in a minimum of the β parameter of the methyl chloride 3e orbital [9], where a CM was observed near 45 eV.

4. Conclusions

We demonstrated the first GD measurement of a molecular CM using high-harmonic spectroscopy, a feature that was initially ambiguous with harmonic intensities alone. This was achieved only through careful removal of the slope of the GD, the attochirp. In doing this, we also further validated both the use of the SFA to calculate GD and its extension to small molecules without the need for more advanced editions of the SFA calculation. By interrogating the CM through spectral intensity, group delay, and phase, we provided a thorough characterization of the CM of methyl chloride, and found a strong analogy to the CM of argon. The atomic-like nature of the methyl chloride HOMO may reveal an interesting target for future work, where accessing the phase structures of larger chlorine-containing molecules or multiply chlorinated molecules can determine to what degree the HOMO is analogous to an atomic target. Additionally, studying the CM in molecules which are aligned or oriented to the laboratory frame may further elucidate the behavior of the CM.

Author Contributions

Methodology, software, and original draft preparation, T.D.S., T.T.G. and F.M. Validation, T.D.S. and T.T.G. Formal analysis, data curation, and visualization, T.D.S. and T.T.G. Investigation, T.D.S., T.T.G., P.S. and S.K. Writing—review and editing, all authors. Conceptualization, supervision, project administration, and funding acquisition, M.B.G., K.J.S., P.A. and L.F.D.

Funding

This work was supported by the US Department of Energy, Office of Science, Office of Basic Energy Sciences, under Award No. DE-SC0012462. L.F.D. acknowledges support from the Edward and Sylvia Hagenlocker Chair.

Acknowledgments

The authors thank Robert R. Jones for helpful discussions.

Conflicts of Interest

The authors declare no conflict of interest. The funders had no role in the design of the study; in the collection, analyses, or interpretation of data; in the writing of the manuscript, and in the decision to publish the results.

Appendix A

In this appendix, we examine the quality of the strong-field approximation (SFA) fits to our RABBITT data, and how these fits scaled with intensity. While improvements to the SFA were proposed to generalize the calculation to the molecular case, we implemented the atomic-level calculation [15], and found good agreement for the molecules in this study. We firstly assessed the intensity scaling in the expectedly successful calculation of atomic xenon, before investigating intensity scaling in the unknown case of methane, to validate the applicability of the atomic SFA calculation to the molecules in the presented study.
Here, we discuss the quality of the fits to the data. We expected the intensity at focus to be directly proportional to the average powers measured before sending pulses into the RABBITT interferometer; as such, we used a fitting routine, as discussed in the main text, to minimize the error of the lowest-intensity dataset, since its comparatively large slope was most sensitive to the intensity fit. For all other datasets, the SFA was calculated using a fixed intensity scaled by the ratio of measured input powers. We then calculated a residual from that fit, which was weighted by the error bars. The mean error is plotted for xenon in Figure A1 for all input powers which were able to provide high-quality RABBITT phase measurements, with the error bars representing a standard deviation of the error from the SFA fit. For all experimental datasets, ranging from 6.37 × 10¹³ W/cm2 to 10.50 × 10¹³ W/cm2, the experimental result matched the calculation within experimental error, validating the calculation for its intended case of the atomic phase.
Figure A1. Mean error from the SFA fit in xenon. By applying the SFA fit to the lowest-intensity RABBITT data, and by scaling further calculations relative to the known input power, we found that the SFA calculations in xenon were, within error bars, of zero deviation from the experimental results.
Applsci 08 01129 g0a1
Next, we performed a similar analysis on the data for methane in order to validate its applicability for the removal of the attochirp from methyl chloride absent of any other spectral phase features (such as the Cooper minimum). Shown in Figure A2 are the mean errors for the fits in methane, again using the lowest-intensity dataset for the fit and applying a known average power scaling for further calculations. Once again, we found good agreement, as six of seven datasets were fit to within the experimental error, with the lone outlier at 8.51 × 10¹³ W/cm2 at 1.25 standard deviations from zero. Thus, we determined that the applicability to small molecules in the presented experiment was validated.
Figure A2. Mean error from the SFA fit in methane (CH4). By applying the SFA fit to the lowest-intensity RABBITT data, and by scaling further calculations relative to the known input power, we found that six of the seven SFA calculations in methane were, within error bars, of zero deviation from the experimental results, in spite of the calculation being designed to treat the atomic potential. The only outlier at 8.51×10¹³ W/cm2 sits 1.25 standard deviations from zero.
Applsci 08 01129 g0a2

References

  1. Krausz, F.; Ivanov, M. Attosecond physics. Rev. Mod. Phys. 2009, 81, 163–234. [Google Scholar] [CrossRef]
  2. Marangos, J.P. Development of high harmonic generation spectroscopy of organic molecules and biomolecules. J. Phys. B At. Mol. Opt. Phys. 2016, 49, 132001. [Google Scholar] [CrossRef]
  3. Haessler, S.; Fabre, B.; Higuet, J.; Caillat, J.; Ruchon, T.; Breger, P.; Carré, B.; Constant, E.; Maquet, A.; Mével, E.; et al. Phase-resolved attosecond near-threshold photoionization of molecular nitrogen. Phys. Rev. A 2009, 80, 011404(R). [Google Scholar] [CrossRef]
  4. Huppert, M.; Jordan, I.; Baykusheva, D.; von Conta, A.; Wörner, H.J. Attosecond Delays in Molecular Photoionization. Phys. Rev. Lett. 2016, 117, 093001. [Google Scholar] [CrossRef] [PubMed]
  5. Wörner, H.J.; Arrell, C.A.; Banerji, N.; Cannizzo, A.; Chergui, M.; Das, A.K.; Hamm, P.; Keller, U.; Kraus, P.M.; Liberatore, E.; et al. Charge migration and charge transfer in molecular systems. Struct. Dyn. 2017, 4, 061508. [Google Scholar] [CrossRef] [PubMed]
  6. Kraus, P.M.; Mignolet, B.; Baykusheva, D.; Rupenyan, A.; Horný, L.; Penka, E.F.; Grassi, G.; Tolstikhin, O.I.; Schneider, J.; Jensen, F.; et al. Measurement and laser control of attosecond charge migration in ionized iodoacetylene. Science 2015, 350, 790–795. [Google Scholar] [CrossRef] [PubMed]
  7. Cooper, J.W. Photoionization from Outer Atomic Subshells. A Model Study. Phys. Rev. 1962, 128, 681. [Google Scholar] [CrossRef]
  8. Higuet, J.; Ruf, H.; Thiré, N.; Cireasa, R.; Constant, E.; Cormier, E.; Descamps, D.; Mével, E.; Petit, S.; Pons, B.; et al. High-order harmonic spectroscopy of the Cooper minimum in argon: Experimental and theoretical study. Phys. Rev. A 2011, 83, 053401. [Google Scholar] [CrossRef]
  9. Carlson, T.A.; Krause, M.O.; Svensson, W.A.; Gerard, P.; Grimm, F.A.; Whitley, T.A.; Pullen, B.P. Photoelectron Dynamics of the Cooper Minimum in Free Molecules. Z. Phys. D At. Mol. Clust. 1986, 2, 309–318. [Google Scholar] [CrossRef]
  10. Novak, I.; Benson, J.M.; Potts, A.W. UV Angle Resolved Photoelectron-Spectra of Fluoro and Chloromethane using Synchrotron Radiation. J. Electron. Spectrosc. Relat. Phenom. 1986, 41, 225–233. [Google Scholar] [CrossRef]
  11. Holland, D.M.P.; Powis, I.; Ohrwall, G.; Karlsson, L.; von Niessen, W. A study of the photoionisation dynamics of chloromethane and iodomethane. Chem. Phys. 2006, 326, 535–550. [Google Scholar] [CrossRef]
  12. Schoun, S.B.; Chirla, R.; Wheeler, J.; Roedig, C.; Agostini, P.; DiMauro, L.F.; Schafer, K.J.; Gaarde, M.B. Attosecond Pulse Shaping around a Cooper Minimum. Phys. Rev. Lett. 2014, 112, 153001. [Google Scholar] [CrossRef] [PubMed]
  13. Wörner, H.J.; Niikura, H.; Bertrand, J.B.; Corkum, P.B.; Villeneuve, D.M. Observation of Electronic Structure Minima in High-Harmonic Generation. Phys. Rev. Lett. 2009, 102, 103901. [Google Scholar] [CrossRef] [PubMed]
  14. Wong, M.C.H.; Le, A.T.; Alharbi, A.F.; Boguslavskiy, A.E.; Lucchese, R.R.; Brichta, J.P.; Lin, C.D.; Bhardwaj, V.R. High Harmonic Spectroscopy of the Cooper Minimum in Molecules. Phys. Rev. Lett. 2013, 110, 033006. [Google Scholar] [CrossRef] [PubMed]
  15. Lewenstein, M.; Balcou, P.; Ivanov, M.Y.; L’Huillier, A.; Corkum, P.B. Theory of High-Harmonic Generation by Low-Frequency Laser Fields. Phys. Rev. A 1994, 49, 2117–2132. [Google Scholar] [CrossRef] [PubMed]
  16. Mairesse, Y.; De Bohan, A.; Frasinski, L.J.; Merdji, H.; Dinu, L.C.; Monchicourt, P.; Breger, P.; Kovačev, M.; Taïeb, R.; Carré, B.; et al. Attosecond synchronization of high-harmonic soft x-rays. Science 2003, 302, 1540–1543. [Google Scholar] [CrossRef] [PubMed]
  17. Kazamias, S.; Balcou, P. Intrinsic chirp of attosecond pulses: Single-atom model versus experiment. Phys. Rev. A 2004, 69, 063416. [Google Scholar] [CrossRef]
  18. Mairesse, Y.; De Bohan, A.; Frasinski, L.J.; Merdji, H.; Dinu, L.C.; Monchicourt, P.; Breger, P.; Kovačev, M.; Auguste, T.; Carré, B.; et al. Optimization of attosecond pulse generation. Phys. Rev. Lett. 2004, 93, 163901. [Google Scholar] [CrossRef] [PubMed]
  19. Varjú, K.; Mairesse, Y.; Carré, B.; Gaarde, M.B.; Johnsson, P.; Kazamias, S.; López-Martens, R.; Mauritsson, J.; Schafer, K.J.; Balcou, P.H.; et al. Frequency chirp of harmonic and attosecond pulses. J. Mod. Opt. 2005, 52, 379–394. [Google Scholar] [CrossRef]
  20. Doumy, G.; Wheeler, J.; Roedig, C.; Chirla, R.; Agostini, P.; DiMauro, L.F. Attosecond Synchronization of High-Order Harmonics from Midinfrared Drivers. Phys. Rev. Lett. 2009, 102, 093002. [Google Scholar] [CrossRef] [PubMed]
  21. Lias, S.G. Ionization Energy Evaluation. In NIST Chemistry WebBook, NIST Standard Reference Database Number 69; Linstrom, P.J., Mallard, W.G., Eds.; National Institute of Standards and Technology: Gaithersburg, MD, USA, 2005. Available online: https://webbook.nist.gov/cgi/cbook.cgi?Contrib=L (accessed on 10 June 2018).
  22. Paul, P.M.; Toma, E.S.; Breger, P.; Mullot, G.; Augé, F.; Balcou, P.; Muller, H.G.; Agostini, P. Observation of a train of attosecond pulses from high harmonic generation. Science 2001, 292, 1689–1692. [Google Scholar] [CrossRef] [PubMed]
  23. Muller, H.G. Reconstruction of attosecond harmonic beating by interference of two-photon transitions. Appl. Phys. B 2002, 74, S17–S21. [Google Scholar] [CrossRef]
  24. Etches, A.; Madsen, L.B. Extending the strong-field approximation of high-order harmonic generation to polar molecules: Gating mechanisms and extension of the harmonic cutoff. J. Phys. B At. Mol. Opt. Phys. 2010, 43, 155602. [Google Scholar] [CrossRef]
  25. Mauritsson, J.; Gaarde, M.B.; Schafer, K.J. Accessing properties of electron wave packets generated by attosecond pulse trains through time-dependent calculations. Phys. Rev. A 2005, 72, 013401. [Google Scholar] [CrossRef]
  26. Rakić, A.D. Algorithm for the determination of intrinsic optical constants of metal films: Application to aluminum. Appl. Opt. 1995, 34, 4755–4767. [Google Scholar] [CrossRef] [PubMed]
  27. Dahlström, J.M.; Guénot, D.; Klünder, K.; Gisselbrecht, M.; Mauritsson, J.; L’Huillier, A.; Maquet, A.; Taïeb, R. Theory of attosecond delays in laser-assisted photoionization. Chem. Phys. 2013, 414, 53–64. [Google Scholar] [CrossRef]
  28. Lin, C.D.; Le, A.-T.; Chen, Z.; Morishita, T.; Lucchese, R. Strong-field rescattering physics-self-imaging of a molecule by its own electrons. J. Phys. B At. Mol. Opt. Phys. 2010, 43, 122001. [Google Scholar] [CrossRef]
  29. Frolov, M.V.; Manakov, N.L.; Sarantseva, T.S.; Starace, A.F. Analytic formulae for high harmonic generation. J. Phys. B At. Mol. Opt. Phys. 2009, 42, 035601. [Google Scholar] [CrossRef]
  30. Boutu, W.; Haessler, S.; Merdji, H.; Breger, P.; Waters, G.; Stankiewicz, M.; Frasinski, L.J.; Taieb, R.; Caillat, J.; Maquet, A.; et al. Coherent control of attosecond emission from aligned molecules. Nat. Phys. 2008, 4, 545–549. [Google Scholar] [CrossRef]
  31. Diveki, Z.; Camper, A.; Haessler, S.; Auguste, T.; Ruchon, T.; Carré, B.; Salières, P.; Guichard, R.; Caillat, J.; Maquet, A. Spectrally resolved multi-channel contributions to the harmonic emission in N2. New J. Phys. 2012, 14, 023062. [Google Scholar] [CrossRef]
  32. McFarland, B.K.; Farrell, J.P.; Bucksbaum, P.H.; Gühr, M. High Harmonic Generation from Multiple Orbitals in N2. Science 2008, 322, 1232–1235. [Google Scholar] [CrossRef] [PubMed]
  33. Le, A.-T.; Morishita, T.; Lin, C.D. Extraction of the species-dependent dipole amplitude and phase from high-order harmonic spectra in rare-gas atoms. Phys. Rev. A 2008, 78, 023814. [Google Scholar] [CrossRef]
  34. Jin, C.; Le, A.-T.; Lin, C.D. Medium propagation effects in high-order harmonic generation of Ar and N2. Phys. Rev. A 2011, 83, 023411. [Google Scholar] [CrossRef]
  35. Farrell, J.P.; Spector, L.S.; McFarland, B.K.; Bucksbaum, P.H.; Gühr, M.; Gaarde, M.B.; Schafer, K.J. Influence of phase matching on the Cooper minimum in Ar high-order harmonic spectra. Phys. Rev. A 2011, 83, 023420. [Google Scholar] [CrossRef]
  36. Gaarde, M.B.; Buth, C.; Tate, J.L.; Schafer, K.J. Transient absorption and reshaping of ultrafast XUV light by laser-dressed helium. Phys. Rev. A 2011, 83, 013419. [Google Scholar] [CrossRef]
Figure 1. Laser intensity scaling in xenon. Measured extreme ultraviolet (XUV) group delays (circles) are shown from harmonic generation in xenon gas, fitted with intensities as shown in the legend. The lowest-intensity curve was fitted for intensity using Equation (9), and this fitted intensity was scaled according to the measured input power ratio for each additional scan (curves). Each intensity was separated by 0.2 fs for visual clarity.
Applsci 08 01129 g001
Figure 2. Laser intensity scaling in methane. Measured XUV group delays (circles) are shown from harmonic generation in methane, fitted with intensities as shown in the legend. As with the xenon scan of Figure 1, the lowest-intensity curve was fitted according to Equation (9), and scaled by the measured input power ratio for each additional scan (curves). Each intensity was separated by 0.2 fs for visual clarity.
Applsci 08 01129 g002
Figure 3. Influence of the methyl chloride Cooper minimum (CM) on the spectral intensity relative to methane. (a) Normalized spectra were taken in sequence with identical harmonic generation conditions for the intensity comparison of methane (blue) and methyl chloride (green); (b) The ratio of normalized spectra from (a) shows the relative minimum in amplitude. Because the laser field was held constant and the spectra were normalized, the difference was attributable exclusively to the chlorine substitution.
Applsci 08 01129 g003
Figure 4. Methane and methyl chloride comparison. Methane (blue) and methyl chloride (green) group delays are shown with the filter and atomic delays removed. (a) The strong-field approximation (SFA) group delay (red) is shown along with the high-harmonic contribution ( τ H H G ) from the experiment. The SFA intensity was fit using methane, resulting in an intensity of 5.56 × 10¹³ W/cm2, and then, this same intensity was applied to the methyl chloride data. The methyl chloride data are shown with a −0.2-fs shift for visual clarity. (b) After removal of the SFA curve, τ t a r g e t was isolated. By doing so, the CM in methyl chloride was revealed as a ~120-as structure in group delay. (c) Group delays were then integrated to show the phase shift of approximately 2.6 radians across the CM.
Applsci 08 01129 g004

