Weathering Process of In Situ Granite and Particle Breakage Characteristics of Compacted Weathered Granite


1
Department of Civil Engineering, Shanxi University, Taiyuan 030013, China
2
School of Transportation Science and Engineering, Beihang University, Beijing 100191, China
3
School of Architecture and Civil Engineering, Taiyuan University of Technology, Taiyuan 030024, China
*
Authors to whom correspondence should be addressed.
Appl. Sci. 2018, 8(7), 1108; https://doi.org/10.3390/app8071108
Submission received: 29 May 2018
/
Revised: 4 July 2018
/
Accepted: 5 July 2018
/
Published: 9 July 2018
(This article belongs to the Section Materials Science and Engineering)
Abstract
:Quantificationally describing weathering process and characterizing particle breakage are important in predicting the behavior of coarse-grained soil (e.g., weathered granite). In order to comprehensively understand the mechanical properties of weathered granite and provide references for reasonable evaluation of the engineering properties of subgrade filling in mountains, a series of tests—X-ray diffraction, sieving, heavy compaction, large-scale triaxial, and field compaction tests—were carried out in this research. Based on the weathering process parameters (m and r) of in-situ granite samples at two typical sections of weathered granite mountains obtained by using previous grading equation, the mathematical model of weathering process with depth was proposed and the variation laws of weathering process with depth were described. The results show that, with an increase in burying depth of mountain profile (h) of weathered granite, the geological year’s parameter (m) decrease by power function, but the geometric progression constants (r) increase by power function. Some factors affecting the particle breakage properties of compacted weathered granite were evaluated by using relative breakage (Br). Especially, the effect of field compaction condition (such as thickness of loose paving layer and number of vibratory rolling passes) on particle breakage was analyzed creatively. Through laboratory and field tests, it was found that particle gradation, mineral composition, compaction effect, stress level, and number of rolling passes significantly affected the particle breakage characteristics of weathered granite. Furthermore, it is worthy of attention that the weathered granite in this paper showed obvious particle breakage characteristics under weak compaction effect and at low stress levels and over-compaction could result in a decrease in the degree of compaction of a certain thickness of loose paving layer filled with weathered granite. Findings in this research can provide a theoretical basis for evaluating the physical properties and mechanical behavior of weathered granite as subgrade fillings.
1. Introduction
With further improvements to the Chinese highway infrastructure, more and more highway engineering construction projects in mountainous areas will be carried out. In order to solve the problem of a shortage of subgrade filling materials in mountainous areas, it is urgent to study the engineering properties and applicability of special subgrade materials. In addition to stress-train nonlinear, elastic-plastic, dilatancy (shrinkage), and other properties, weathered granite, a type of special subgrade material, has its own unique engineering property, e.g., easy weathering and particle breakage. The different of weathering process determines the particle size distribution of the in-situ soils. Furthermore, the particle size distribution affects the particle breakage characteristics of soils. There are not many studies concerning the particle size distribution of natural weathered granite soil, but these types of studies are very important, because the particle size distribution has considerable influences upon engineering properties of weathered granite soil such as compatibilities, permeabilities, and strength-deformation characteristics [1].
The characteristics of particle breakage are obviously affected by the weathering process [1]. The structural failure or damage of soil particles caused by loading is the external cause of soil particle breakage. The internal causes of particle breakage in weathered granite are mainly microcracks (or voids) and fragile mineral components (e.g., biotite, feldspar, etc.) [2]. Particle breakage can cause a change in the distribution of soil particles, and then the physical and mechanical properties of soil will be changed [3,4].
As early as the 20th century, some scholars discovered the phenomenon of soil particle breakage. However, because the number of construction projects was small and the experimental technology was backward at that time, the phenomenon of particle breakage of soil has not received sufficient attention for quite a long time [5]. It was not until one-dimensional compression tests on sand subjected to high confining pressure (96.5 MPa) were carried out by Terzaghi and Peck [6] and its particle breakage was discovered that particle breakage of geotechnical material was extensively studied in the field of engineering.
In the past, many methods and indexes were proposed to evaluate the degree of soil particle breakage [7,8,9,10]. Some measured the increase in percentage of particles passing a given sieve size, some measured the decrease in sieve size corresponding to a given percentage passing [11], and some measured the changes in the overall particles [12,13,14,15,16]. Among them, four measurement methods, proposed by Marsal [10], Lee and Farhoomand [11], Miura and O-Hara [13], and Hardin [14], are widely used in engineering practice. Among these four methods, because the concept of breakage potential (Bp) proposed by Hardin [14] is more scientific and easier to measure, the relative breakage index Br has been widely used in correlative fields.
The particle breakage of soils has been studied in previous research by using the proposed particle breakage indexes from different angles [17], but most of these studies were qualitative, and few quantitative studies were carried out using the indexes, which can truly reflect the overall change in the particle size distribution of soil. The relationships between different factors and quantitative breakage indexes were also less studied.
The particle breakage properties of coarse-grained soil at high stress levels have been studied quantitatively [18,19,20,21], but less research has been done on geotechnical material (e.g., weathered granite) that can be crushed at low stress levels [13].
Particle breakage of soil is influenced by several factors, such as initial void ratio, grain shape, grading curves, mineral composition, saturation, grain strength, load size, loading path, etc. [22]. In order to explore the weathering process of in situ granite and the particle breakage characteristics of compacted weathered granite, the geological year’s parameter m and geometric progression constants r of different depth granite samples were calculated by Fukumoto’s grading equation [1] and a series of laboratory and field tests were performed—X-ray diffraction, sieving, heavy compaction, large-scale triaxial, and field compaction tests—to quantitatively discuss the particle breakage characteristics of compacted weathered granite using relative breakage [14].
One of the purposes of this paper is to provide a theoretical basis for determining the grain distribution of weathered granite in different weathering processes (or in different depths of the mountain profile) and a reference for the selection of subgrade fillings by establishing a quantitative relationship between the depths of weathered mountain profile and the weathering process of weathered granite. Another purpose is to break through the limitation of cognition in previous research on the particle breakage characteristics of soils at high stress levels by means of the large-scale triaxial test of weathered granite at low stress levels.
2. Quantitative Index for Measuring Weathering Process and Particle Breakage
2.1. Quantitative Index for Measuring Weathering Process of Granite
It is difficult to quantificationally describe the weathering process of granite by using a certain mathematical model. Base on some assumptions and simplifications, Fukumoto [1] made it possible to describe the process of granite weathering by using reasonable mathematical methods. By means of a large number of field investigation and a series of sieving tests, Fukumoto [1] proposed a grad equation for decomposed granite soil by using geometric fractal theories and mathematical statistics method and used it to evaluate the particle breakage of weathered rock. Fukumoto’s model has been widely used in describing the process of rock weathering because it is more scientific and easier to use. Thus, this research also used this model to describe the weathering process of in-situ granite.
Before establishing weathering mathematical model, Fukumoto made the following assumptions:
- (1)
- In a state of weathering, the retained percentage of soil show statistically geometric progressional distribution, it is constant r (0 ≤ r ≤ 1).
- (2)
- The decomposed granite soil, which passed geological time of y0 years, was sieved by one series of sieves with sieve ratio of λ.
- (3)
- The percent retained of nth sieve from maximum particle size Dmax toward smaller size, is expresses as (1−r)·rn−1.
Equations (1) and (2) are called a grading equation of decomposed granite soil.
where pn is the percent passing which pass mesh opening Dn. n in Equation (1) is related with Dn as in Equation (2).
The calculation procedures of Fukumoto’s equation are follows as:
- (1)
- The position of n on the horizontal axis in Figure 1 must be determined. Applying Dmax, the maximum particle size by actual measurement, and , the sieve ratio assuming Tyler Series, is obtained from Equation (2). Using this relation and combining with particle size Dn on the horizontal axis, graduation of n scale in figure is possible. Depending on the n scale, read the value of percent passing pn on vertical axis corresponding to integer n (dotted line in figure). Then, obtain the percent retained qn.
- (2)
- Obtain mean μ and variance σ2 by the following equation:
According to Equations (5) and (6) stand, m and r are obtained by Equations (7) and (8)
Using Equations (1) and (2) by the substitution of m and r, the theoretical curve which is indicated by thin line in Figure 1 is obtained.
2.2. Quantitative Index for Measuring Particle Breakage
The relative breakage proposed by Hardin [14] was obtained from the variation in particle size distribution curves before and after loading. Relative breakage can reflect the overall change in particle size distribution before and after loading and overcomes the shortcoming of using the increase in percentage of particles passing a given sieve size [7,8,9] or the decrease in sieve size corresponding to a given percentage passing [11] as the evaluation index for particle breakage. As mentioned above, for soil elements with the same particle shape and initial conditions, but different particle size distributions, after loading along the same path, the relative breakage rate is basically the same. Relative breakage can be regarded as a basic attribute of the soil material, so it is more scientific to take relative breakage as an index to evaluate soil particle breakage characteristics.
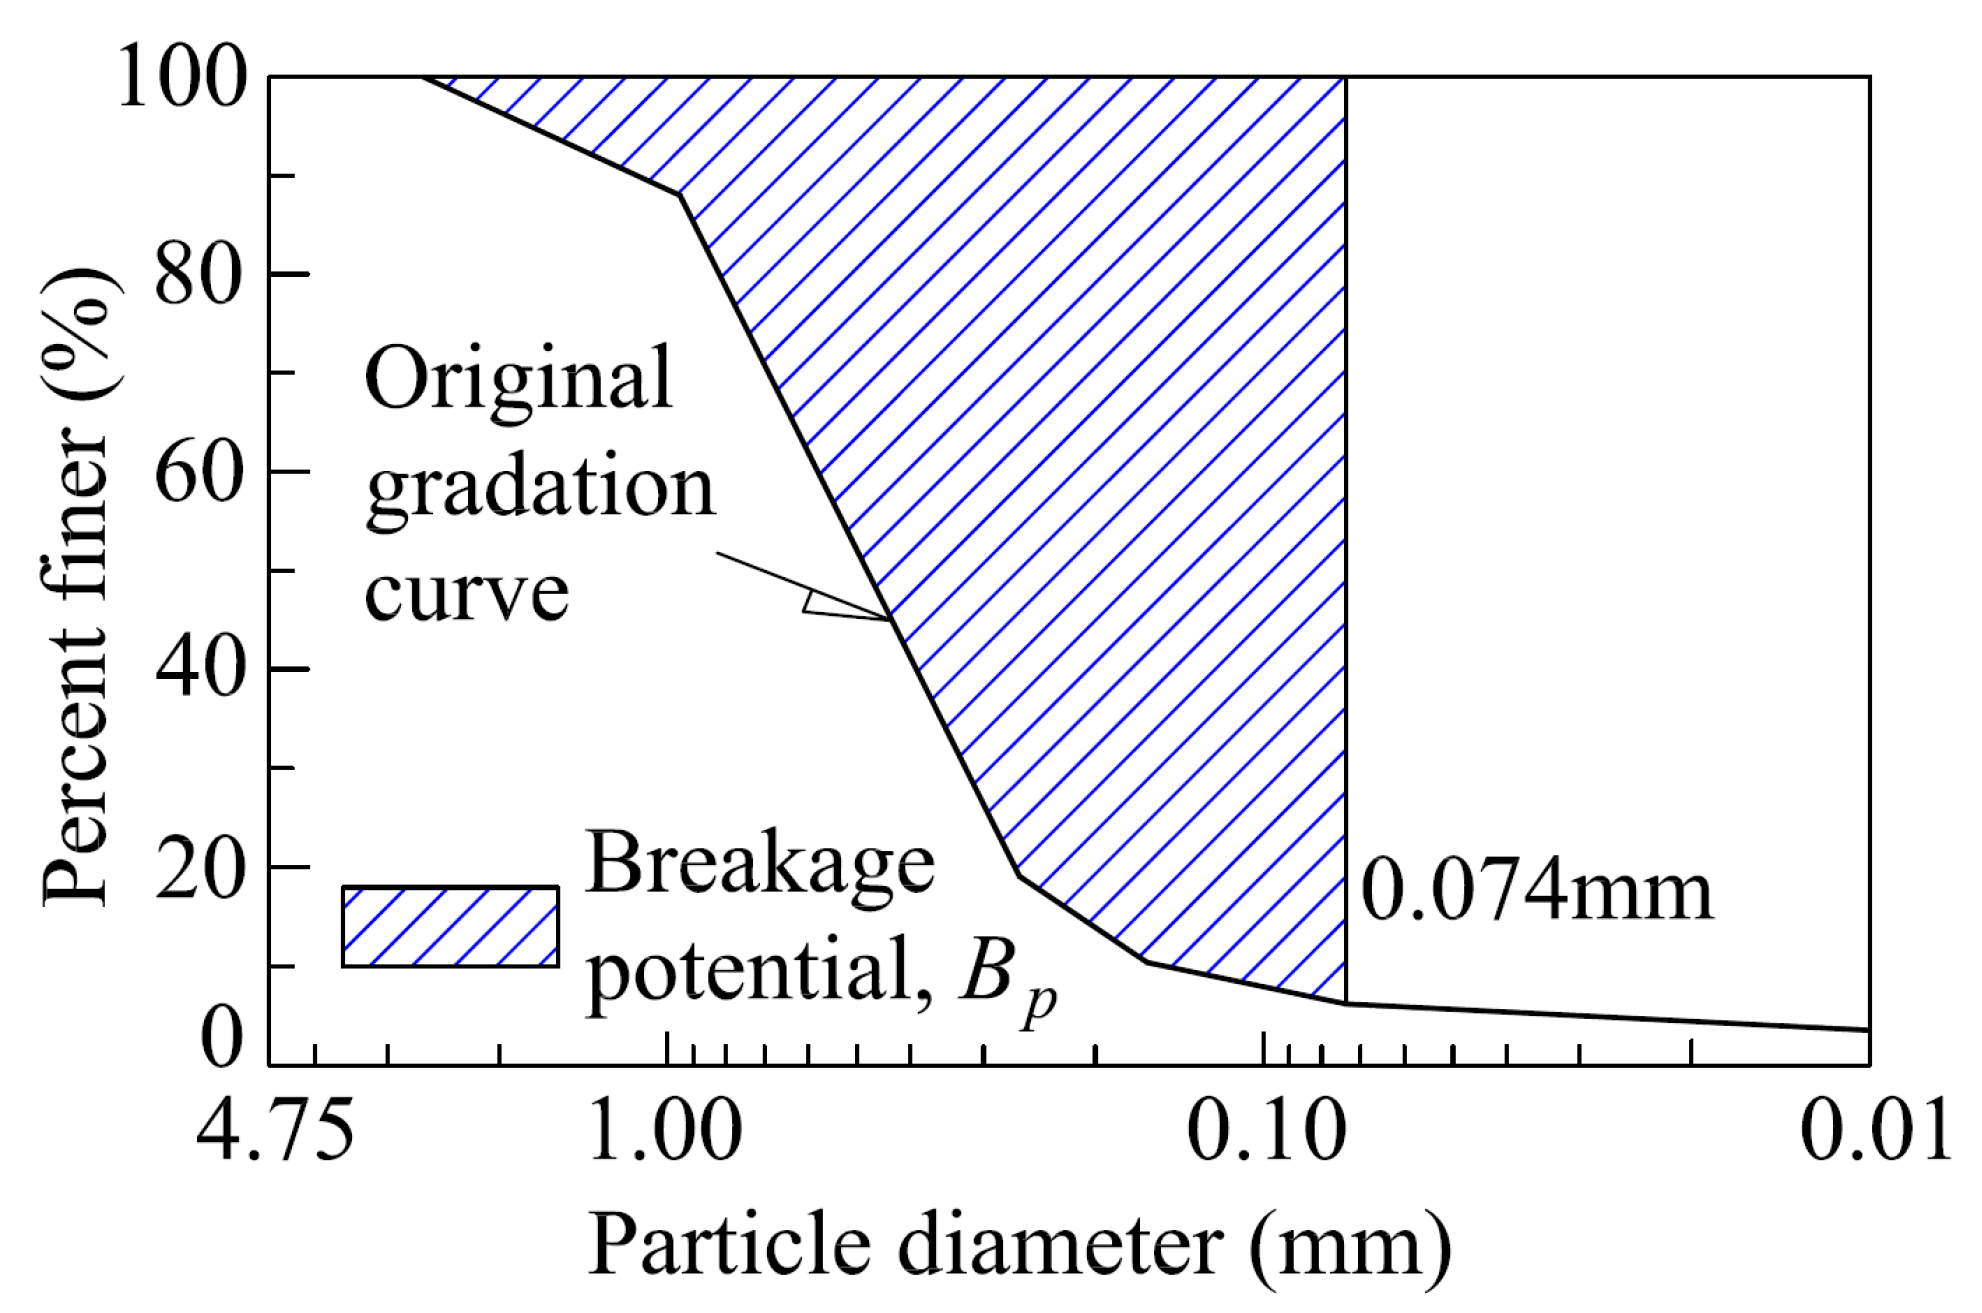
The breakage potential (Bp) defined by Hardin [14] can be seen as the possibility of particle breakage (shown in Figure 2). It is considered that the possibility of soil particle breakage increases with particle size. That is because the normal contact forces in a soil element increase with particle size and the probability that there will be a defect in a given particle increases with its size [14].
Under high stress, large particles will be broken into silt particles 0.074 mm in size, while silt particles cannot be broken further. Therefore, the ultimate particle size is 0.074 mm in the process of breakage [14]. All particles larger than this size have the possibility of breakage. The potential for breakage of a particle of a given size, D, can be represented by
where D is particle size (mm) and D ≥ 0.074 mm; when D < 0.074 mm, bp = 0.
According to the definition of Hardin [14], the desired integration of the breakage potential (Bp), shown as the hatched areas in Figure 2, can be given by
where df is a differential of percentage of particles passing divided by 100.
Hardin [14] defined the difference between the breakage potential of soil samples before and after loading as the total breakage (Bt), shown by the hatched areas in Figure 3 and given by
where bpo is the original value of bp and bpl is the value of bp after loading.
The data measured by Lee and Farhoomand [11] show that values of Br, for soil elements with the same particle material and shape, at a given void ratio and loaded along a specified effective stress path to the same state of effective stress, are approximately proportional to Bp. In view of the above, Hardin [14] concluded that when particle size distribution is the only variable, Bt is proportional to Bp and defined the relative breakage index, Br, as a quantitative indicator of particle breakage, as follows:
In other words, the relative breakage, Br, is approximately independent of particle size distribution when the only variable is particle size distribution.
The lower limit of relative breakage is zero, which means no soil particles are crushed. The theoretical upper limit of relative breakage is 1, which means all soil particles are crushed to the extent that no particles larger than 0.074 mm remain.
3. Specimen Preparation and Test Methods
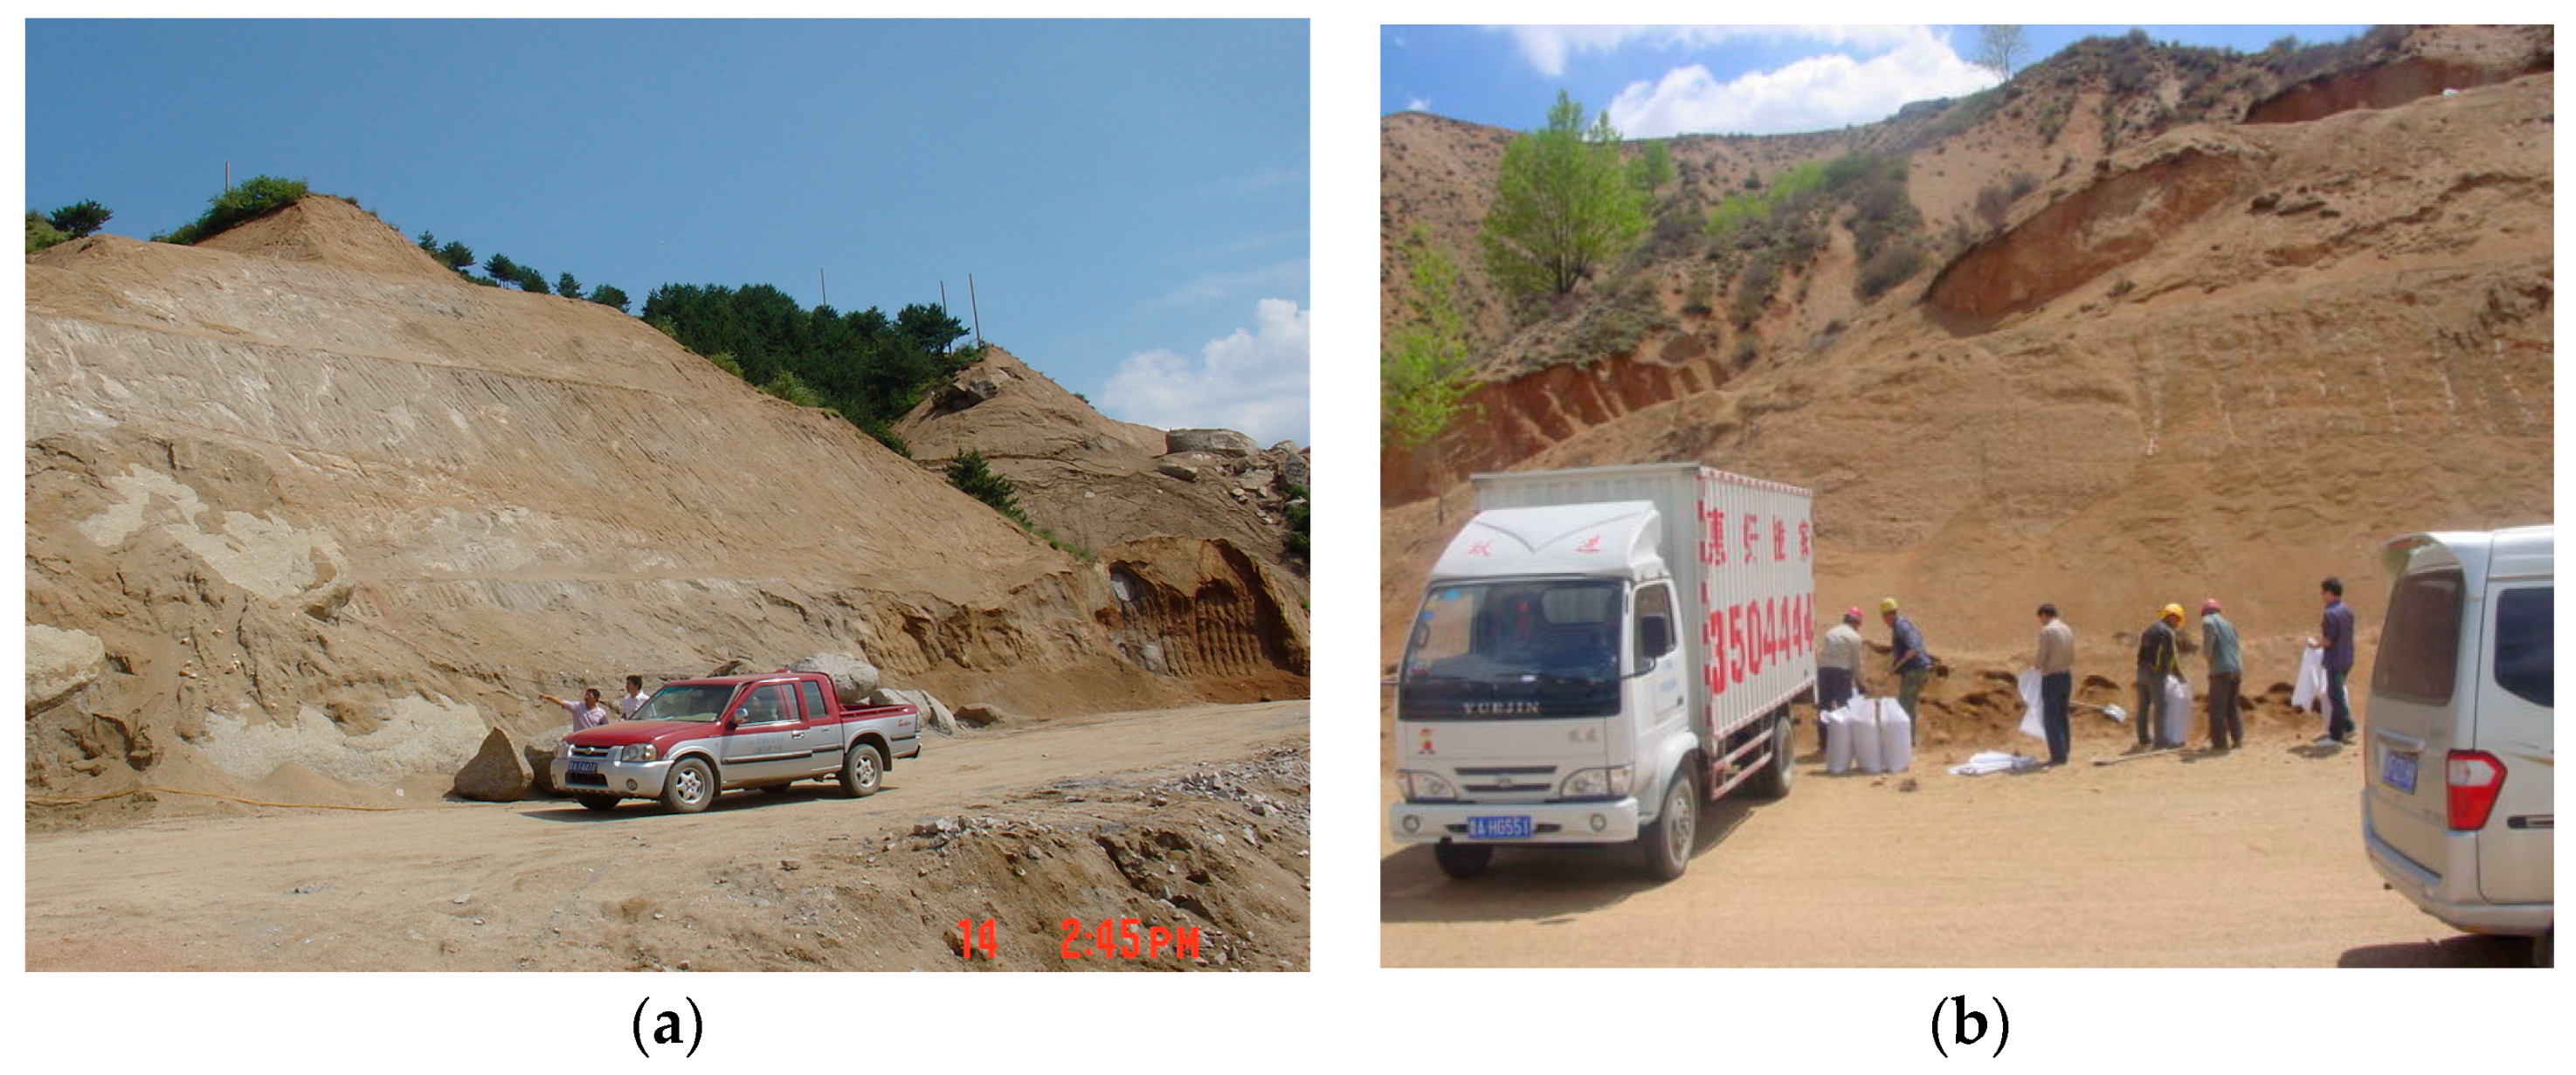
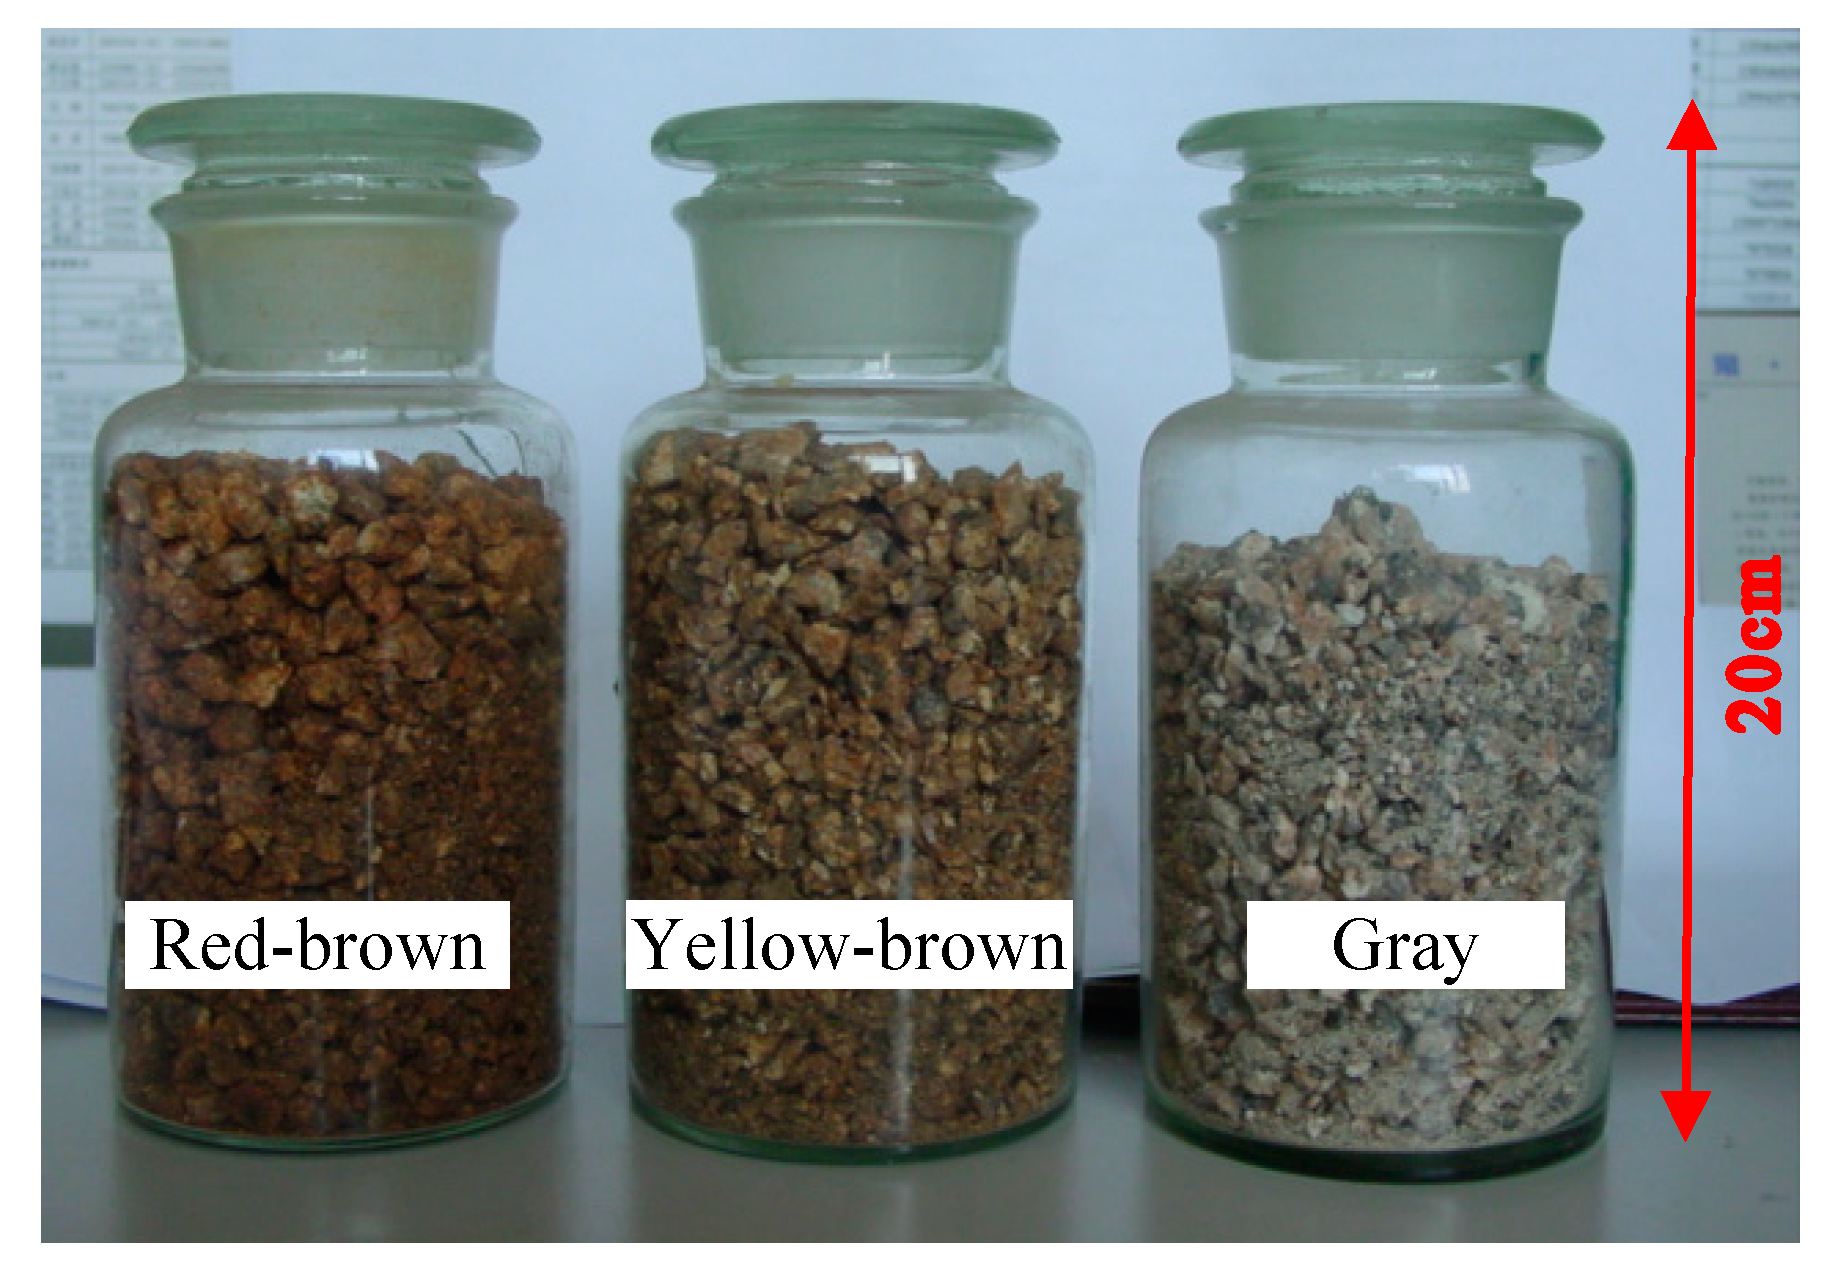
The weathered granite soils used in this research were sampled from a site near Mount Yunzhong (shown in Figure 4), a branch of the Luliang Mountains, on the eastern outskirts of Xinzhou City, Shanxi Province, China. These soils were used as part of the subgrade materials on Xinbao Highway (Xinzhou City to Baode City). There were three colors of weathered granite in the field, red-brown, yellow-brown, and gray, from the surface to the inside of the mount, as shown in Figure 5. Most of the fillings used in the field embankment were obtained from the excavation range at a depth of about 10 m under the surface of the mount. The embankment is mainly filled with red-brown weathered granite, so parts of the tests in this paper were mainly aimed at red-brown samples.
In order to evaluate the weathering process of granite, Fukumoto’s weathering model was used in this research. Based on the thorough investigation on the distribution of weathered granite in the field, a series of sieving testes were made on a large number of granite samples obtained from two typical sections, as shown in Figure 4a,b, and geological year’s parameter m and geometric progression constants r of granite samples at different depths were calculated by using Fukumoto’s grading equation. In addition, in order to research the particle breakage characteristics of compacted weathered granite, the experimental procedures involved in this study were X-ray diffraction, sieving, heavy compaction, large-scale triaxial, and field compaction tests.
3.1. X-ray Diffraction Test
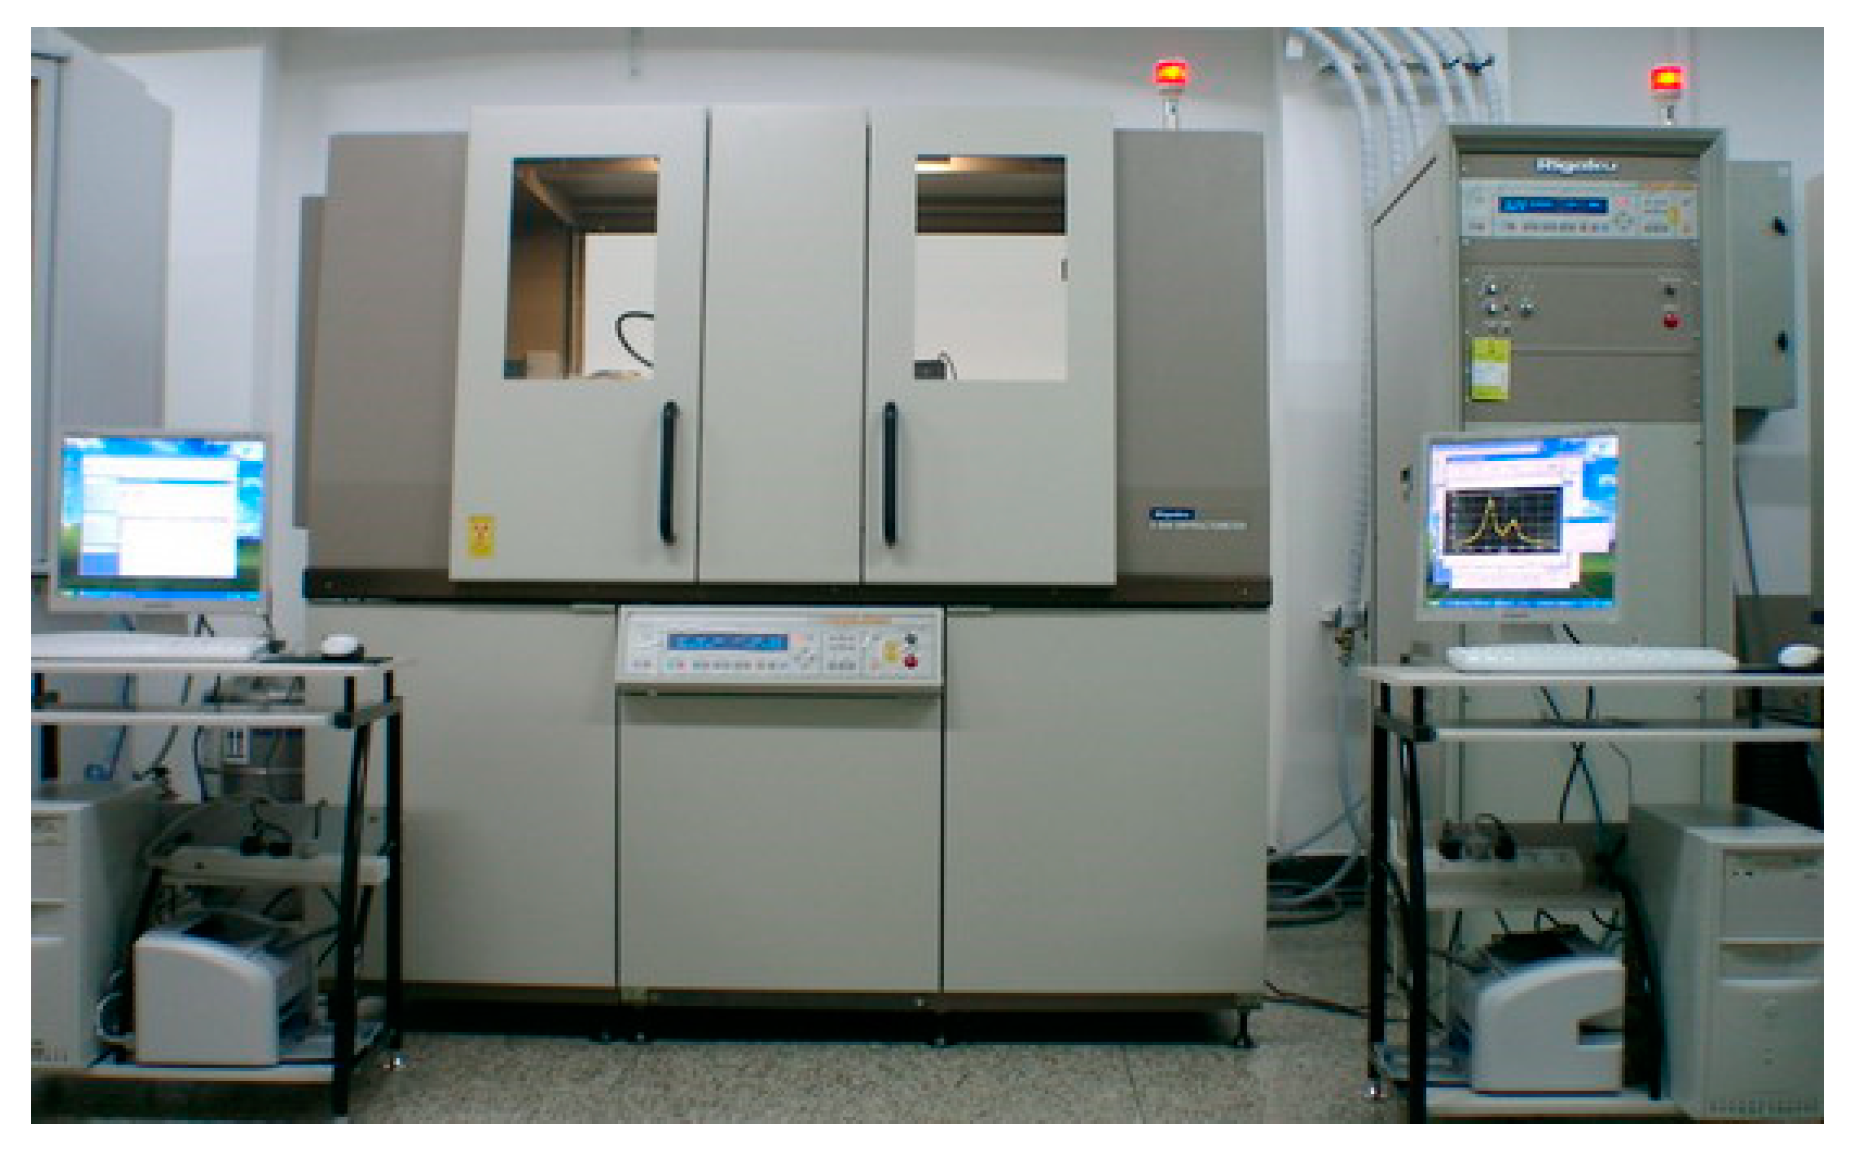
The X-ray diffraction test is a principal method for analyzing the mineral composition of geotechnical materials. The success of a diffraction experiment will often depend on the correct choice of preparation method for the sample being analyzed and for the instrument being used in the analysis. The samples for X-ray diffraction test in this study were prepared strictly in accordance with the methods of the Joint Committee on Powder Diffraction Standards (JCPDS) (e.g., quantitative phase analysis and strength contrast method). Before the formal test, three basic samples were first ground grind separately by the continuous vibration cup mill. The X-ray diffraction equipment used to analyze the primary mineral composition of the weathered granite samples in this research belongs to Scientific Instrument Center of Shanxi University (Model No.: D/MAX2500, shown in Figure 6). According to the methods of the JCPDS, the X-ray diffraction curves (shown in Figure 7) were obtained. A diffraction curves contains three types of useful information: the positions of the diffraction maxima, the peak intensities, and the intensity distribution as a function of diffraction angle.
Test results (Table 1) show that quartz and feldspar (including plagioclase and potash feldspar) were the main mineral components of the soil samples, with contents of 12–77% and 11–36%, respectively. The samples contained a small amount of mica, hematite, and hornblende (1–4%). According to Wang et al. [23], the hornblende and biotite in Mount Yunzhong are blue-green and yellow-brown, respectively. The color of weathered granite is mainly controlled by the content of quartz, feldspar, hornblende, and mica.
3.2. Sieving Test and Specific Gravity Test
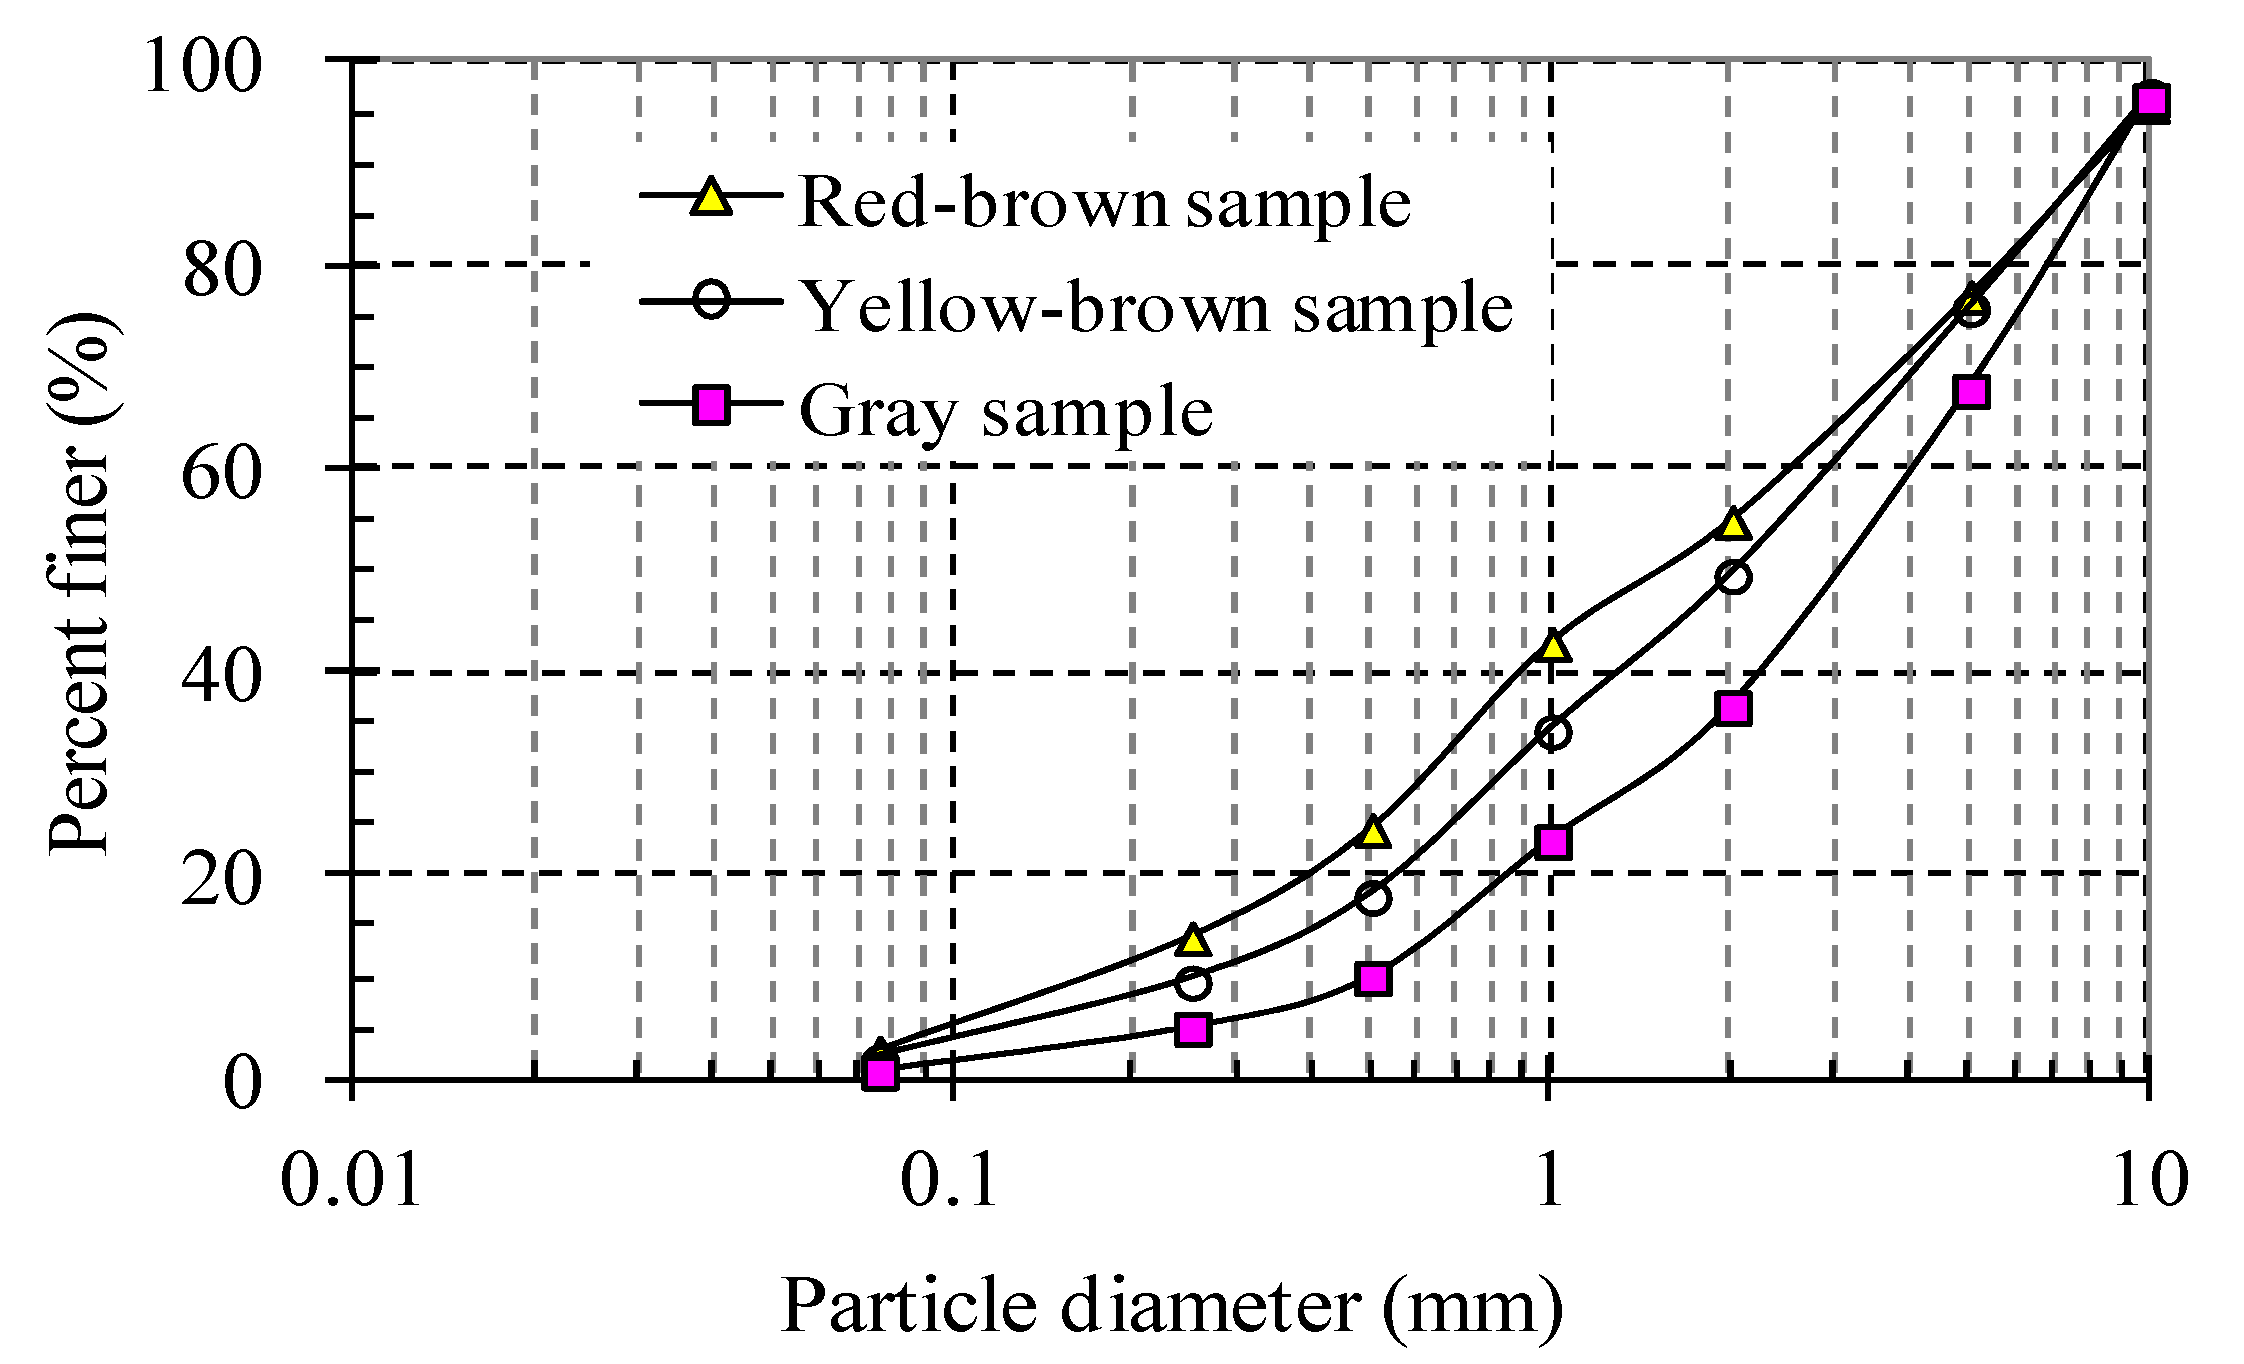
The main purpose of the sieving test is to investigate the change in particle size distribute of weathered granite samples under the action of different weathering process and in particle breakage of weathered granite samples under the action of different factors. The particle distribution curves of typical original samples in this research are shown in Figure 8. The Gravity Bottle Method (T0112-1993, Test Methods of Soils for Highway Engineering) [24] was used to acquire the specific gravities of weathered granite samples. It was found that the specific gravities of red-brown, yellow-brown, and gray granite samples were 2602 g/cm3, 2636 g/cm3, and 2609 g/cm3, respectively.
3.3. Heavy Compaction Test
The heavy compaction test [24] was used to prepare standard samples for investigation of the influence of particle gradation, mineral composition, and stress level on particle breakage of weathered granite. In addition, it was used to study the influence of the compaction effect (compaction degree) on particle breakage.
The apparatus for standard heavy compaction test in this paper was a multifunctional electric compaction instrument (Model No.: TDJ-III). The compaction testes were carried out in accordance with current Chinese code. Parameters of standard heavy compaction test are shown in Table 2. In the later analysis of the effect of blows per layer on particle breakage in Section 4.2.3, except for number of blows per layer, the other parameters are consistent with the standard heavy compaction test in Table 2.
According to the standard heavy compaction method [24], the maximum dry densities of red-brown, yellow-brown, and gray samples were 2.13, 2.25, and 2.18 g/cm3, respectively, and the optimum moisture contents were 6.1%, 6.2%, and 5.9%, respectively. The maximum dry density of finer red-brown and coarser gray soil samples was smaller than that of yellow-brown samples. This is because the compaction of weathered granite is synthetically affected by the particle size distribution of soils, the hardness degree of rocks, and the degree of weathering.
3.4. Large-Scale Triaxial Test
According to T0147-1993 [24], coarse-grained soil samples should not be saturated, consolidated, and drained during the triaxial compression test. However, in actual situations, coarse-grained soil is often consolidated and drained as subgrade filling [25]. In this case, the weathered granite soil samples were tested after consolidation and drainage, which was different from T0147-1993 requirements. With reference to the triaxial shear test in the Code for Coarse-Grained Soil Tests for Hydropower and Water Conservancy Engineering [26], large-scale triaxial shear tests (consolidated drained triaxial test; CD test) were conducted on the red-brown samples of weathered granite soil after consolidation and drainage. Large-scale triaxial Test System Based on Stress Path (YS30-3B), built at Experimental Demonstration Center, Department of Civil Engineering, Shanxi University, was used for CD test in this research, as shown in Figure 9. Using the surface vibration method, the soil specimens were prepared at the optimum water ratio of 6.1% and compactness of 93%. The diameter and height of the specimens was 300 mm and 600 mm, respectively. The specimens were sheared after effective confining pressures of 100, 200, 300, and 400 kPa.
Figure 10 and Figure 11 show the typical stress-strain relationship and εv-ε1 relationship of the CD tests on four representative red-brown weathered granite samples under four confining pressures, where σ1 is the axial stress, σ3 is confining pressure, ε1 is the axial strain, and εv is the volumetric strain.
3.5. Field Compaction Test
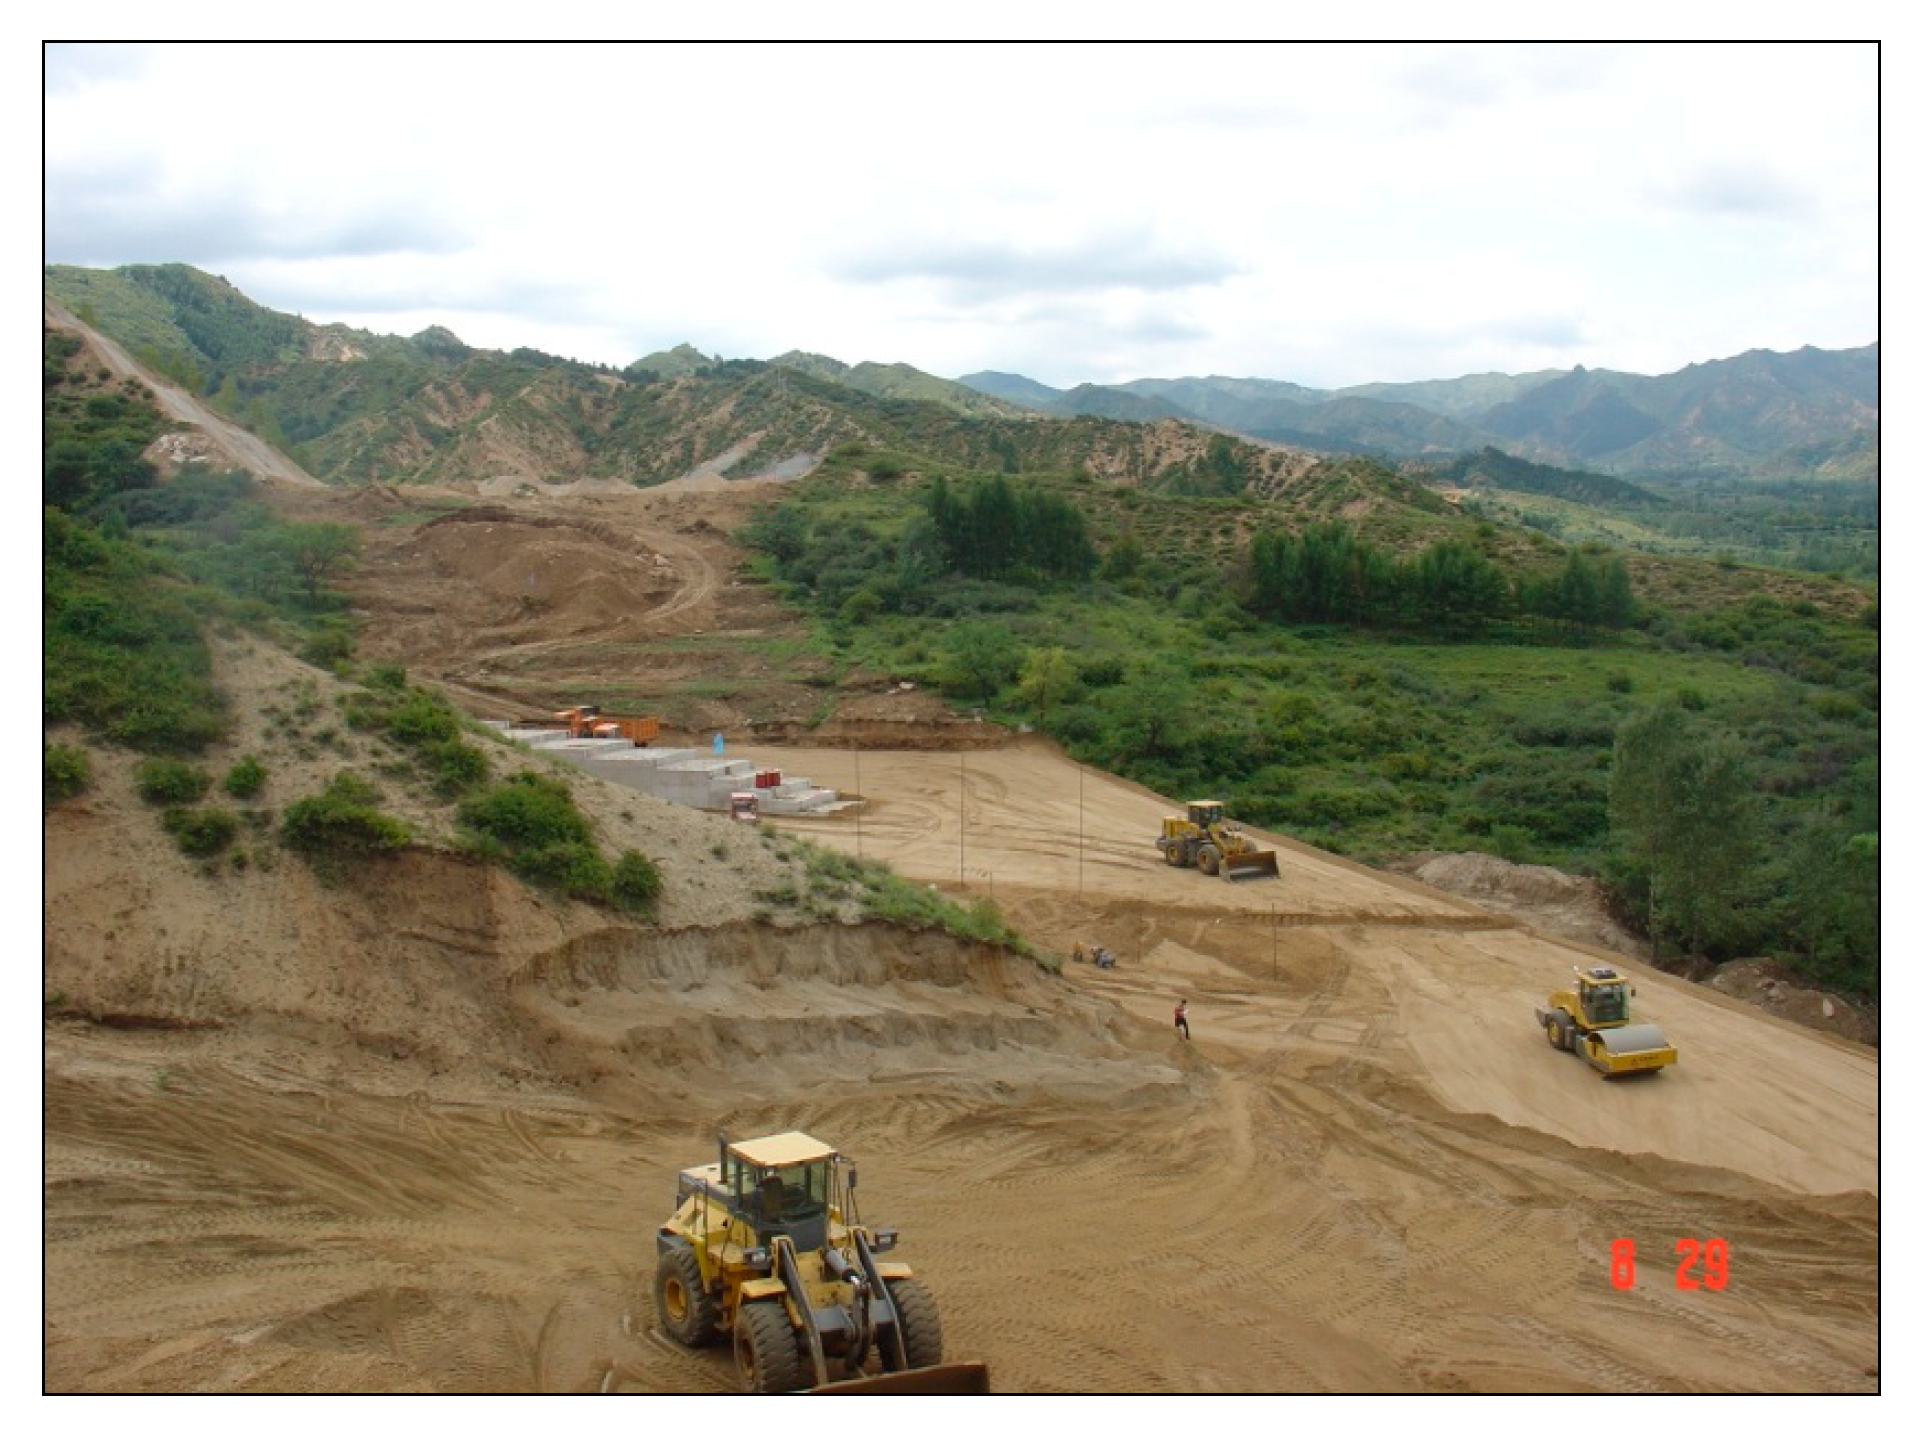
In order to explore the effect of an in situ embankment compaction on particle breakage of weathered granite fillings, a subgrade test section 300 m in length was constructed on the site of the project (shown in Figure 12).
Because the red-brown weathered granite was the most widely distributed in the field, the subgrade test section was filled with red-brown weathered granite. Field compaction tests with different thicknesses of loose paving layer (TLPL) were conducted by using the vibratory roller, a full hydraulic single-drive, single-wheel roller (Model No.: SSR200AC-8). The technical parameters of vibratory roller are shown in Table 3. Before vibration compaction, each loose paving layer must be compacted in static. The number of static rolling passes of each loose paving layer is 2. The static rolling speed was 2 km/h and the vibration rolling speed was 5 km/h.
The relationships among the thicknesses of loose paving layers, the number of rolling passes, and the degree of compaction were examined. The degree of compaction of paving layers was measured by using the method of sand replacement [27].
4. Test Results and Discussion
4.1. Weathering Process
Figure 13 and Figure 14, respectively, show changes of parameters m and r for the samples at different depths of mountain profile, h.
The results of statistical analysis indicate an approximately power function relationship between h and m (or r), and the correlation of relationship was relatively good. The power function relationships in section A are showed as follows:
where h is the depth of granite samples, which was measured from the surface of mount; mA and rA is geological year’s parameter and geometric progression constant in section A, respectively.
The power function relationships in section B are showed as follows:
where mB and rB is geological year’s parameter and geometric progression constant in section B, respectively.
In fact, the geological year’s parameter, m, represents the degree of geological actions (including physical actions and chemical actions). The deeper the granite is buried, the less the geological action will affect it. The above experimental results show that the geological year’s parameter, m, was close to zero at a depth of 20–25 m under the surface of the mount, indicating that the geological action on the granite was negligible at this depth. The geometric progression constant, r, actually reflects the integrality of rock. For the mountains studied in this paper, the geometric progression constant of section A and section B was close to a certain value at a depth of 25 m and 20 m, respectively, indicating that the granite in the mountains studied in this paper was close to the complete unaltered state at a depth of 20–25 m.
The test results show that the m of section A was larger than that of section B at the same depth, which illustrates that the ability of section A to resist geological and climatic environment was worse than that of section B. By contrast, the r of section A was smaller than that of section B at the same depth, which indicates that the integrality of granite in section A was worse than that in section B. Under the same geological and climatic environment, the main reason for the difference in m and r between section A and section B was the difference in internal properties (such as the mineral composition of rocks) between these two sections. In other words, it may be due to the fact that the content of weathering resistant minerals (such as quartz) in Section A are smaller than those in Section B. Of course, some external factors could not be excluded, for example, the probability of fracture distribution of section A is larger than that of Section B.
4.2. Particle Breakage Characteristics
The characteristics of particle breakage of compacted weathered granite are influenced by many aspects, such as particle gradation, mineral composition, blows per layer, stress level, number of rolling passes, etc.
4.2.1. Particle Gradation
Standard heavy compaction tests on eight weathered granite samples with different gradations (four red-brown samples and four gray samples) were carried out under optimum moisture content conditions. Sieving tests were implemented on the samples before and after compaction, and the uniformity coefficient (Cu = d60/d10) and relative breakage (Br) of the samples before and after the compaction test were calculated. The relationship between the uniformity coefficient and the relative breakage is shown in Figure 15. It can be seen from the figure that the relative breakage of the samples decreased with the increase of the uniformity coefficient, indicating that as the uniformity coefficient of weathered granite increased, the degree of particle breakage was reduced because of the enhancement of the intergranular locking effect. When the uniformity coefficient was small, the contact area among particles was smaller, and the stress concentration among particles was easy to be produced in the process of compaction, which leaded to the particle being crushed easily. For the sample with a high uniformity coefficient, due to the good intergranular locking structure and the larger contact area among particles, there was no excessive stress concentration during compaction, and the probability of particle breakage was small because the particles might undergo moved, approached and overturned processes in the process of compaction. In addition, it can be seen that the rate of decrease of relative breakage of the red-brown sample was higher than that of the gray sample, reflecting that because the degree of weathering of red-brown weathered granite is higher than that of gray weathered granite, the strength of the red-brown sample was less than that of the gray sample. This shows that the sensitivity of the red-brown sample to particle heterogeneity was greater than that of the gray sample.
4.2.2. Mineral Content (Quartz and Feldspar)
The red-brown, yellow-brown, and gray weathered granite samples were prepared with approximately the same particle size distribution. Standard heavy compaction tests were performed on the samples under optimum moisture content conditions. The results of sieving before and after the test are shown in Figure 16.
The relationship between relative breakage and quartz (or feldspar) content was analyzed by calculating the relative breakage of different samples before and after the standard compaction test. Figure 17 and Figure 18 show the relationship between relative breakage and quartz (or feldspar) content. It can be seen from the figures that Br decreased with the increase of quartz content, while Br increased with the increase of feldspar (=plagioclase feldspar + potassium feldspar). The results show that quartz and feldspar content have an obvious effect on the particle breakage characteristics of weathered granite.
The main reasons that the Br of samples with high quartz content after compaction test was small are as follows: (1) The probability of breakage of samples with more quartz content is small because quartz has a high strength; (2) samples with high quartz content have strong ability to resist being weathered; and (3) there are few microcracks in samples with high quartz content. On the contrary, feldspar has little strength and is easy being weathered, so the samples with higher feldspar content showed obvious particle breakage characteristics.
The above conclusions were obtained under the same initial gradation. If the initial gradation changes, the increasing or decreasing trend of relative breakage will change.
4.2.3. Blows per Layer (Compaction Degree)
In order to analyze the effect of blows per layer of samples on the particle breakage properties of weathered granite, four red-brown weathered granite samples with the same initial particle size distribution were prepared, and four different heavy compaction tests were conducted, with blows per layer (BPL) of 30, 50, 75, and 98. The sieving results before and after the tests are shown in Figure 19.
As shown in Figure 20, the relative breakage increased with an increase in blows per layer, but the increasing level of relative breakage decreased. Furthermore, with the further increase of blows, Br tended toward a certain limit value. Considering the engineering practice, the compaction degree of samples was analyzed, and the compaction degrees of samples and corresponding relative breakage are depicted in Figure 21. It can be concluded from this figure that there is an approximate linear growth relationship between compaction degree and Br. It can be found that, for the same weathered granite fillings, relative breakage can be used to reflect the compaction performance indirectly on the basis of the relationship between compaction effect and compaction performance. Excessive compaction may lead to excessive particle breakage of soils and is not conducive to the long-term stability of subgrade.
4.2.4. Stress Level
The breakage of soil particles in a sample of rockfill under moderate stress will be quite evident [14]. For the purpose of studying the particle breakage characteristics of compacted weathered granite soil under different stress levels, particle size analysis tests were conducted on the samples before and after consolidated drained large-scale triaxial tests, and the relationship between relative breakage and confining pressure (or stress ratio, q/p) was analyzed.
Because specimens for the triaxial test must be prepared by the vibrating forming method, particles of the specimens may be partially crushed. In order to improve the accuracy of the experiment, two specimens for the large-scale triaxial test under the same confining pressure were artificially prepared with approximately the same particle size distribution before vibrating compaction. One of the samples was sieved after vibrating compaction and before the triaxial test. The results of the sieving test for this sample were used as the initial gradation of the other sample for the triaxial test.
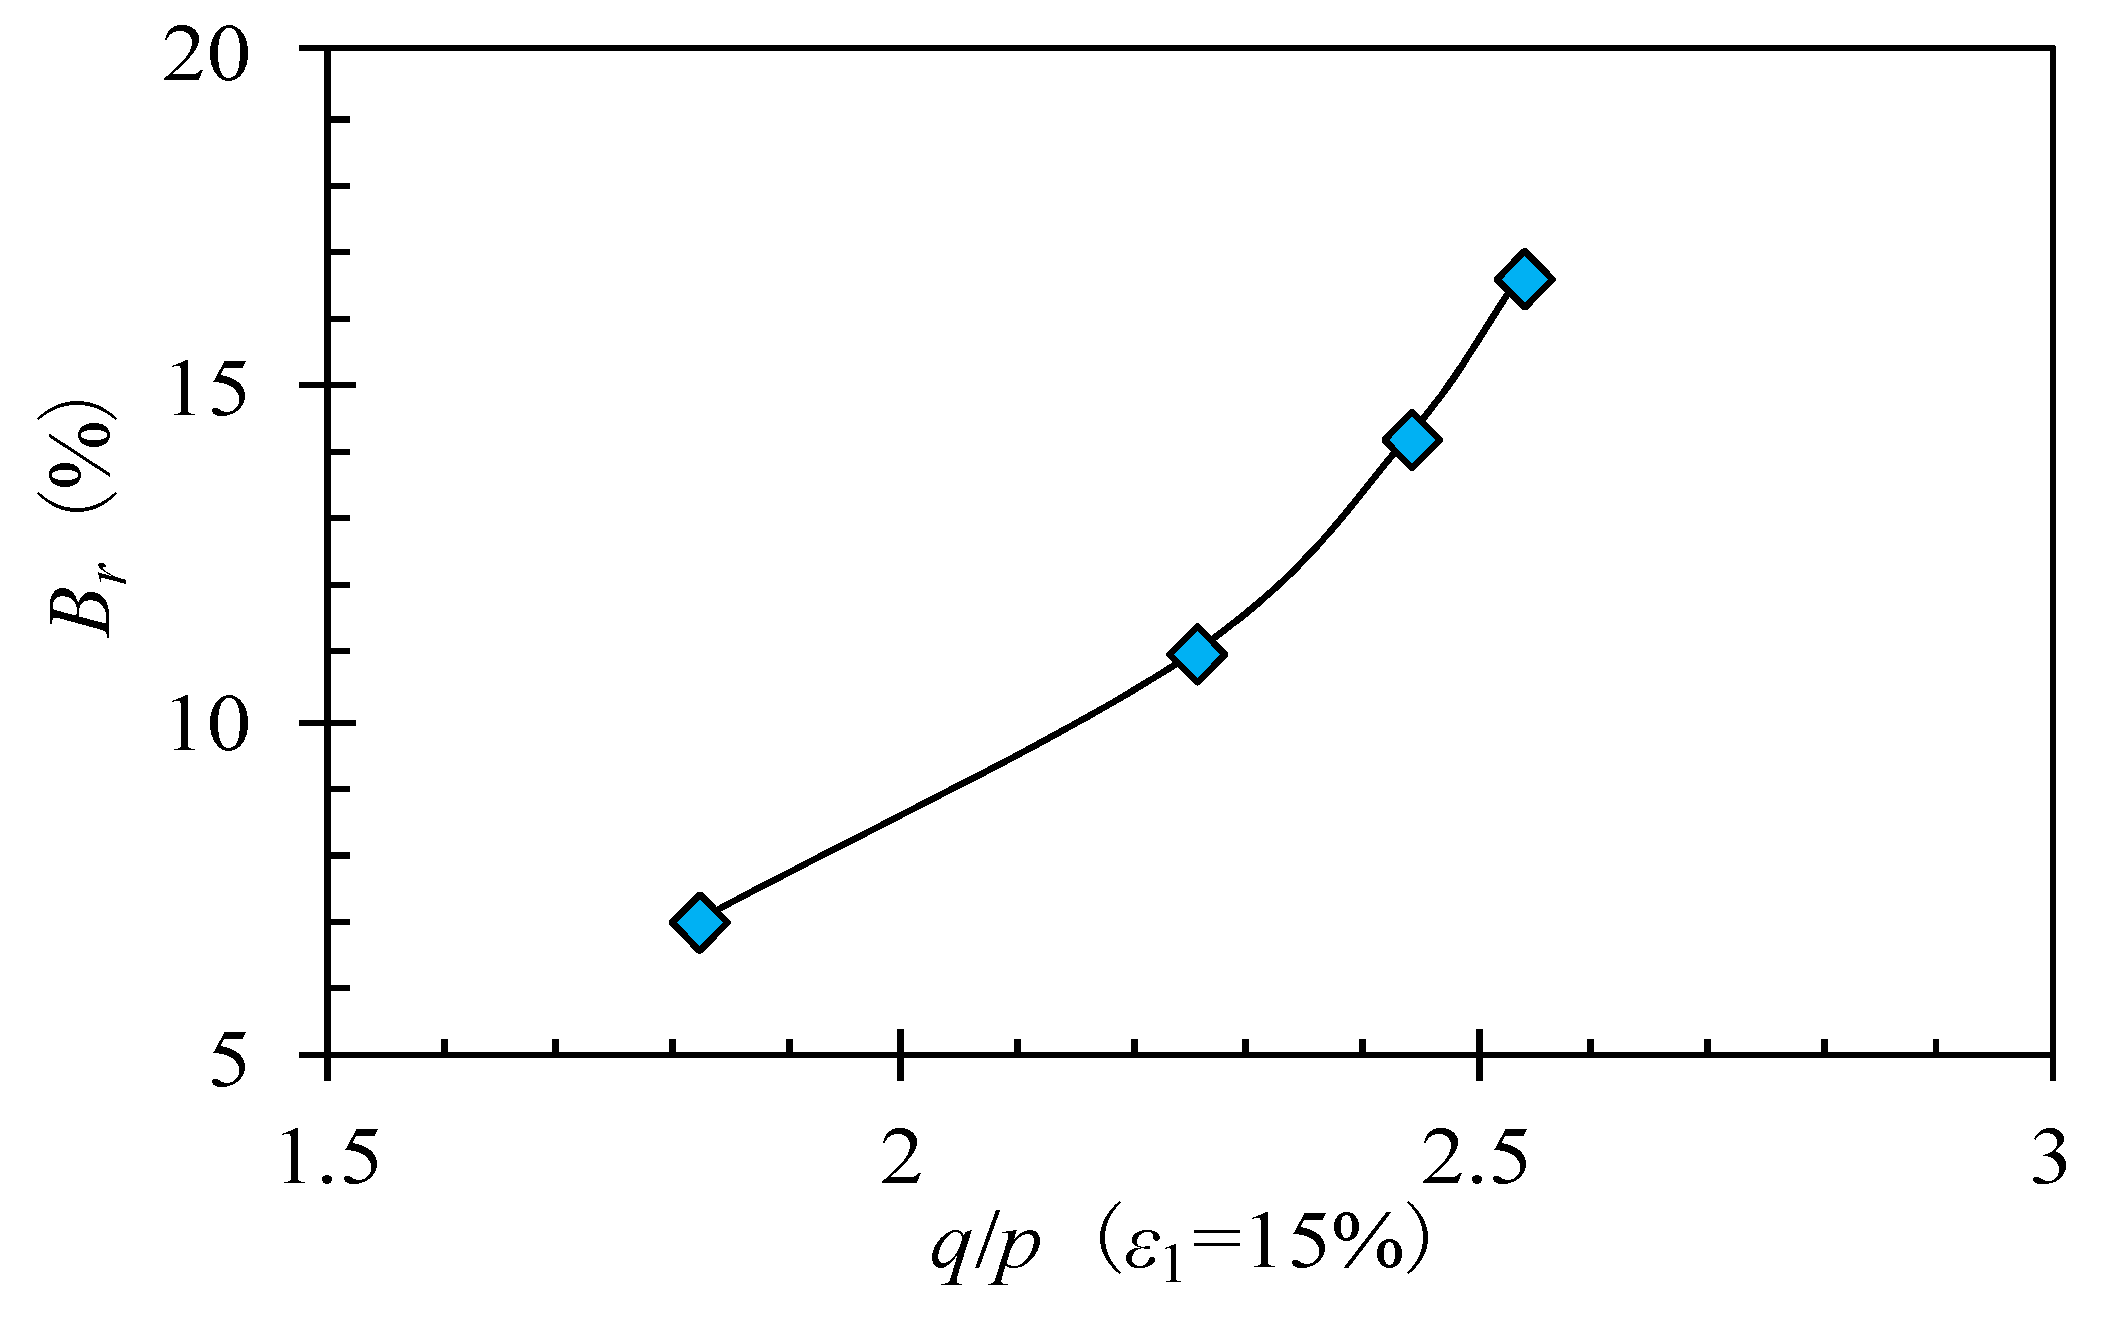
From the stress–strain curve of samples in this study, it can be seen that when the axial strain reached 15%, the residual strength of the specimen under different confining pressures reached its constant value. Therefore, when the axial strain reached 15%, the triaxial tests were forced to stop, and then the sieving tests were performed. Figure 22 and Figure 23, respectively, show variations in relative breakage (Br) with confining pressure (σ3) and stress ratio (q/p).
As indicated in Figure 22, at the end of the triaxial test, the relative breakage of samples increased with the increase of confining pressure, while the increasing amplitude of relative breakage decreased slightly with the increase of confining pressure. It can be considered that the higher confining pressure limited the further compaction and movement of soil particles in soil samples and result in the produce of microcracks and fracture within a single particle. The data in Figure 23 illustrate that at the end of the experiment (ε1 = 15%), both relative breakage Br and the amplitude of Br increased with the increase of the stress ratio q/p. These results indicate that under the same axial strain conditions, more particles were broken due to the increased strain confinement caused by higher confining pressure.
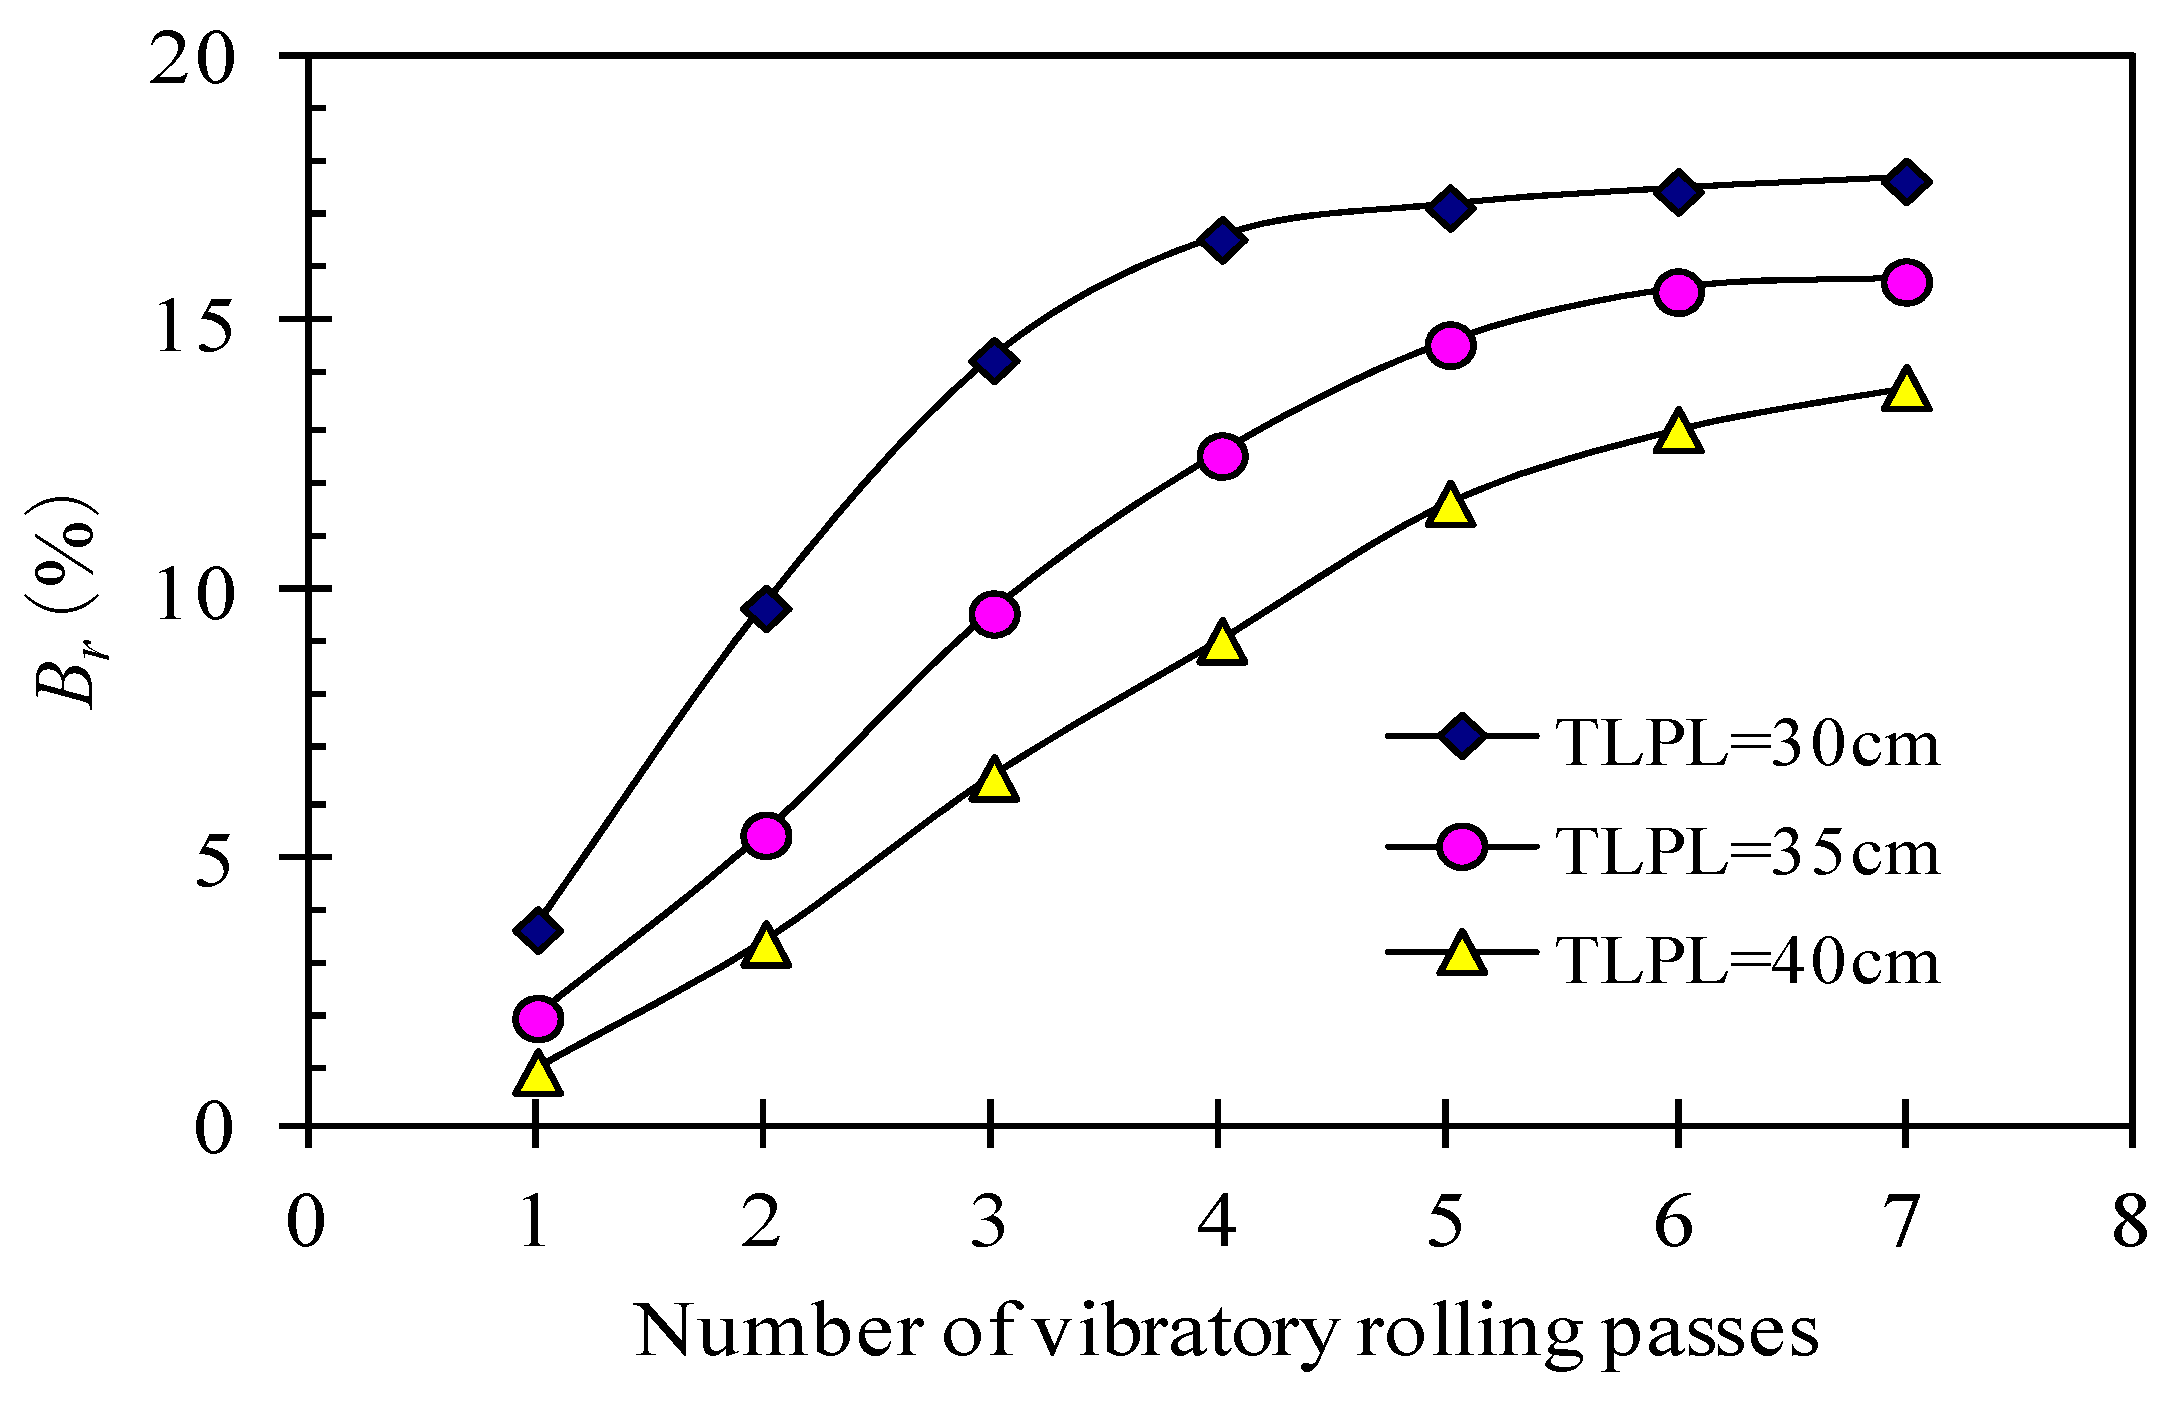
4.2.5. Rolling Passes of Field Vibration Compaction
Figure 24 shows the variations of compaction degree of different paving layer thicknesses with number of rolling passes of vibratory compaction. It can be seen from the graphs that the compaction degree increased with the increased number of rolling passes, but when compaction degree was close to about 97%, the increase slowed down. Especially in the case where the thickness of the loose paving layer was 30 cm, the compaction degree tended to decrease when the number of rolling passes was >5. However, this is not limitless, which indicates that excessive compaction may cause the degree of compaction of the thinner paving layer to decrease. This phenomenon shows that the initial vibration compaction can make the fine particles fill the voids of coarse particles and be further compacted. When the number of rolling passes of vibration compaction exceeds a certain limit, the fine particles will be further increased due to particle breakage. Thus, compacted weathered granite will show partial compaction properties similar to those of eolian sand, which has a decreased degree of compaction when over-compacted [28]. It can also be seen from Figure 24 that the growth rate of the degree of compaction, which increased with the number of rolling passes of vibratory compaction, slowed down with decreased thickness of the loose paving layer. As previously mentioned, in short, the thickness of loose paving layers of weathered granite filling has an obvious influence on the compaction outcome.
In view of the characteristics of particle breakage of strongly weathered granite, the relative breakage Br of strongly weathered granite fillings with different thicknesses of loose paving layer (30 cm, 35 cm, and 40 cm) and numbers of rolling passes of vibration compaction were measured. The results are shown in Figure 25.
Before compaction, three different specimens from the same roller track were selected for the sieving test. After compaction, to determine the degree of compaction of loose paving layers under a certain number of rolling passes, the average of three measurements of degree of compaction near the three points mentioned above in the same roller track was used as the degree of compaction for each number of rolling passes. The average value of relative breakage of the three points where degree of compaction was tested was calculated through sieving tests as the relative breaking Br under each number of rolling passes.
As can be seen from Figure 25, with the increased number of rolling passes of vibratory compaction, the relative breakage of a given thickness of loose paving layer tended to a certain value. When the number of rolling passes was 7, the relative breakage of loose paving layers 30 cm, 35 cm, and 40 cm thick was 17.6%, 15.8%, and 13.8%, respectively. This shows that the relative breakage decreased with increased loose paving thickness. For the loose paving layer 30 cm thick, the increasing range of Br tended to decrease when the number of rolling passes of vibratory compaction was >4. For the loose paving layer 35 cm thick, the relative breakage began to increase by a small margin when the number of rolling passes was 5, and for the loose paving layer 40 cm thick, it was 7. It can be deduced that the number of rolling passes in the situation where the increasing trend began to slow down decreased with increased loose paving layer thickness.
5. Conclusions
The weathering process of in-situ granite and the particle breakage characteristics of compacted weathered granite were investigated with a series of laboratory and field tests: X-ray diffraction, sieving, heavy compaction, large-scale triaxial, and field compaction tests. In view of the aforementioned results, the following conclusions can be summarized:
- A preliminary relationship between weathering process parameters (m and r) and burying depth (h) is established to improve the understanding of weathering process and degree of rock by using previous grading equation. With an increase in burying depth of weathered granite, the geological year’s parameter (m) decrease by power function, but the geometric progression constants (r) increase by power function. The exponent of power function in this research can be used to evaluate the weathering process of weathered granite.
- After the heavy compaction test for samples with difference Cu were carried out, The uniformity coefficient Cu can be used to effectively reflect the influence of particle size distribution on soil particle breakage characteristics. The reasonable particle size distribution (e.g., intergranular locking structure) can reduce the potential of particle breakage of coarse-grained soil similar to weathered granite and improve the stability of subgrade filled with coarse-grained soil.
- Because different minerals have different strength and hardness, the mineral composition and content in weathered granite have a significant effect on the particle breakage characteristics of compacted weathered granite. This provides a relatively reliable reference for selecting high-strength and durable subgrade fillings.
- The compaction effect during embankment compaction has a significant effect on the particle breakage properties of weathered granite. With the further increase of compaction effect, Br will tend toward a certain limit value.
- At the lower stress level, the compacted weathered granite shows obvious particle breakage characteristics. There is a significant positive correlation between stress level and particle breakage. Under the same axial strain (e.g., 15%), the higher confining pressure promotes strain confinement and results in further particle breakage of compacted rock samples.
- The thickness of loose paving layers and the number of rolling passes obviously affect the particle breakage characteristics of weathered granite fillings. Excessive compaction may lead to a slight decrease in the degree of compaction of embankment, which road engineers should pay attention to. Before the subgrade is formally filled with weathered granite, the subgrade test section should be paved in order to determine the best mechanical assembly, reasonable construction technology, and reliable quality-control measures, and to prevent over-compaction from a decrease in the degree of compaction, affecting the overall stability of the subgrade.
- Given that wet conditions may influence the evolution of embankments after construction, future extensive research should be focused on dynamic measurement methods of particle breakage and long-term behavior degradation analysis of subgrade as a result of further weathering and particle breakage [29,30,31]. Analyzing the weathering mechanism and particle breakage characteristics of rock by using fracture mechanics is still a challenging task, so researchers and engineers should pay more attention to the weathering mechanism of granite by means of fracture mechanics and micromechanics and evaluate the stability and safety of the subgrade filled with weathered granite by using safe rock theory in the future.
Author Contributions
X.N. and Y.Y. conceived and designed the experimental scheme and writing structure of this paper. The all lab experiments in this research were performed by X.N. and Z.L. X.N. wrote this manuscript. Y.S. was responsible for the English polish and proofreading of this manuscript.
Funding
This research was funded by the Shanxi Province Natural Science Foundation (201701D121068), the Research Plan of Shanxi Province Department of Transportation in China (2016-1-7), the China Postdoctoral Science Foundation (2016M591044), the National Basic Research Program of China (973 Program, 2014CB047001), and Student Research Training Program of Shanxi University (2018016536).
Acknowledgments
All the supports are gratefully acknowledged. The authors thank all the engineers for their support and help in the field compaction test on the Xinbao Highway Project.
Conflicts of Interest
The authors declare no conflicts of interest.
Abbreviations
The following symbols are used in this paper:
| Bp | breakage potential |
| Br | relative breakage |
| Bt | total breakage |
| Cu | uniformity coefficient that is (d60/d10) |
| D | particle diameter |
| Dmax | maximum grain size |
| Dn | particle size |
| bp | potential for breakage of given size fraction |
| bpl | value of bp after loading |
| bpo | value of bp before loading |
| d10 | 10 percent diameter |
| d60 | 60 percent diameter |
| h | depth of mountain profile |
| m | geological year’s parameter |
| n | ordinal number of a series of sieves with sieve ratio λ (counted from maximum opening side) |
| p | mean stress |
| pn | value of percent passing |
| q | deviator stress that is (σ1–σ3) |
| qn | value of percent retained |
| r | geometric progression constant |
| y0 | geological time unit |
| ε1 | axial strain |
| εv | volumetric strain |
| λ | sieve ratio |
| σ1 | maximum principal stress that is the axial stress in triaxial tests |
| σ3 | minimum principal stress that is the confining stress |
| σ2 | variance |
References
- Fukumoto, T. A grading equation for decomposed granite soil. Soils Found. 1990, 30, 27–34. [Google Scholar] [CrossRef]
- Miura, N.; Murata, H.; Yasufuku, N. Stress-strain characteristic of sand in a particle-crushing region. Soils Found. 1984, 24, 77–89. [Google Scholar] [CrossRef]
- Saberi, M.; Annan, C.D.; Konrad, J.M. Constitutive modeling of gravelly soil-structure interface considering particle breakage. J. Eng. Mech. 2017, 143, 04017044. [Google Scholar] [CrossRef]
- Niu, X.R.; Yao, Y.P.; Chen, Z.D. The strength and constitutive model of compacted weathered granite soils in Lüliang Mountains. Rock Soil Mech. 2017, 38, 2833–2840, 2846. [Google Scholar] [CrossRef]
- Yu, F. Particle breakage and the drained shear behavior of sands. Int. J. Geomech. 2017, 17, 04017041. [Google Scholar] [CrossRef]
- Terzaghi, K.; Peck, R.B. Soil Mechanics in Engineering Practice; Wiley: New York, NY, USA, 1948. [Google Scholar]
- Leslie, D.D. Large scale triaxial tests on gravelly soils. In Proceedings of the 2nd Pan-American Conference on Soil Mechanics and Foundation Engineering, Rio de Janeiro, Brazil, 16–24 July 1963; Associacao Brasileira de Mecanica dos Solos: São Paulo, Brazil, 1963; Volume 1, pp. 181–202. [Google Scholar]
- Leslie, D.D. Shear Strength of Rockfill, Physical Properties. Engineering Study No. 526; South Pacific Division, Corps of Engineers Laboratory: Sausalito, CA, USA, 1975; p. 124. [Google Scholar]
- Marsal, R.J. Discussion of Shear Strength. In Proceedings of the 6th International Conference on Soil Mechanics and Foundation Engineering, Montreal, QC, Canada, 8–15 September 1963; Volume 3, pp. 310–316. [Google Scholar]
- Marsal, R.J. Large scale testing of rockfill materials. J. Soil Mech. Found. Div. 1967, 93, 27–43. [Google Scholar]
- Lee, K.L.; Farhoomand, I. Compressibility and crushing of granular soils in anisotropic triaxial compression. Can. Geotech. J. 1967, 4, 68–86. [Google Scholar] [CrossRef]
- Fukumoto, T. Effect of particle breakage on compaction of decomposed granite soils. Soils Found. 1972, 12, 55–63. [Google Scholar] [CrossRef]
- Miura, N.; O-Hara, S. Particle-Crushing of a Decomposed Granite Soil under Shear Stresses. Soils Found. 1979, 19, 1–14. [Google Scholar] [CrossRef]
- Hardin, B.O. Crushing of Soil Particles. J. Geotech. Eng. 1985, 111, 1177–1192. [Google Scholar] [CrossRef]
- Einav, I. Breakage mechanics-Part I: Theory. J. Mech. Phys. Solids 2007, 55, 1274–1297. [Google Scholar] [CrossRef]
- Zhang, S.; Tong, C.X.; Li, X.; Sheng, D.C. A new method for studying the evolution of particle breakage. Géotechnique 2015, 65, 911–922. [Google Scholar] [CrossRef]
- Liu, H.L.; Sun, Y.F.; Yang, G.; Chen, Y.M. A review of particle breakage characteristics of coarse aggregates. J. Hohai Univ. 2012, 40, 361–369. [Google Scholar] [CrossRef]
- Miura, N.; Yamanouchi, T. Particle-crushing properties of sands under high stresses. Technol. Rep. Ymaguchi Univ. 1976, 1, 439–447. [Google Scholar]
- Hagerty, M.M. One-dimensional high-pressure compression of granular media. J. Geotech. Eng. 1993, 119, 1–18. [Google Scholar] [CrossRef]
- Mun, W.; McCartney, J.S. Roles of particle breakage and drainage in the isotropic compression of sand to high pressures. J. Geotech. Geoenviron. Eng. 2017, 143, 04017071-1–04017071-14. [Google Scholar] [CrossRef]
- De Bono, J.P.; Mcdowell, G.R. On the micro mechanics of yielding and hardening of crushable granular soils. Comput. Geotech. 2018, 97, 167–188. [Google Scholar] [CrossRef]
- Liu, M.C.; Gao, Y.F. Constitutive modeling of coarse-grained materials incorporating the effect of particle breakage on critical state behavior in a framework of generalized plasticity. Int. J. Geomech. 2017, 17, 04016113. [Google Scholar] [CrossRef]
- Wang, H.C.; Kang, J.L.; Xiao, Z.B.; Xiang, Z.Q.; Li, J.R.; Sun, Y.W.; Shi, J.R.; Zhang, J.H. Neoarchean subduction in North China Craton: New evidence from the metamorphic high-Mg igneous assemblage in Yunzhognshan area, Shanxi Province. Acta Petrol. Sin. 2018, 34, 1099–1118. [Google Scholar]
- Ministry of Transport of the People’s Republic of China. JTG E40-2007 Test Methods of Soils for Highway Engineering; China Communications Press: Beijing, China, 2007.
- Schofield, A.N. Disturbed Soil Properties and Geotechnical Design; Thomas Telford: London, UK, 2006. [Google Scholar]
- China Electricity Council. DL/T 5356-2006 Code for Coarse-Grained Soil Tests for Hydropower and Water Conservancy Engineering; China Electric Power Press: Beijing, China, 2006. [Google Scholar]
- Ministry of Transport of the People’s Republic of China. JTG E60-2008 Field Test Methods of Subgrade and Pavement for Highway Engineering; China Communications Press: Beijing, China, 2008.
- Yang, R.F.; Zeng, J.Y.; Dong, L. Compacting mechanism and features of aeolian sands. J. Chang’an Univ. (Nat. Sci. Ed.) 2011, 31, 21–22. [Google Scholar]
- Wang, W.; Coop, M.R. An investigation of breakage behaviour of single sand particles using a high-speed microscope camera. Géotechnique 2016, 66, 1–15. [Google Scholar] [CrossRef] [Green Version]
- Niu, X.; Xie, H.; Sun, Y.; Yao, Y. Basic physical properties and mechanical behavior of compacted weathered granite soils. Int. J. Geomech. 2017, 17, 04017082. [Google Scholar] [CrossRef]
- Konrad, J.M.; Salami, Y. Particle breakage in granular materials—A conceptual framework. Can. Geotech. J. 2018, 55, 710–719. [Google Scholar] [CrossRef]
Figure 1.
Fitting of Fukumoto’s grading equation.
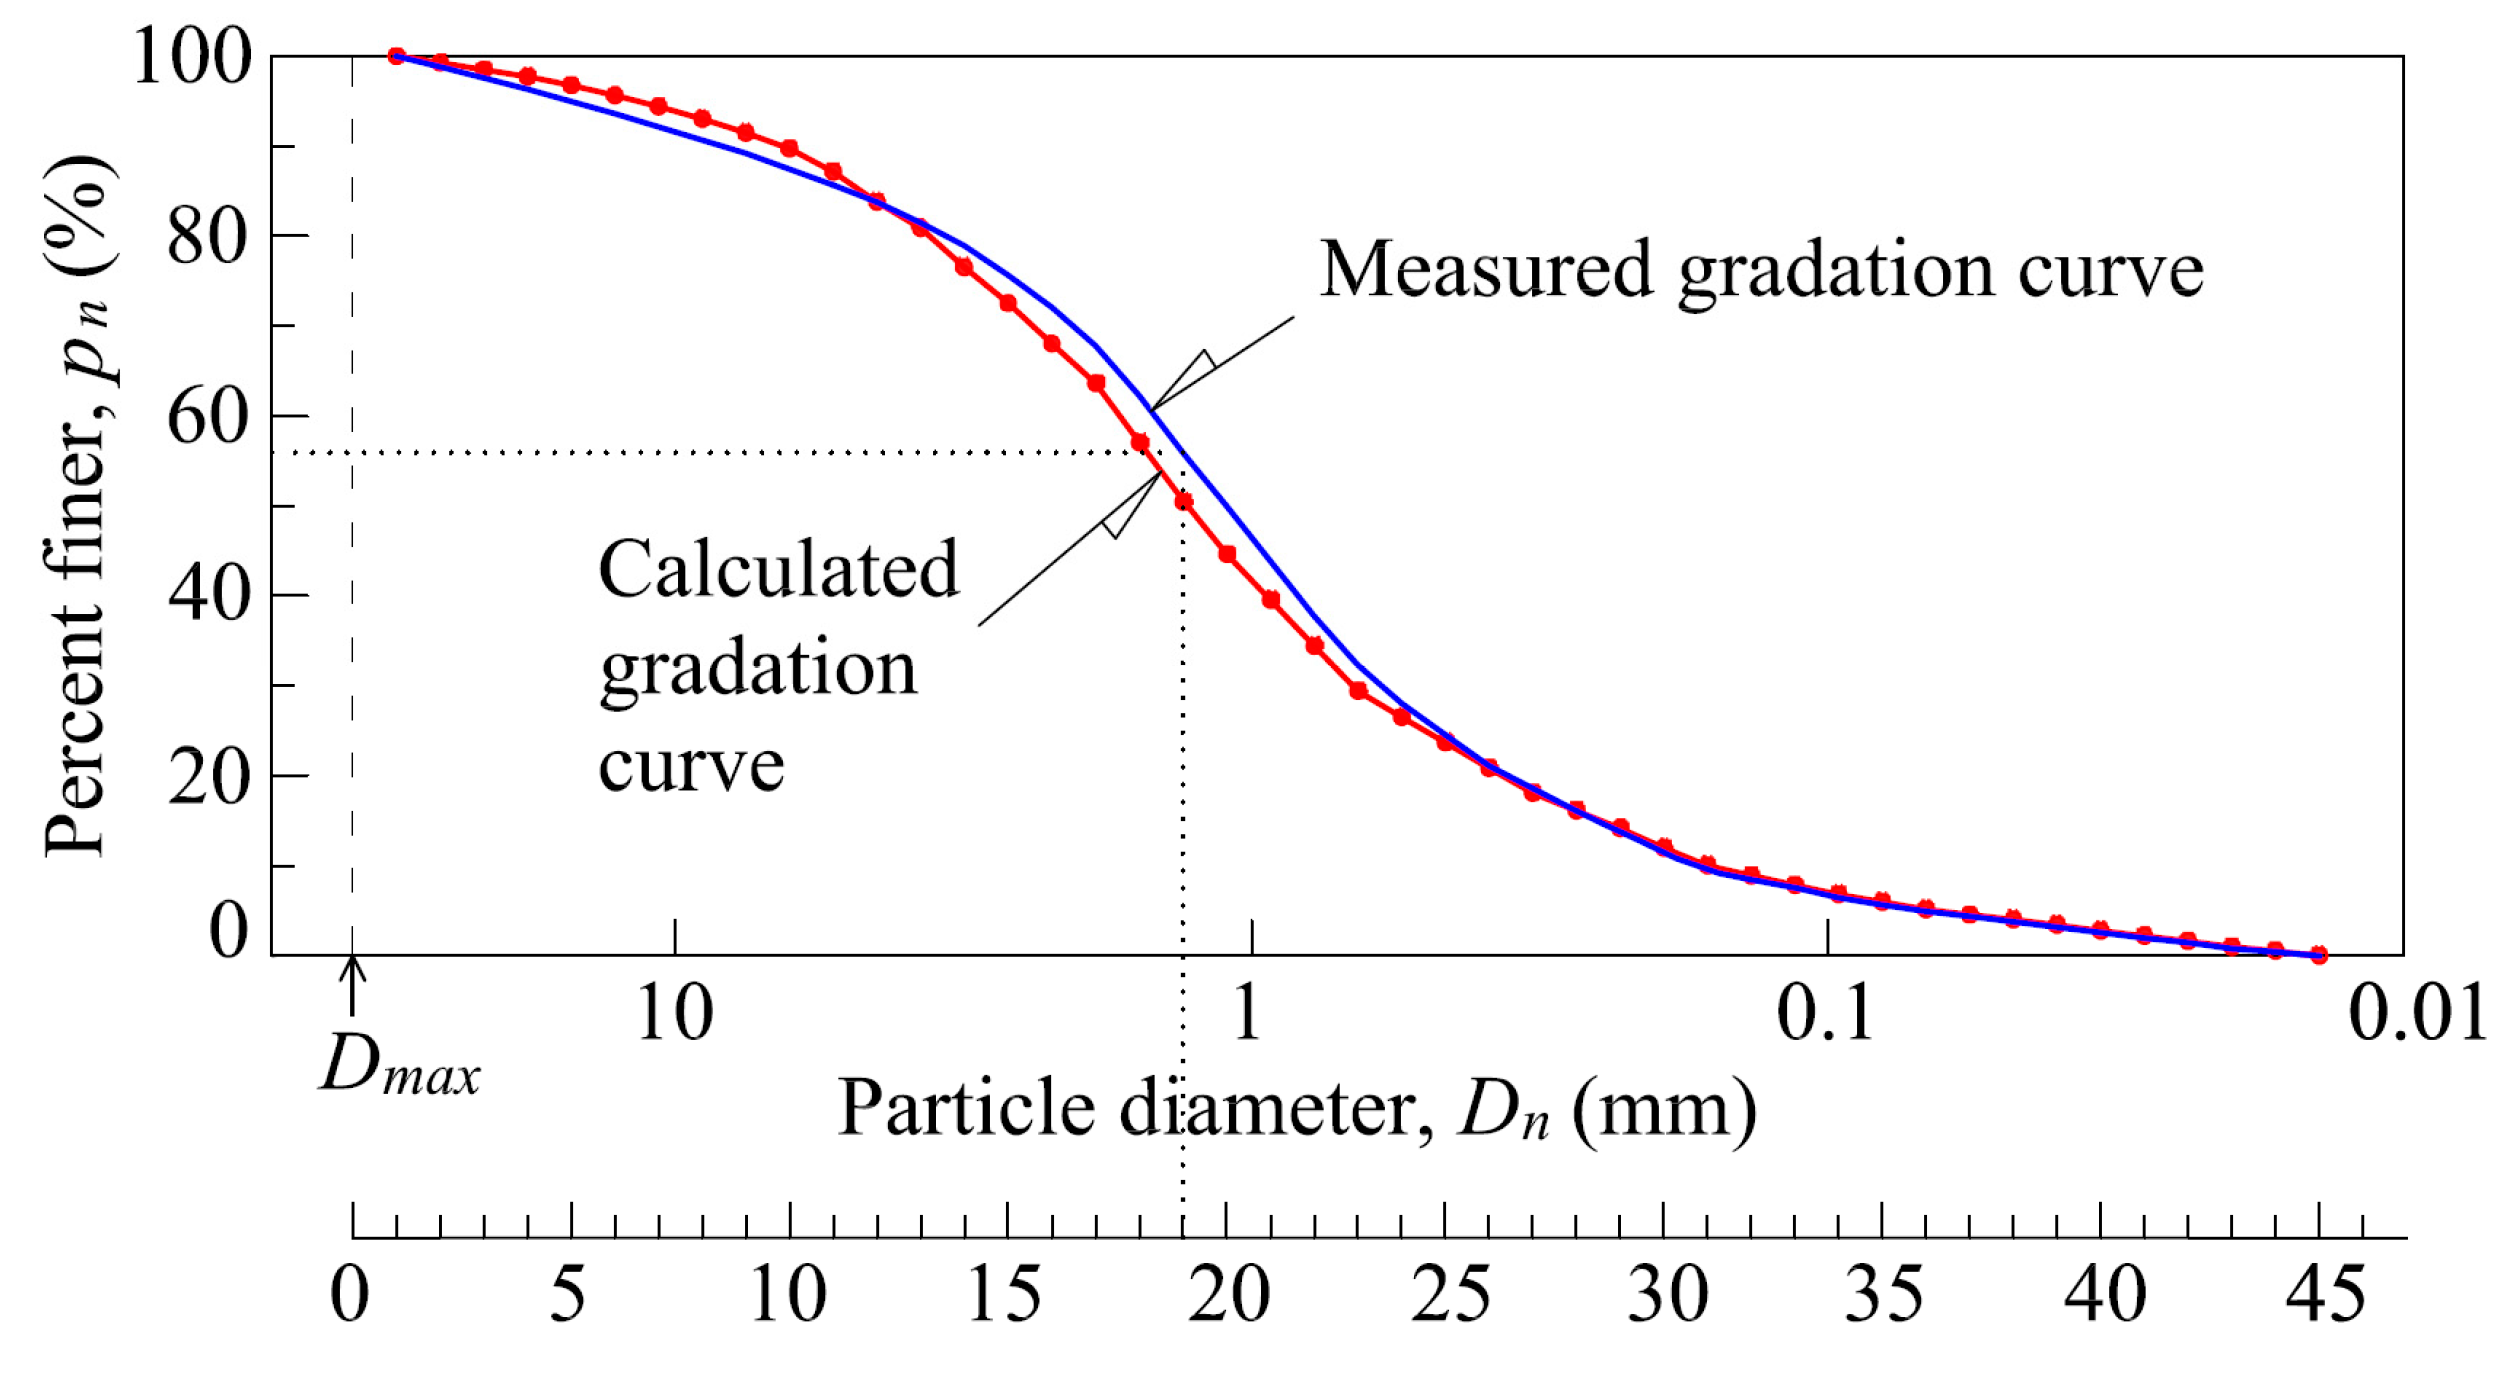
Figure 2.
Definition of Hardin’s breakage potential [14].
Figure 2.
Definition of Hardin’s breakage potential [14].

Figure 3.
Definition of Hardin’s total breakage [14].
Figure 3.
Definition of Hardin’s total breakage [14].
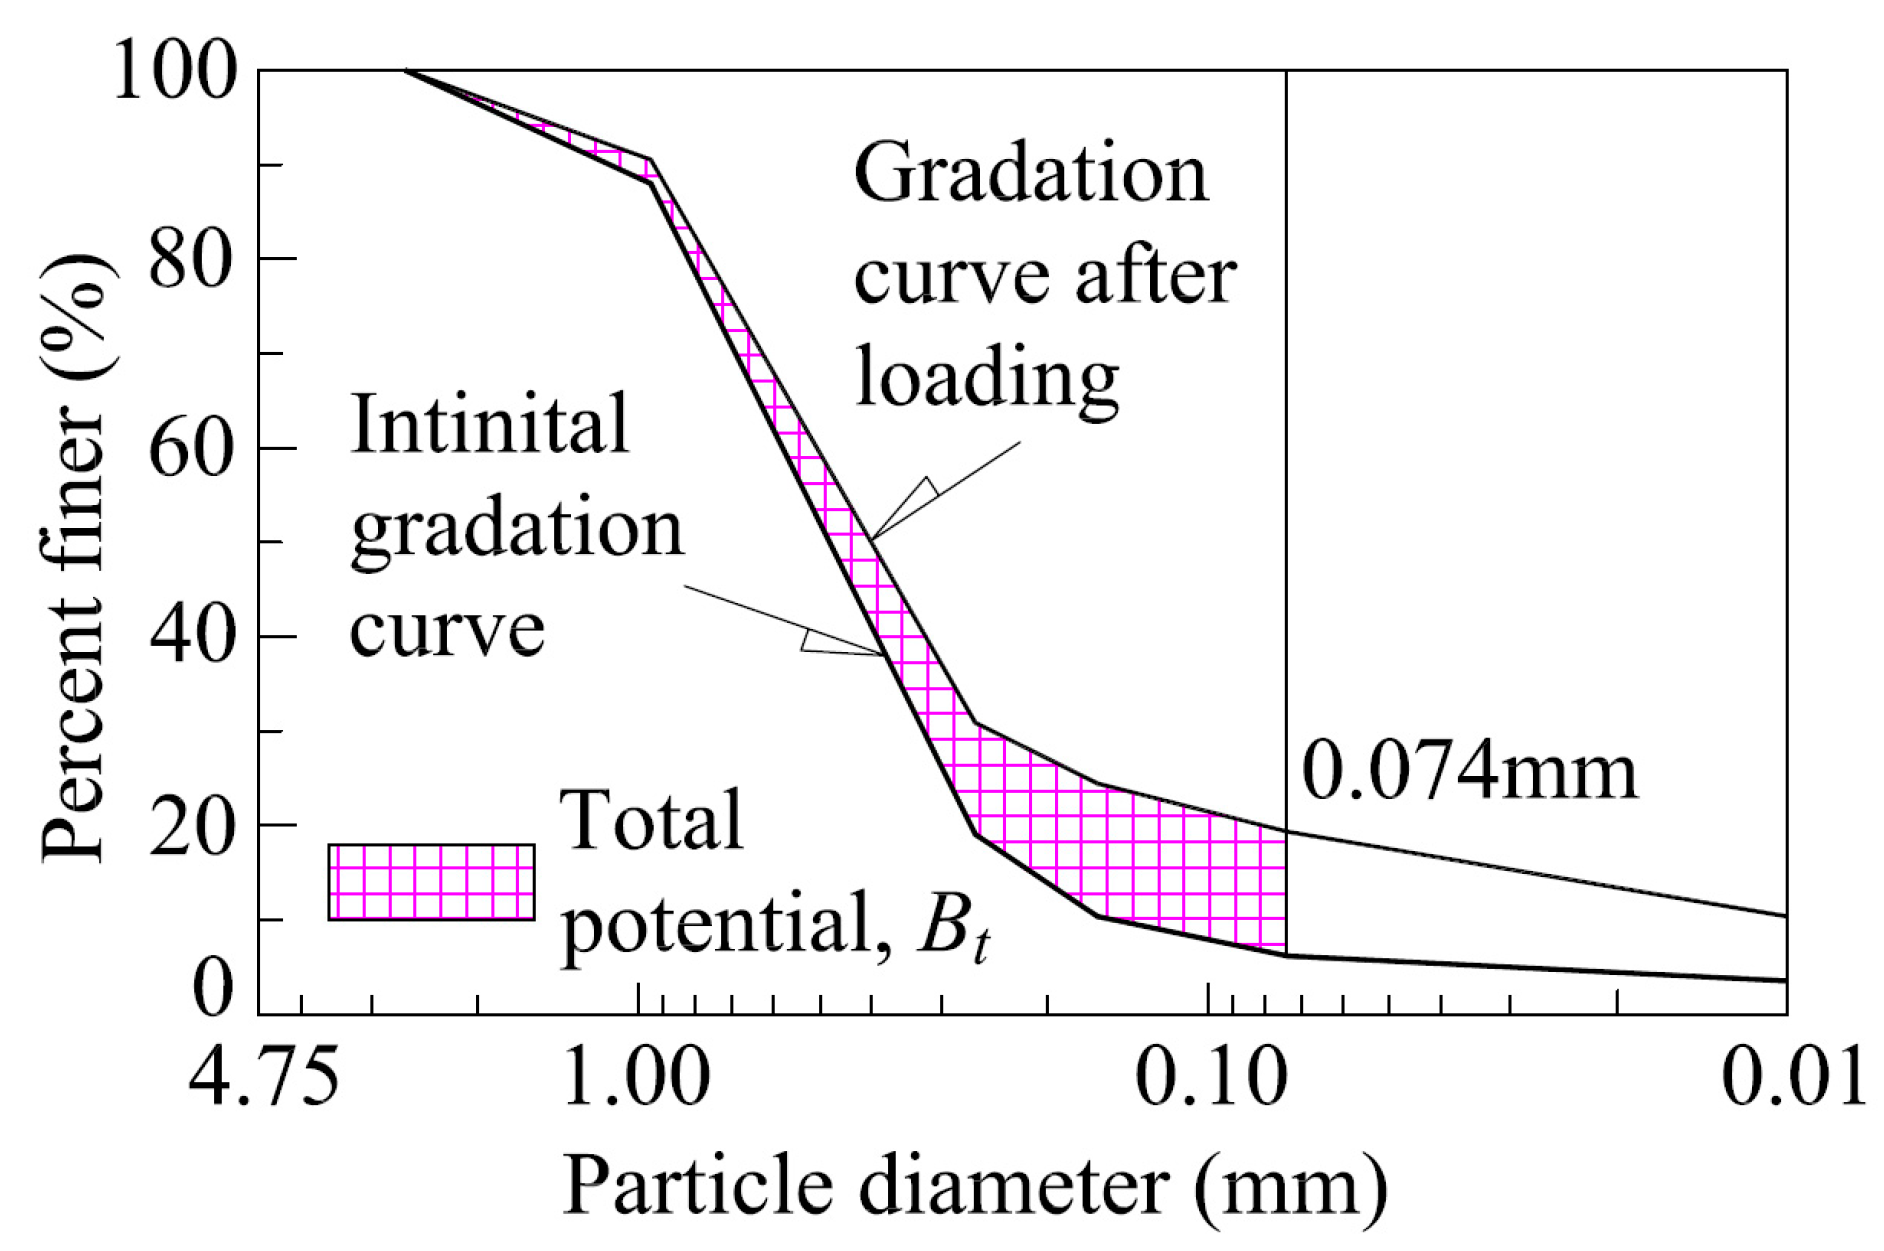
Figure 4.
Photograph of field sampling: (a) section A; (b) section B.

Figure 5.
Photograph of weathered granite samples.

Figure 6.
Photograph of X-ray diffraction equipment.

Figure 7.
The curves of the X-ray diffraction test: (a) Gray sample; (b) yellow-brown sample; (c) red-brown sample.
Figure 7.
The curves of the X-ray diffraction test: (a) Gray sample; (b) yellow-brown sample; (c) red-brown sample.

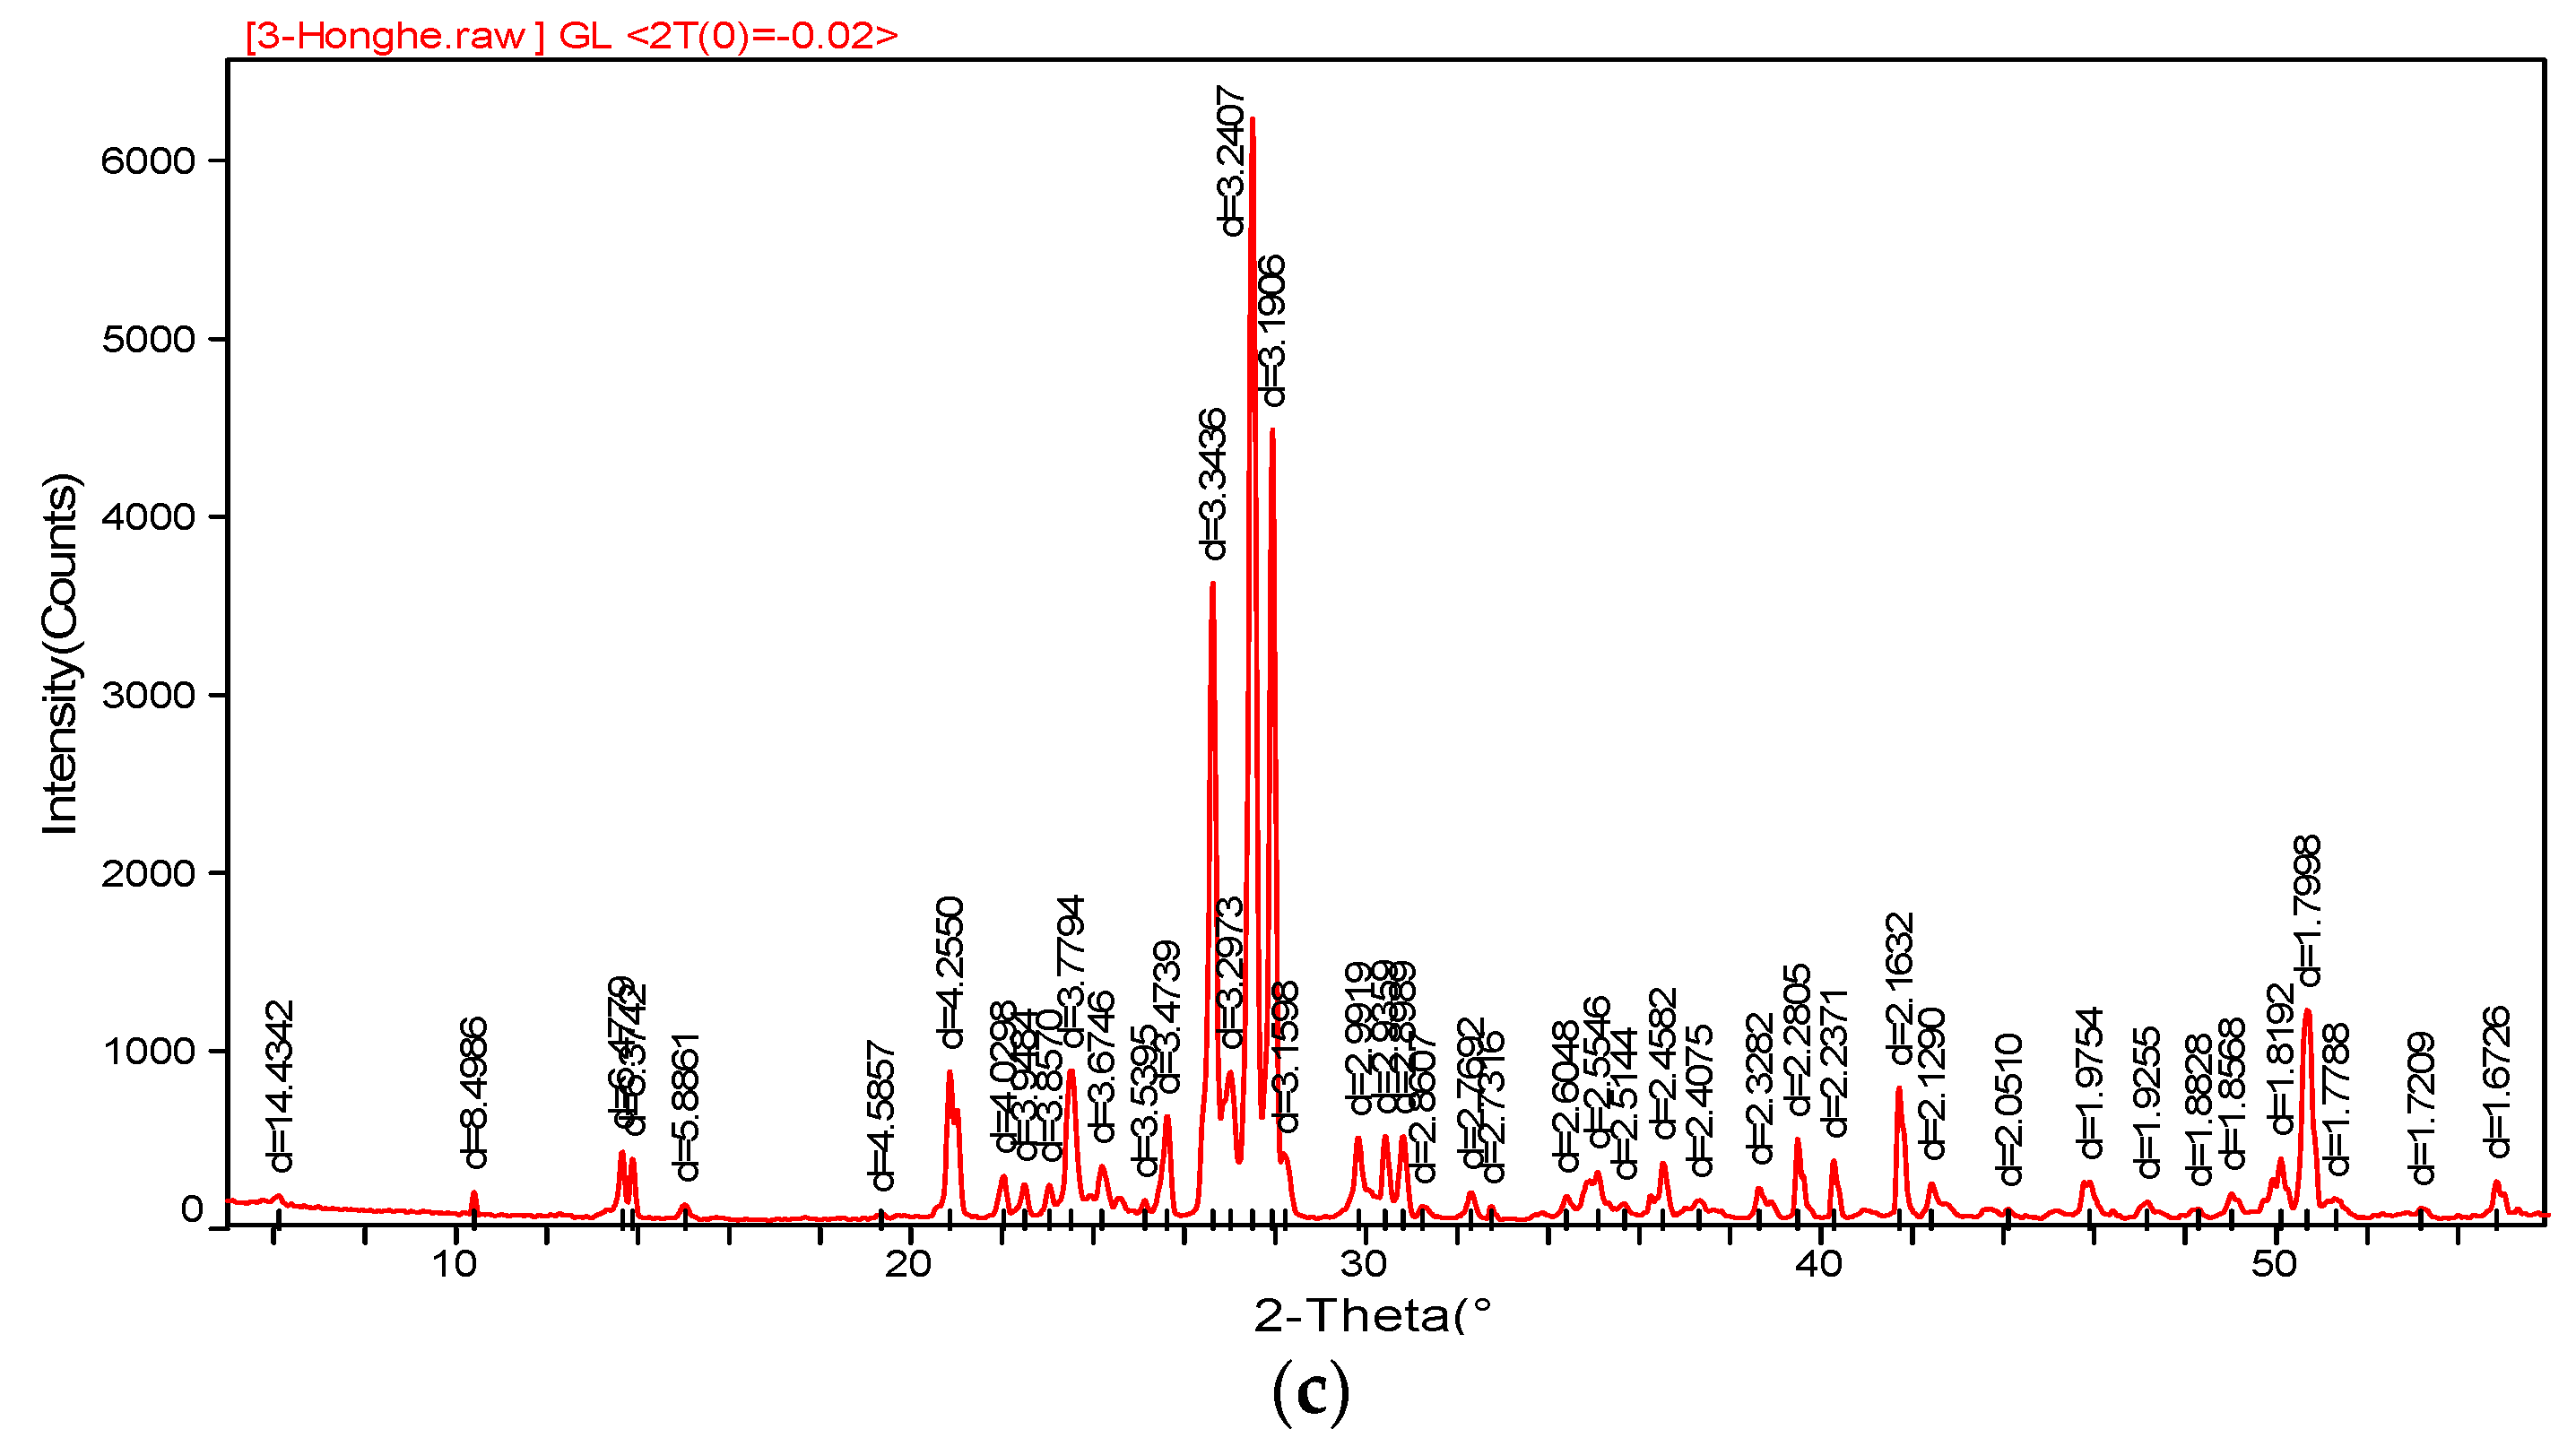
Figure 8.
Sieving curves of typical samples.

Figure 9.
Large-scale triaxial shear apparatus.
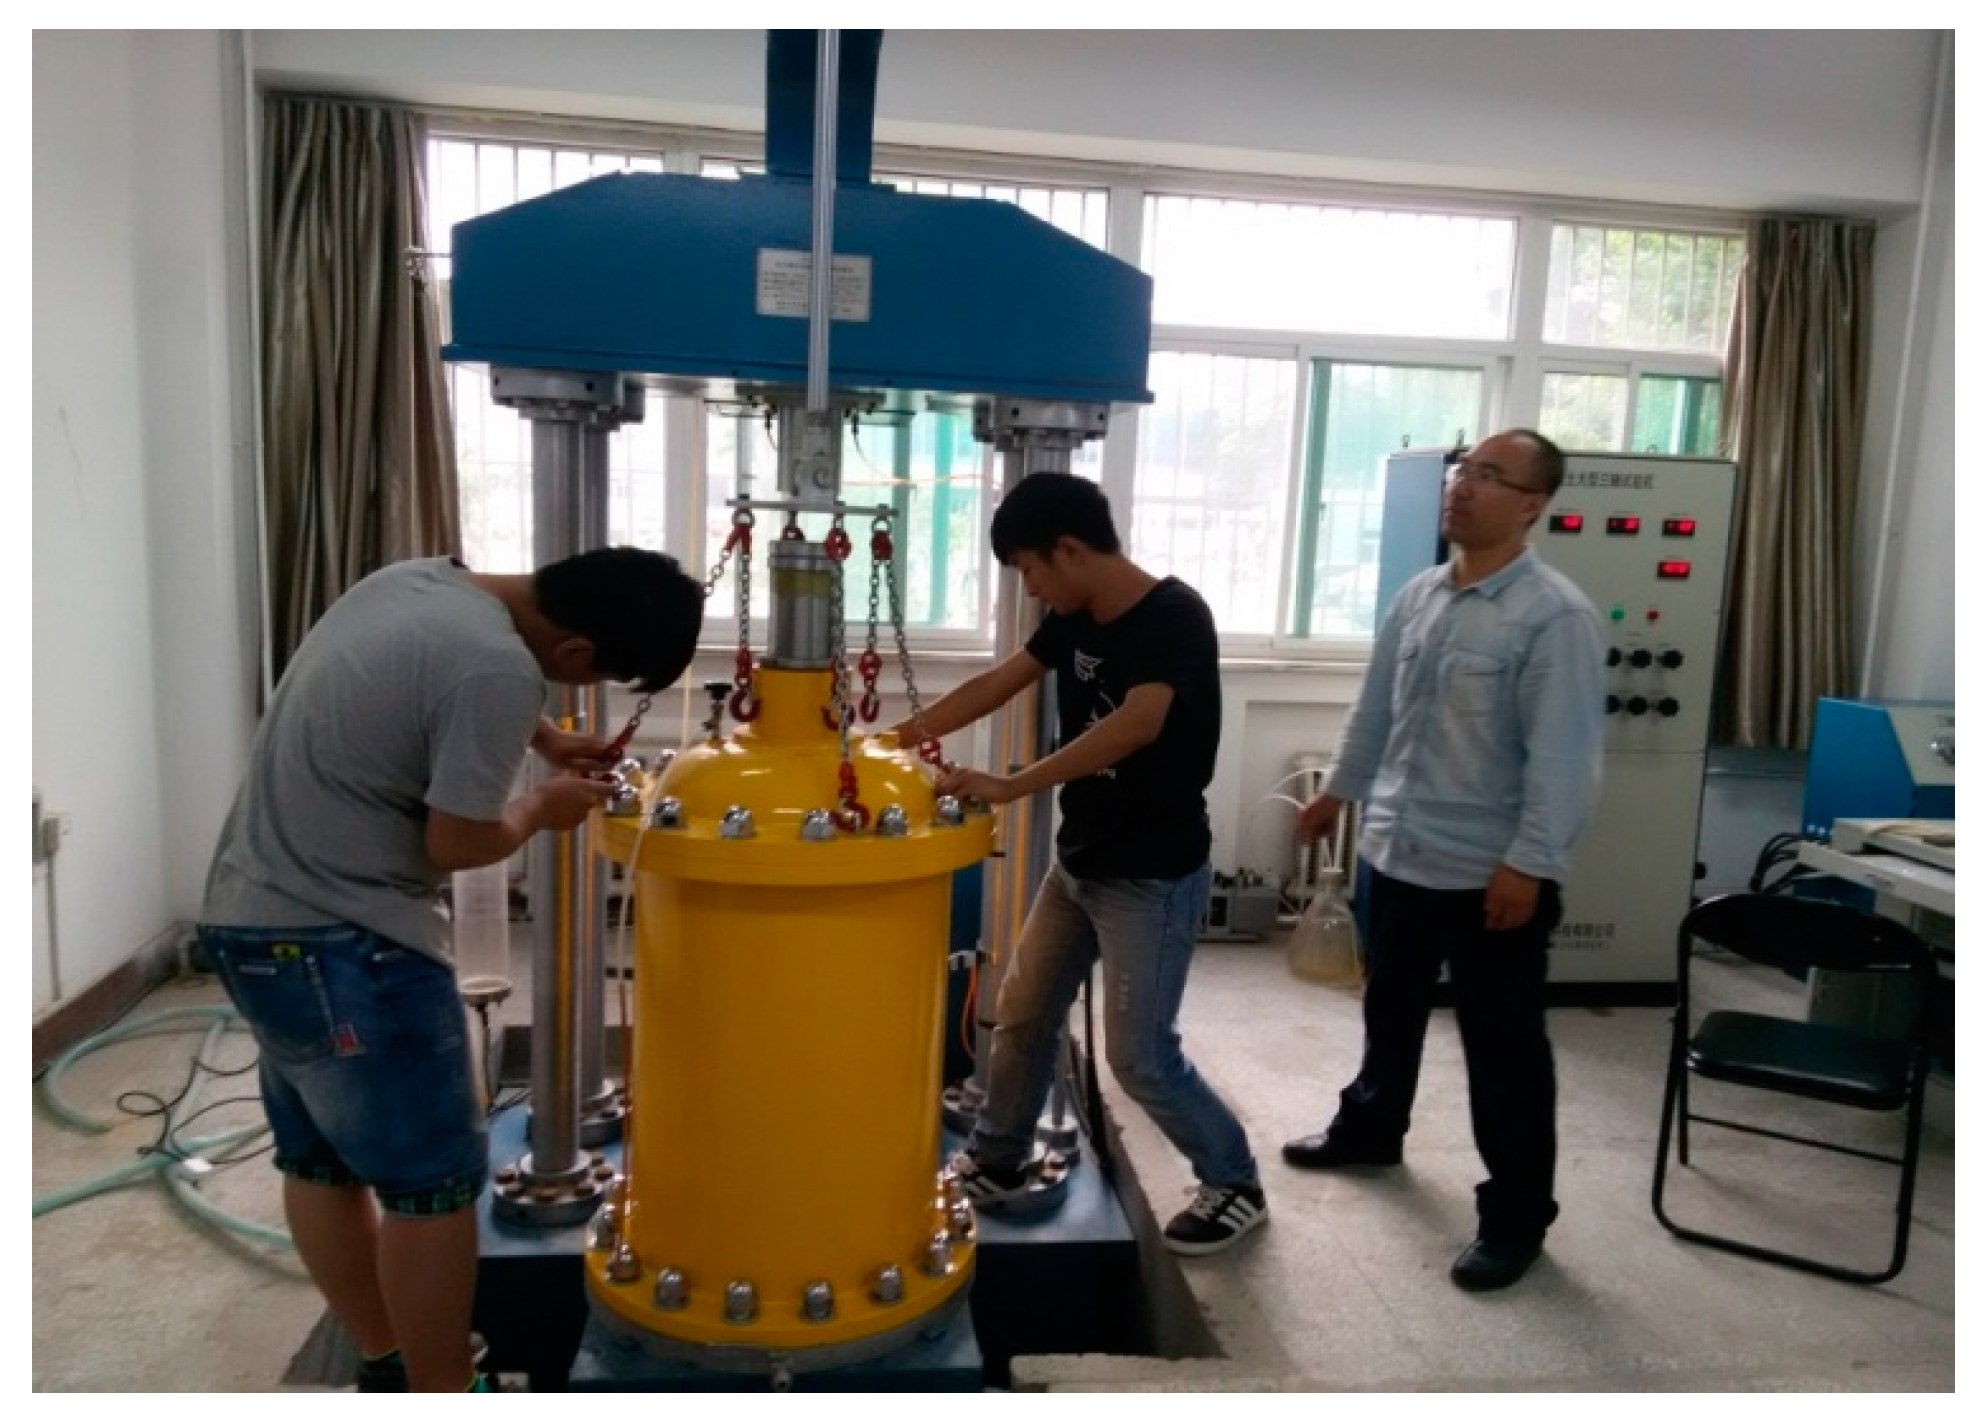
Figure 10.
Stress-strain curves.

Figure 11.
εv-ε1 curves.
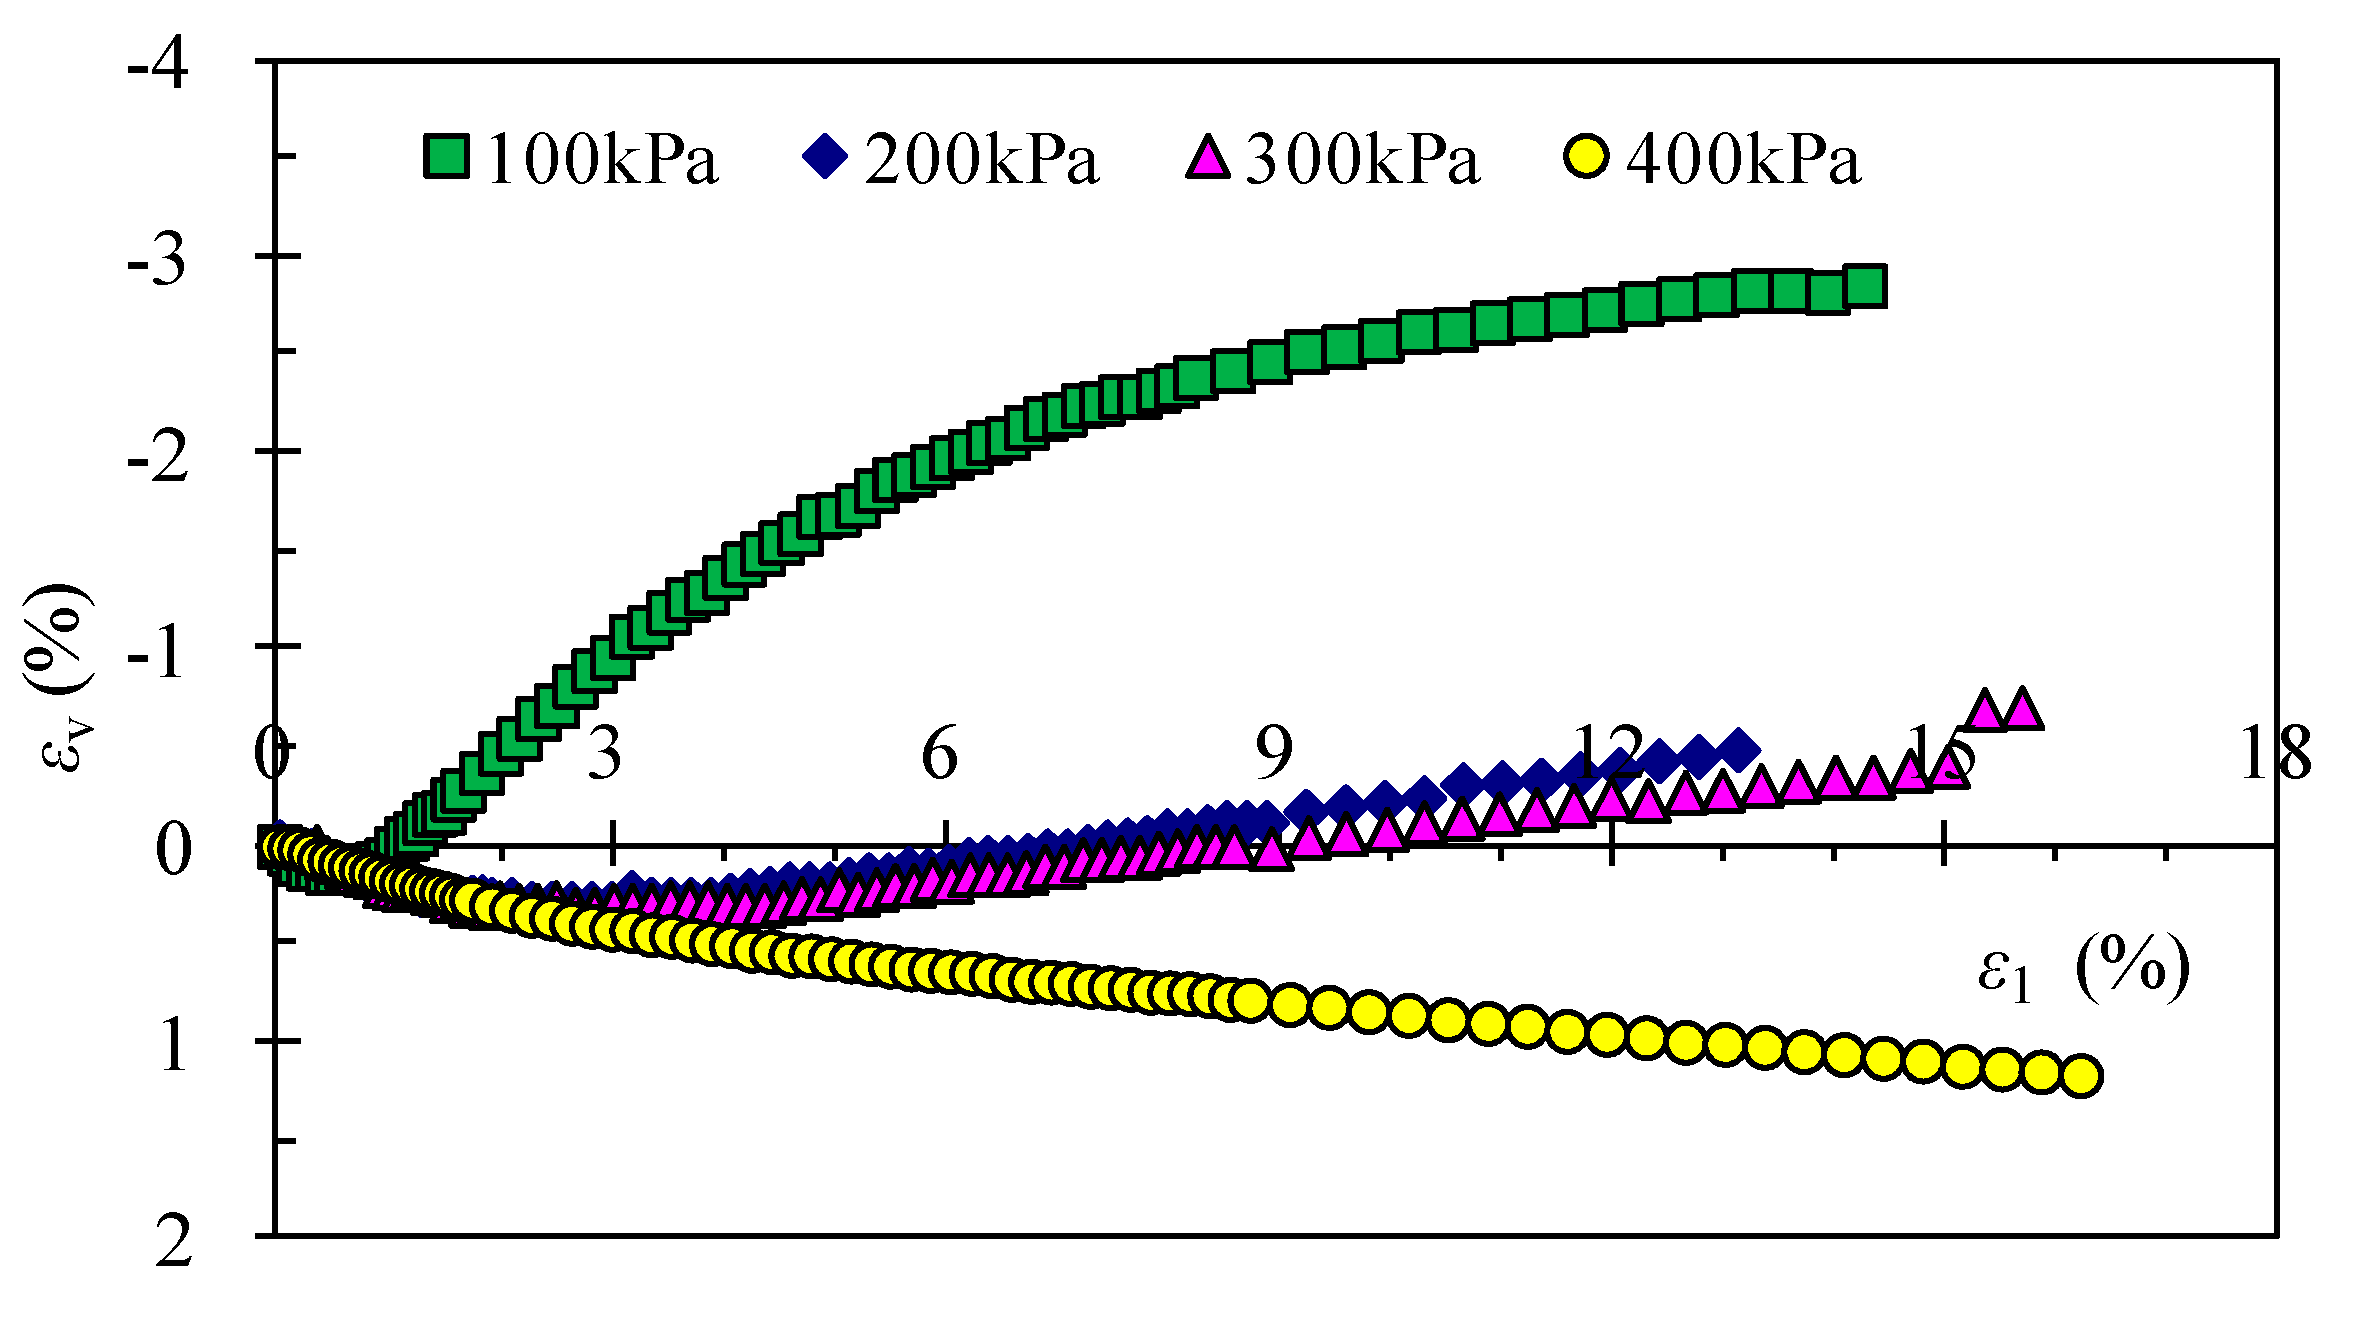
Figure 12.
Weathered granite subgrade test section.

Figure 13.
Change of parameters m for samples at different depths: (a) Section A; (b) section B.
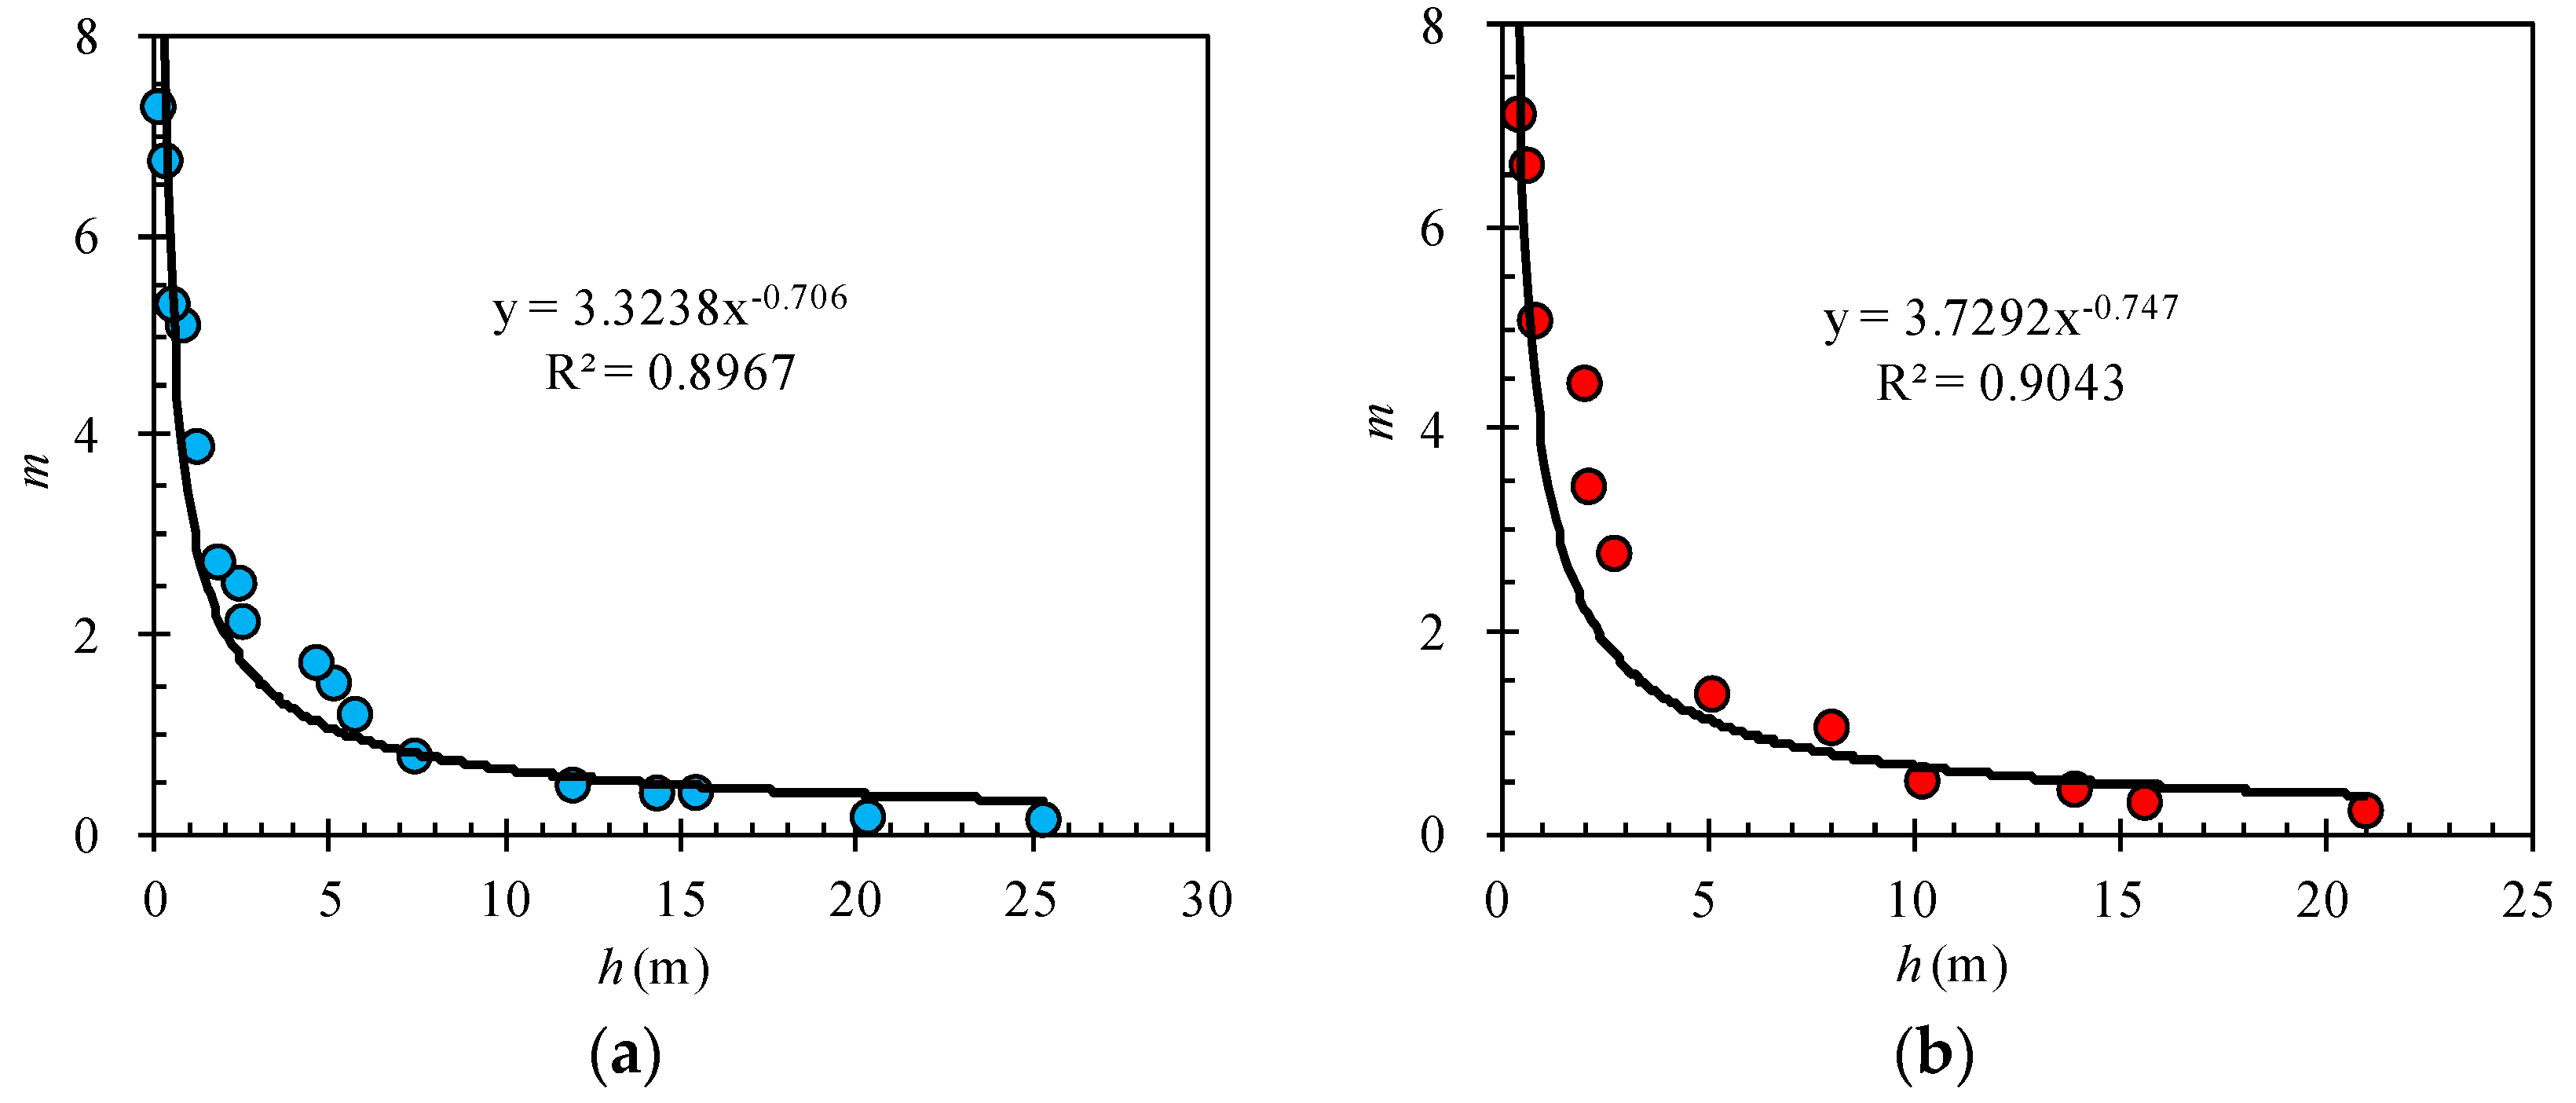
Figure 14.
Change of parameters r for samples at different depths: (a) Section A; (b) section B.
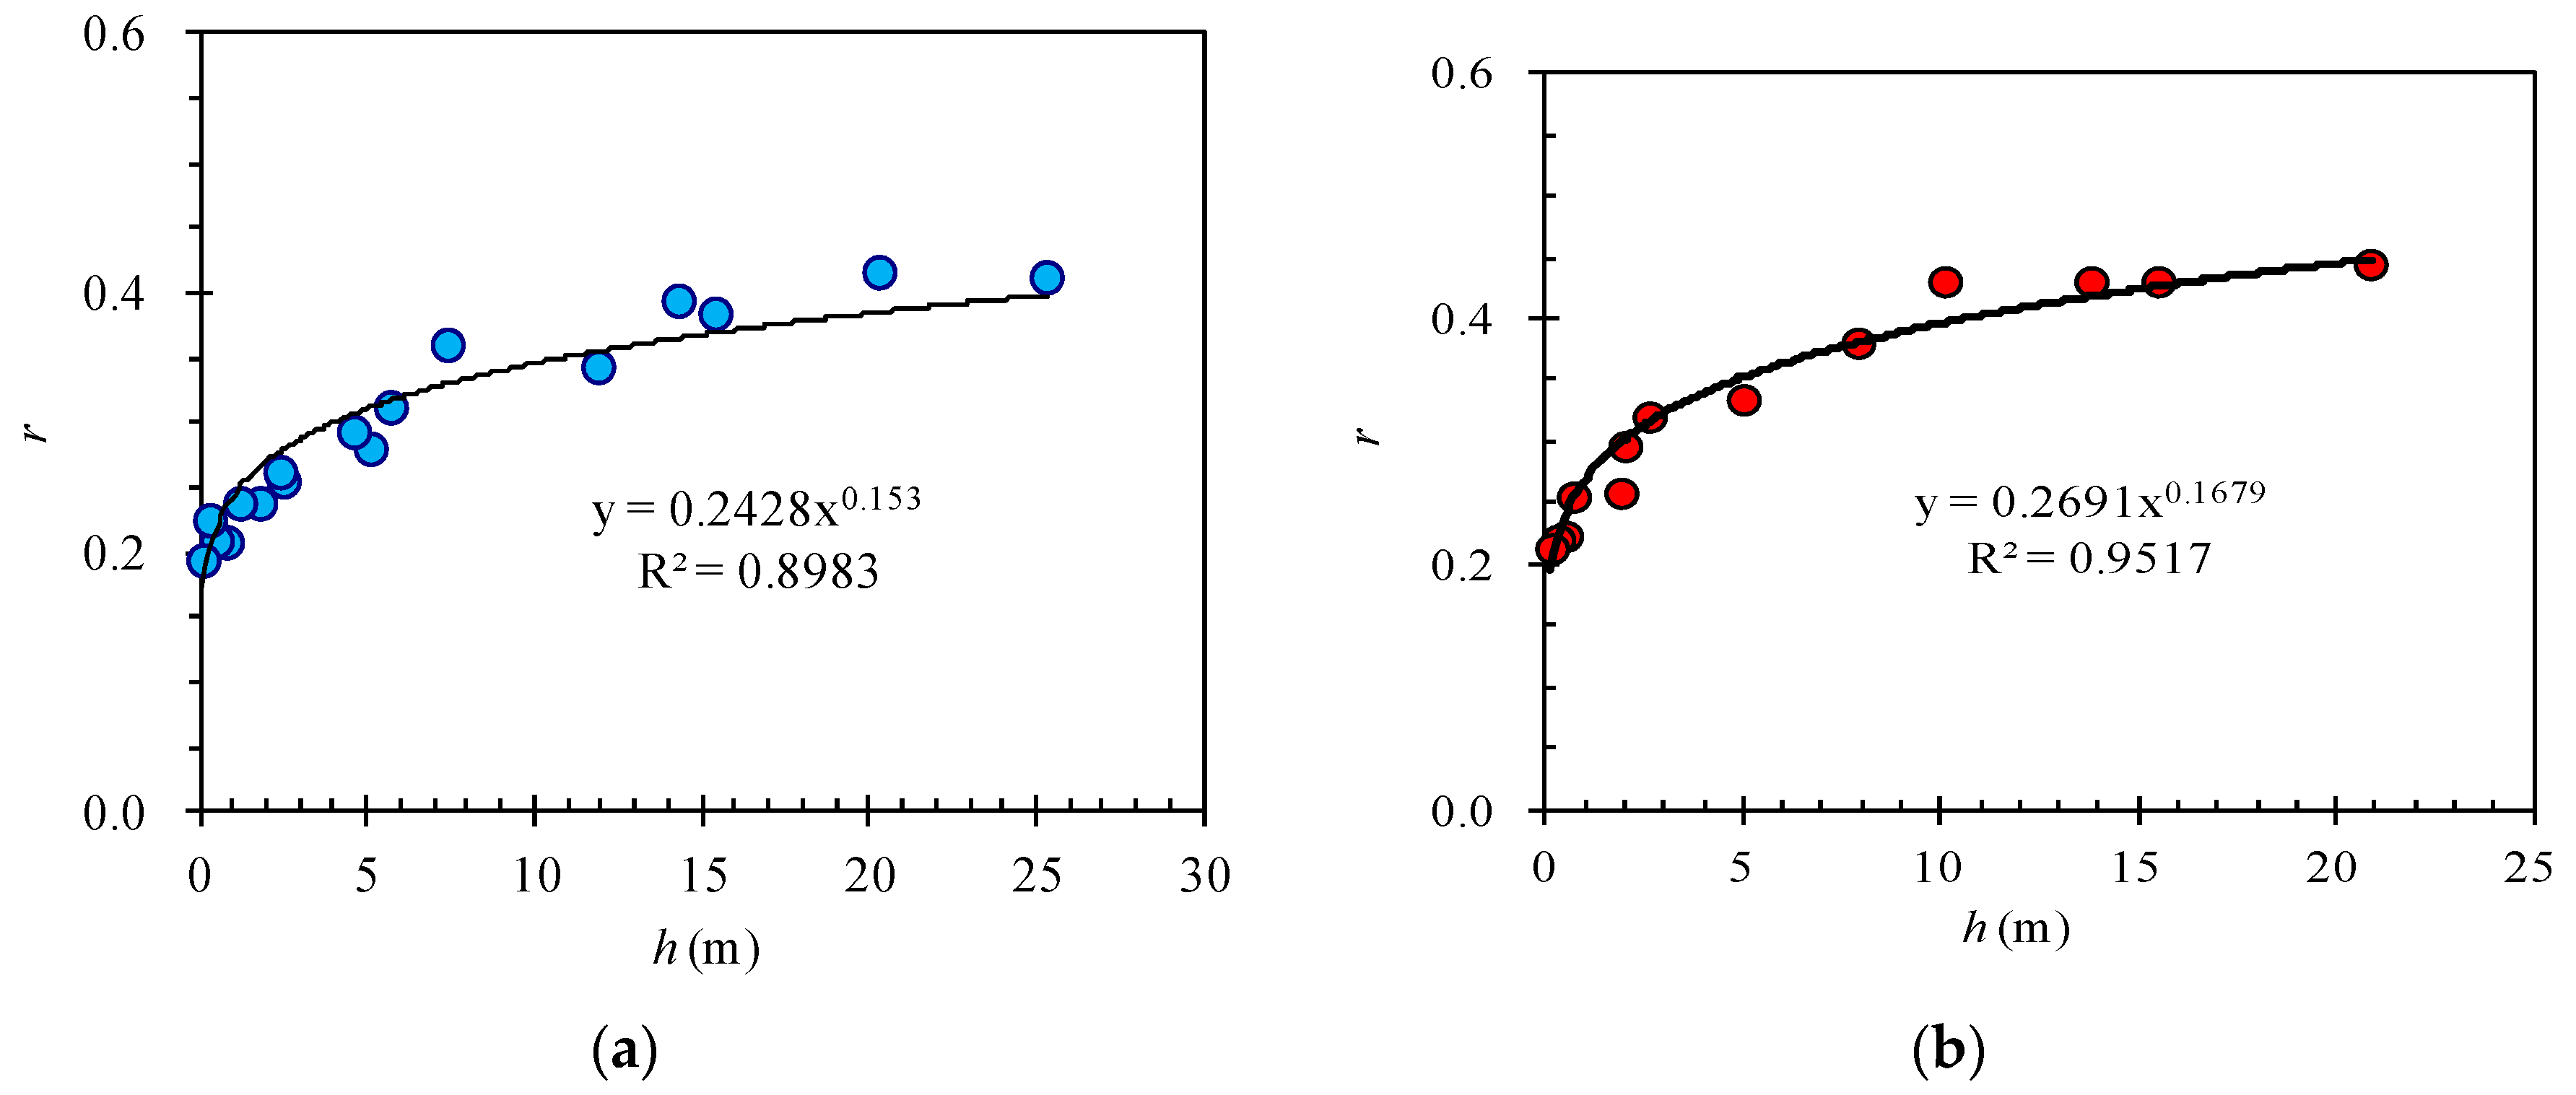
Figure 15.
Br-Cu curves.

Figure 16.
Sieving curves of different samples before and after the test.

Figure 17.
Relationship curve between quartz content and Br.
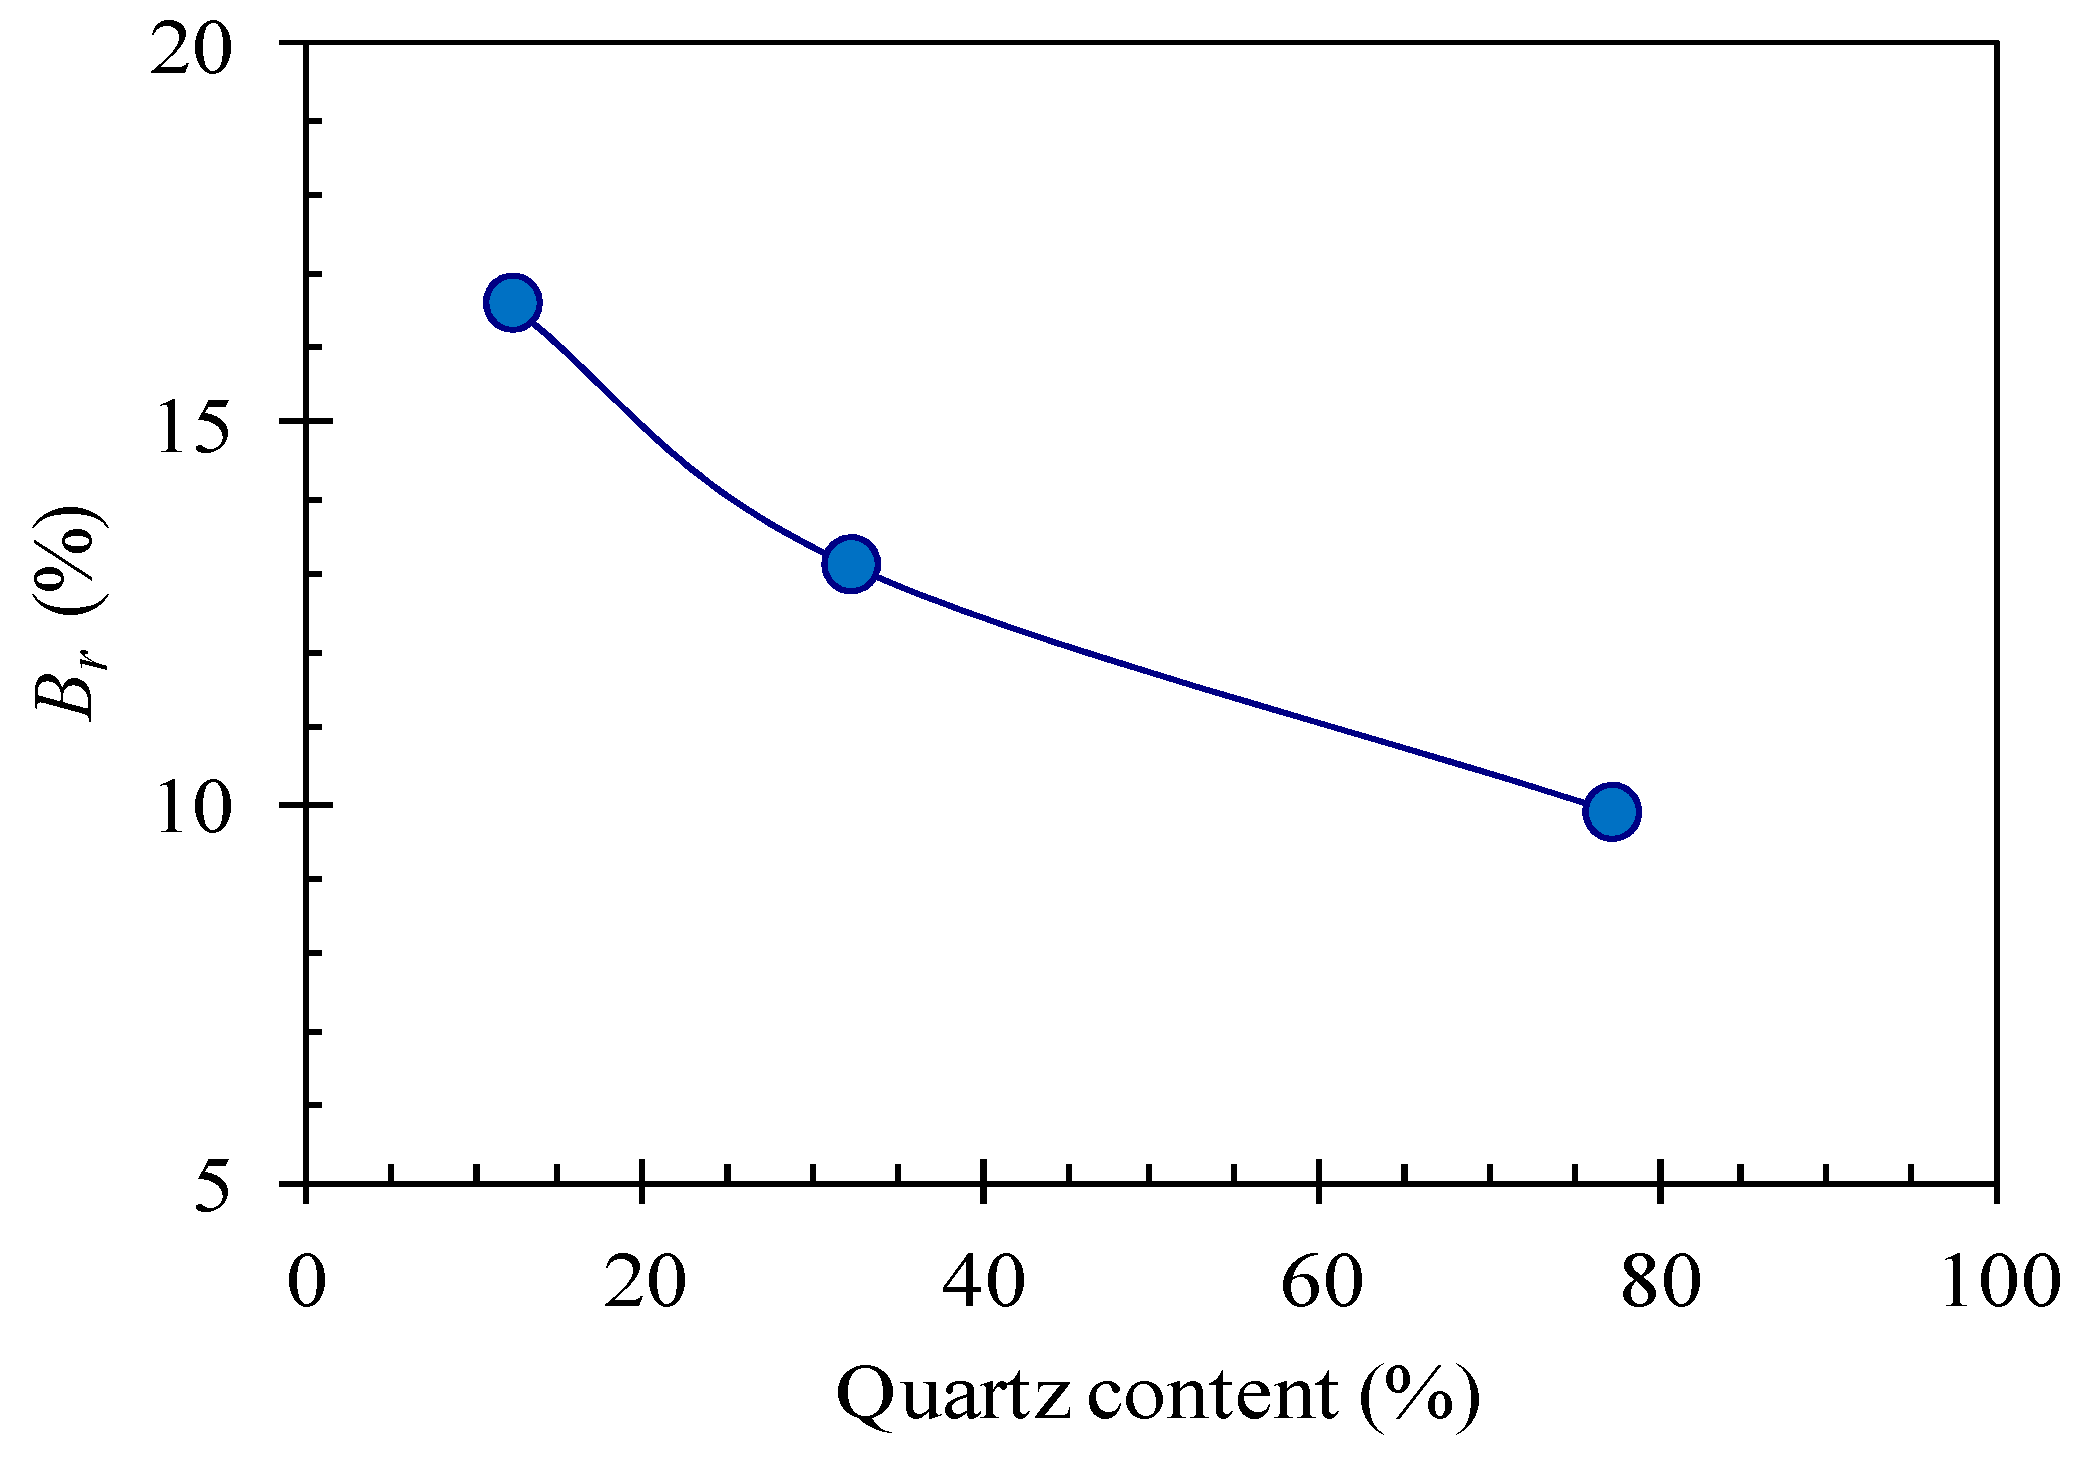
Figure 18.
Relationship curve between feldspar content and Br.

Figure 19.
Sieving curves of samples under different blows per layer. BPL: blows per layer.
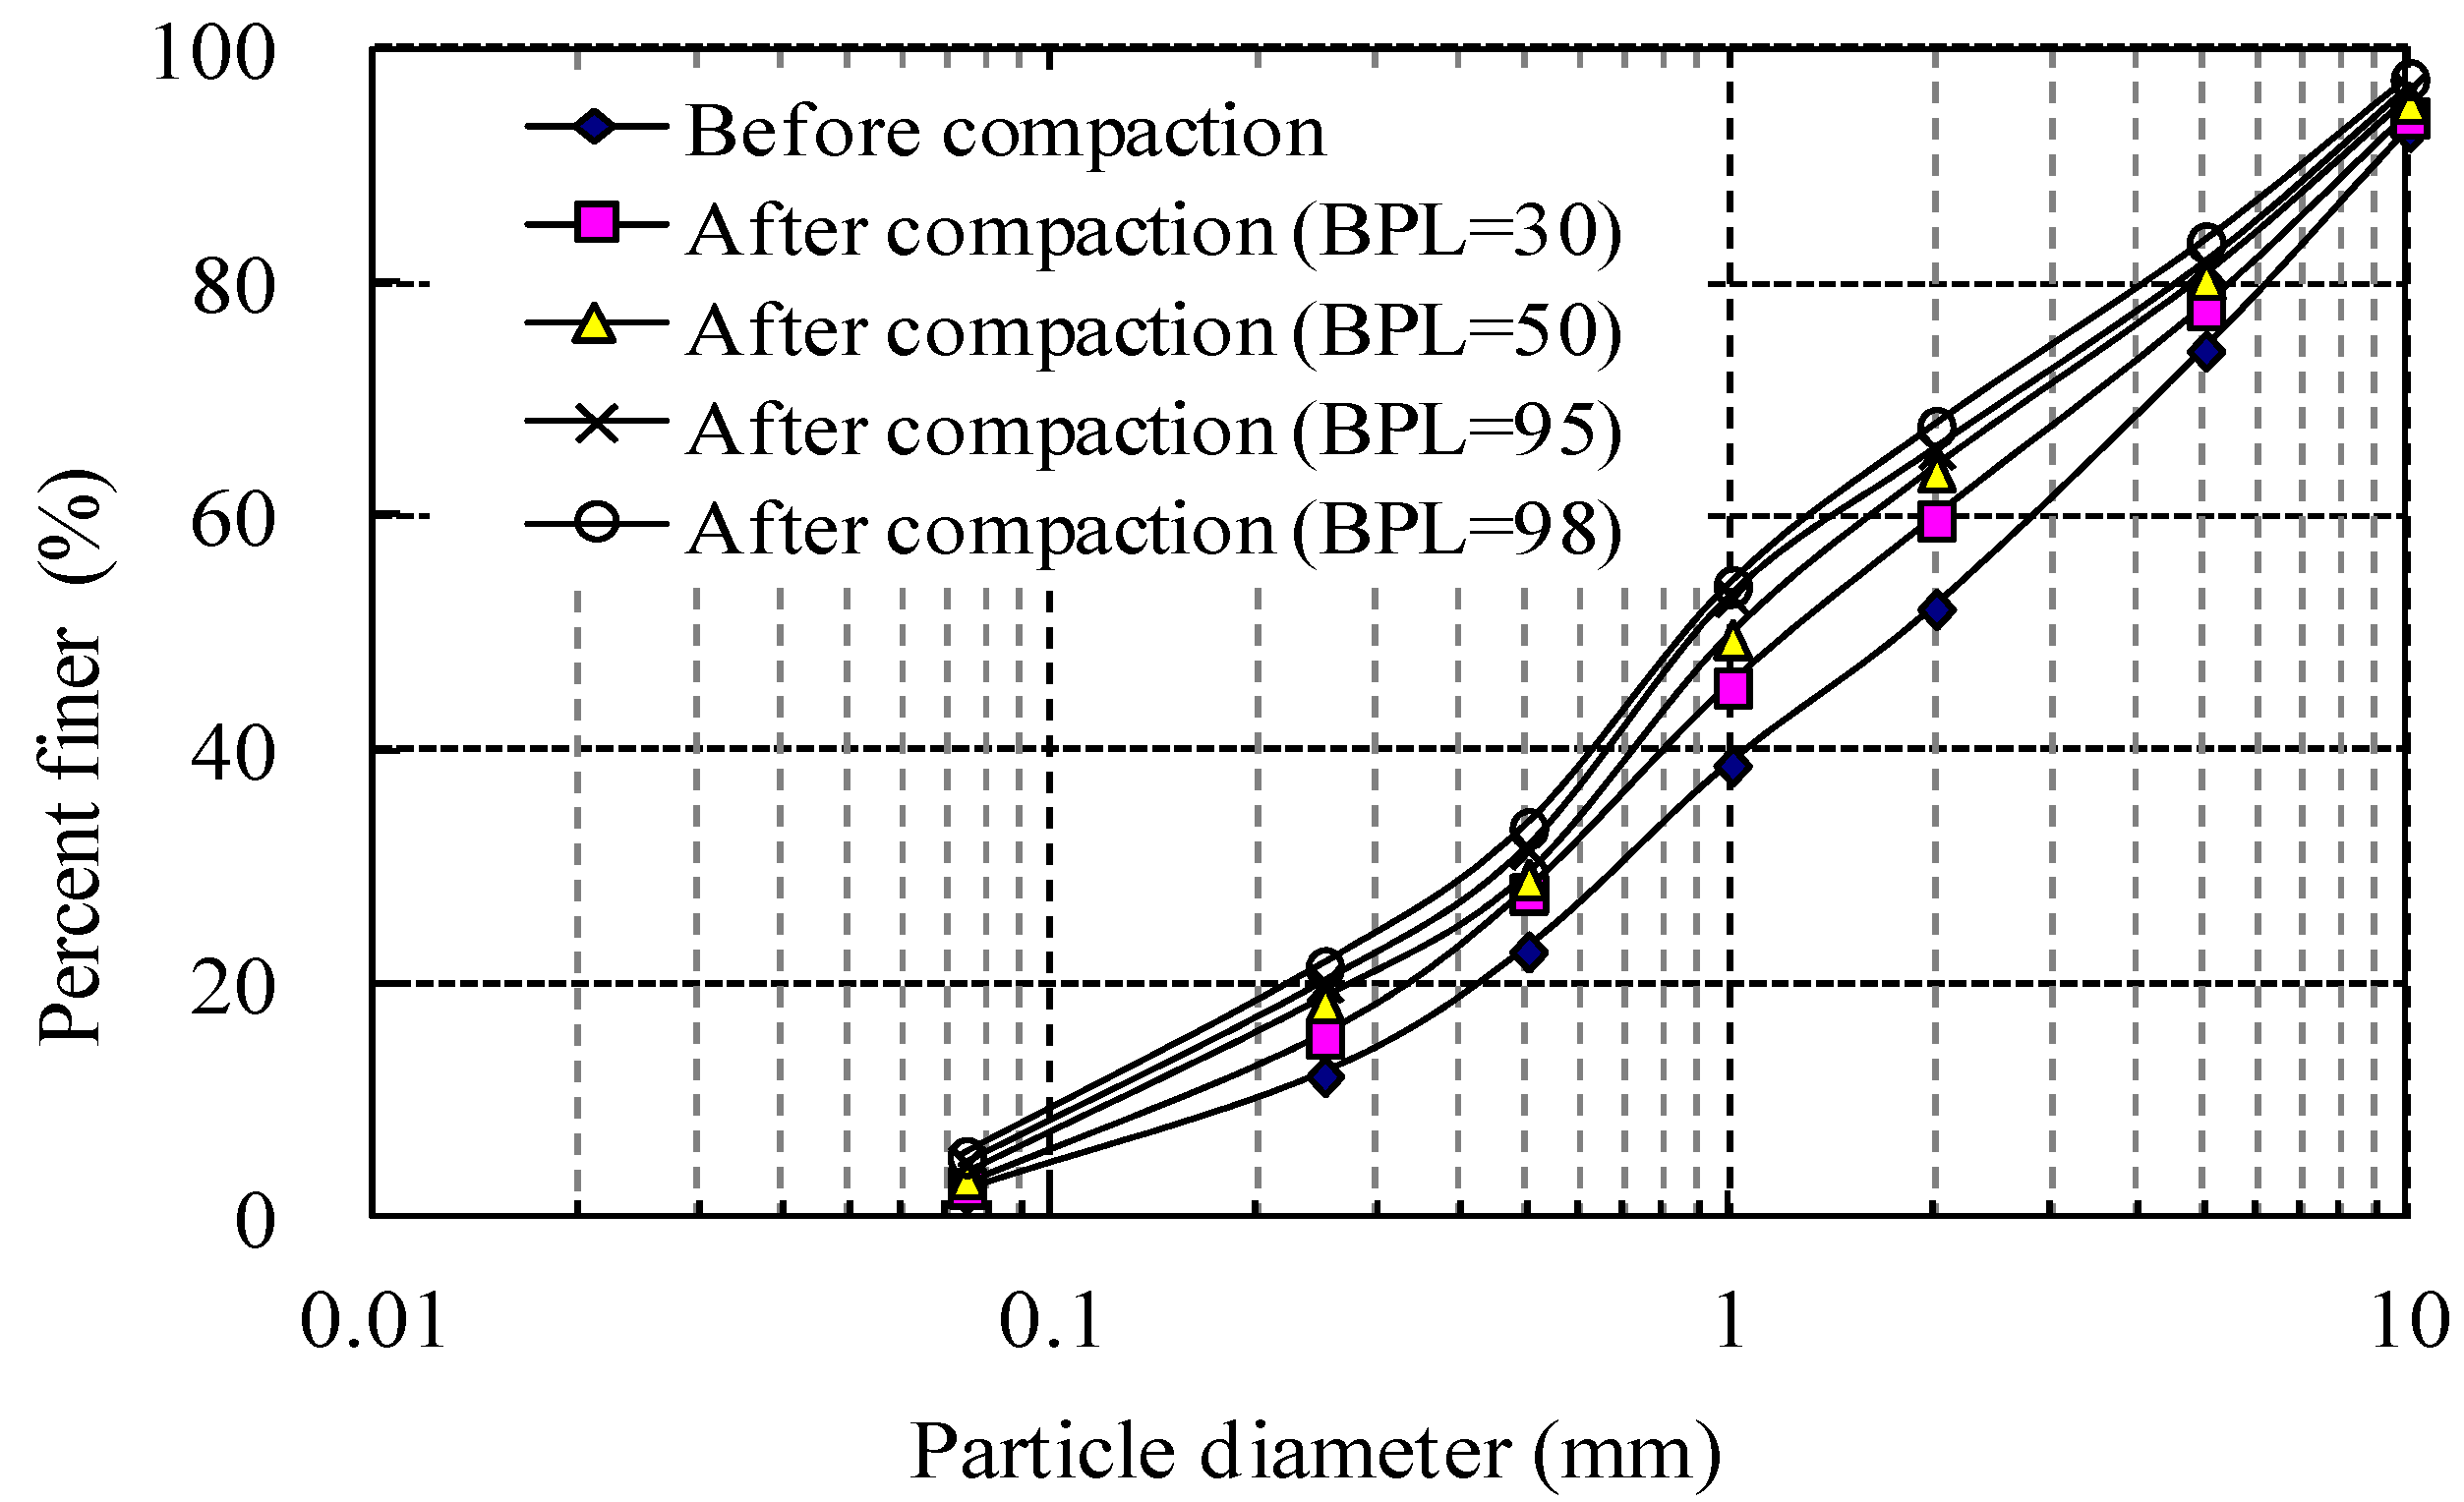
Figure 20.
Relationship curve between blows per layer and Br.

Figure 21.
Relationship curve between degree of compaction and Br.
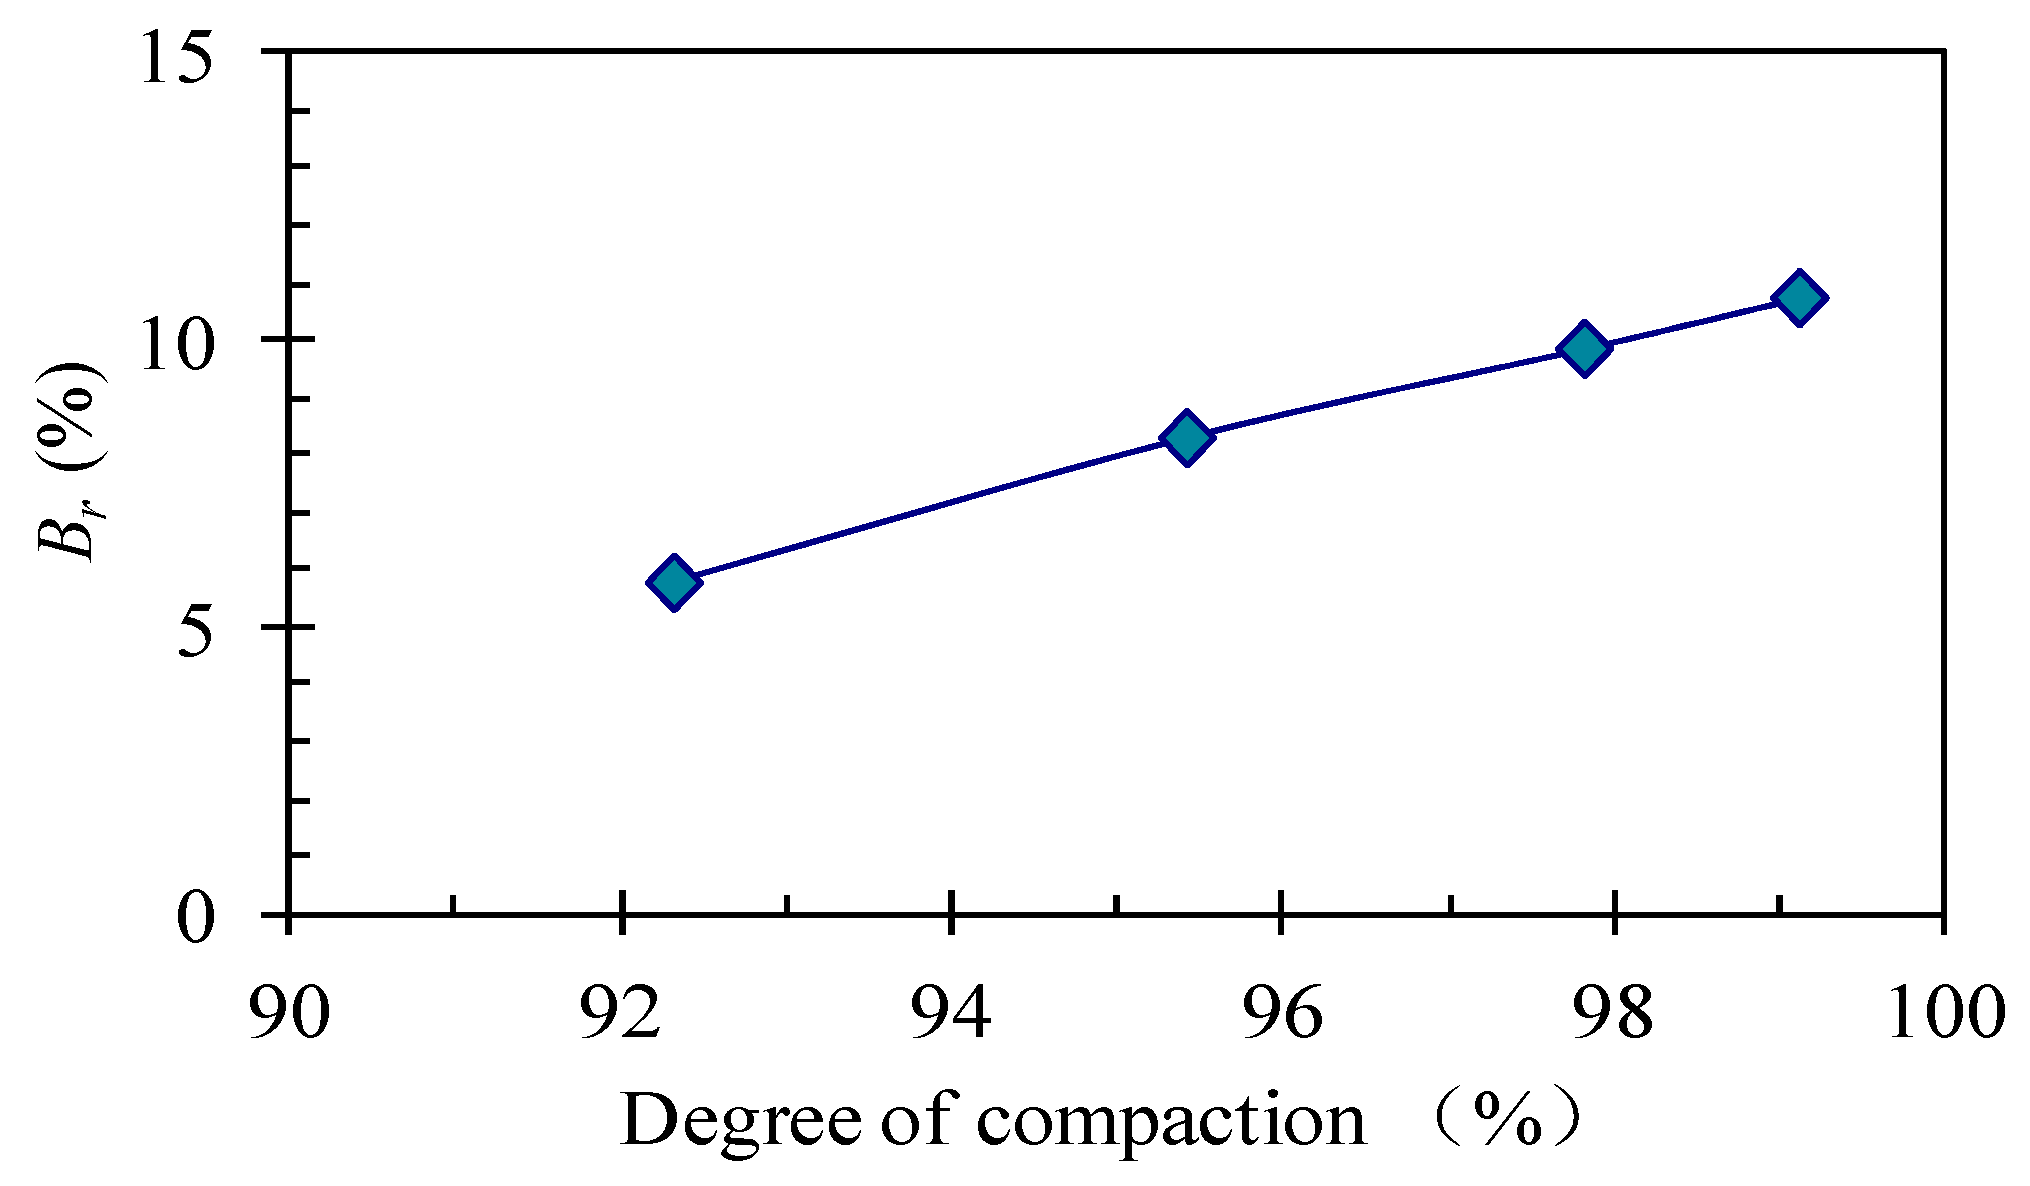
Figure 22.
Br-σ3 curves.
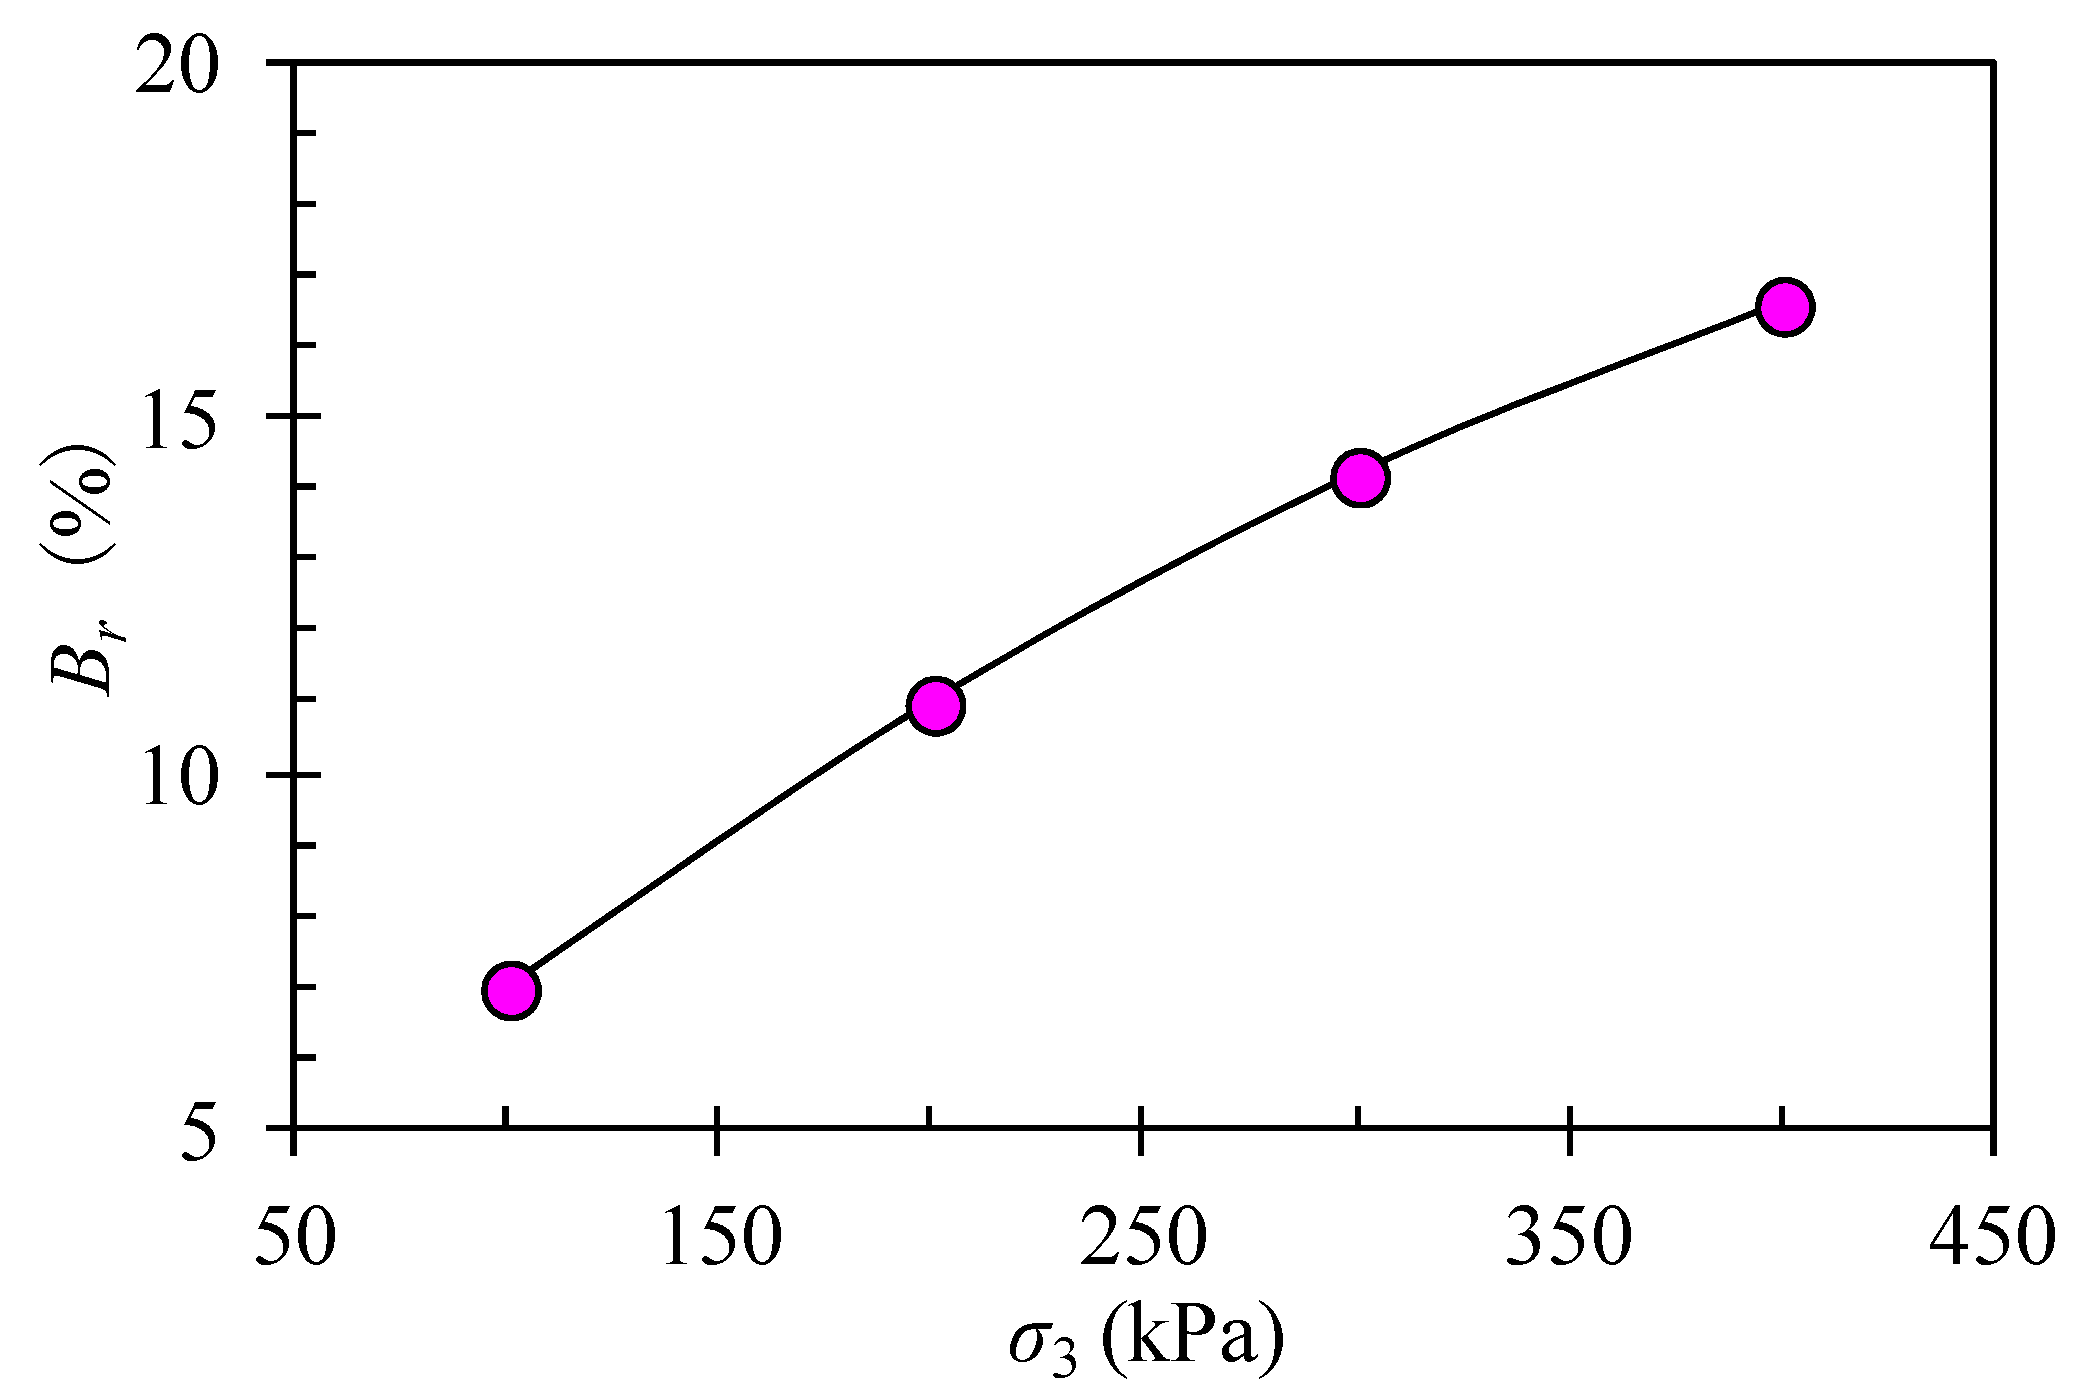
Figure 23.
Br-q/p (ε1 = 15%) curves.

Figure 24.
The relationship between degree of compaction and number of vibratory rolling passes. TLPL: thicknesses of loose paving layer.
Figure 24.
The relationship between degree of compaction and number of vibratory rolling passes. TLPL: thicknesses of loose paving layer.

Figure 25.
The relationship between relative breakage and number of vibratory rolling passes.

Table 1.
Mineral composition of weathered granite samples.
| Type of Sample | Weight of Mineral Composition, % | |||||||
|---|---|---|---|---|---|---|---|---|
| Quartz | Plagioclase Feldspar | Potassium Feldspar | Mica | Hematite | Amphibole | Vermiculite | Unknown | |
| Gray | 77 | 11 | 8 | 2 | 1 | 0 | 0 | 1 |
| Yellow-brown | 32 | 35 | 28 | 2 | 0 | 2 | 0 | 1 |
| Red-brown | 12 | 36 | 45 | 0 | 0 | 4 | 2 | 1 |
Table 2.
Parameters of standard heavy compaction test [24].
Table 2.
Parameters of standard heavy compaction test [24].
| Type of Test | Diameter of Rammer Bottom, cm | Weight of Rammer, kg | Drop Height, cm | Size of Mold, cm | Size of Sample | No. of Layers | No. of Blows per Layer | Compaction Effort, kJ/ cm3 | ||
|---|---|---|---|---|---|---|---|---|---|---|
| Internal Diameter | Height | Height, cm | Volume, cm3 | |||||||
| Ⅱ-2 | 5 | 4.5 | 45 | 15.2 | 17 | 12 | 2177 | 3 | 98 | 2677.2 |
Table 3.
Parameters of vibratory roller.
| Type of Parameter | Name of Parameter | Value of Parameter |
|---|---|---|
| Quality/Pressure parameter | Working quality of whole machine, kg | 20,000 |
| Distributed quality of vibration wheel, kg | 10,000 | |
| Distributed quality of drive axle, kg | 10,000 | |
| Net line pressure of vibratory wheel, kg/cm | 470 | |
| Size parameter | Diameter of vibration wheel, mm | 1600 |
| Width of vibration wheel, mm | 2130 | |
| Rim thickness of vibration wheel, mm | 40 | |
| Working parameter | Vibration frequency, Hz | 29 |
| Vibration amplitude, mm | 1.9 | |
| Excitation force, kN | 368 | |
| Rolling speed, km/h | 5 |
© 2018 by the authors. Licensee MDPI, Basel, Switzerland. This article is an open access article distributed under the terms and conditions of the Creative Commons Attribution (CC BY) license (http://creativecommons.org/licenses/by/4.0/).
Share and Cite
MDPI and ACS Style
Niu, X.; Yao, Y.; Sun, Y.; Luo, Z. Weathering Process of In Situ Granite and Particle Breakage Characteristics of Compacted Weathered Granite. Appl. Sci. 2018, 8, 1108. https://doi.org/10.3390/app8071108
AMA Style
Niu X, Yao Y, Sun Y, Luo Z. Weathering Process of In Situ Granite and Particle Breakage Characteristics of Compacted Weathered Granite. Applied Sciences. 2018; 8(7):1108. https://doi.org/10.3390/app8071108
Chicago/Turabian StyleNiu, Xirong, Yangping Yao, Yanfang Sun, and Zuolong Luo. 2018. "Weathering Process of In Situ Granite and Particle Breakage Characteristics of Compacted Weathered Granite" Applied Sciences 8, no. 7: 1108. https://doi.org/10.3390/app8071108
Note that from the first issue of 2016, this journal uses article numbers instead of page numbers. See further details here.