Abstract
Grouting reinforcement is an important part of modern engineering and has grown in popularity due to the benefits of grouting enhancement on cyclic loading. Understanding the fatigue mechanism of grouting-enhanced structures is vital to the design and the long-term stability analysis of such structures. In this study, the fatigue mechanical properties of cracked cement paste after epoxy resin grouting enhancement under different cyclic conditions were investigated in the laboratory and an inverted S-shaped curve was proposed to describe the damage accumulation. The test results indicated that the fatigue axial deformation can be divided into three stages: the initial stage, constant velocity stage and accelerating stage. The irreversible deformation can be used to describe the damage accumulation. The fatigue process is significantly affected by the upper limit stress level and the stress amplitude. In addition, the exponential relationship between stress amplitude and fatigue life was obtained. The proposed S-shaped curve was validated by an experimental fatigue strain test. The tests result upon various load conditions and crack types represented a good agreement with the predicted data.
1. Introduction
In recent years, underground structures have become more popular around the world. The mechanical properties of rock, concrete, and other engineering materials under cyclic loading are the main factors affecting the stability of engineering structures. The fatigue deformation and damage accumulation of rock and concrete are widely studied to reveal the mechanisms of fatigue failure and to evaluate the safety and stability of underground structures. Fatigue failure has become an important issue in the field of engineering research [1,2,3,4].
Under cyclic loading, the irreversible deformation of brittle materials, such as rock, concrete, and other engineering materials, undergo three stages: initial stage, uniform velocity stage, and accelerated stage [5,6,7]. There is a threshold value of fatigue failure close to the yield value. The fatigue damage will not occur when the fatigue control variable is below the threshold. Different scholars have conducted extensive fatigue studies on different rock types. He et al. [8] tested the sandstone samples under different amplitudes of cyclic loading. A dissipated energy evolution equation was proposed based on the deformation, cyclic softening, cycle hardening, and energy consumption characteristics of sandstone. Guo et al. [9] studied the strength, deformation and fatigue damage process of salt rock under uniaxial compression conditions. They found that the fatigue failure curve of rock salt was controlled by the complete stress-strain curve under static loading. Similar results have been obtained with rock of different densities, such as marble [10,11,12,13], granite [14,15], white sandstone [16], and coal rock [17] through fatigue testing. It was suggested that fatigue testing would be a feasible and effective method for damage evolution. Numerous experimental data show that energy dissipation can be obtained through hysteresis loop integral calculation of stress-strain curve under cyclic loading. In this paper, the stress-strain curves obtained from the experimental records also showed that hysteresis loops had a loose-dense-loose model (see Figure 1a). The irreversible axial deformation presented a three-stage development trend which corresponded to the three stages of crack initiation, crack stabilization propagation and crack instability propagation (see Figure 1b) [18].
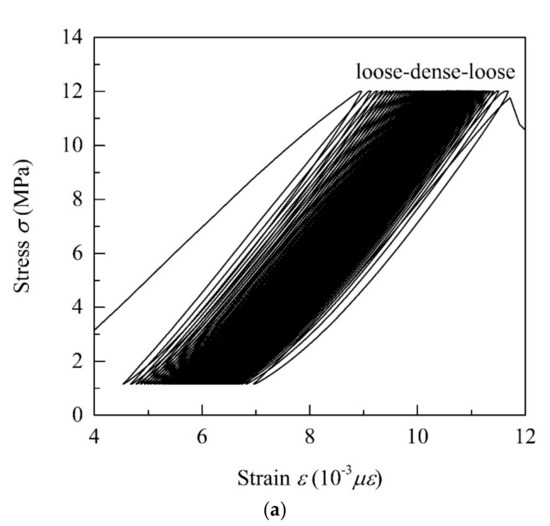
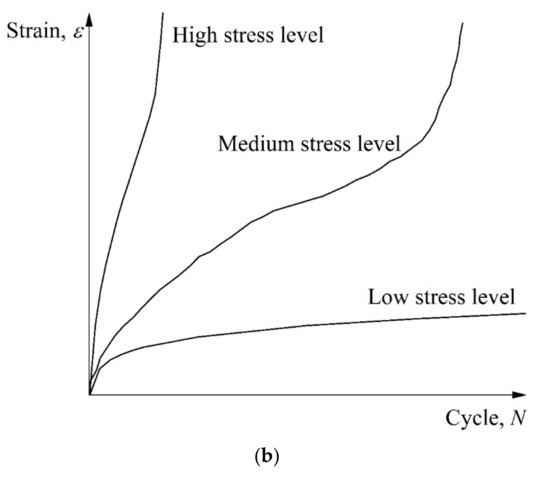
Figure 1.
Classical fatigue damage evolution: (a) stress–strain curve under cyclic loading; and (b) classification of development curves of irreversible deformation.
There are three different curve types according to the different stress levels. When the stress level is lower than the threshold value of fatigue failure, the irreversible deformation showed a stable period after experiencing the initial stage, that is, damage occurs at infinity. When the stress level is moderate, the curve shows three clear stages and the uniform stage is longer. During the uniform velocity stage, the irreversible deformation increases linearly, which is the common form of most rock fatigue. When the stress level is high, the initial stage and the accelerated stage are shorter than others. The cracks propagate rapidly after the initial stage.
It is clear that the irreversible deformation can be used to describe the damage accumulation. An inverted S-shaped curve can be introduced to describe the relationship between irreversible deformation and cyclic number. Therefore, it is an effective method to define the appropriate damage variables and simulate the damage process.
In this paper, Portland cement was used to make fractured specimens, and the cracks were grouted with toughened epoxy resin. The damage mechanism after grouting reinforcement under cyclic loading was revealed and an inverted S-curve model was established to simulate the damage accumulation process.
2. Materials and Methods
The cement paste sample was prepared with white Portland cement (P.W 32.5 based on GB/T 2015-2005) with designed water to cement (w/b) ratio of 0.5. The mixture was poured into a mold and placed on an electromagnetic vibration shaker roughly 20 min. The basic mechanical properties of the samples were tested after 28 days curing at room temperature. The grouting reinforcement material (bisphenol A epoxy resins and amine hardener) was provided by Shanghai Jiagu Building Materials Co., Ltd. (Shanghai, China). The epoxy resin matrix (bisphenol A epoxy) and curing agents (amine hardener) were mixed with a volume ratio of 2:1. The epoxy resin was fully stirred and poured into the polytetrafluoroethylene (PTFE) mold. The epoxy resin was cured at room temperature for 72 h before testing. The mechanical properties, such as tensile strength st, elastic modulus E, Poisson’s ratio m, and compressive strength sc, were measured experimentally through a splitting test and a uniaxial compression test, as listed in Table 1.

Table 1.
Mixture components’ mechanical properties.
The regular single crack and parallel double crack cement paste specimens with a size of 50 mm × 25 mm × 100 mm were prepared by using the embedded strip method [19] and the crack angle a = 60°, crack length 2a = 20 mm, and crack spacing H = 10 mm. Epoxy resin was injected into the crack and cured for 72 h. The flatness of the specimen surface and penetration of cracks were checked after demolding to meet the test requirements. The sample and grouting preparation are shown in Figure 2. Fatigue tests were conducted on a Hualong WDW-20C test apparatus, manufactured by the Shanghai Hualong Co., Ltd. (Shanghai, China). The test parameters included the greatest stress σmax, the smallest stress σmin, the static compressive strength σc, the stress amplitude σa, stress ratio R, and stress level S. The relationship among the parameters is shown in Figure 3. The greatest stress and the smallest stress were entered as control parameters. Then a triangle wave loading based on the frequency was automatically loaded. The fatigue loading in this test was loaded at a frequency of 0.1 Hz. Three different stress ratios and four different stress levels were chosen for comparison. They were R = 0.1, 0.2, 0.3 and S = 0.41, 0.51, 0.61, 0.76, respectively.
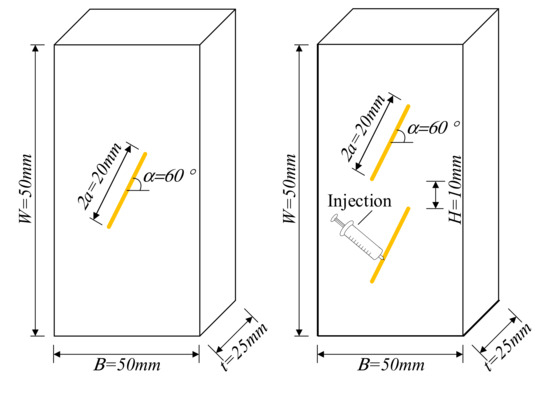
Figure 2.
Specimen size and grouting method.
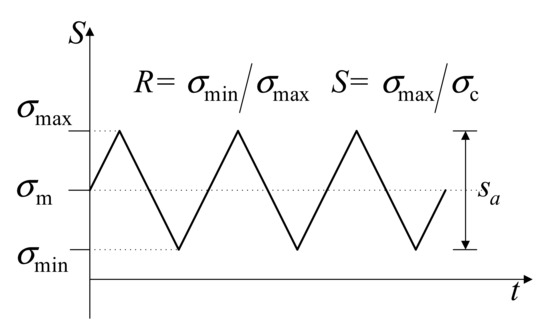
Figure 3.
Fatigue loading curve.
3. Fatigue Test Results and Analysis
Figure 4 shows a typical failure trajectory of the specimens. Several stages of the specimens under cyclic loading, including compaction, micro-crack initiation, stable crack propagation, and accelerated crack propagation, were observed with the increase of the number of cycles. For single crack specimens, the crack initiated in the middle of the specimen and propagated up and down around the slurry body (see Figure 4a). After the specimen was completely destroyed, the slurry body and the surrounding part of the specimen still had good integrity. It was clear that grouting reinforcement could effectively avoid the stress concentration of the crack and strengthen the specimen. The fatigue performance of the specimens after grouting was better than that of the specimens without a crack. The typical failure trajectory of the specimens of cracked specimens and non-cracked specimens was listed in Figure 4c,d. According to the test results, under the same stress level and stress ratio (S = 0.41, R = 0.1), the average fatigue life of non-fractured specimens was 31,250 cycles. For the single-cracked specimen, crack initiation started after approximately 721 cycles and the final number of cycles to extend to the top of the specimen was approximately 21,453 cycles. For the double-cracked specimen, the crack initiation started after approximately 561 cycles and the final number of cycles to extend to the top of the specimen was approximately 19,453 cycles. At the same time, compared with the un-grouted and non-fractured specimens, the toughness of the grouted specimens was greatly improved. For the double-crack specimens, the crack initiated in the original crack tip and propagated to another crack (see Figure 4b). In some cases, the grouting body was compressed and destroyed, which indicated that the better grouting effect can be obtained and the grouting body has fully played its important reinforcement role. In general, double-fractured specimens have better strength and fatigue resistance than single-fissure specimens.
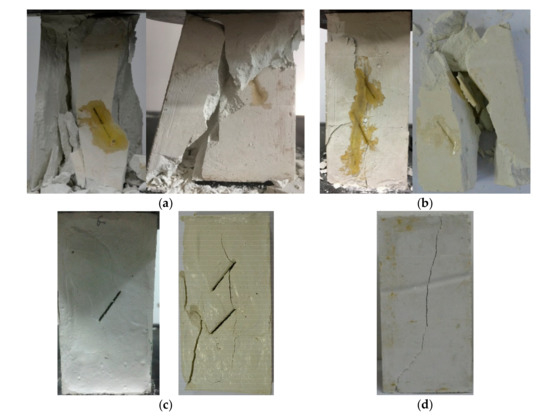
Figure 4.
Failure diagram of specimen: (a) single-crack after grouting; (b) double-crack after grouting; (c) cracked specimens before grouting; and (d) without cracks.
The fatigue test results under different stress ratio and stress levels are listed in Table 2. The fatigue life of specimens slightly decreased with the low amplitude Sa, however, after increasing the amplitude Sa, the fatigue life was rapidly reduced. Changing the stress level σmax/σc and the stress amplitude Sa significantly affects the fatigue process. The initial axial deformation took place before the beginning of the cycle and the axial deformation increased with the increase of the stress level. The total amount of cumulative irreversible deformation required to achieve failure will be reduced and affect the fatigue life of the specimen significantly.
Table 2.
Fatigue test results.
The S-N (stress amplitude and fatigue life relationship) curve was obtained according to the data listed in Table 2 and Figure 5. It can be seen that the stress amplitude Sa decreases exponentially with the increases of the fatigue life Nf which is similar to the research results of other scholars [20]. After data fitting, the stress-fatigue life equation can be obtained as:
Sa = 15.25522 Nf−0.08804
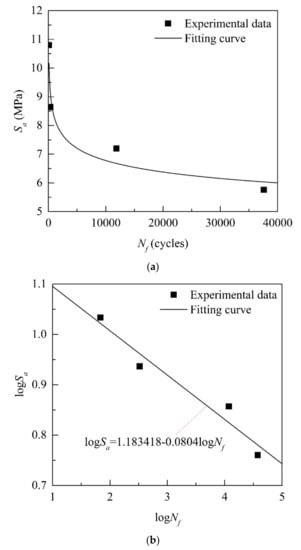
Figure 5.
S-N (stress amplitude and fatigue relationship) curve (single-crack specimens, R = 0.1); (a): Nonlinear stress amplitude and fatigue relationship; (b): Double logarithmic linear relationship.
Taking the logarithm of both sides of Equation (1), the linear relationship between the stress amplitude Sa and fatigue life Nf can be obtained as:
lgSa = 1.183418 − 0.08804l gNf
Figure 6 shows the effect of stress ratios on fatigue life. It can be seen that the fatigue life increases greatly with the increase of the stress ratio R under the same stress level. The increase of R means the decrease of stress amplitude Sa. Compared with the upper limit stress level σmax/σc, R has little influence on the fatigue life. When the upper limit stress level is 0.51, the stress ratio R = 0.1 and the fatigue life can reach 11,866. However, when the upper limit stress level is 0.76, even if the stress ratio R increases to 0.2, the fatigue life still only increases to 1621. Obviously, the upper limit stress level is one of the main factors affecting the fatigue life. In the actual project, the grouting-reinforced structure should avoid working at the high-stress levels.
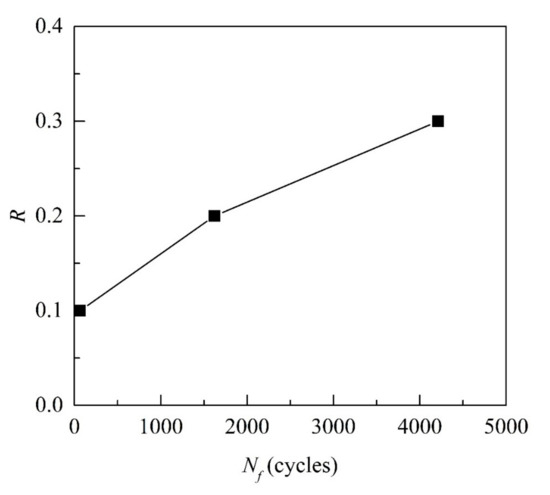
Figure 6.
The effect of stress ratios on fatigue life (Single crack specimens, σmax/σc = 0.76).
There is a clear difference between the destruction process of static and dynamic uniaxial compression, but there is also some connection between them [9,21,22]. The axial stress-strain curves under static loading and those under cyclic loading are plotted in the same figure, as shown in Figure 7. According to the static stress-strain curve, there is a control point at the upper limit stress level, the corresponding strain at this point is the fatigue failure strain εd. The strain corresponding to the position before the peak load at the same stress level is the initial strain ε0. The total fatigue residual strain can be obtained as εr = εd − ε0. The strain of the failure point named as failure strain εf. The failure point and the control point approximately coincide and the error between the strain εd and εf is less than 1% according to the experimental data. The deformation can be selected as a control factor of fatigue failure analysis.
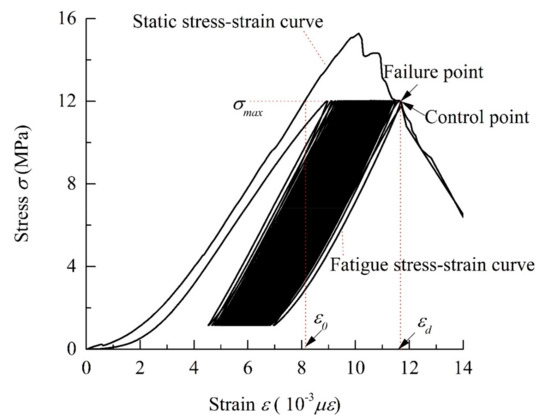
Figure 7.
Static and fatigue testing curves.
4. Inverted S-Shaped Fatigue Damage Model
Figure 8 shows the strain cycle-ratio curve of typical samples. Where the strain is the amount of relative deformation in the vertical compression direction which was collected during the fatigue loading process. It can be seen that the changing rules of the single-crack and double-crack samples are consistent, and the entire fatigue failure process exhibits a clear three-stage damage rule. The initial damage phase and the acceleration phase have a shorter duration, and the stability phase is relatively long. The curves of the three phases show a distinct inverted S-shaped shape, which is consistent with the results obtained in most of the literature [23,24]. At the same cyclic ratio, the single-crack specimen has a greater strain than the double-crack specimen. The cracking strain of the resin is much larger than that of the cement, so the damage begins at the periphery of the cement away from the original crack after grouting reinforcement. The strength of the entire structure is strengthened and the anti-fatigue performance is improved after grouting enhancement.
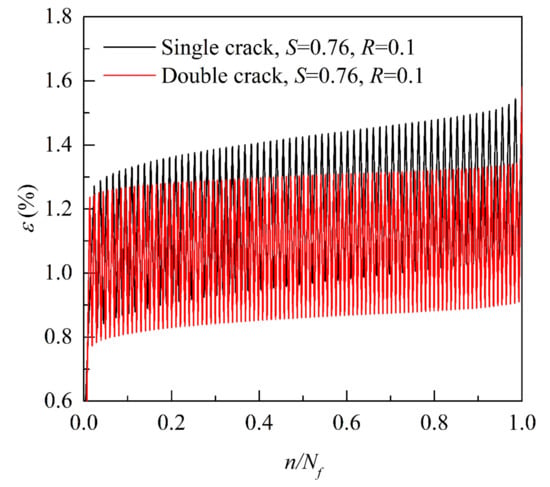
Figure 8.
Strain-cycle ratio curve.
When damage mechanics is used to study the fatigue properties of cement and other solid materials under cyclic loading, the selection of the damage variables is crucial. At the same time, the damage variable needs to have a clear physical meaning, easy to measure, and the change law is consistent with the evolution of fatigue mechanical properties of materials. The common definitions of damage variables are elastic modulus, longitudinal wave velocity, energy dissipation, maximum strain, residual strain, acoustic emission, density, etc. [25,26,27]. According to the above collection results of strain, it can be found that the strain has all the features as the amount of damage. In this paper, we will use the maximum strain as the definition of damage, and study the damage process. According to the results of the literature study, the damage variable can be defined based on the maximum vertical deformation under cyclic loading:
where D is the damage after n cycles, is the instantaneous maximum strain for the n-th cycle, is the initial fatigue maximum strain of the first cycle, and is the maximum strain of the last cycle.
The inverted S-shaped curve has been widely used in many fields of research. The logistic model, also known as the Verhulst-Pearl model, is a model in which the S-shaped curve can be better simulated. The general expression of the Logistic model equation can be expressed as [28,29]:
where a, b, c are related parameters affecting the shape of the curve.
Applying the inverse function of the logistic model to the damage model described in this paper, a new mathematical expression of the inverted S-shaped model for fatigue damage accumulation can be expressed as:
where n is an independent variable, called generalized cycle, can be absolute cycle N or relative cycle N/Nf; D is the dependent variable, represents the corresponding damage of N cycles under constant amplitude loading; D0 is a parameter related to the initial damage; a and b are two parameters to be determined.
A perfect fitting curve of damage evolution agreeable to experimental data can be obtained by adjusting these three parameters: D0, a, and b. It can be seen from Figure 9 that the damage value D is consistent with the D0 when the relative cycle N/Nf is equal to 0.5 which is consistent with the conclusion of [29]. This means that the damage value of the curve center, the cumulative damage of the half-life, could be controlled by D0. Most of the value of D0 should be around 0.5 because it is related to the half-life damage. The range of D0 should be limited to 0–1. The damage accumulation rate of the uniform velocity stage is accelerated with the increase of the parameter a. In other words, the damage accumulation rate in the middle stage of fatigue damage is controlled by the value of a. The larger the value of a, the faster the damage growth. The range of a should be limited to 0–1. The convergence of the curve can be controlled by the parameter b and the curve can’t converge when b is larger than 1.5. It is recommended that the parameter b should be restricted in 1.0–1.2.
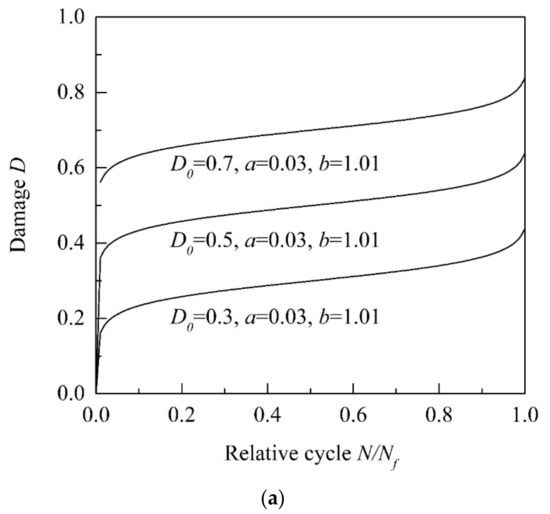
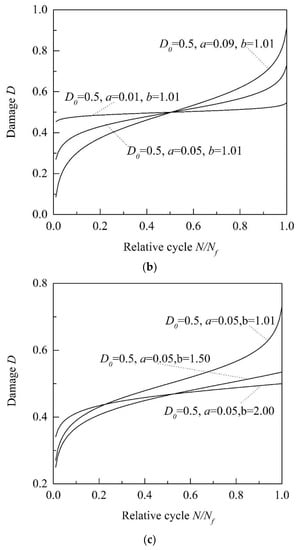
Figure 9.
Effect of the inverted S-curve parameters: (a) parameter D0; (b) parameter a; and (c) parameter b.
The strain data were collected during the test and the damage D was calculated according to Equation (3). The damage cumulative curve can be fitted based on Equation (5). As shown in Table 3 and Figure 10, taking the specimens S-2, S-4, and D-1 as examples, the three parameters can be obtained by fitting. The test data is obviously consistent with the fitted data and the fitted covariance are 0.9911, 0.9946, and 0.9951, respectively. It can be seen from Figure 10 that for the single-crack grouting specimen, the initial damage (D0) and the corresponding damage cumulative (a) increase with the increase of the stress level, which is consistent with the observations and strain changes during in the experiment. For the double-crack grouting specimen, it can be seen that the initial damage (D0) and the cumulative acceleration (a) are smaller than that of the single-crack specimen at the same stress level and stress ratio. Due to the good elasticity and toughness of the resin, the specimen can be enhanced by the resin which can decrease the initial damage and damage cumulative. The more injected resin, the more enhanced the effect. This indicates that the inverted S curve can better simulate the evolution of fatigue damage.
Table 3.
Parameter fitting results.
Figure 10.
Fitting result of the inverted S-curve.
5. Conclusions
Currently, the understanding on the fatigue properties of grouting reinforcement materials is still limited and its fatigue failure mechanism needs further investigation. In this study, the evolution of the fatigue damage was characterized by an analytical inverted S-shaped model according to the recorded maximum vertical deformation during the loading test. To reveal the mechanism of fatigue damage of rock-like materials after grouting enhancement, the uniaxial compression test under cyclic loading was carried out. The effect of the upper limit stress level, the stress ratio, and the stress amplitude on the fatigue life was studied. From the above discussion, some important conclusions can be drawn:
- (1)
- The cracks initiated in the middle of the specimen and propagated up and down around the slurry body. The grouting reinforcement could effectively avoid the stress concentration of the crack and made the specimen more complete and strong. The fatigue life decreases slowly, first, and then decreases rapidly with the increase of the stress amplitude. The upper limit stress level and the stress amplitude are two significant factors to the fatigue life.
- (2)
- The exponential function of the stress amplitude and the fatigue life was obtained through the S-N curve and the experimental data. There was also a double logarithmic linear relationship between the stress amplitude and the fatigue life.
- (3)
- The damage evolution is phased into three stages and the three stages can be observed from the tested specimens, which are influenced by the loading parameters (such as the upper limit stress level, the stress ratio, and the stress amplitude).
- (4)
- The fatigue damage evolution curve was acquired by the curve-fitting method through the experimental data, which is based on the Logistic model. An inverted S-shaped curve was obtained and used to describe the damage evolution. The fitting result was consistent with the experimental data.
This study exclusively focused on the fatigue damage of grouting-enhanced rock-like materials under constant amplitude fatigue condition. For the future work, the fatigue performance under variable amplitude loading will be investigated. In addition, the fatigue damage model for rock-like materials with different types of grouting materials will be studied in the future.
Author Contributions
Z.W. and L.L. designed the scheme, tested the data and wrote the paper; Q.D. and S.G. offered constructive suggestions for the fatigue test design; Q.D. and S.G. also helped to proofread the manuscript.
Funding
This research was funded by the National Natural Science Foundation of China, grant number [51404212]; the Foundation for University Key Teacher by the He’nan Educational Committee, grant number [2016GGJS-002]; the program of China Scholarships Council; grant number [201608410176]; the third author acknowledges the financial support from the China Scholarship Council, grant number [201406370141].
Conflicts of Interest
The authors declare no conflict of interest.
References
- Cerfontaine, B.; Collin, F. Cyclic and fatigue behaviour of rock materials: Review, interpretation and research perspectives. Rock Mech. Rock Eng. 2018, 51, 391–414. [Google Scholar] [CrossRef]
- Lv, S.; Liu, C.; Lan, J.; Zhang, H.; Zheng, J.; You, Z. Fatigue Equation of Cement-Treated Aggregate Base Materials under a True Stress Ratio. Appl. Sci. 2018, 8, 691. [Google Scholar] [CrossRef]
- Liu, Y.; Dai, F.; Dong, L.; Xu, N.; Feng, P. Experimental investigation on the fatigue mechanical properties of intermittently jointed rock models under cyclic uniaxial compression with different loading parameters. Rock Mech. Rock Eng. 2018, 51, 47–68. [Google Scholar] [CrossRef]
- Bańkowski, W. Evaluation of Fatigue Life of Asphalt Concrete Mixtures with Reclaimed Asphalt Pavement. Appl. Sci. 2018, 8, 469. [Google Scholar] [CrossRef]
- Lv, S.; Liu, C.; Chen, D.; Zheng, J.; You, Z.; You, L. Normalization of fatigue characteristics for asphalt mixtures under different stress states. Constr. Build. Mater. 2018, 177, 33–42. [Google Scholar] [CrossRef]
- Guo, Y.; Yang, C.; Mao, H. Mechanical properties of Jintan mine rock salt under complex stress paths. Int. J. Rock Mech. Min. Sci. 2012, 56, 54–61. [Google Scholar] [CrossRef]
- Erarslan, N.; Williams, D. Mechanism of rock fatigue damage in terms of fracturing modes. Int. J. Fatigue 2012, 43, 76–89. [Google Scholar] [CrossRef]
- He, M.M.; Chen, Y.S.; Li, N.; Zhu, C.H. Deformation and energy characteristics of sandstone subjected to uniaxial cyclic loading. J. China Coal Soc. 2015, 40, 1805–1812. [Google Scholar]
- Guo, Y.; Zhao, K.; Sun, G.; Yang, C.; Ma, H.; Zhang, G. Experimental study of fatigue deformation and damage characteristics of salt rock under cyclic loading. Rock Soil Mech. 2011, 32, 1353–1359. [Google Scholar]
- Royer-Carfagni, G.; Salvatore, W. The characterization of marble by cyclic compression loading: Experimental results. Mech. Cohes. Frict. Mater. 2000, 5, 535–563. [Google Scholar] [CrossRef]
- Cardani, G.; Meda, A. Marble behaviour under monotonic and cyclic loading in tension. Constr. Build. Mater. 2004, 18, 419–424. [Google Scholar] [CrossRef]
- Cattaneo, S.; Labuz, J. Damage of marble from cyclic loading. J. Mater. Civ. Eng. 2001, 13, 459–465. [Google Scholar] [CrossRef]
- Yang, S.; Tian, W.; Ranjith, P. Experimental investigation on deformation failure characteristics of crystalline marble under triaxial cyclic loading. Rock Mech. Rock Eng. 2017, 50, 2871–2889. [Google Scholar] [CrossRef]
- Wang, Z.; Li, S.; Qiao, L.; Zhao, J. Fatigue behavior of granite subjected to cyclic loading under triaxial compression condition. Rock Mech. Rock Eng. 2013, 46, 1603–1615. [Google Scholar] [CrossRef]
- Wang, Z.; Li, S.; Qiao, L.; Zhang, Q. Finite element analysis of the hydro-mechanical behavior of an underground crude oil storage facility in granite subject to cyclic loading during operation. Int. J. Rock Mech. Min. Sci. 2015, 73, 70–81. [Google Scholar] [CrossRef]
- Feng, C.; Wu, X.; Di, D. Investigation on fatigue characteristics of white sandstone under cyclic loading. Chin. J. Rock Mech. Eng. 2009, 28, 2749–2754. [Google Scholar]
- Yang, Y.; Song, Y.; Chu, J. Experimental study on characteristics of strength and deformation of coal under cyclic loading. Chin. J. Rock Mech. Eng. 2007, 26, 201–205. [Google Scholar]
- Xiao, J.Q.; Ding, D.X.; Xu, G.; Jiang, F.L. Inverted S-shaped model for nonlinear fatigue damage of rock. Int. J. Rock Mech. Min. Sci. 2009, 46, 643–648. [Google Scholar] [CrossRef]
- Wong, R.H.C.; Chau, K.T. Crack coalescence in a rock-like material containing two cracks. Int. J. Rock Mech. Min. Sci. 1998, 35, 147–164. [Google Scholar] [CrossRef]
- Kim, J.K.; Kim, Y.Y. Experimental study of the fatigue behavior of high strength concrete. Cem. Concr. Res. 1996, 26, 1513–1523. [Google Scholar] [CrossRef]
- Ren, J.X.; Ge, X.R. Study on rock meso-damage evolution law and its constitutive model under uniaxial compression loading. Chin. J. Rock Mech. Eng. 2001, 20, 425–431. [Google Scholar]
- Zhang, Q.X.; Ge, X.R.; Huang, M.; Sun, H. Testing study on fatigue deformation law of red-sandstone under triaxial compression with cyclic loading. Chin. J. Rock Mech. Eng. 2006, 25, 473–478. [Google Scholar]
- He, M.; Huang, B.; Zhu, C.; Chen, Y.; Li, N. Energy Dissipation-Based Method for Fatigue Life Prediction of Rock Salt. Rock Mech. Rock Eng. 2018, 51, 1447–1455. [Google Scholar] [CrossRef]
- Zhao, Y.R.; Wang, L.; Lei, Z.K.; Han, X.F.; Shi, J.N. Study on bending damage and failure of basalt fiber reinforced concrete under freeze-thaw cycles. Constr. Build. Mater. 2018, 163, 460–470. [Google Scholar] [CrossRef]
- Zhu, J.; Xiao, R.; Song, Y. Experimental Study on the Cumulative Fatigue Damage of Plain Concrete under Biaxial Compression. China Civ. Eng. J. 2005, 38, 104–109. [Google Scholar]
- Fan, X.; Jian, W. Experimental research on fatigue characteristics of sandstone using ultrasonic wave velocity method. Chin. J. Rock Mech. Eng. 2008, 27, 557. [Google Scholar]
- Jin, J.; Zhong, H.; Wu, Y.; Guo, Z.; Zhou, X. Method selection for defining damage variable of rock subjected to static loadings and cyclic impacts. Nonferrous Met. Sci. Eng. 2013, 4, 85–90. [Google Scholar]
- Yin, Z. Study on the fitting methods of logistic curve. J. Appl. Stat. Manag. 2002, 21, 41–46. [Google Scholar]
- Jin, J.; Li, X.; Qiu, C. Evolution model for damage accumulation of rock under cyclic impact loadings and effect of static loads on damage evolution. Chin. J. Rock Mech. Eng. 2014, 33, 1162–1671. [Google Scholar]
© 2018 by the authors. Licensee MDPI, Basel, Switzerland. This article is an open access article distributed under the terms and conditions of the Creative Commons Attribution (CC BY) license (http://creativecommons.org/licenses/by/4.0/).