3.1. Propagation Parallel to the 1D Phononic Nanoridge
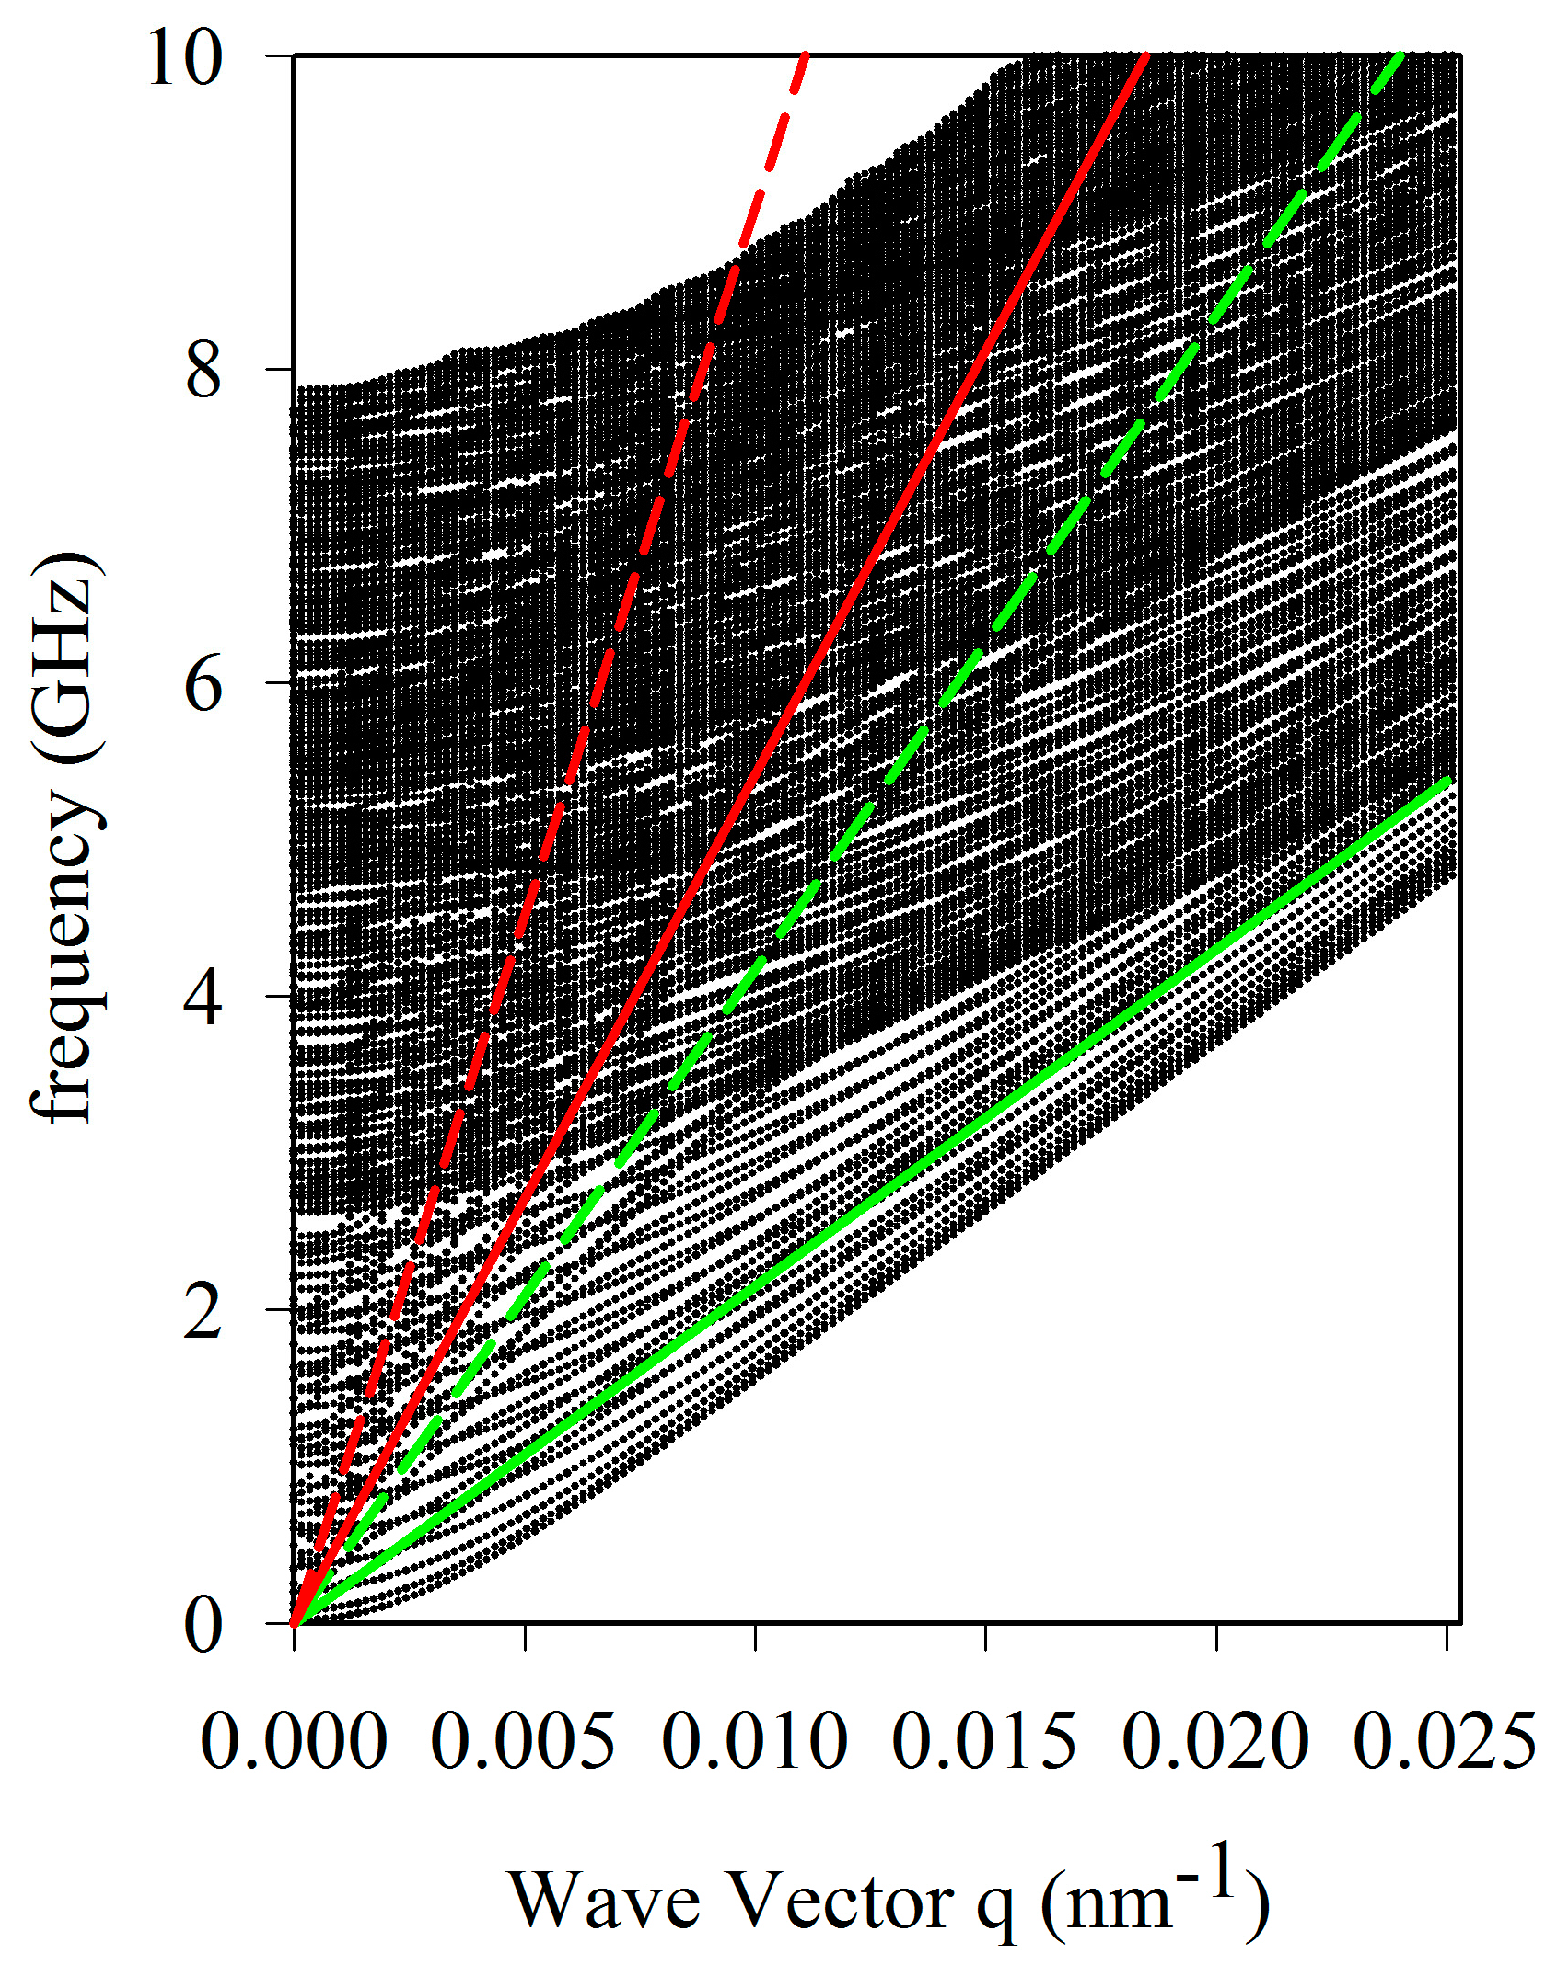
Figure 2 represents the dispersion curves for the propagation direction parallel to the nanoridges (along
x). Since the structure does not present any periodicity in this direction, we chose an arbitrary
q limit of 0.025 nm
−1 in accordance with typical BLS experiments [
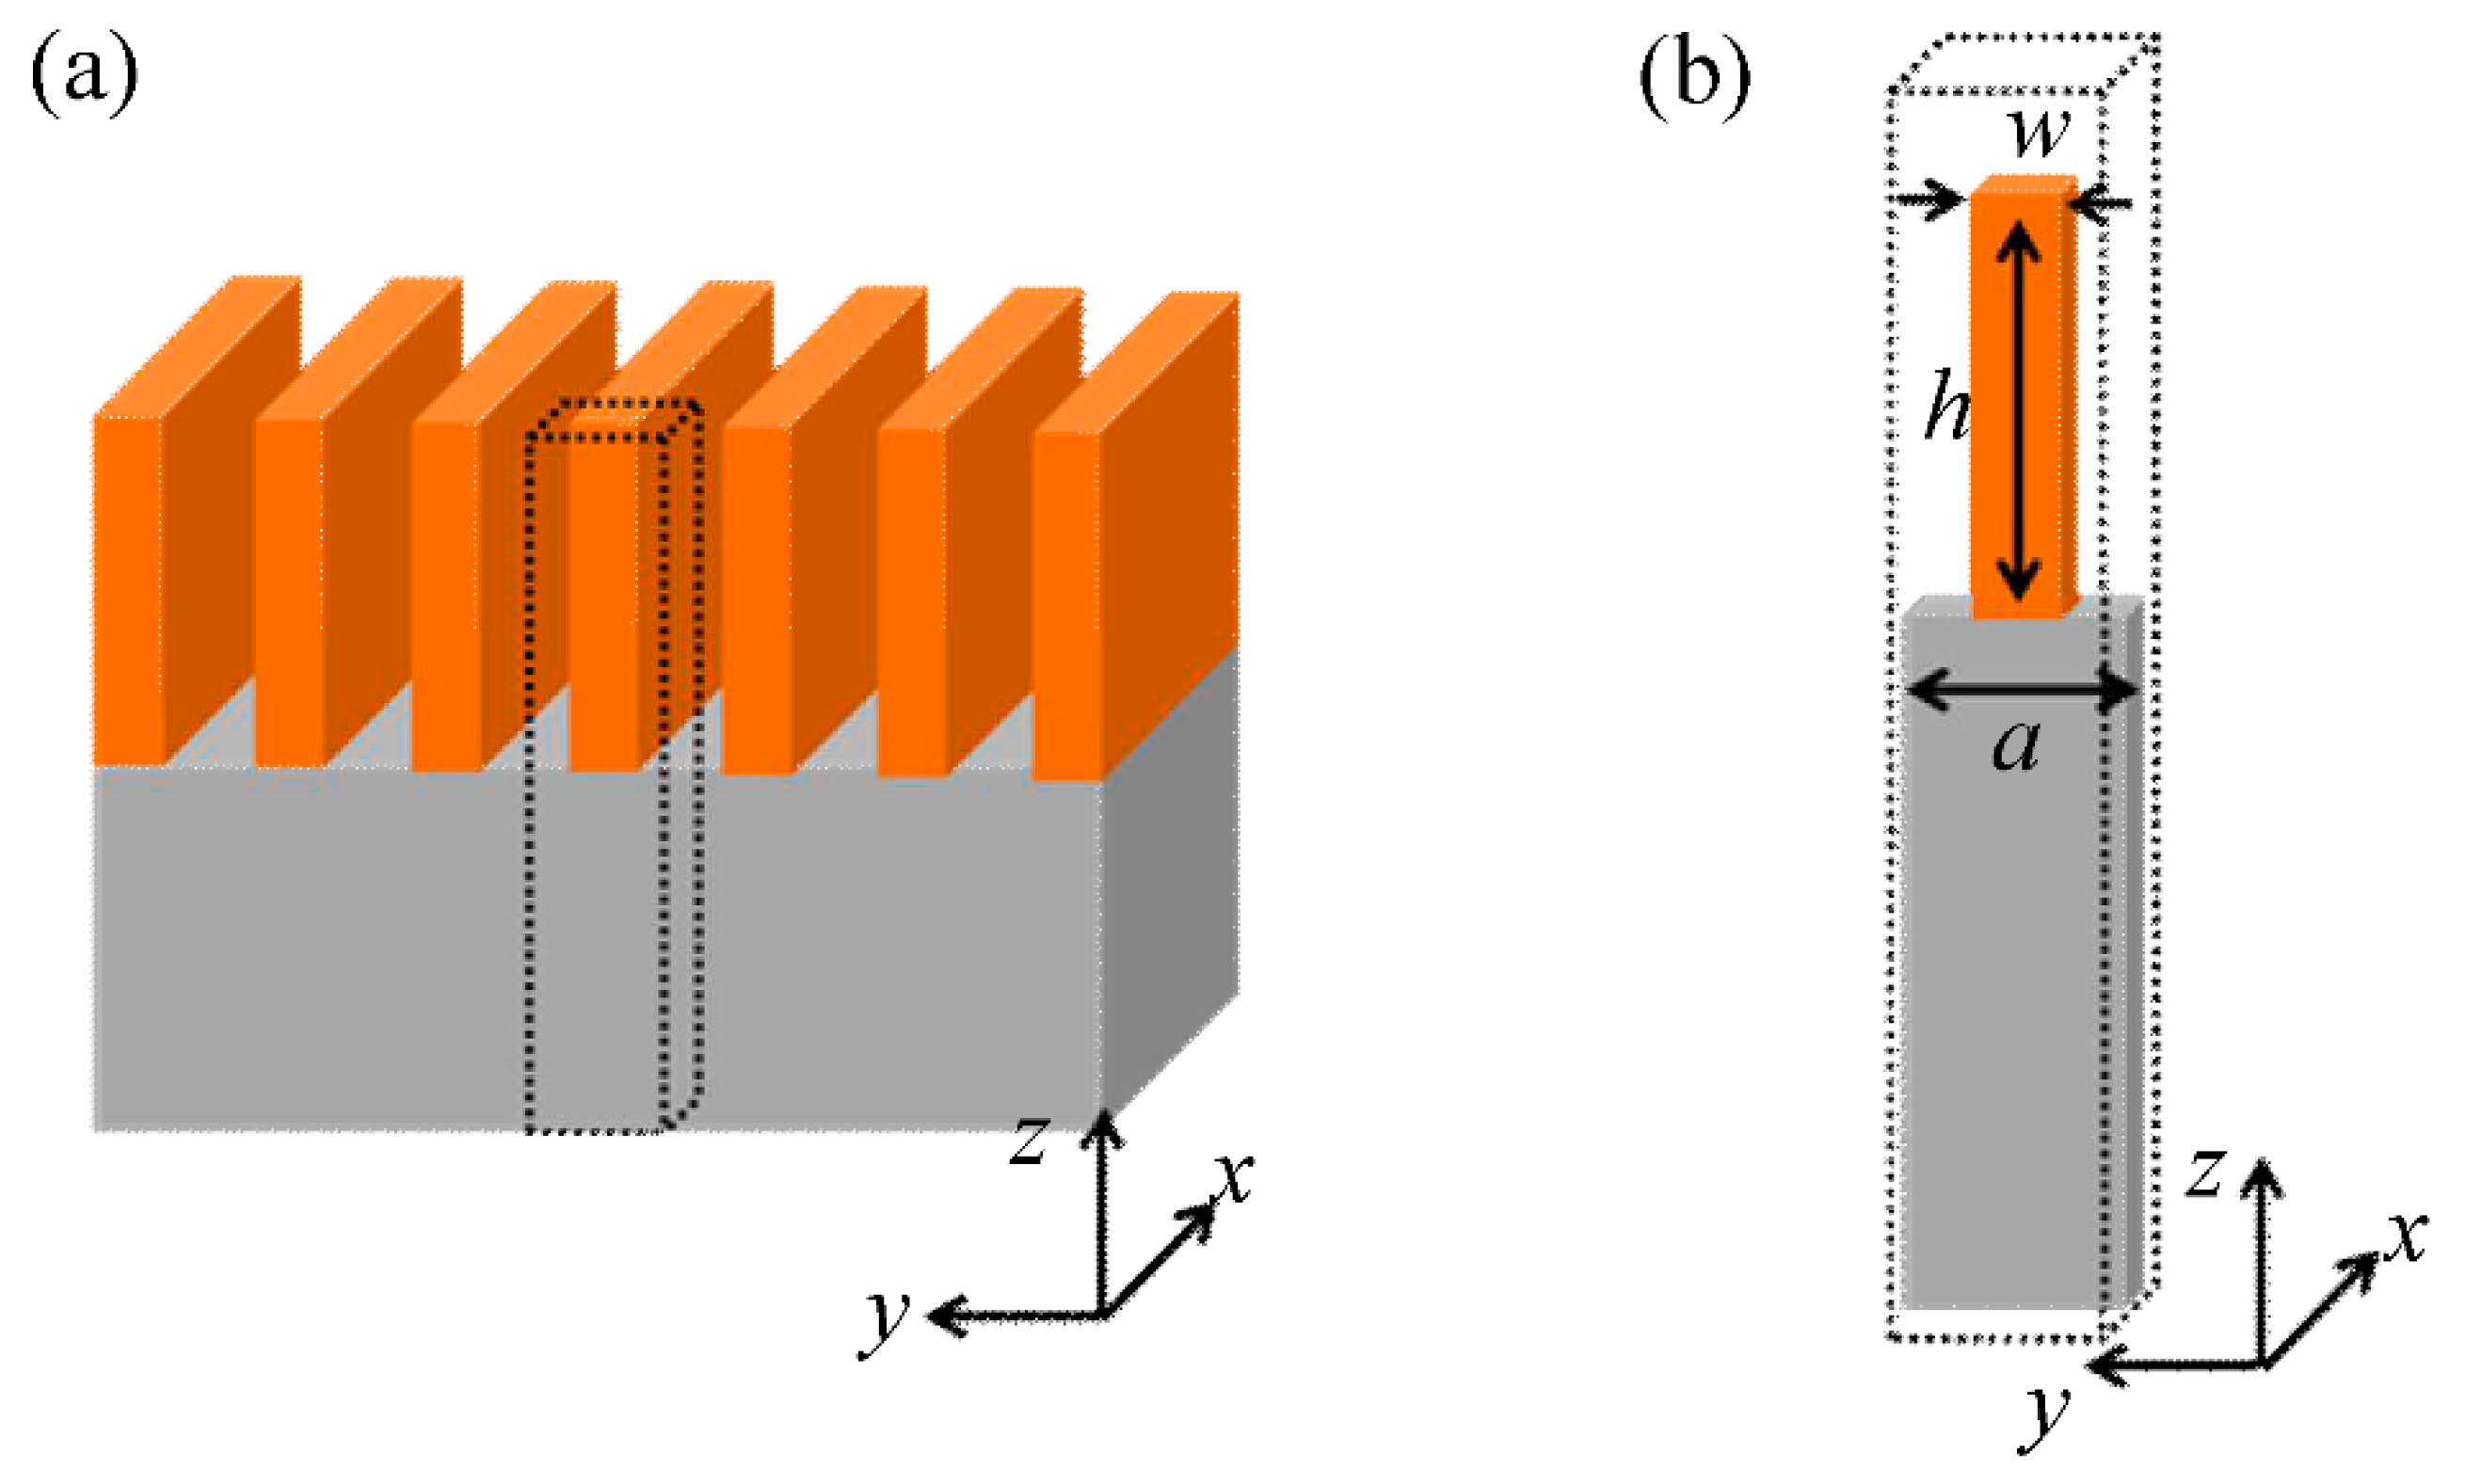
24]. The dispersion curves of the nanoridge structure are calculated with the following parameters:
a = 630 nm,
h = 2.7 µm, and
w = 250 nm. The calculated dispersion curves show a huge number of branches, mainly due to the high aspect ratio of the nanoridges (
AR = 10.2).
We report in color on the same diagram the bulk phase velocities (straight lines) of the involved materials. The red (green) dashed and solid lines correspond respectively to the longitudinal and transverse velocities of the glass (epoxy). In the following, our interest will be focused on the modes below the transverse sound lines of the glass substrate (red solid line), which are expected to be localized at the surface of the substrate and/or localized in the nanoridge phononic structure.
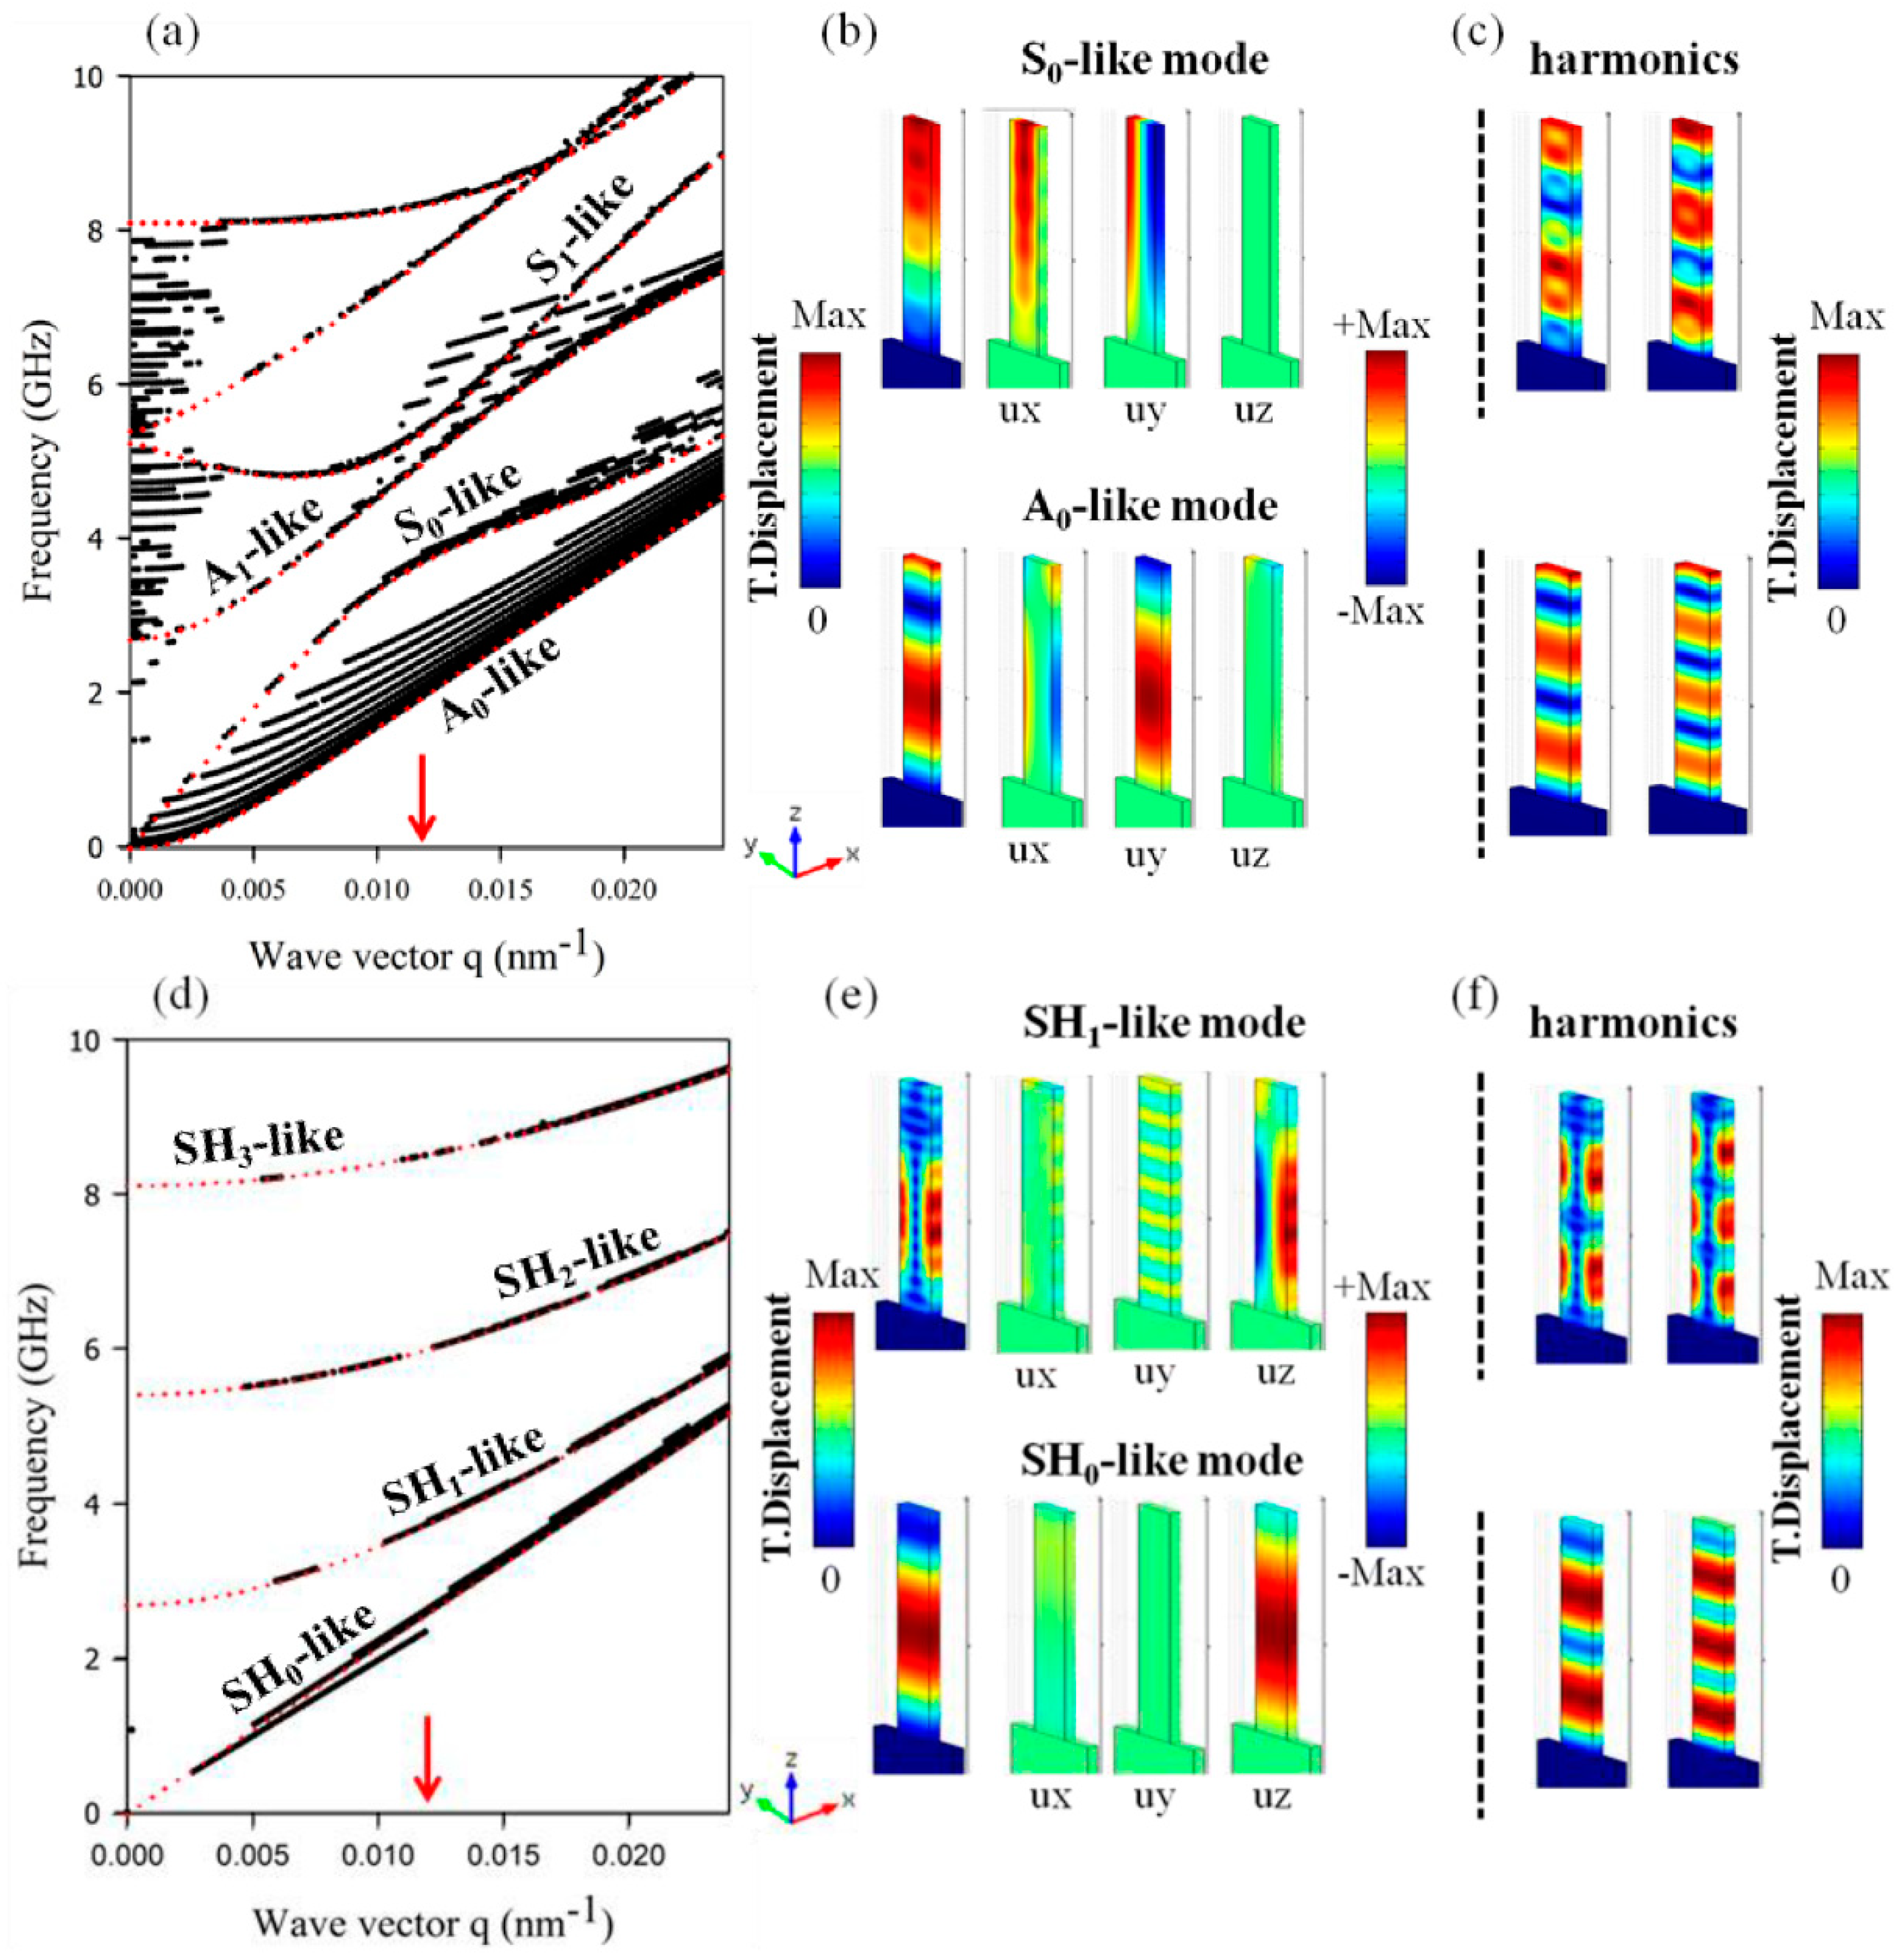
To go further and learn more about the localization and polarization of the surface acoustic modes, we proceed to a selection of modes using a band-sorting method, which enables us to keep only the modes that are highly confined inside the nanoridges. In addition, we divide them into two sets according to the following relations:
The expression
(resp.
) gives the contribution of the modes with the components
and
(resp.
), which are localized only inside the nanoridge. In particular, modes with high
and
(resp.
) components display a
(resp.
) close to 1. The black curves in
Figure 3a,d give respectively the dispersion branches obtained from the dispersion curves of
Figure 2 that satisfy the conditions
and
.
From a general point of view, one can notice that the highlighted black modes coincide with the Lamb modes of an infinite plate with respectively
xy and
z polarizations, as mentioned by Heyliger et al. [
25]. This conclusion is supported by the calculated dispersion curves of an infinite epoxy plate (red dotted lines) with a thickness of
w = 250 nm where we can notice a good similarity between the modes belonging to the nanoridge structure with the Lamb modes of the plate of epoxy. The reason for this similarity is due to the high aspect ratio of the nanoridge, which brings the vibration modes of the nanoridge in close connection to those of a single plate. We called these modes A
0, S
0, SH
0, and SH
1 ‘-like’ modes in reference to the antisymmetric and symmetric propagation modes of the plate that are commonly called A
n and S
n for the modes with
xy polarization, and SH
n for the modes with
z polarization. The calculation of the intensity of the displacement fields at the wave vector
q = 0.0135 nm
−1, which is indicated by a red arrow on the dispersion curves that are represented in
Figure 3b,e, clearly shows the localization of the field inside the nanoridge together with their components and symmetries. This confinement is in perfect agreement with the corresponding modes of an infinite plate (not shown here). However, and contrary to an infinite plate, each of the fundamental plate ‘like’ modes is followed by a set of higher harmonics corresponding to stationary waves along the height of the nanoridge, and displaying more and more oscillations in the vertical direction. An illustration of the second and third harmonics is presented in
Figure 3c,f.
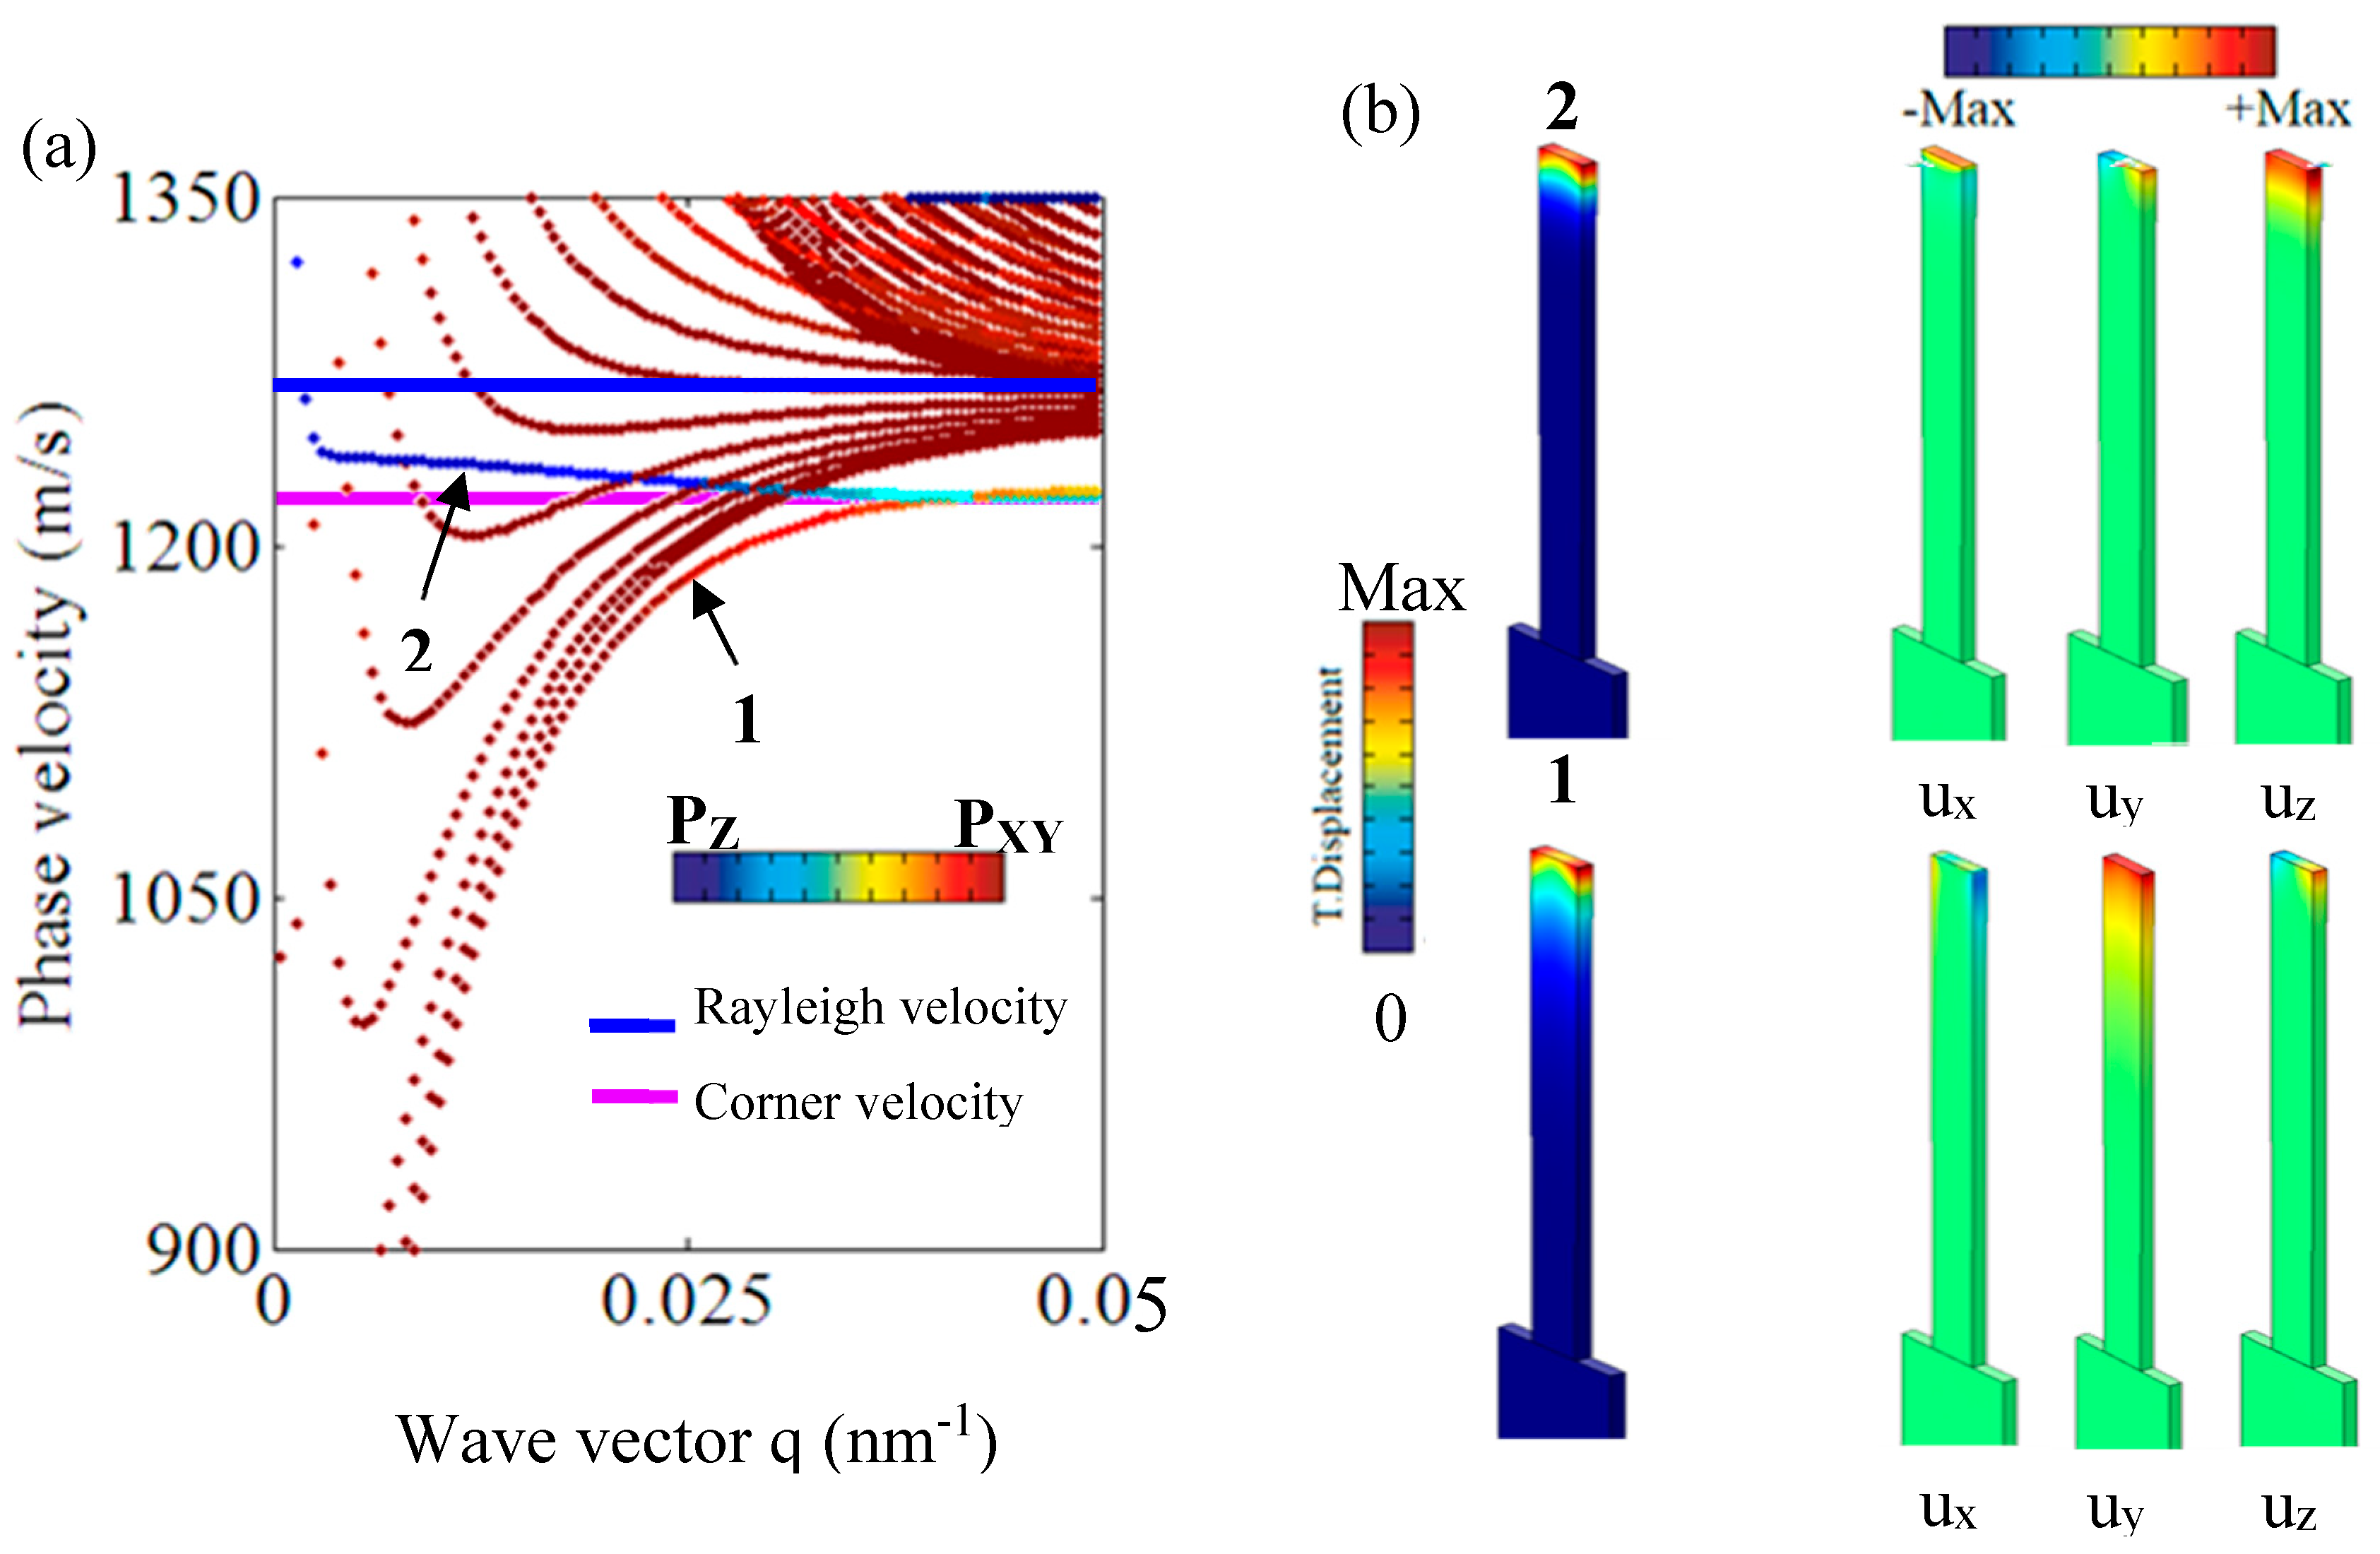
Another intriguing feature, which is actually not present in the dispersion curves of an infinite plate, concerns the modes lying in the region below the fundamental A
0-like mode of the nanoridge. To give a better representation of the full set of modes calculated in
Figure 2, we show in
Figure 4a the phase velocity diagram versus the wave vector
q. The diagram is represented with a band-sorting calculation following Equations (1) and (2). The red (resp. blue) color corresponds to modes that have a high value of
Pxy (resp.
Pz), meaning a strong
xy (resp.
z) polarization. As we can see, at a high-wave vector (
q = 0.05 nm
−1), the pseudo modes ‘A
0-like’ and ‘S
0-like’ of
xy polarization, and their harmonics, below the transverse velocity of epoxy (1350 m/s), move toward a new limit represented by a blue solid line. This line corresponds to the velocity of the well-known Raleigh wave of epoxy. It means that, at a high
q vector, the ‘A
0-like’ and ‘S
0-like’ modes move toward a localized mode at the surface of the nanoridge without fully penetrating inside the epoxy plate. In addition, two modes appear well below the Rayleigh wave velocity of epoxy and move towards another limit, which is represented by a pink solid line. As shown in
Figure 4b, these modes are localized in the corners of the nanoridges. Moreover, one of the two modes is
xy polarized (mode 1), while the other is
z polarized (mode 2). This conclusion is supported both by the color of the modes ‘1′ and ‘2′ in
Figure 4a and the components of their elastic fields, as represented
Figure 4b. It is well known that such wedge waves, which are confined at solid edges, exhibit a phase velocity below those of surface and bulk waves [
26]. These modes exist because of the finite size of the nanoridge.
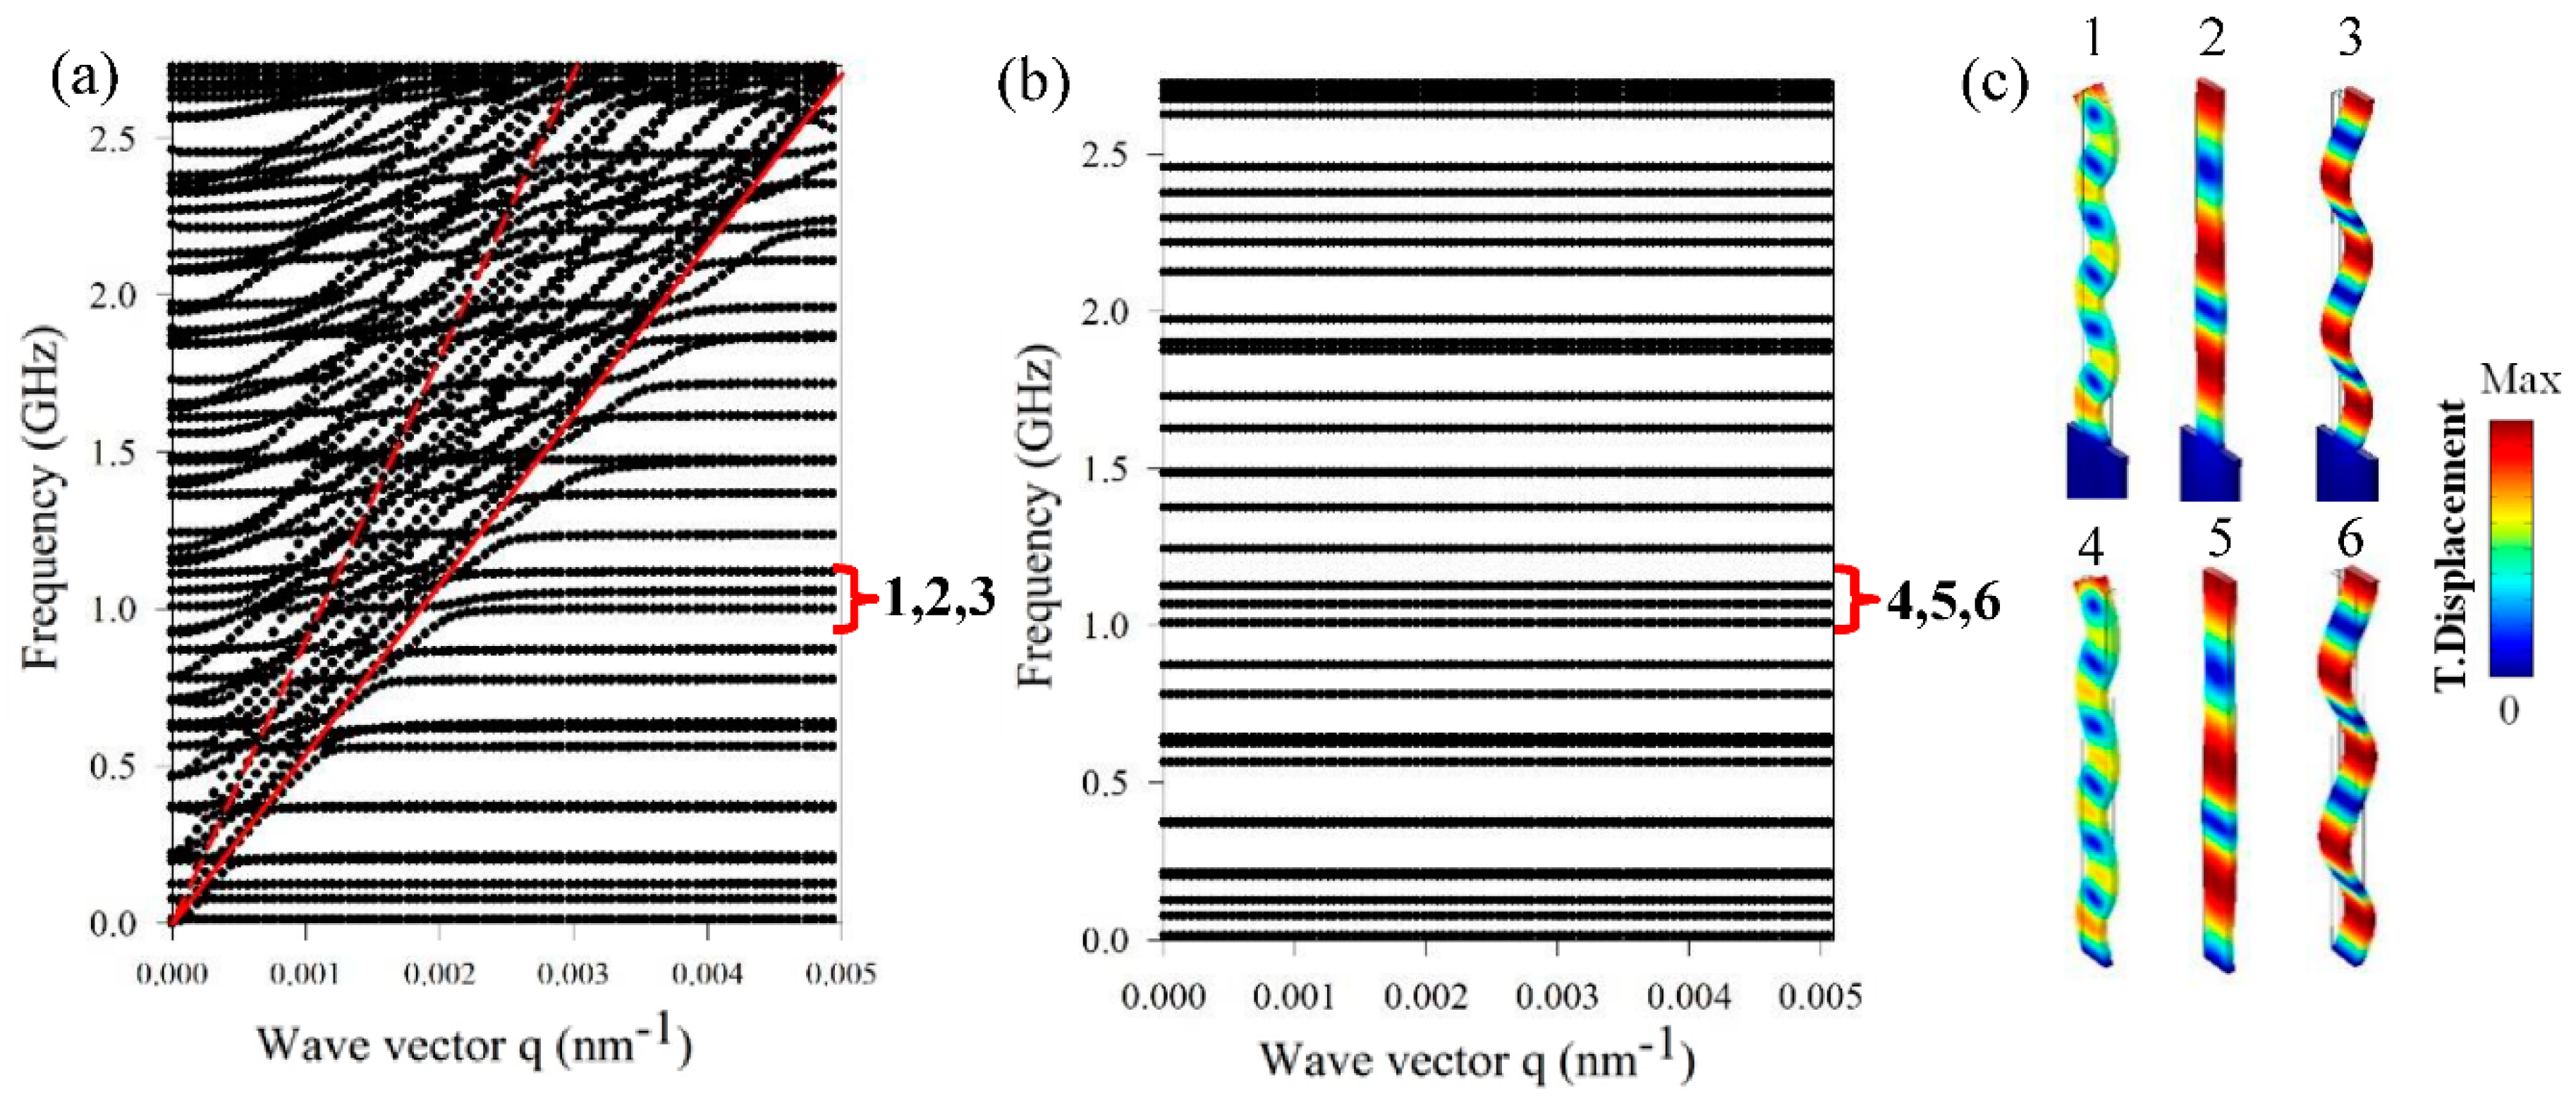
3.2. Propagation Perpendicular to the 1D Phononic Nanoridge
We now consider the propagation along the direction perpendicular to the nanoridges of the same height and width, namely:
h = 2.7 µm and
w = 250 nm. The corresponding dispersion curves (
Figure 5a) in the non-radiative region below the sound cone of the substrate display many flat branches with zero group velocities. It means that the modes do not propagate, and are strongly confined in the nanoridges. To understand the origin of these modes, we proceed to the calculation of the eigenmodes of a single nanoridge that is fixed at the bottom (
Figure 5b). It results that the eigenfrequencies of the single nanoridge almost perfectly match the frequencies of the flat dispersion curves of the 1D nanoridge. This result is confirmed through an analysis of the displacement fields at the frequencies 1, 2, and 3 (
Figure 5a). One can see that the distribution of the displacement fields of modes 4, 5, and 6 of the one side fixed plate (
Figure 5b) exhibit the same behavior as those of the supported ridges. Just below the sound line of the SiO
2 substrate, one can see that the flat branches interact with the surface Rayleigh mode, give rise to small anticrossings, and possibly lead to the opening of the small band gaps.
3.3. Effect of the Geometrical Parameters
The previous calculations have been realized in the particular case of a high aspect ratio of the nanoridges. In what follows, we investigate the effect of the geometrical parameters of the nanoridges for the directions that are parallel and perpendicular to the nanoridges.
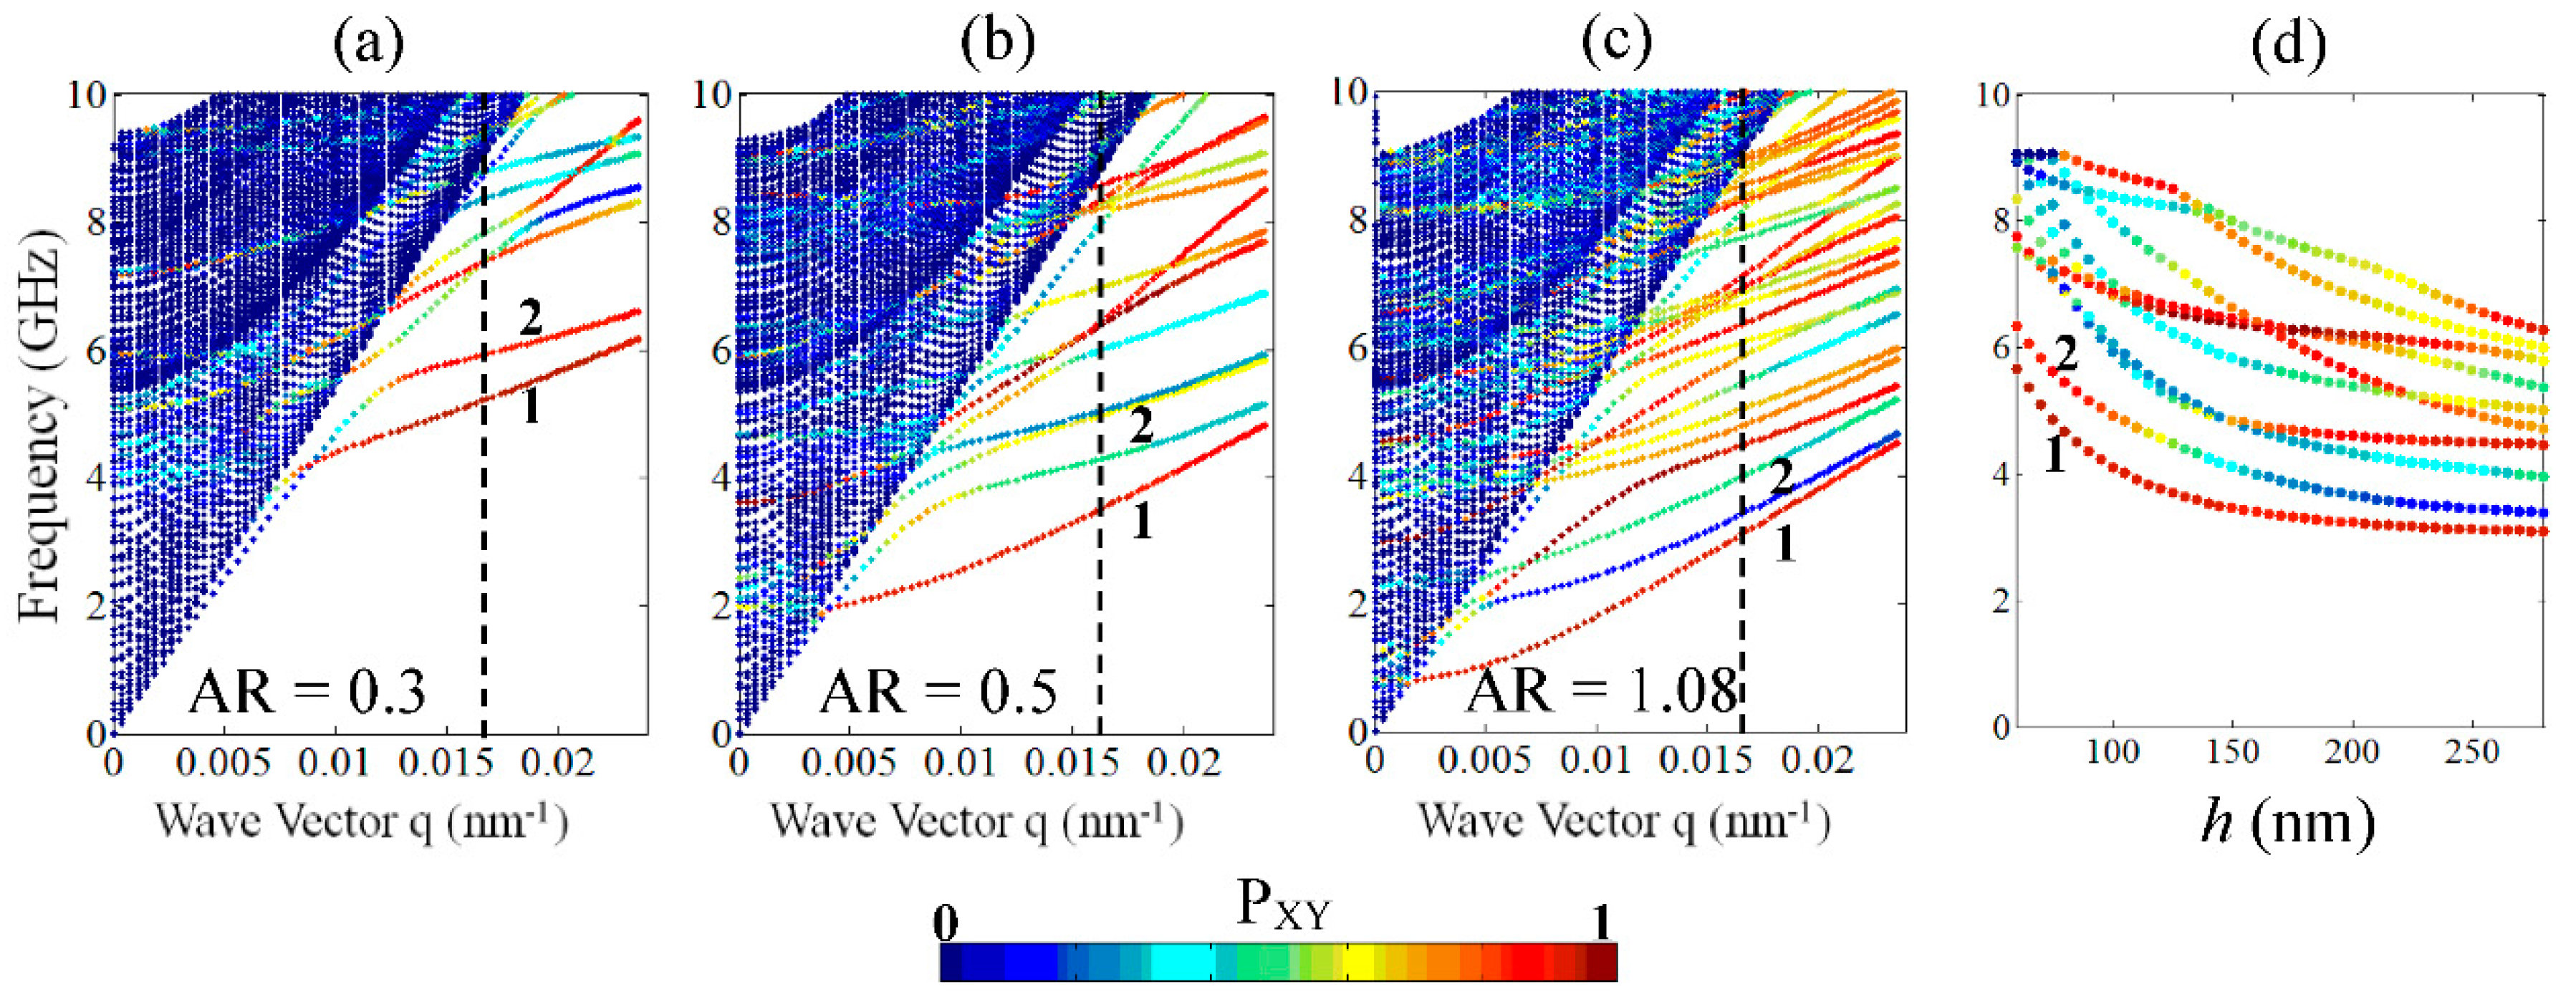
Figure 6 shows the dispersion curves for the parallel propagation direction to the nanoridges for three values of height:
h = 68 nm (i.e.,
AR = 0.3),
h = 135 nm (i.e.,
AR = 0.5), and
h = 270 nm (i.e.,
AR = 1.087). The band diagrams are represented with a band-sorting calculation, which highlights the modes inside the nanoridges as a function of their ‘in-plane’
Pxy polarization with a color bar, following Equation (1).
Two features can be noticed from the analysis of the band diagrams. First, one can see that, as predicted, the number of branches increases with the height
h of the nanoridges, leading to the limiting case that is presented in
Figure 2 (
AR = 10.2). For the low aspect ratios, the behavior of the branches cannot be compared to A
0 and S
0-like modes of a single plate, as shown previously for high AR. Second, one can see that the polarizations of the branches generally change when the height increases. For example, when
h = 68 nm, branch 2 is red, indicating that the mode is polarized in the (
x,
y) plane; meanwhile, when the height increases, the second branch becomes green for
h = 135 nm and blue for
h = 270 nm, meaning that the polarization becomes along
z (
Pz close to 1).
Figure 6d reports in detail the evolution of the frequency of the first 10 modes and their polarization as a function of the height
h for a fixed wave vector
q = 0.0167 nm
−1. Focusing specifically on branch 2, one can notice a progressive conversion of the polarization from
xy to
z (red to blue color) as far as the height of the nanoridge increases. At the same time, the polarization of branch 1 remains unchanged. Such a physical behavior can have a considerable effect on the BLS experimental measurements spectra where the polarization plays a central role [
27]. One can note that branch 1 corresponds to the A
0-like mode, and branch 2 corresponds to one of the edge modes.
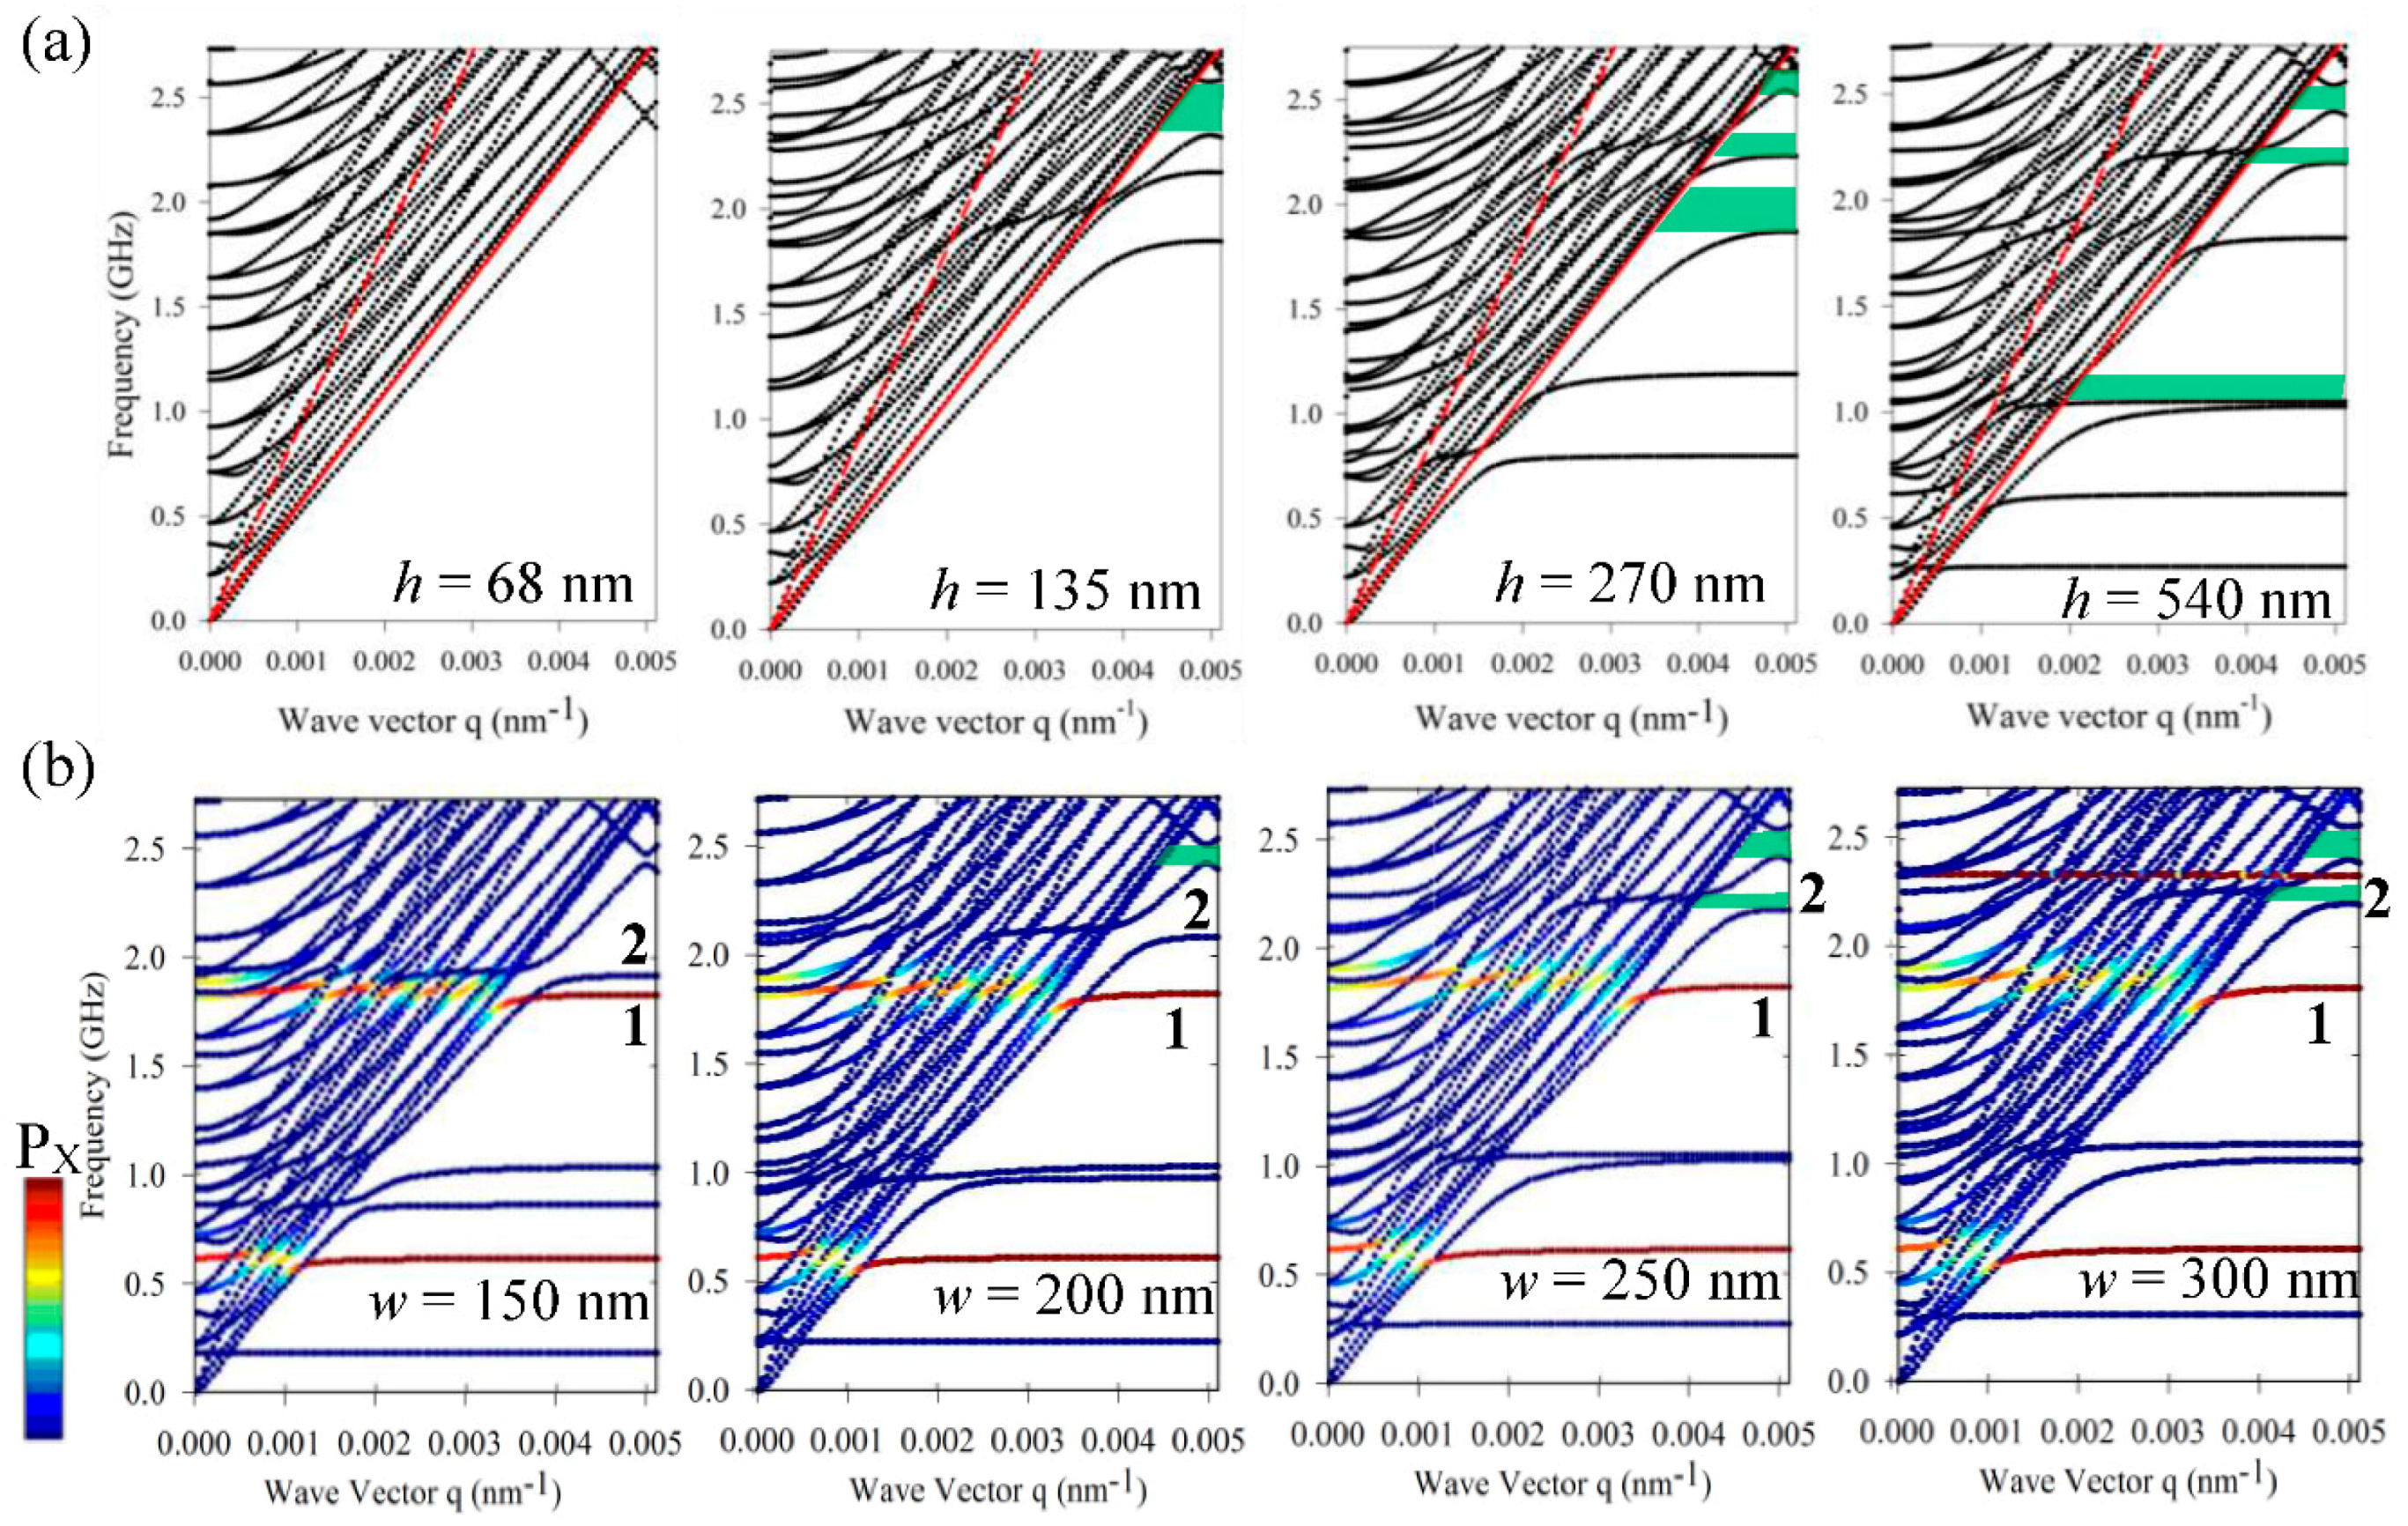
Figure 7 sketches the evolution of the dispersion curves as a function of the geometrical parameters of the nanoridge for the direction perpendicular to the nanoridges. When the height of the nanoridge increases from 68 nm to 540 nm, with the the thickness
w = 250 nm being constant, one can see that the number of flat branches increases and shifts to low frequencies. As mentioned in the previous section, the flat branches correspond to eigenmodes of the clamped nanoridge. In the band structures of
Figure 7, one can see the occurrence of small band gaps where the surface acoustic waves cannot propagate at the surface of the substrate (green area).
Similarly, we proceed to the calculation of the dispersion curves as a function of the width
w from 150 nm to 300 nm, for a constant value of the height
h = 540 nm (
Figure 7b). In this case, some of the branches shift to high frequencies (see for instance the branch labeled 2), while others slightly decrease toward low frequencies (see for instance the branch labeled 1). To find the origin of such a behavior, we proceed to a band-sorting calculation and represent bar the modes inside the nanoridges of polarization
x, i.e., in the direction of propagation, with a color. Within this representation, one can clearly see that the width of the nanoridges affects the branches of vibration that are polarized respectively parallel and perpendicular to the propagation direction.
3.4. Infiltration with a Liquid
In this last section, we have filled the grooves between the nanoridges with a polymer liquid with the commercial name ‘Cargille’. This polymer has a density of 1000 kg/m
3 and a longitudinal velocity of 1670 m/s. The contrast between epoxy and Cargille comes from their different physical natures, i.e., liquid and solid, while the densities are almost the same (see
Table 1). The nanoridge structure that was considered for the calculations presents the following parameters:
a = 630 nm,
h = 2.7 µm, and
w = 250 nm. In the numerical FEM model, free stress boundary conditions have been applied at the surface of the liquid, on top of the unit cell. At the liquid/solid interface, the normal component of the displacement, as well as the normal stress, are continuous. We do not include capillary forces, which at the considered wavelengths should be significant at much lower frequencies than those (GHz) considered in this work. The validity of the model is also supported by our previous investigations of solid/liquid phononic crystal, in which we obtained a good agreement between the experimental and the theoretical band structure using the same numerical model [
24,
28].
As the structure is mixed, i.e., contains simultaneously a liquid and a solid, we have to adapt the method of calculation to these two different media. First, the solid part follows the elastic wave equation:
where
represents the density,
represents the angular frequency,
u represents the displacement field vector, and
represents the stress tensor. Second, the liquid part of the structure is computed with the pressure equation of propagation:
where
p represents the acoustic pressure, and
c represents the sound velocity in the liquid.
At the solid/liquid interface, the boundary conditions are given by the continuity of the displacements and stress normal components. These conditions are given by the two equations:
where
is the normal direction at the solid/liquid interface,
is the stress tensor,
is the displacement field in the solid, and
p is the pressure field in the liquid part.
We then calculated the dispersion curves of the phononic crystal infiltrated with the liquid (Cargille) in the two directions of propagation: parallel and perpendicular to the nanoridges.
For the direction parallel to the nanoridges, we applied a band-sorting calculation to select, among the huge number of modes, those that presented an ‘in-plane’ polarization
Pxy that was close to 1 (Equation (1)). To do so, the components of the displacement field in the liquid part have been deducted from the following equations:
The results of the calculations are presented in
Figure 8a where only the modes that satisfied the condition
were kept. These curves can be compared with
Figure 3a for the structure without the infiltration. Let us remind that in the latter case, the modes have been attributed to fundamental Lamb-like modes of the nanoridges and their harmonics. Similarly, we have performed the calculation of a 1D infinite multilayer array alternately constituted of epoxy and Cargille. The corresponding dispersion curves are presented with blue color on the same figure. When we compare the two dispersion curves, one can see that the branches of the 1D nanoridges structure infiltrated with Cargille can be associated to the fundamental modes of the 1D infinite multilayer array. In addition, due to the finite size effect of the nanoridges in the vertical direction, the fundamental modes are followed by many others that correspond to higher orders of vibration (harmonic modes)
For propagation in the direction perpendicular to the nanoridges (
Figure 8b), we also show in blue the dispersion curves of the infinite 1D periodic epoxy/Cargille multilayer. The dispersion curves of the actual structures, under the condition
, can qualitatively be distinguished into the following three categories. (i) Above the SiO
2 transverse velocity (red line), the selected modes are localized inside the 1D periodic structure, but can couple to the semi-infinite substrate. Such modes are known as leaky waves. (ii) The modes situated below the transverse velocity of SiO
2 (red solid line) and above the lower blue branch are dispersive modes that result from propagation inside the multilayer and interact with the surface of the substrate. They are analogous to the Sezawa waves that are associated with an ad-layer deposited on a substrate. (iii) The branches below the lower blue curve are almost flat, which represents a signature of their localization in the 1D periodic nanostructure. Indeed, as the flat bands fall below the longitudinal velocity of sound in the fluid (Cargille), these modes do not propagate in the fluid.
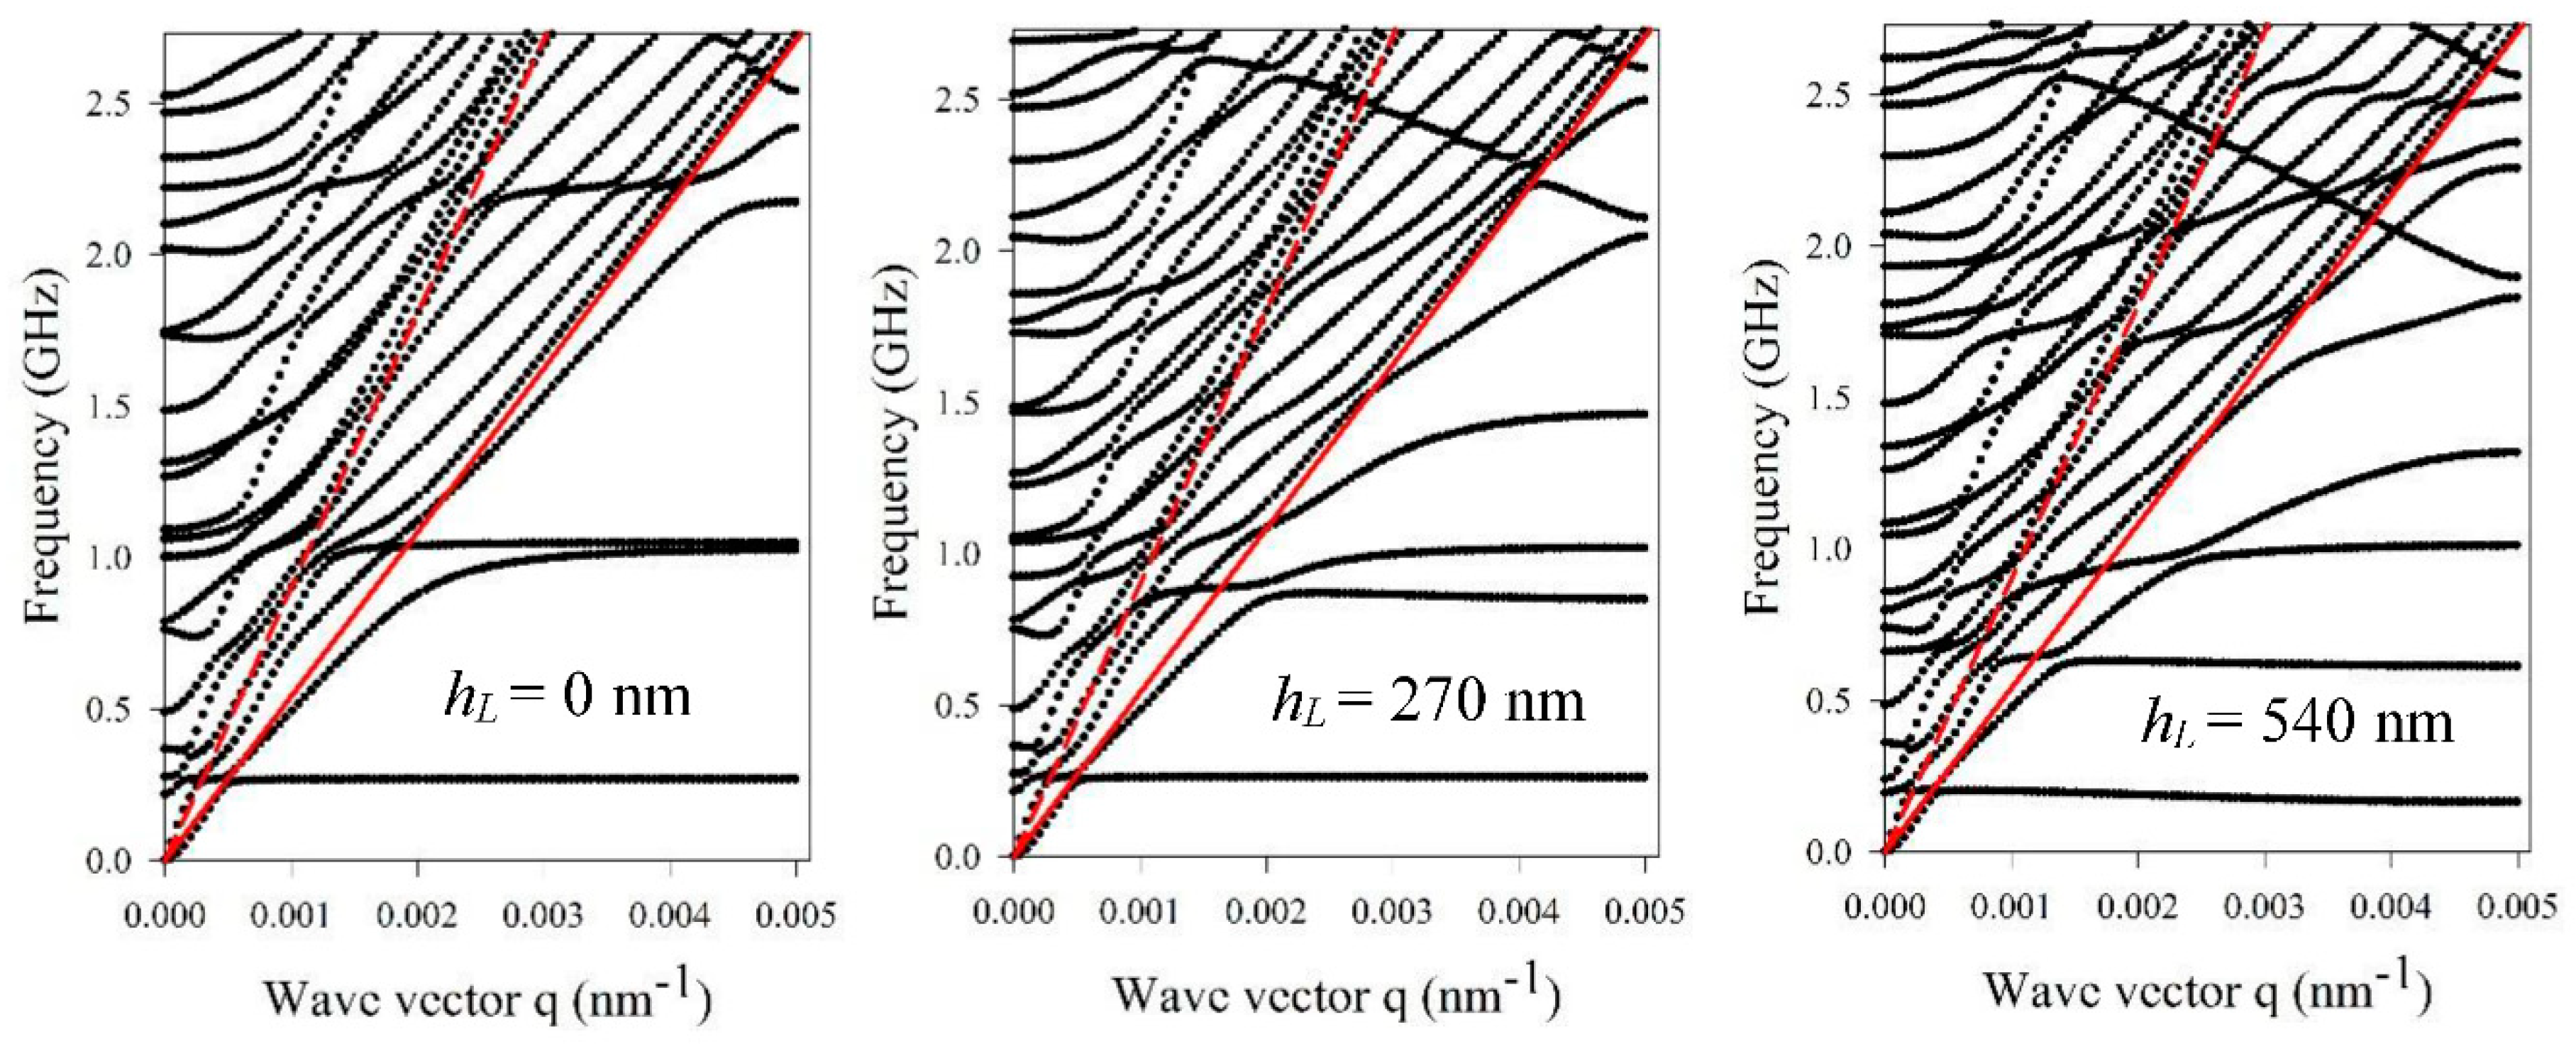
In
Figure 9, we discuss the evolution of the dispersion curves as a function of the height of the liquid filling the grooves. The left panel in
Figure 9 recalls the dispersion curves corresponding to the nanoridges with a height of 540 nm without infiltration. The middle and right panels in
Figure 9 present the calculation when the grooves are filled with two different heights of the liquid polymer: 270 nm and 540 nm, respectively. In each case, one can see that the level of liquid drastically modifies the dispersion curves with the creation of new branches. As discussed previously, these new dispersive branches present a group velocity that is different from zero, and associated with propagating waves at and above the surface of the semi-infinite glass substrate. This propagation can be understood as the ridges now being connected through the grooves filled with a liquid. Therefore, the modes can now propagate through the 1D multilayer array on top of the semi-infinite substrate.

 ,
, 


