Article

A Shack-Hartmann Sensor for Single-Shot Multi-Contrast Imaging with Hard X-rays

1
Karlsruhe Institute of Technology (KIT), Institute for Photon Science and Synchrotron Radiation (IPS), Herrmann-von-Helmholtz-Platz 1, 76344 Eggenstein-Leopoldshafen, Germany
2
New Mexico State University (NMSU), Department of Physics, 1255 N Horseshoe, Las Cruces, NM 88003-8001, USA
3
Physical-Technical Institute, Tomsk Polytechnic University (TPU), Lenin Avenue 30, 634050 Tomsk, Russia
4
Karlsruhe Institute of Technology (KIT), Institute of Microstructure Technology, Hermann-von-Helmholtz Platz 1, 76344 Eggenstein-Leopoldshafen, Germany
5
Los Alamos National Laboratory, Los Alamos, NM 87545, USA
6
Karlsruhe Institute of Technology (KIT), Laboratory for Applications of Synchrotron Radiation (LAS), Engesserstrasse 15, 76131 Karlsruhe, Germany
*
Author to whom correspondence should be addressed.
Current address: Canadian Light Source, 44 Innovation Boulevard Saskatoon, Saskatoon, SK S7N 2V3, Canada.
Appl. Sci. 2018, 8(5), 737; https://doi.org/10.3390/app8050737
Submission received: 3 April 2018 / Revised: 27 April 2018 / Accepted: 27 April 2018 / Published: 7 May 2018
(This article belongs to the Special Issue Advanced EUV and X-Ray Optics)

Abstract

:
An array of compound refractive X-ray lenses (CRL) with 20 × 20 lenslets, a focal distance of 20cm and a visibility of 0.93 is presented. It can be used as a Shack-Hartmann sensor for hard X-rays (SHARX) for wavefront sensing and permits for true single-shot multi-contrast imaging the dynamics of materials with a spatial resolution in the micrometer range, sensitivity on nanosized structures and temporal resolution on the microsecond scale. The object’s absorption and its induced wavefront shift can be assessed simultaneously together with information from diffraction channels. In contrast to the established Hartmann sensors the SHARX has an increased flux efficiency through focusing of the beam rather than blocking parts of it. We investigated the spatiotemporal behavior of a cavitation bubble induced by laser pulses. Furthermore, we validated the SHARX by measuring refraction angles of a single diamond CRL, where we obtained an angular resolution better than 4 μ rad.

Graphical Abstract

1. Introduction

The broad availability of X-ray sources such as synchrotrons and free electron lasers with very high brightness paved the way to tackle the formidable demands of imaging the structural evolution of hierarchical materials by means of multi-contrast imaging. Phase-contrast imaging modalities assess the relative variations in the real part of the refractive index (propagation-based phase-contrast [1,2,3], crystal-based [4], edge illumination method [5], and grating-based interferometry [6,7,8,9,10]). Grating-based interferometry and diffraction-enhanced imaging can additionally provide scattering contrast, thereby extending the accessible information to the full set of scalar wave-matter interactions in transmission geometry [11]. However, the requirement to record several sub-images interrupted by mechanical motion (either with different sample positions, different relative positions of the gratings, or different angles of the analyzer crystal) complicate the investigation of dynamics on the microsecond scale [12]. Successful approaches have used a canted interferometer setup to retrieve the phase shifts by Fourier analysis of the Moiré pattern [9] and could use polychromatic X-rays [13].
Hartmann sensors for X-rays provide single-shot differential phase-front measurements [14,15,16]. By using absorption gratings, however, a large fraction of the incident radiation is absorbed in the optical element and cannot contribute to the signal and therefore reducing the achievable signal-to-noise ratio for a given integration time.
We show the application of the analogue of a Shack-Hartmann sensor in the hard X-ray spectral range (SHARX), which permits for single-shot imaging of absorption, phase and diffraction contrast. This is quantitatively equivalent to the Hartmann-mask approach [14,15,16,17,18], or even conceptually similar to methods with structured X-ray beams [19,20,21]. Due to the use of focusing lenslets [22,23,24] the local X-ray flux density is increased strongly, leading to an improved signal-to-noise ratio even at shortest integration times. The availability of diffraction contrast extends the accessible length scales [25,26]. With a spatial resolution of the pitch of the SHARX (here 50 μ m) structures in the nanometer up to sub-micrometer regime can be imaged.
Since a single image is sufficient for obtaining the three contrast types simultaneously, contrast variations on the microsecond time scale can be used to judge how the structural dynamics on different length scales influence each other and the overall evolution of the material properties [27].

2. Material and Methods

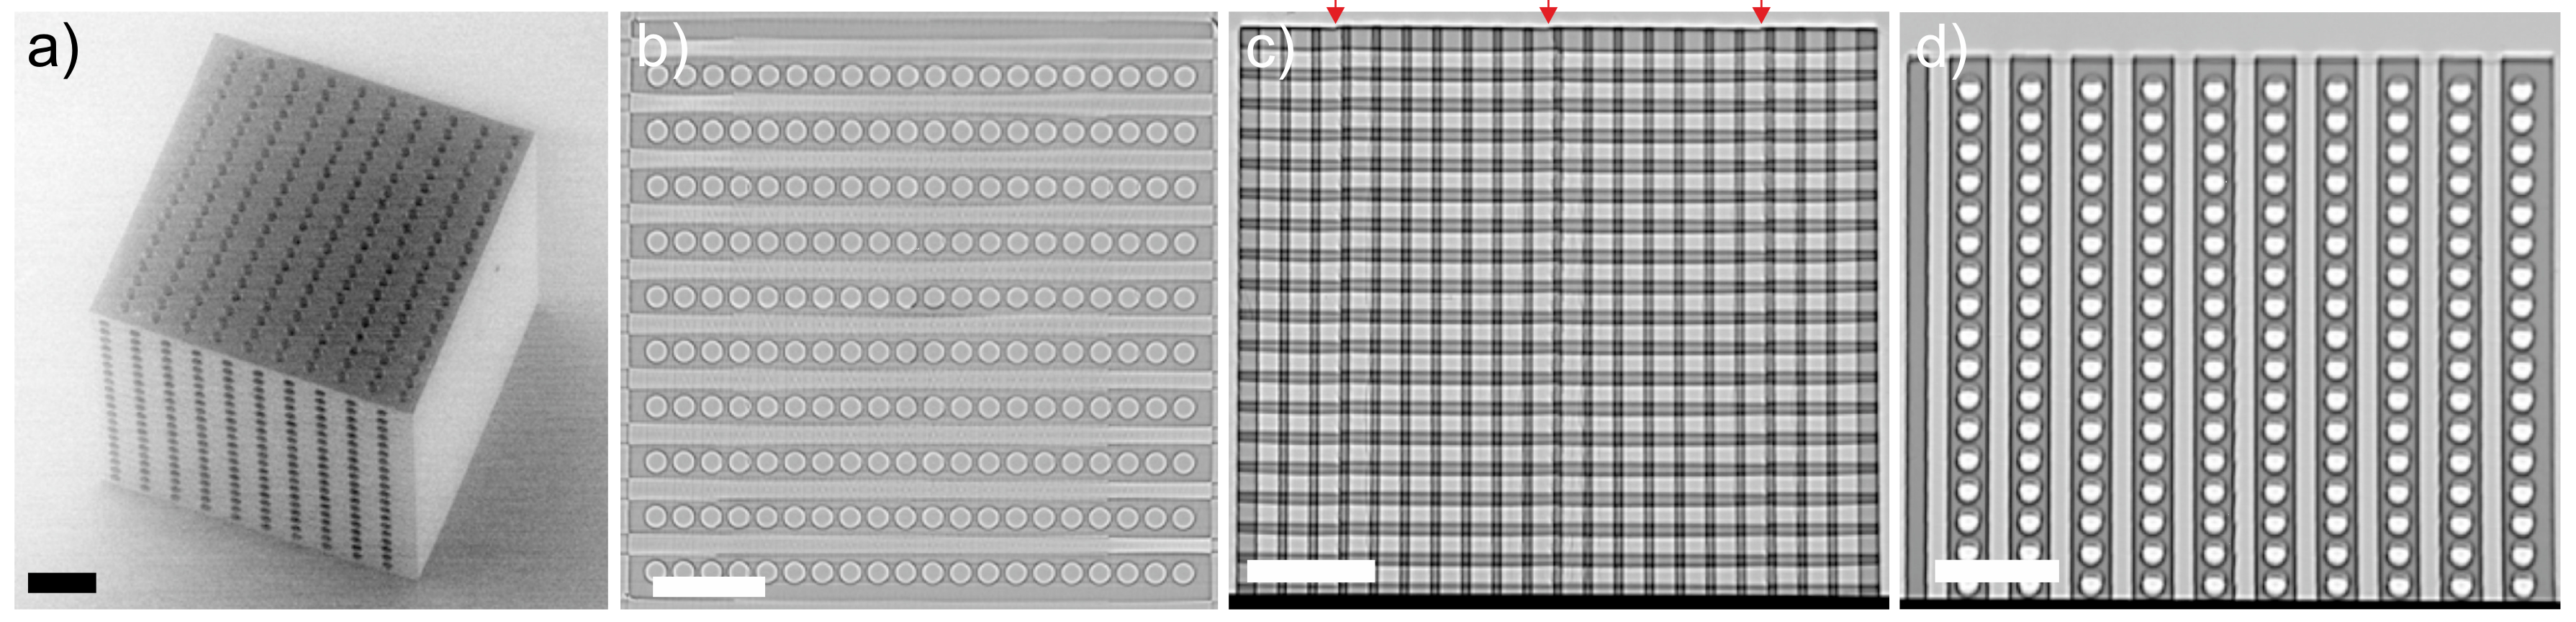
2.1. Fabrication of the 2D Lens Array

In Figure 1 we present the hard X-ray analogue to a visible-light array of lenslets in the shape of a 3D hole structure fabricated from a low-absorbing polymer [28,29]. The 3D structure with crossed hollow cylinders of 40 μ m in diameter, a periodicity of 50 μ m and a total volume of 1 mm 3 has been fabricated by using a state-of-the-art three-dimensional direct laser writing system (Photonic Professional GT, Nanoscribe GmbH, Eggenstein-Leopolds­ha­fen, Germany). A commercial photoresist (IP-S, Nanoscribe GmbH) and a 25× magnification objective (0.8 NA) were used. The structure was fabricated in dip-in mode, meaning that the objective is immersed in the photoresist. After the writing process, the structure was developed in mr-Dev 600 (micro resist technology GmbH, Berlin, Germany).
Each cylinder acts as a one-dimensional lens and the serial stacking shortens the focal length of the compound refractive lens (CRL) [22,24]. The orthogonal combination of crossed cylinders in the beam propagation direction leads to a focusing of the beam in two directions. This results in well-defined spots that can be used analogously to Hartmann-mask beamlets. The benefits of this arrangement are manifold. The majority of photons from a lenslet aperture are concentrated on the beamlet area leading to a reduced exposure time due to the increased local photon flux density compared to the unfocused primary beam when using gratings or Hartmann-masks. Furthermore, the differential phase sensitivity can be adjusted to a certain extent by changing the sample-to-detector distance. The required lenslet pitches of tens of micrometers for hard X-ray diffraction experiments permit to vary cylinder diameters, grating materials and fabrication methods, and therefore tune the respective optical element for experimental demands. In particular, diffraction contrast is sensitive to length scales that can be tuned by the distance of the object to the detection plane and the array pitch [25,26].

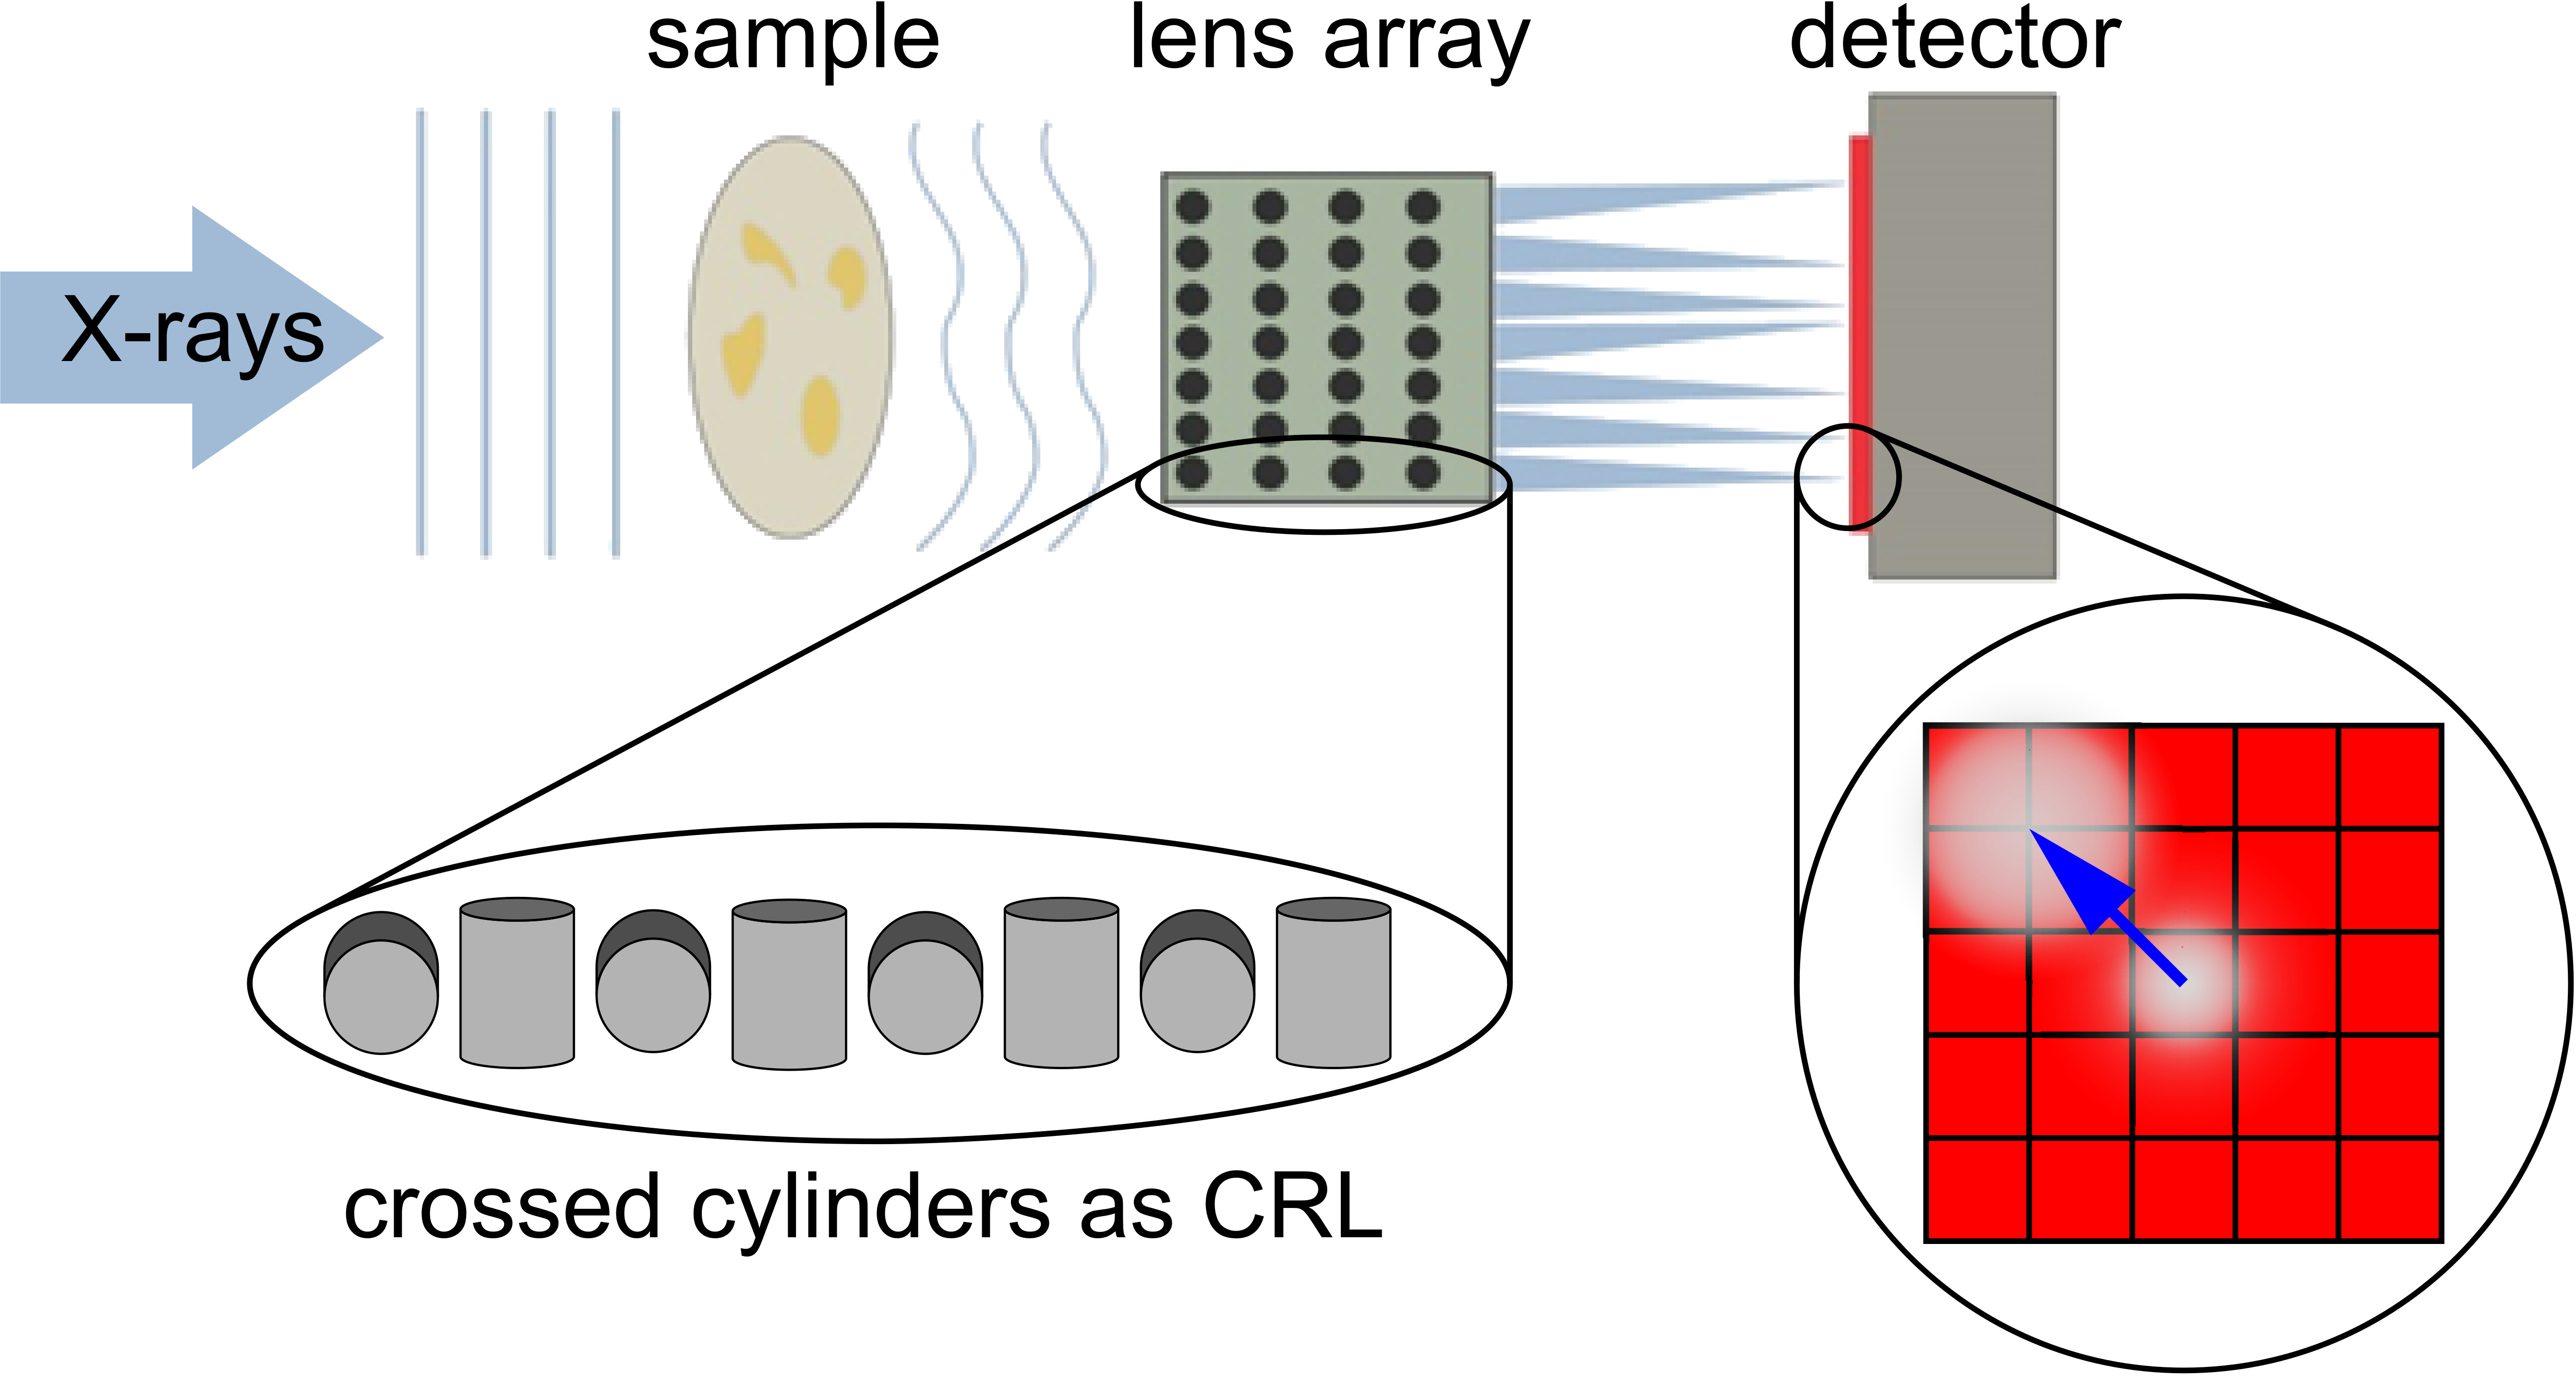
2.2. Image Formation

Every lenslet focuses a part of the incident plane wave onto a spot on the detector. After passing the object under investigation, each beamlet is attenuated, displaced or broadened relative to the incident beam direction (see Figure 2) depending on the local transmission, refraction or diffraction properties of the sample, respectively. By using the central result from Fourier optics that a slice of sample placed in the path of a converging spherical wave produces the optical Fourier transform of the part of the object intersected by the wavefront [30], it is possible to intuitively relate the local object properties to the modification of intensity in the focal plane. The angular spectrum of a planar wavefront is a delta function, thus the spots of the unmodified incident beamlets are as sharp as possible, where its size only depends on the optical transfer function of the lenslet aperture. We have to note that the wavefront in reality is not necessarily planar due to the finite distance and lateral extent of the X-ray source. In this case, the smallest achievable focal spot is the demagnified image of the source. Furthermore, the focal distance changes according to optical equations. This effect, however, is small in our case as the distance from the source (30 m) is two orders of magnitude larger than the focal distance.
In the case of local attenuation in the sample, the direction of the wavefront is not changed, only the magnitude of the local intensity is reduced. Refraction, on the other hand, introduces a local change of direction of the planar wavefront without changing the frequency content of the angular spectrum. The apparent width of the resulting intensity distribution in the focal plane is unchanged compared to the unmodified incident beamlets. Any other wavefront curvature may arise from local scattering on sub-aperture-sized discontinuities of the refractive index in the sample [18,31]. These have a high-frequency component in the angular spectrum. Since the intensity response is the convolution of the optical transfer function with the angular spectrum of the incident wavefront [18,25], this introduces a broadening of the focal spot.
Small-angle scattering of objects that fulfil the far field condition adds to the broadening. Here, diffraction contrast averages signals from all the objects that fall into the sensitivity size range [25,26]. By accessing several Fourier orders a crude size discrimination may be achieved [32]. In practice, the distinction between phase-contrast and diffraction contrast originating from scattering is not strict and depends on the geometry of the experimental setup, as well as discretization effects. In the continuous case, when the lenslet separation tends to zero, the distinction vanishes [33].
In summary, the array of CRLs acts as the X-ray equivalent of a Shack-Hartmann sensor known in the optical regime [34], which allows for discrimination of absorption contrast, phase-contrast and additionally a set of diffraction contrasts depending on the geometry and detector resolution. Thus, a second level of size information on the nanometer scale is overlaid on the morphology on the micrometer scale.

2.3. Retrieval of The Contrasts: Amplitude, Phase and Diffraction

To retrieve the different contrasts of amplitude, differential phase and diffraction, each spot was fitted separately by a 2D-Gaussian [35]:
g = h × e x p 1 2 × x μ x σ x 2 2 + y μ y σ y 2 2 + o ,
where h is the height, o the offset, σ x , y the width and μ x , y the peak position in horizontal and vertical direction, respectively. Any rotation of the Gaussian distribution was neglected to reduce calculation time and because no pronounced elliptical spot deformation was detected. The offset was only calculated for better fitting, but represents no separate contrast as long as it is just the residual background intensity.
To determine the changes in spot properties due to the sample the Gaussian fit was performed for two images, one without the sample and one with the sample. This leads to six contrast images for the undisturbed (free) image (height: h f , offset: o f , width in horizontal and vertical direction: σ x , f and σ y , f , position in horizontal and vertical direction: μ x , f and μ y , f ) and equivalent for the sample image ( h s , o s , σ x , s , σ y , s , μ x , s and μ y , s ). The changes where calculated by relating the undisturbed one to the sample image for the transmission T, the differential phase dP and the diffraction D in horizontal and vertical direction by the following expressions:
T = h s h f ,
d P x = μ x , s μ x , f a n d d P y = μ y , s μ y , f ,
D x = σ x , s σ x , f a n d D y = σ y , s σ y , f .
For calculating the actual beam deflection the differential phase was (in small-angle approximation) divided by the working distance. The latter being the distance between the SHARX or the detector when the sample is placed before the SHARX and the distance between the sample and the detector when the sample is placed between the SHARX and the detector.
Gaussian fits were used instead of Fourier analysis, since this procedure prevents issues with phase wrapping [18]. Additionally, the Fourier analysis as introduced by Wen et al. [14] is known to introduce cross-talk between absorption and diffraction contrast [36]. However, depending on the numbers of pixels sampling each beamlet, the Fourier analysis is able to probe several Fourier orders, possibly yielding information on several length scales in diffraction contrast as mentioned above. Both extremes of sampling in terms of pixel per period have their own limitation. The low sampling limit for reconstructing all three contrasts is 3 × 3 pixels per beamlet. A higher sampling ratio (smaller pixels) may improve the resolution of peak shifts for a lower detection limit on phase deviation. The limit of high sampling is, on the other hand, limited by the requirements on the detector performance such as the field of view, noise level and frame rate.
For wavefront sensing the angular resolution is of primary importance. It depends on the smallest detectable deviation of the beamlets in the fit of the peak position. This depends on the noise level of the images and on the geometric properties of the specific setup. For the wavefront sensing in Section 3.2 the angular resolution for a one pixel shift is 0.72 μ m/16 cm = 4.5 μ rad. At the same time, peak shifts smaller than one pixel can easily be detected.
The reconstruction of the change in the wavefront was done by zonal wavefront estimation introduced by Southwell [37]. For better accuracy in phase estimation the modified Southwell algorithm, as proposed in [38] was used. Here, additionally to the horizontal and the vertical phase slope, also the diagonal ones are incorporated in the reconstruction.

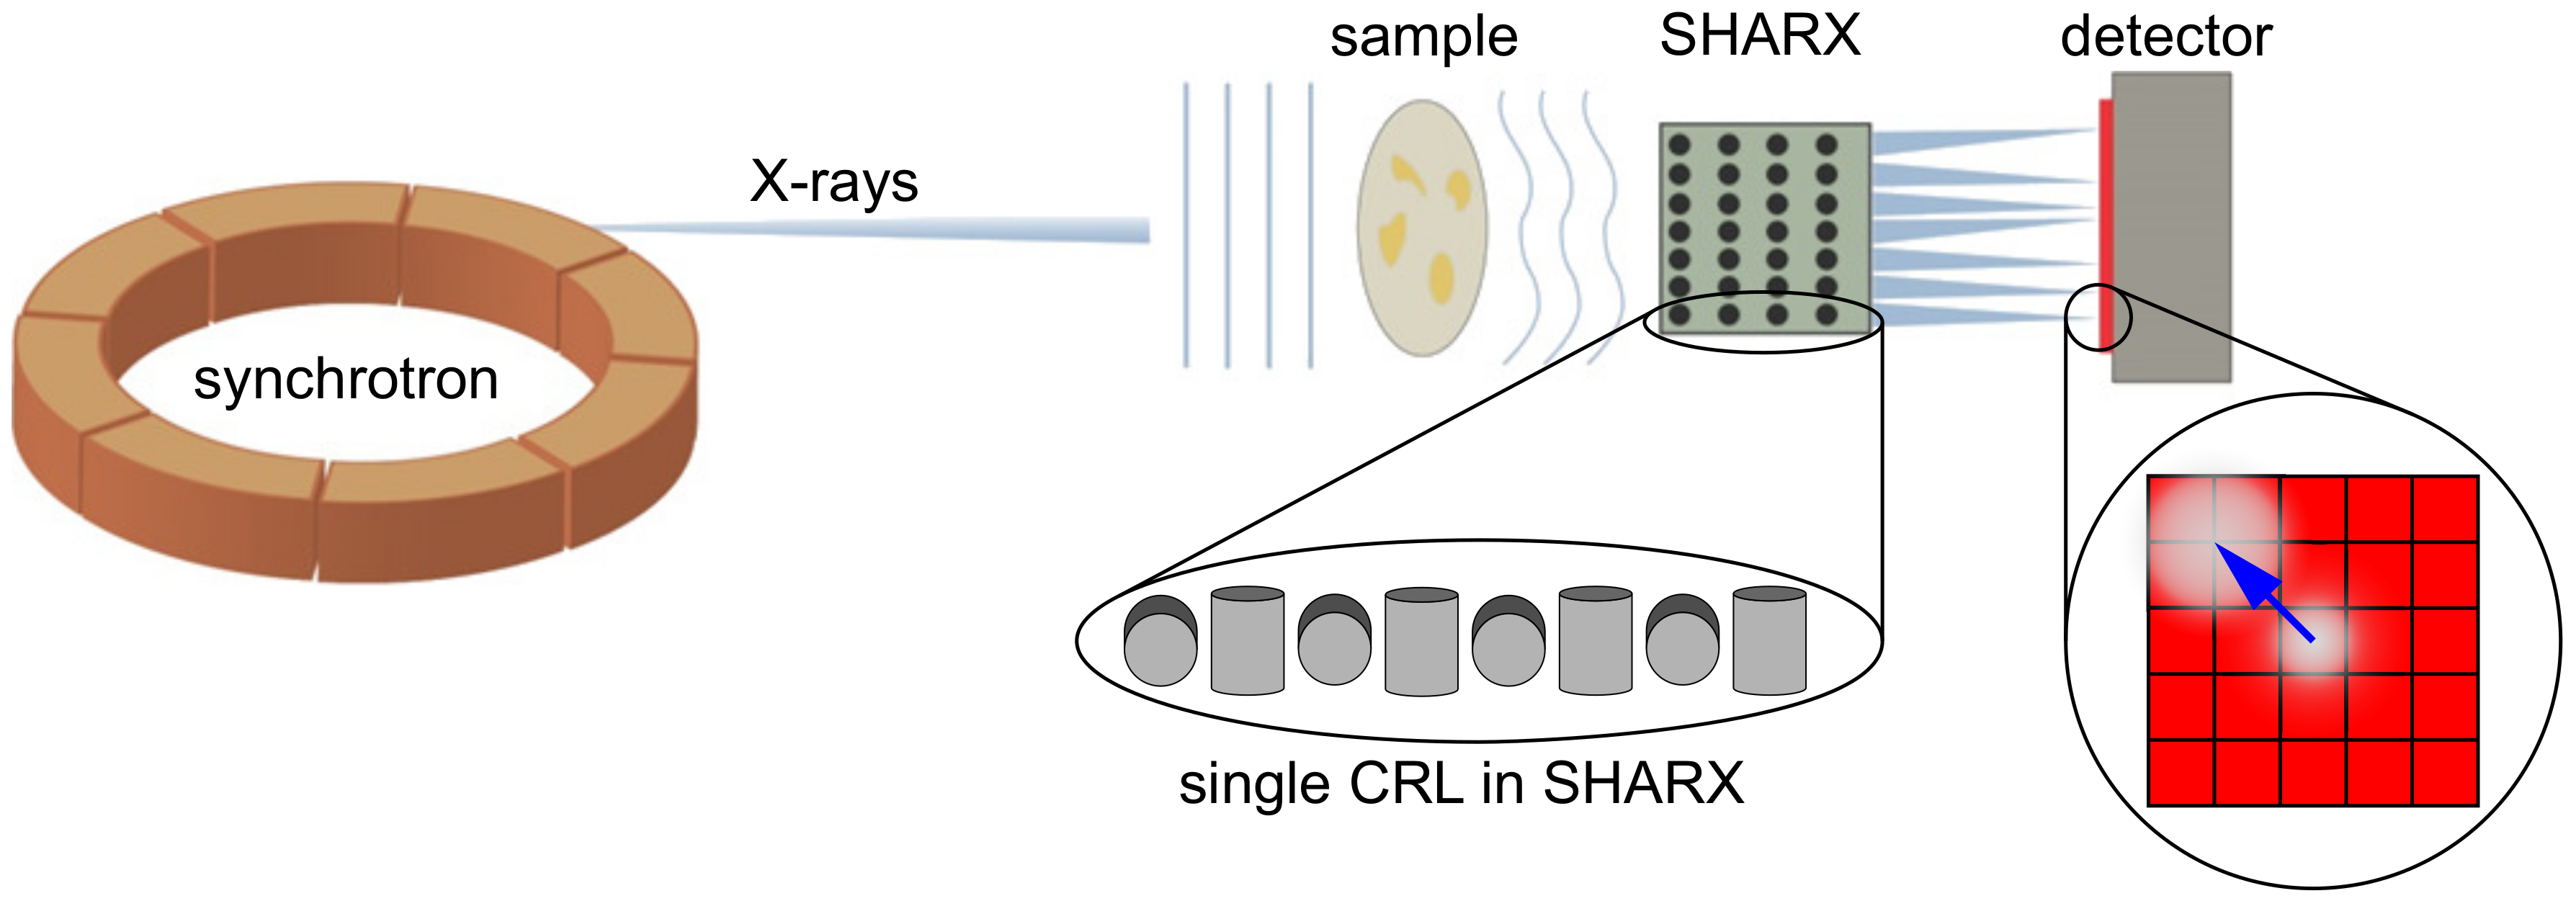
2.4. Experimental setup

The experiments were performed at the bending magnet beamline TOPO-TOMO at the synchrotron at the Karlsruhe Institute of Technology (KIT) (Karlsruhe, Germany). The scheme of the Shack-Hartmann setup is shown in Figure 2. A white beam (filtered by 0.2 mm of aluminum and 0.25 mm of beryllium), which has a beam size defined by mechanical blades (motorized slits) illuminates the lens array homogeneously, which leads to the formation of the beamlets on an X-ray scintillator. The visible light from the scintillator is imaged by a lens system onto a 2D detector. The sample can either be placed before or after the SHARX, which essentially determines the sensitivity (and susceptibility to phase wrapping) on phase-contrast and on the length scale in diffraction contrast.
The SHARX requires the positioning of the three angles, but not a sub-pixel spatial positioning, as no commensurability between spots and pixel is required. The two tilt angles should be aligned to better than 0.2 degrees by visual inspection of spot symmetry. The third angle (azimuthal rotation) needs to be set only if a Fourier analysis is envisioned in order to allow for fast Fourier transform routines.
Several setups for the imaging and optical characterisation were employed:
(i)
The internal microstructure of the SHARX was examined by means of micro-tomography acquired in filtered white beam (central energy 15 keV) with a 7 cm distance between the SHARX and the scintillator, which is much smaller than the focal distance of the lens array. A PCO.dimax (PCO AG, Kelheim, Germany) camera was used to image a 10 μ m thick LSO:Tb scintillator by a 10× objective (Mitutoyo LWD 10X 0.28 (Mitutoyo Deutschland GmbH, Neuss, Germany)) and a 180 mm tube lens, resulting in a ninefold optical magnification. The effective pixel size was 1.22 μ m. Projections were continuously recorded while rotating the sample with constant angular velocity around an axis perpendicular to the beam propagation directions [39].
(ii)
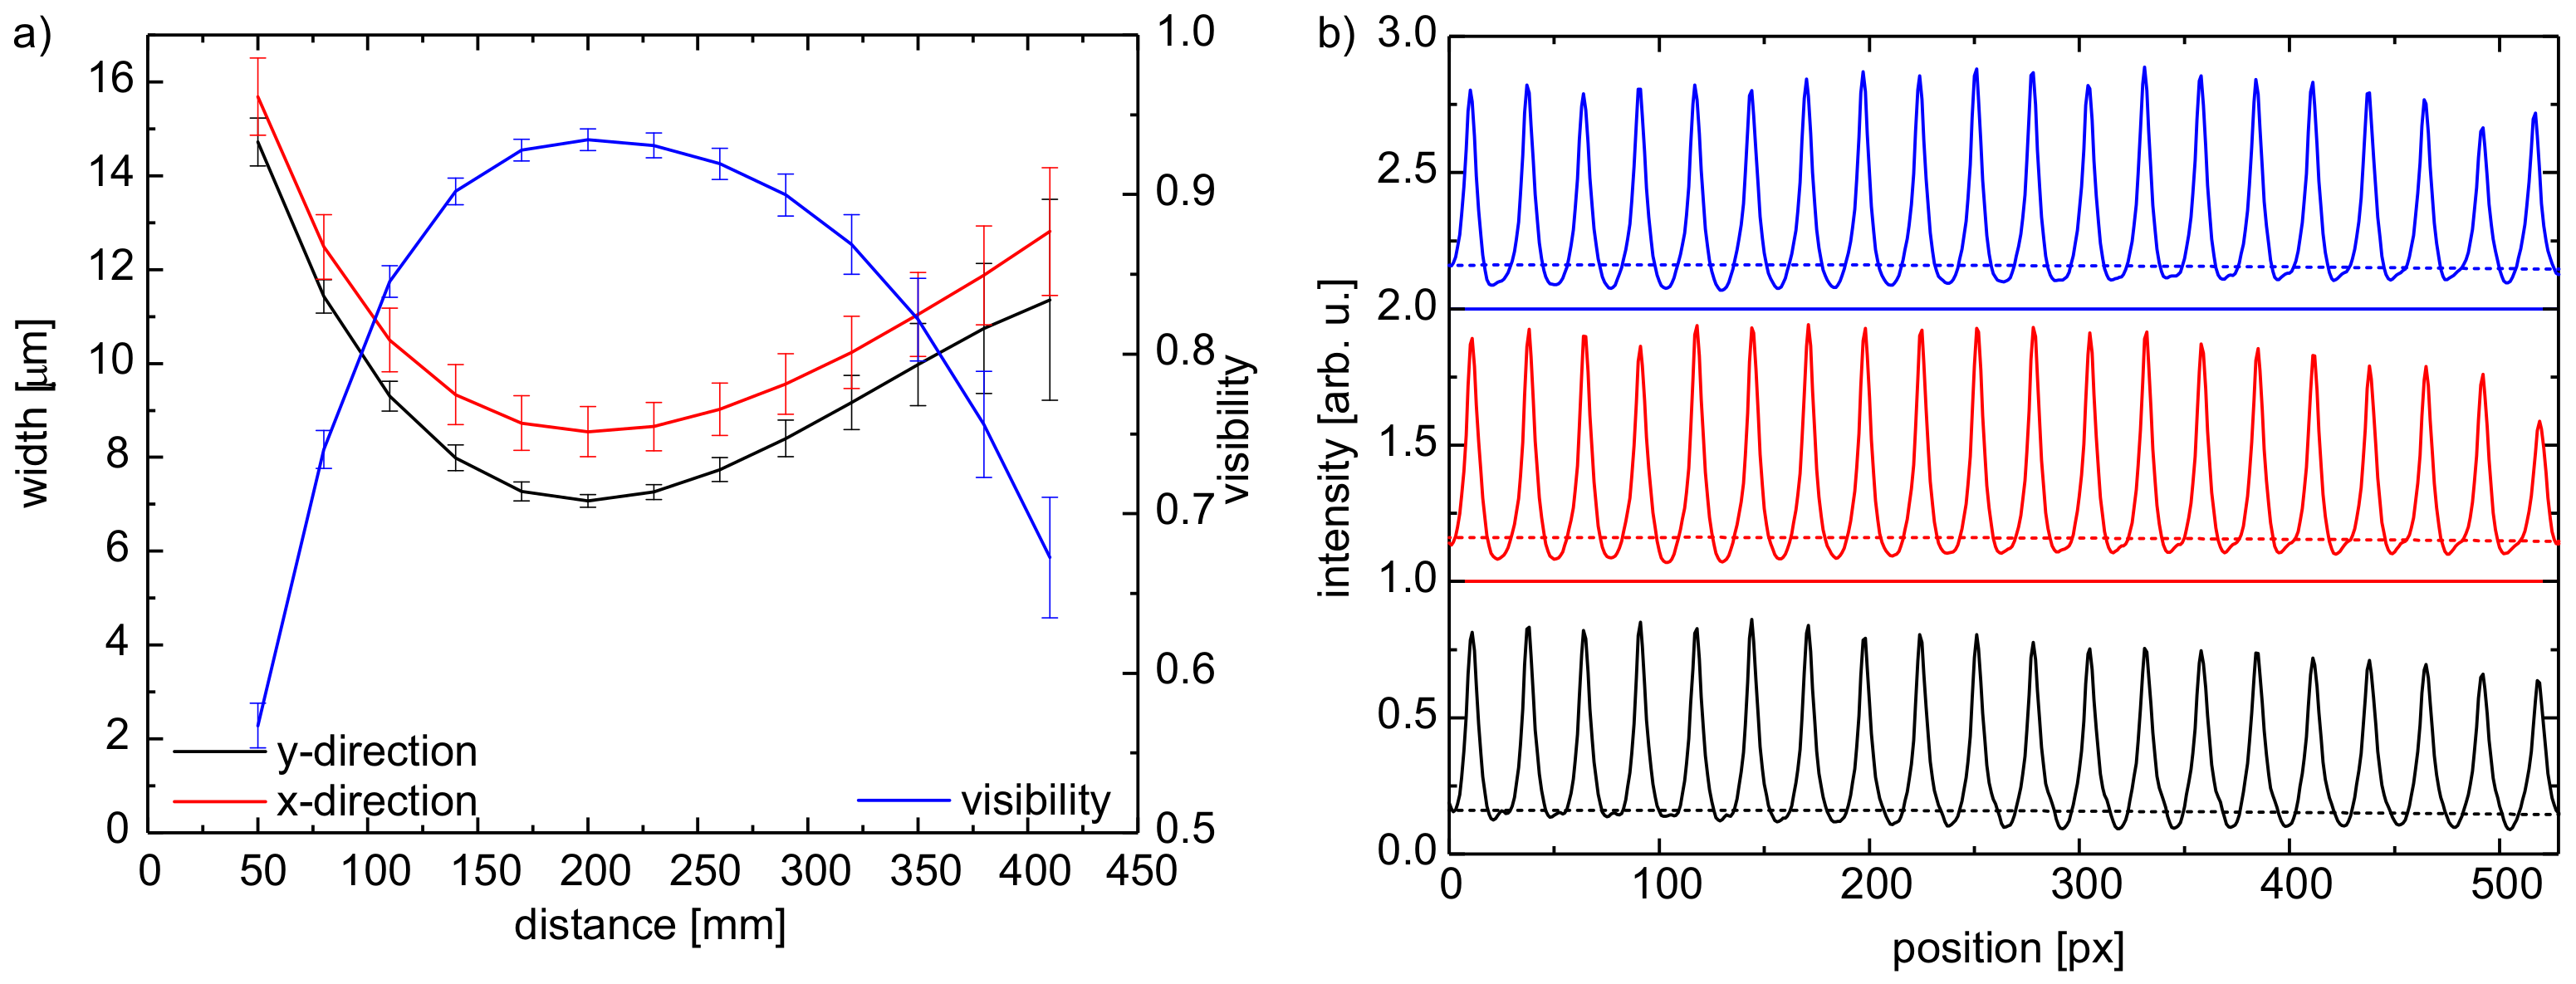
The focal distance of the SHARX was characterized in monochromatic beam (double-multilayer monochromator with 2% bandwidth at 9 keV). As detector an Andor Neo (Andor Technology Ltd., Belfast, Northern Ireland) camera coupled to a 200 μ m LuAG:Ce scintillator via a single objective lens (Nikon Nikkor 85/1.4 (Nikon GmbH, Düsseldorf, Germany)) was used. The optical magnification was 3.6x, resulting in an effective pixel size of 1.8 μ m.
(iii)
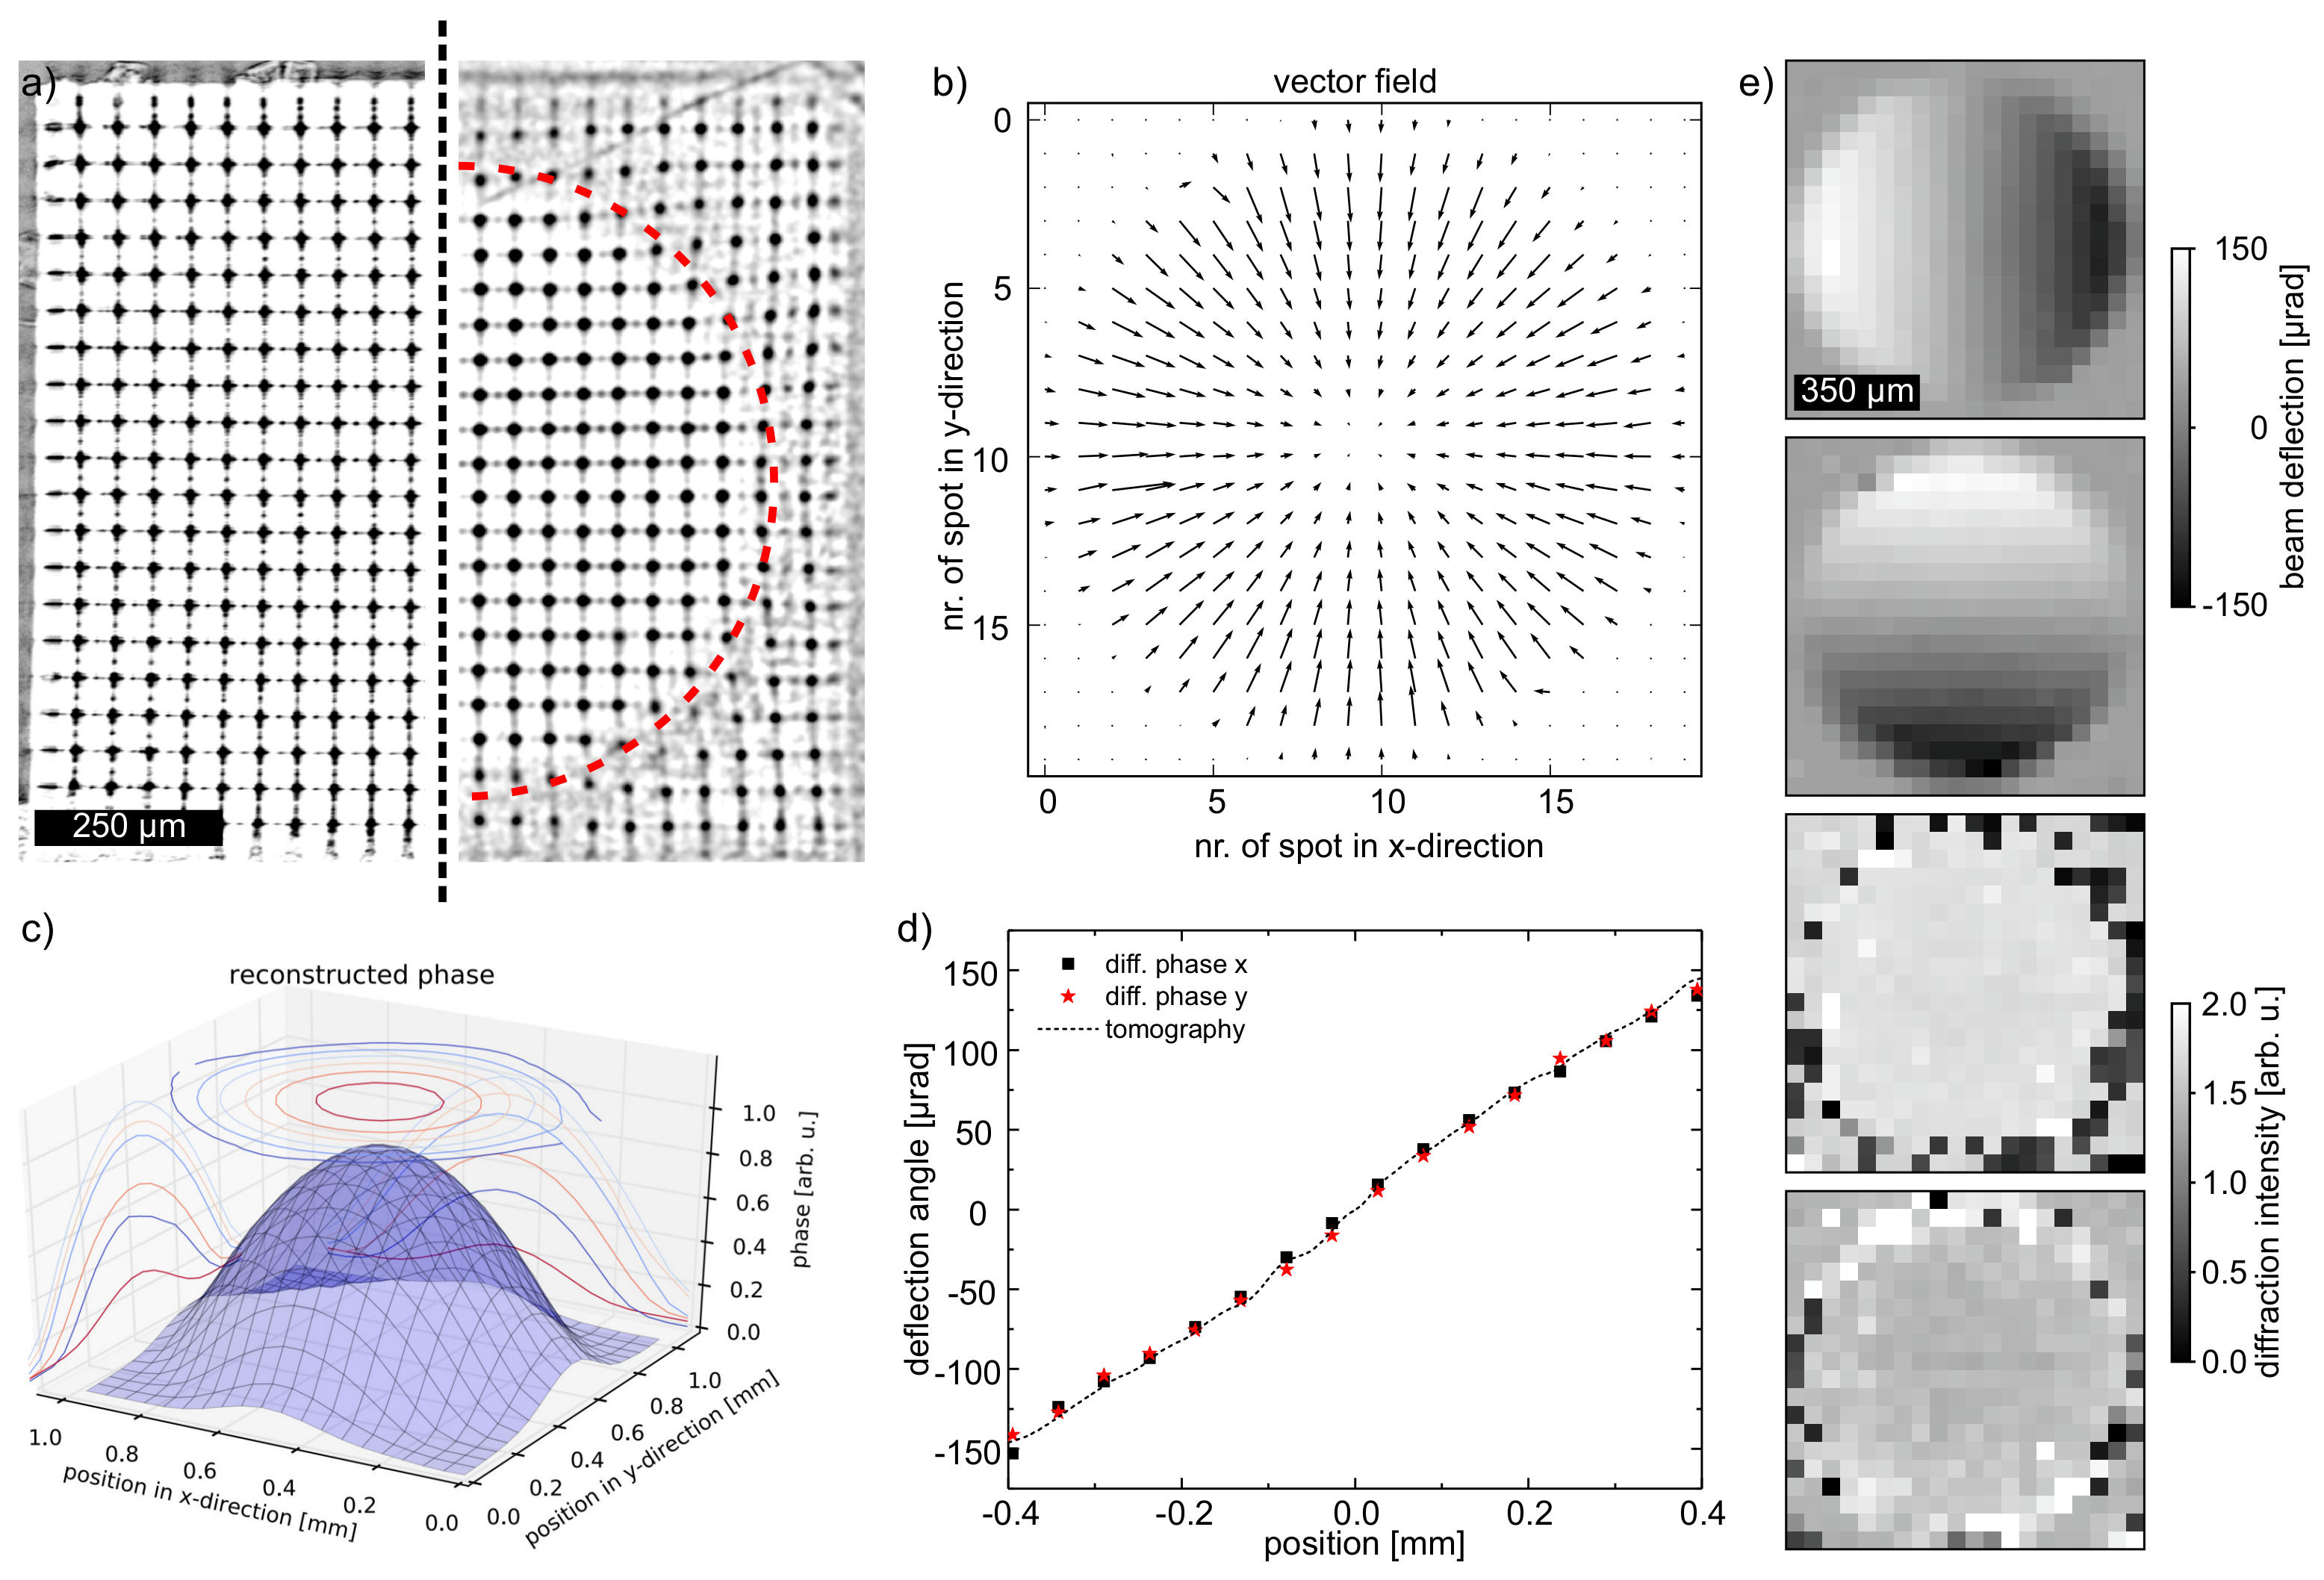
The phase-front reconstruction of the diamond lens was performed in monochromatic beam (8.5 keV). The camera used was the Andor Neo using the same optics as in setup (i) resulting in an effective pixel size of 0.72 μ m. The distance between the detector and the SHARX was 16 cm and the diamond lens was placed before the SHARX.
(iv)
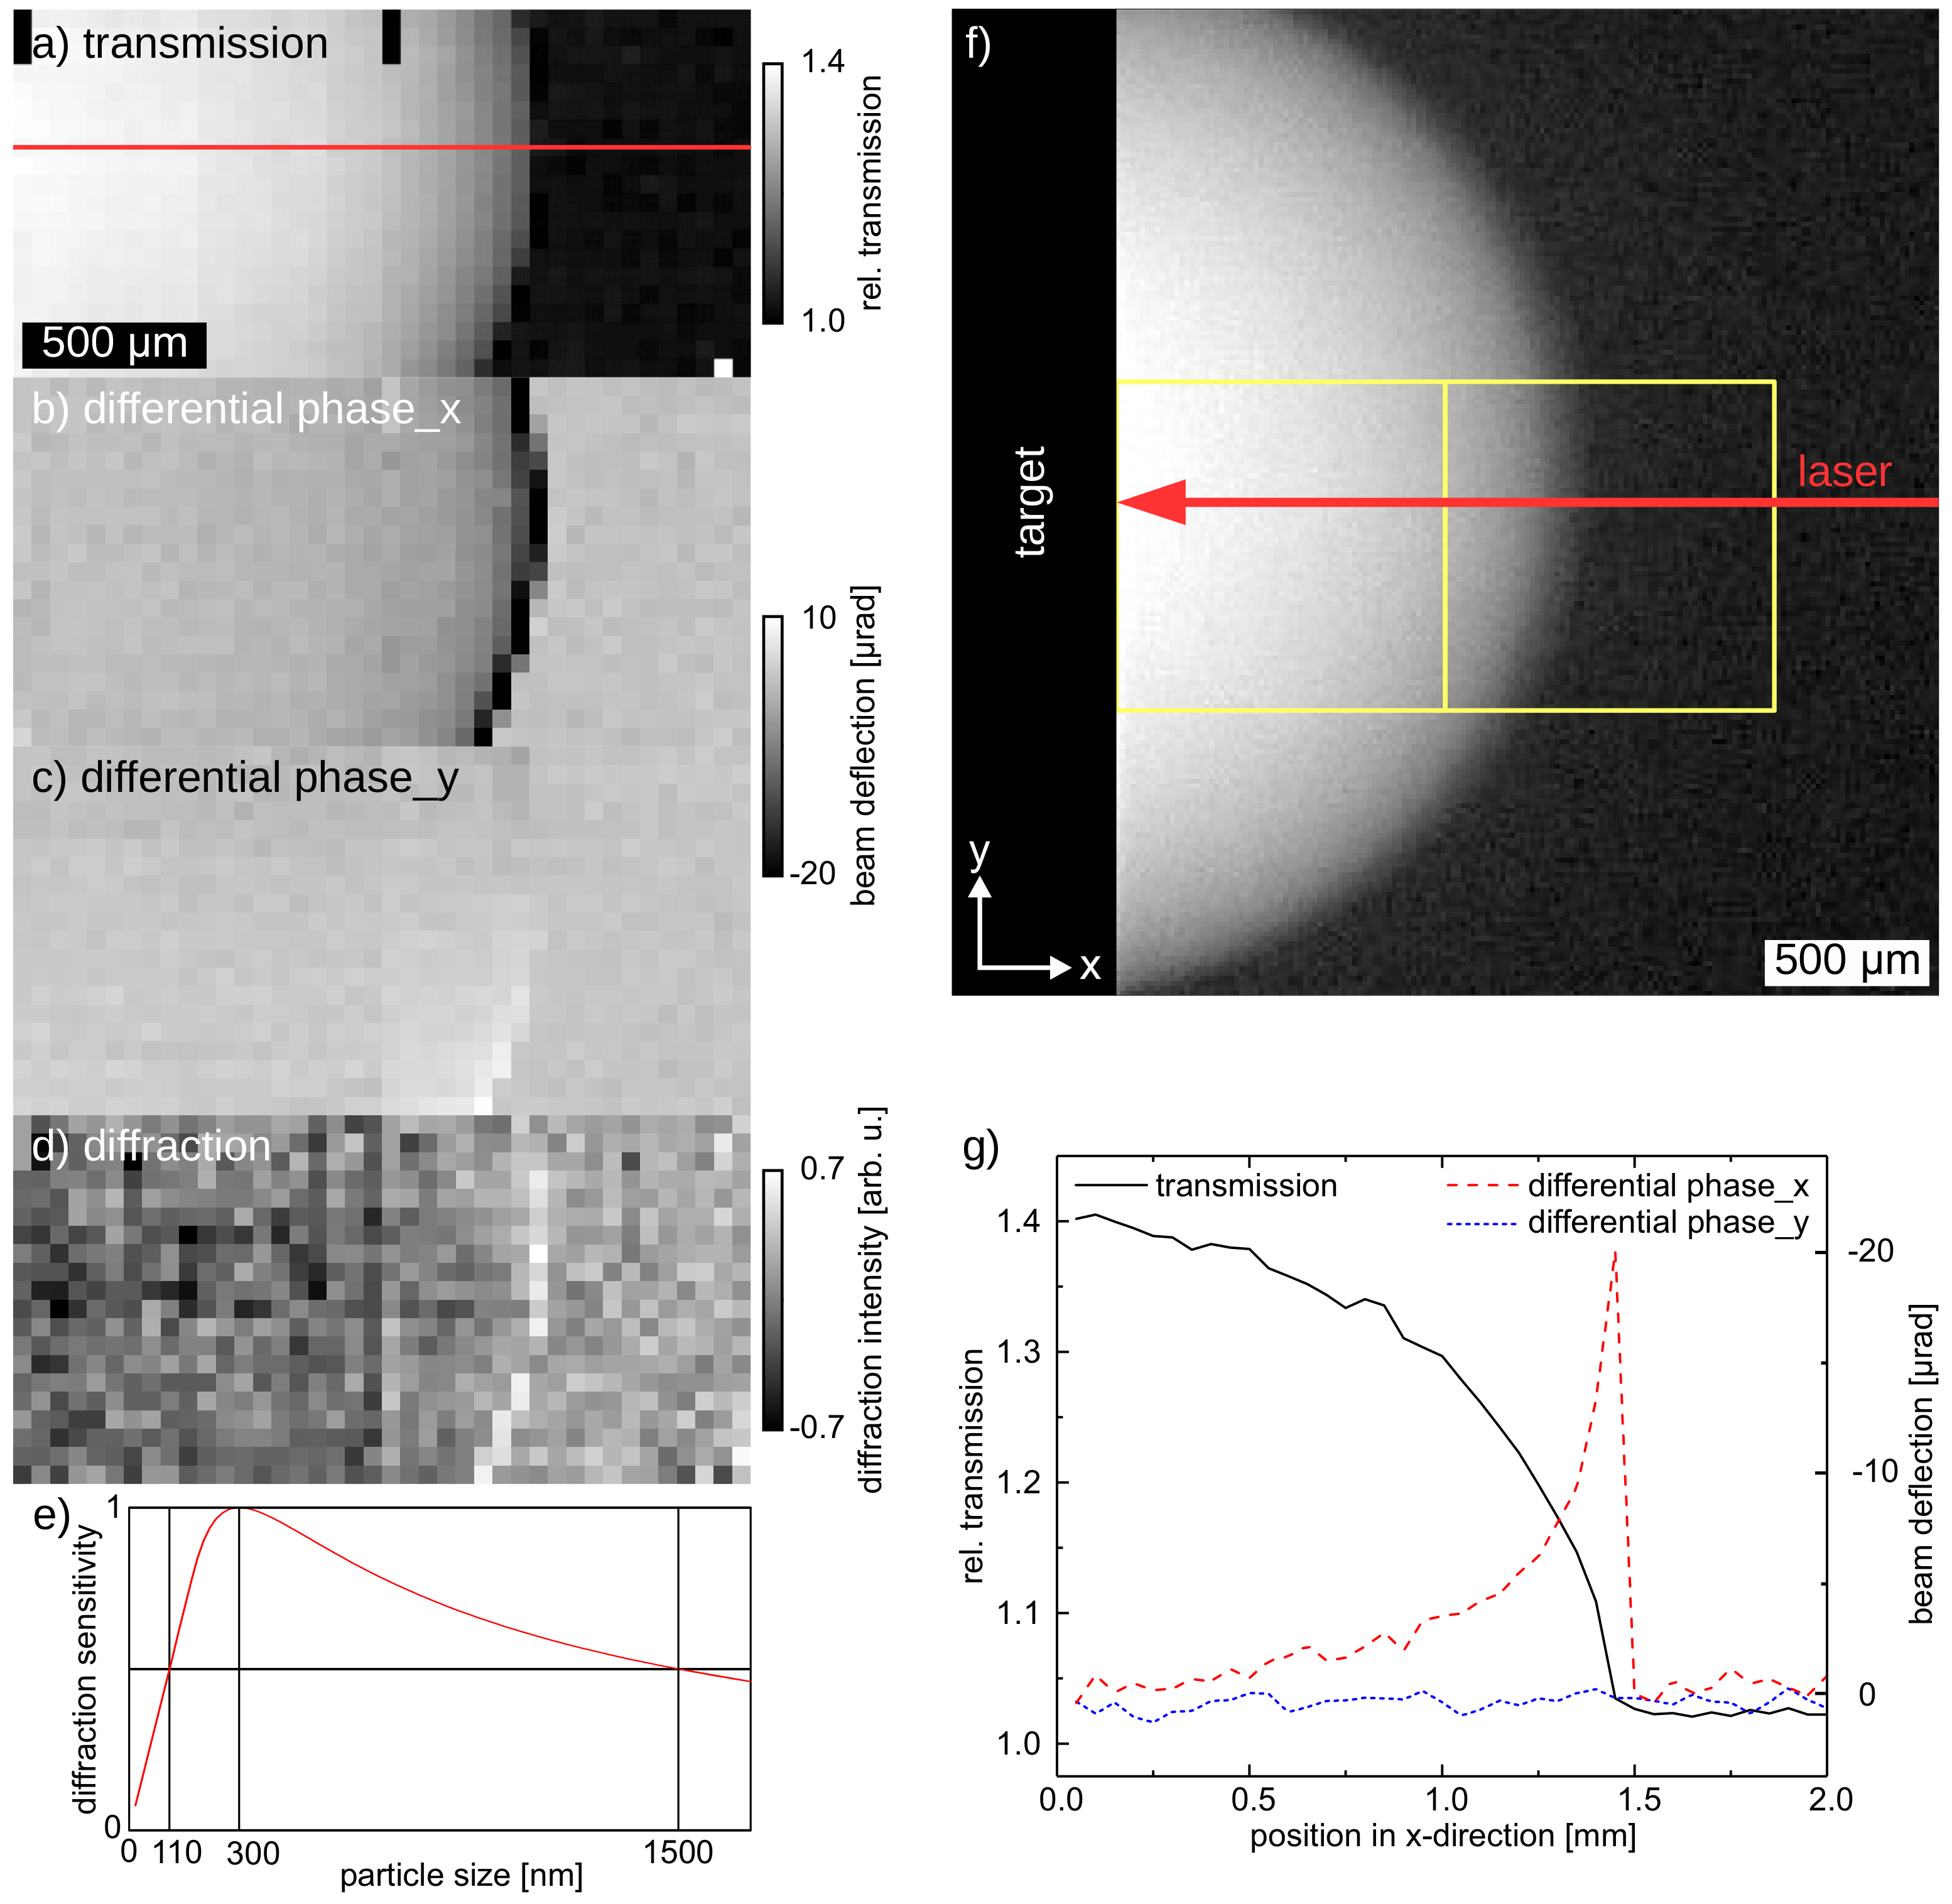
The fast multi-contrast imaging during the ablation process was performed in filtered white beam (central energy 15 keV). The camera was a PCO.dimax, lens-coupled with twofold magnification to a 50 μ m thick LuAG:Ce scintillator. The effective pixel size was 5.5 μ m. The ablation process was measured in a pump-record mode. For each laser pulse a complete image sequence was recorded with a frame rate of 15 kHz and an exposure time of 33 μ s to limit motion blurring [27]. This image sequence started before the laser impact (used for flat correction) and lasted longer than the final cavitation bubble collapse. For statistical reasons images sequences from 700 subsequent laser shots were averaged. The ablation process occurred in an in situ chamber, which was placed behind the SHARX close to the scintillator (7 cm distance). The ablation, in brief, was performed on a silver wire target (0.7 mm diameter) continuously transported through a sealed chamber of 0.4 cm 3 volume and flushed continuously by a water flow to avoid laser shielding by nanoparticles produced at predecessing laser pulses. Pulses from a nanosecond laser (Continuum Minilite I (Continuum, San Jose, USA), 1064 nm, 10 mJ) entered the chamber via a lens (38 mm effective focal length in water) to be focused onto the target (for more details see [27,40,41]).

3. Results and Discussion

3.1. Lens Array Characterization

The focal length of biconcave X-ray lenses is calculated according to the basic optics formula [22]:
f = R 2 × N × δ ,
where R is the radius of curvature, N the number of stacked biconcave lenses and 1- δ the energy-dependent real part of the index of refraction of the material in the X-ray range. Here, each CRL consists of 20 crossed cylindrical lenses which leads to an effective total of 10 biconcave lenses for each direction. The radius R is 20 μ m and δ = 5.65 × 10 6 at 9 keV. The expected focal length therefore is 177 mm. Scanning the distance between the detector and the array (see Figure 3a) yields the minimal width of the focal spots at (200 ± 15) mm which is in good agreement with the design value. Note that the real composition of the photoresist is unknown and therefore the exact value of δ may vary slightly. Additionally, lens errors may add to the shift. The slight difference in spot size in x- and y-direction originates from different sizes of the source in horizontal and vertical direction. The visibility V ( V = ( I m a x I m i n ) / ( I m a x + I m i n ) with I m a x being the maximum and I m i n the minimum intensity in the square zone of each spot) of the spots peaks at the same distance as the effective focal length.
The achieved visibility of 0.93 is considerably higher than typical values for grating interferometry [42]. Even in white-beam illumination (centered at 15 keV), we still obtained a high visibility of 0.5. Figure 3b shows three line plots in x-direction of different spot rows (solid lines, the upper two are shifted for clarity) in monochromatic mode. All of them show high gain factors compared to the free beam intensity (dashed lines). Two points have to be noted. First, not only intensity within the horizontal line is concentrated into the spots, but also in the perpendicular direction. Therefore intensity appears not to be conserved (area below dashed versus solid lines). Second, the minima in Figure 3b are not the global minima in each zone of the spot. The SHARX consists of crossed cylinders acting as 2D focusing lenses at the exact intersection point, while focusing works only in one direction at positions away from the cylinder cross points. The minima in Figure 3b reflect such positions leading to an increased background intensity compared to areas of no intensity increase or even intensity decrease. The absolute visibility, however, was derived from analysing a square area around each spot. Nevertheless, the spot sizes and thus one major factor to spot shift sensitivity are dominated by two effects, the finite size of the synchrotron source and the aberrations of the cylinder lenses (spherical aberration and partly focusing regions due to the reduced fill factor of the cylinders).

3.2. Reconstruction of The Phase Shift of a Diamond Lens

The SHARX can be used to analyze the changed wavefront of the X-ray beam in the exit plane of an X-ray optical element. For demonstration we analysed a CRL composed of 8 plano-concave parabolic lenses made from single-crystal diamond. Each unit lens has a design radius of curvature of 200 μ m at the vertex of the parabola and an entrance aperture of around 0.9 mm [43,44] leading to a focal length of about 2.5 m (at 8.5 keV). Figure 4a clearly illustrates the effect produced by the CRL inserted in the X-ray beam: the almost rectilinear grid of X-ray spots formed by the SHARX (left part) is bent toward the central axis of the CRL (right part). Shift in meridional and sagittal planes of each beamlet are derived by comparing reference and distorted image. The resulting local refraction angle in the CRL exit plane is shown as a vector field in Figure 4b. As expected, spots at the peripheral part of the CRL experience larger shifts than peaks located near the lens central axis. From these shifts we could easily reconstruct the X-ray phase shift using, for instance, the modified Southwell algorithm [38] (see also Section 2.3). The calculated phase shift (Figure 4c) is in reasonable agreement with the prediction based on the design values.
To verify the accuracy of the performed phase front metrology, the deflection of the X-rays introduced by the diamond CRL was derived independently from a microtomography (CT) with the CT rotation axis coinciding with the CRL optical axis [45]. The reconstructed distribution of material density was subjected to a segmentation procedure in order to outline the surfaces of the diamond. These in turn were used to calculate the thickness of diamond projected onto the CRL exit plane. Finally, this projected thickness was converted into X-ray deflection angles using the relation β ( x , y ) = Δ T ( x , y ) × δ d , where Δ T ( x , y ) is the finite difference approximation to the first derivative of the thickness and 1- δ d the real part of the index of refraction of diamond. The result is shown as dashed line in Figure 4d and compared to the SHARX deflection angles (red stars and black squares). Both angular shifts match well within a 4 μ rad confidence and relate to a CRL with effective radius of curvature at the apex of 205 μ m. The reproducibility of differential phase in the unperturbed area outside the diamond lens was derived to be 1.8 and 4 μ rad in horizontal and vertical direction, respectively. Smaller deviations can be detected by reducing the noise on the data by averaging (0.5 μ rad in the ablation run). A very good agreement between the measured beam deflection by the SHARX and the indirectly estimated deflection from the CT demonstrates that a precise phasefront metrology can be performed with the SHARX device.
2D representations of the differential phase and diffraction contrast in x and y-direction are shown in Figure 4e. Phase-contrast is shown for both directions, reproducing the finding of phase front curvature. The diffraction patterns show no significant signal as expected from a smooth material. However, the edges display an elevated diffraction level. Here two effects appear: the abrupt beam displacement within the individual beamlets, leading to a high curvature of the wave front, and an enhanced roughness due to processing. The first effect is in line with the interdependence of diffraction and phase from objects sized within the spatial resolution [46].

3.3. In-Situ Imaging of Laser-Induced Cavitation Bubble

Pulsed laser ablation in liquid (PLAL) is employed to produce ligand-free nanoparticles in (e.g., aqueous) suspension [47]. Due to its hierarchical processes spanning several length scales and the fast dynamics of structure formation the mechanisms and control of the process are still under investigation [48]. Within the present nanosecond excitation it is known that ablated material is ejected from the target by phase explosion, while at the same time a plasma is ignited to modify particle formation and foster energy coupling into the water. The latter is easily visible as a millimeter-sized transient cavitation bubble [41]. This bubble develops into a hemispherical shape of some 1.5 mm radius within a typical 150 μ s lifetime. It is known that this bubble contains a major part of the ejected mass from the target as nanoparticles [41,49] and the mutual interaction governs particle ripening [50].
With the SHARX setup we could measure differential phase and diffraction in addition to the absorption. The bubble is imaged with the spatial resolution of the pitch of the SHARX (50 μ m). While the absorption and phase shift contain information about the bubble structure, the diffraction channel contains the scattering signal from structures in the nanometer up to the sub-micrometer scale as indicated by the sensitivity graph in Figure 5. Due to the short exposure time an averaging over a number of (nominally reproducible) events is necessary for improving the signal-to-noise ratio.
Figure 5f shows an absorption contrast radiography without the SHARX for orientation [40] over a large field of view. Due to the limited size of the SHARX array we sampled separately two different positions relative to the cavitation bubble, which were merged afterwards to cover the region of interest (see Figure 5f). Figure 5a–d shows the results at maximum bubble expansion for the different contrast channels. The differential phases in both directions clearly show the apex of the bubble, which coincides with the highest phase gradient. The directional sensitivity is unambiguous. A reconstruction of the absolute phase could be calculated as for the diamond lens (not shown here).
As known from investigations with Hartmann masks, the diffraction channel is referred to the scattering of spatially unresolvable structures [14,15,32]. As explained in theory by Lynch et al. [25] the sensitivity for different particle sizes is mainly dependent on the pitch of the spots, the X-ray energy and the distance between the sample and the detector. The sensitivity peak for the present setup is located at a structure size of 300 nm with a FWHM (full width at half maximum) from 110 to 1500 nm [25,26] as shown in the sensitivity curve in Figure 5e. From earlier studies it is known that the main size fraction of particles produced by PLAL is smaller than the present range [27,51]. However, ripening processes produce large particles that enter the visibility interval. These larger agglomerates (>100 nm) will be visible in diffraction contrast with the present setup. A change in the setup geometry (lens pitch, distances) furthermore would enable to modify the sensitivity range.
The small observed signals in the diffraction channel in Figure 5d (average of the two directional ones as no anisotropic scattering is expected) is of similar spatial distribution as the absorption signal. Therefore it is reasonable to consider a homogeneous filling of the bubble with scattering structures. On the other hand, some residual crosstalk from absorption or phase-contrast [33,52] may contribute to the signal and is subject of ongoing investigations. The high diffraction signal at the bubble boundary is again attributed to the crosstalk from an unresolvable sharp phase change [46].
A signal decomposition as in [52,53] could not shed more light on this issue. These signals are visible by Fourier analysis as well [18]. A further setup optimization and data analysis are required. It should be kept in mind that the integration time for the presented data only adds up to a total of 14 ms given the 33 μ s exposure of the individual frames.

4. Summary and Conclusions

Summarizing these results, the Shack-Hartmann approach with a 2D array of X-ray lenses, SHARX, is able to capture multi-contrast images of objects which discern absorption, phase and diffraction. This is quantitatively equivalent to the described Hartmann-mask approach [14,17,18] or even conceptually similar to other methods with structured X-ray beams [19,20,21]. The only observable is the modification of a patterned X-ray field at the detector plane and its relation to the optical properties of the sample, but not to the way the patterning is produced. Sensitivity therefore relates to pure geometric design and pattern visibility. The Shack-Hartmann sensor therefore increases usable X-ray flux compared to the Hartmann mask. An amplification factor of 6 has so far been achieved but with higher space filling fraction and at sources with smaller source size this can be improved further. Thus, exposure times can be considerably lowered to study ultra fast processes. On the other hand, spatial resolution relative to the native detector pixel size is reduced. This can nevertheless be compensated for in some cases, where the sample resides closer to the detector (and is static). In that case the beamlets only illuminate a gridded part of the sample. A lateral rastering of the sample can then regain spatial resolution by interleaving several exposures.
The field of view of the SHARX is limited due to the fabrication process. This limitation can be overcome by producing so called compound array refractive lenses (CARL’s), e.g., in a 2D process with subsequent stacking to a compound lens, as recently demonstrated [53].
As a refraction-based element the SHARX is chromatic due to the fact that the refractive index of any lens material is energy-dependent. Consequently, the focal point will shift with X-ray energy. Nevertheless, this shift (estimated as 5.9 cm/keV at 9 keV) in our case is comparable to broadening due to the imaging of the source onto the detector as compared to the filtered spectrum with 50% bandwidth. With quasi-monochromatic sources (some 5% bandwidth) the broadening due to shifting the focal length would be about 0.2 μ m, which is small as compared to the source image in our case (7 μ m).
In this paper, we have demonstrated the use of a 2D array of cylindrical holes inside a refractive polymer, called SHARX, as a compound refractive lens array for hard X-rays. We have produced a lens array of 50 μ m pitch with a focal length of 200 mm, which is sensitive to angular shifts of the wavefront down to 4 μ rad at a spatial resolution on the micrometre scale. At the same time, structural length scales of around 300 nm are probed in diffraction contrast. The device requires low precision of alignment and no moving parts during the data acquisition. The performance is preserved at a relaxed bandwidth of the X-ray beam.
The sensitivity of phase modulation by an object (sample) has been shown to be very high and comparable to other phase-sensitive techniques. Adding the high flux, this approach is particularly useful for imaging irreversible or fast processes in materials or sensing wavefront (changes) of X-ray beams. The efficiency of the method can be further improved by increasing the filling factor for the lenses and focusing precision by shifting to individual parabolic lenses rather than lens cylinders. With optimal lens shape and material transmission an extension to soft X-ray energies down to 4 keV seems feasible.
The availability of a diffraction contrast may fulfil demands imposed by the requirements of imaging hierarchical structure evolution. The simultaneously observable length scales combine the micrometer range in absorption contrast and the nanometer to sub-micrometer range in diffraction contrast at the spatial resolution of the absorption contrast. This results in the ability to assess contrast variations of interest on the microsecond time scale and to investigate how the structural dynamics influences each other.

Author Contributions

T.d.S.R., S.R., D.K., S.G., E.F. and A.P. conceived and designed the experiments; D.K. produced the SHARX; T.d.S.R., S.R., S.G. and A.P. performed the experiments; T.d.S.R., S.R. and S.G. analyzed the data; T.d.S.R., S.R., S.G. and A.P. wrote the paper with help of all co-authors.

Acknowledgments

This research has been supported by the Helmholtz programme topic “from matter to materials and life—MML” and by the German Research Foundation DFG through grant PL 325/8-1. This work benefited from the use of the application SHWaveRecon (version 1.1) developed at the KIT, Karlsruhe. The Karlsruhe Nano Micro Facility KNMF is acknowledged for producing the lens array. We are grateful to TISNCM (Troitsk, Russian Federation) for providing a single crystal diamond CRL for testing. The provision of beamtime at ANKA is acknowledged. We wish to thank T. Müller for support at the beamline and S. Barcikowski and A. Letzel for continuing discussions. We acknowledge support by Deutsche Forschungsgemeinschaft and Open Access Publishing Fund of Karlsruhe Institute of Technology.

Conflicts of Interest

The authors declare no conflict of interest. The founding sponsors had no role in the design of the study; in the collection, analyses, or interpretation of data; in the writing of the manuscript, and in the decision to publish the results.

References

  1. Wilkins, S.W.; Gureyev, T.E.; Gao, D.; Pogany, A.; Stevenson, A.W. Phase-contrast imaging using polychromatic hard X-rays. Nature 1996, 384, 335–338. [Google Scholar] [CrossRef]
  2. Diemoz, P.; Bravin, A.; Coan, P. Theoretical comparison of three X-ray phase-contrast imaging techniques: propagation-based imaging, analyzer-based imaging and grating interferometry. Opt. Express 2012, 20, 2789–2805. [Google Scholar] [CrossRef] [PubMed]
  3. Cloetens, P.; Barrett, R.; Baruchel, J.; Guigay, J.P.; Schlenker, M. Phase objects in synchrotron radiation hard X-ray imaging. J. Phys. D Appl. Phys. 1996, 29, 133–146. [Google Scholar] [CrossRef]
  4. Bonse, U.; Hart, M. An X-ray Interferometer. Appl. Phys. Lett. 1965, 6, 155–156. [Google Scholar] [CrossRef]
  5. Endrizzi, M.; Diemoz, P.C.; Millard, T.P.; Louise Jones, J.; Speller, R.D.; Robinson, I.K.; Olivo, A. Hard X-ray dark-field imaging with incoherent sample illumination. Appl. Phys. Lett. 2014, 104, 024106. [Google Scholar] [CrossRef]
  6. Momose, A.; Kawamoto, S.; Koyama, I.; Hamaishi, Y.; Takai, K.; Suzuki, Y. Demonstration of X-ray Talbot Interferometry. Jpn. J. Appl. Phys. 2003, 42, L866–L868. [Google Scholar] [CrossRef]
  7. Weitkamp, T.; Diaz, A.; David, C.; Pfeiffer, F.; Stampanoni, M.; Cloetens, P.; Ziegler, E. X-ray phase imaging with a grating interferometer. Opt. Express 2005, 13, 6296–6304. [Google Scholar] [CrossRef] [PubMed]
  8. Pfeiffer, F.; Weitkamp, T.; Bunk, O.; David, C. Phase retrieval and differential phase-contrast imaging with low-brilliance X-ray sources. Nat. Phys. 2006, 2, 258–261. [Google Scholar] [CrossRef]
  9. Momose, A.; Yashiro, W.; Maikusa, H.; Takeda, Y. High-speed X-ray phase imaging and X-ray phase tomography with Talbot interferometer and white synchrotron radiation. Opt. Express 2009, 17, 12540. [Google Scholar] [CrossRef] [PubMed]
  10. Pfeiffer, F.; Bech, M.; Bunk, O.; Kraft, P.; Eikenberry, E.F.; Brönnimann, C.; Grünzweig, C.; David, C. Hard-X-ray dark-field imaging using a grating interferometer. Nat. Mater. 2008, 7, 134–137. [Google Scholar] [CrossRef] [PubMed]
  11. Kagias, M.; Wang, Z.; Jefimovs, K.; Stampanoni, M. Dual phase grating interferometer for tunable dark-field sensitivity. Appl. Phys. Lett. 2017, 110, 014105. [Google Scholar] [CrossRef]
  12. McDonald, S.A.; Marone, F.; Hintermüller, C.; Mikuljan, G.; David, C.; Pfeiffer, F.; Stampanoni, M. Advanced phase-contrast imaging using a grating interferometer. J. Synchrotron Radiat. 2009, 16, 562–572. [Google Scholar] [CrossRef] [PubMed] [Green Version]
  13. Momose, A.; Yashiro, W.; Harasse, S.; Kuwabara, H. Four-dimensional X-ray phase tomography with Talbot interferometry and white synchrotron radiation: dynamic observation of a living worm. Opt. Express 2011, 19, 8423–8432. [Google Scholar] [CrossRef] [PubMed]
  14. Wen, H.H.; Bennett, E.E.; Kopace, R.; Stein, A.F.; Pai, V. Single-shot X-ray differential phase-contrast and diffraction imaging using two-dimensional transmission gratings. Opt. Lett. 2010, 35, 1932–1934. [Google Scholar] [CrossRef] [PubMed]
  15. Morgan, K.S.; Paganin, D.M.; Siu, K.K.W. Quantitative single-exposure X-ray phase contrast imaging using a single attenuation grid. Opt. Express 2011, 19, 19781–19789. [Google Scholar] [CrossRef] [PubMed]
  16. Rutishauser, S.; Samoylova, L.; Krzywinski, J.; Bunk, O.; Grünert, J.; Sinn, H.; Cammarata, M.; Fritz, D.M.; David, C. Exploring the wavefront of hard X-ray free-electron laser radiation. Nat. Commun. 2012, 3, 947. [Google Scholar] [CrossRef] [PubMed]
  17. Rand, D.; Ortiz, V.; Liu, Y.; Derdak, Z.; Wands, J.R.; Tatíček, M.; Rose-Petruck, C. Nanomaterials for X-ray Imaging: Gold Nanoparticle Enhancement of X-ray Scatter Imaging of Hepatocellular Carcinoma. Nano Lett. 2011, 11, 2678–2683. [Google Scholar] [CrossRef] [PubMed]
  18. Vittoria, F.A.; Endrizzi, M.; Diemoz, P.C.; Zamir, A.; Wagner, U.H.; Rau, C.; Robinson, I.K.; Olivo, A. X-ray absorption, phase and dark-field tomography through a beam tracking approach. Sci. Rep. 2015, 5, 16318. [Google Scholar] [CrossRef] [PubMed]
  19. Wang, H.; Kashyap, Y.; Sawhney, K. Hard-X-ray Directional Dark-Field Imaging Using the Speckle Scanning Technique. Phys. Rev. Lett. 2015, 114, 103901. [Google Scholar] [CrossRef] [PubMed]
  20. Wang, H.; Kashyap, Y.; Sawhney, K. Quantitative X-ray dark-field and phase tomography using single directional speckle scanning technique. Appl. Phys. Lett. 2016, 108, 124102. [Google Scholar] [CrossRef]
  21. Kagias, M.; Wang, Z.; Villanueva-Perez, P.; Jefimovs, K.; Stampanoni, M. 2D-Omnidirectional Hard-X-ray Scattering Sensitivity in a Single Shot. Phys. Rev. Lett. 2016, 116, 093902. [Google Scholar] [CrossRef] [PubMed]
  22. Snigirev, A.; Kohn, V.; Snigireva, I.; Lengeler, B. A compound refractive lens for focusing high-energy X-rays. Nature 1996, 384, 49–51. [Google Scholar] [CrossRef]
  23. Lengeler, B.; Tümmler, J.; Snigirev, A.; Snigireva, I.; Raven, C. Transmission and gain of singly and doubly focusing refractive X-ray lenses. J. Appl. Phys. 1998, 84, 5855–5861. [Google Scholar] [CrossRef]
  24. Lyubomirskiy, M.; Snigireva, I.; Kohn, V.; Kuznetsov, S.; Yunkin, V.; Vaughan, G.; Snigirev, A. 30-Lens interferometer for high-energy X-rays. J. Synchrotron Rad. 2016, 23, 1104–1109. [Google Scholar] [CrossRef] [PubMed]
  25. Lynch, S.K.; Pai, V.; Auxier, J.; Stein, A.F.; Bennett, E.E.; Kemble, C.K.; Xiao, X.; Lee, W.K.; Morgan, N.Y.; Wen, H.H. Interpretation of dark-field contrast and particle-size selectivity in grating interferometers. Appl. Opt. 2011, 50, 4310–4319. [Google Scholar] [CrossRef] [PubMed]
  26. Strobl, M. General solution for quantitative dark-field contrast imaging with grating interferometers. Sci. Rep. 2014, 4, 7243. [Google Scholar] [CrossRef] [PubMed]
  27. Ibrahimkutty, S.; Wagener, P.; dos Santos Rolo, T.; Karpov, D.; Menzel, A.; Baumbach, T.; Barcikowski, S.; Plech, A. A hierarchical view on material formation during pulsed-laser synthesis of nanoparticles in liquid. Sci. Rep. 2015, 5, 16313. [Google Scholar] [CrossRef] [PubMed]
  28. Von Freymann, G.; Ledermann, A.; Thiel, M.; Staude, I.; Essig, S.; Busch, K.; Wegener, M. Three-dimensional nanostructures for photonics. Adv. Funct. Mater. 2010, 20, 1038–1052. [Google Scholar] [CrossRef]
  29. Maruo, S.; Nakamura, O.; Kawata, S. Three-dimensional microfabrication with two-photon-absorbed photopolymerization. Opt. Lett. 1997, 22, 132–134. [Google Scholar] [CrossRef] [PubMed]
  30. Goodman, J.W. Introduction to Fourier Optics; Roberts and Company: Atlanta, GA, USA, 2005. [Google Scholar]
  31. Malecki, A.; Potdevin, G.; Pfeiffer, F. Quantitative wave-optical numerical analysis of the dark-field signal in grating-based X-ray interferometry. EPL 2012, 99, 48001. [Google Scholar] [CrossRef]
  32. Wen, H.; Bennett, E.E.; Hegedus, M.M.; Rapacchi, S. Fourier X-ray Scattering Radiography Yields Bone Structural Information. Radiology 2009, 251, 910–918. [Google Scholar] [CrossRef] [PubMed]
  33. Koenig, T.; Zuber, M.; Trimborn, B.; Farago, T.; Meyer, P.; Kunka, D.; Albrecht, F.; Kreuer, S.; Volk, T.; Fiederle, M.; et al. On the origin and nature of the grating interferometric dark-field contrast obtained with low-brilliance X-ray sources. Phys. Med. Biol. 2016, 61, 3427–3442. [Google Scholar] [CrossRef] [PubMed]
  34. Artzner, G.E. Microlens arrays for Shack-Hartmann wavefront sensors. Opt. Eng. 1992, 31, 1311. [Google Scholar] [CrossRef]
  35. Reich, S.; Plech, A. Shack-Hartman Sensor Wavefront Reconstruction Software; Karlsruhe Institute of Technology (KIT): Karlsruhe, Germany, 2018. [Google Scholar]
  36. Vittoria, F.A.; Kallon, G.K.N.; Basta, D.; Diemoz, P.C.; Robinson, I.K.; Olivo, A.; Endrizzi, M. Beam tracking approach for single-shot retrieval of absorption, refraction, and dark-field signals with laboratory X-ray sources. Appl. Phys. Lett. 2015, 106, 224102. [Google Scholar] [CrossRef]
  37. Southwell, W. Wave-front estimation from wave-front slope measurements. J. Opt. Soc. Am. 1980, 70, 998. [Google Scholar] [CrossRef]
  38. Pathak, B.; Boruah, B.R. Improved wavefront reconstruction algorithm for Shack-Hartmann type wavefront sensors. J. Opt. 2014, 16, 055403. [Google Scholar] [CrossRef]
  39. Dos Santos Rolo, T.; Ershov, A.; van de Kamp, T.; Baumbach, T. In vivo X-ray cine-tomography for tracking morphological dynamics. Proc. Natl. Acad. Sci. USA 2014, 111, 3921–3926. [Google Scholar] [CrossRef] [PubMed]
  40. Reich, S.; Schönfeld, P.; Wagener, P.; Letzel, A.; Ibrahimkutty, S.; Gökce, B.; Barcikowski, S.; Menzel, A.; dos Santos Rolo, T.; Plech, A. Pulsed laser ablation in liquids: Impact of the bubble dynamics on particle formation. J. Colloid Interface Sci. 2017, 489, 106–113. [Google Scholar] [CrossRef] [PubMed]
  41. Reich, S.; Schönfeld, P.; Letzel, A.; Kohsakowski, S.; Olbinado, M.; Gökce, B.; Barcikowski, S.; Plech, A. Fluence Threshold Behaviour on Ablation and Bubble Formation in Pulsed Laser Ablation in Liquids. ChemPhysChem 2017, 18, 1084–1090. [Google Scholar] [CrossRef] [PubMed]
  42. David, C.; Nöhammer, B.; Solak, H.H.; Ziegler, E. Differential X-ray phase contrast imaging using a shearing interferometer. Appl. Phys. Lett. 2002, 81, 3287–3289. [Google Scholar] [CrossRef]
  43. Polyakov, S.N.; Zholudev, S.I.; Gasilov, S.V.; Martyushov, S.Y.; Denisov, V.N.; Terentiev, S.A.; Blank, V.D. Resolution of X-ray parabolic compound refractive diamond lens defined at the home laboratory. Proc. SPIE 2017, 10243, 102430X. [Google Scholar] [CrossRef]
  44. Gasilov, S.; dos Santos Rolo, T.; Mittone, A.; Polyakov, S.; Terentyev, S.; Farago, T.; Blank, V.; Bravin, A.; Baumbach, T. Generalized pupil function of a compound X-ray refractive lens. Opt. Express 2017, 25, 25090–25097. [Google Scholar] [CrossRef] [PubMed]
  45. Gasilov, S.; Mittone, A.; dos Santos Rolo, T.; Polyakov, S.; Zholudev, S.; Terentyev, S.; Blank, V.; Bravin, A.; Baumbach, T. Refraction and ultra-small-angle scattering of X-rays in a single-crystal diamond compound refractive lens. J. Synchrotron Radiat. 2017, 24, 1137–1145. [Google Scholar] [CrossRef] [PubMed]
  46. Yashiro, W.; Momose, A. Effects of unresolvable edges in grating-based X-ray differential phase imaging. Opt. Express 2015, 23, 9233. [Google Scholar] [CrossRef] [PubMed]
  47. Zeng, H.; Du, X.W.; Singh, S.C.; Kulinich, S.A.; Yang, S.; He, J.; Cai, W. Nanomaterials via laser ablation/irradiation in liquid: A review. Adv. Funct. Mater. 2012, 22, 1333–1353. [Google Scholar] [CrossRef]
  48. Zhang, D.; Gökce, B.; Barcikowski, S. Laser Synthesis and Processing of Colloids: Fundamentals and Applications. Chem. Rev. 2017, 117, 3990–4103. [Google Scholar] [CrossRef] [PubMed]
  49. Reich, S.; Göttlicher, J.; Letzel, A.; Gökce, B.; Barcikowski, S.; dos Santos Rolo, T.; Baumbach, T.; Plech, A. X-ray spectroscopic and stroboscopic analysis of pulsed-laser ablation of Zn and its oxidation. Appl. Phys. A 2018, 124, 71. [Google Scholar] [CrossRef]
  50. Ibrahimkutty, S.; Wagener, P.; Menzel, A.; Plech, A.; Barcikowski, S. Nanoparticle formation in a cavitation bubble after pulsed laser ablation in liquid studied with high time resolution small angle X-ray scattering. Appl. Phys. Lett. 2012, 101, 103104. [Google Scholar] [CrossRef]
  51. Letzel, A.; Gökce, B.; Wagener, P.; Ibrahimkutty, S.; Menzel, A.; Plech, A.; Barcikowski, S. Size Quenching during Laser Synthesis of Colloids Happens Already in the Vapor Phase of the Cavitation Bubble. J. Phys. Chem. C 2017, 121, 5356–5365. [Google Scholar] [CrossRef]
  52. Kaeppler, S.; Bayer, F.; Weber, T.; Maier, A.; Anton, G.; Hornegger, J.; Beckmann, M.; Fasching, P.A.; Hartmann, A.; Heindl, F.; et al. Signal Decomposition for X-ray Dark-Field Imaging. In MICCAI 2014, Part I; Golland, P., Hata, N., Barillot, C., Hornegger, J., Howe, R., Eds.; Springer International Publishing: Berlin, Germany, 2014; pp. 170–177. [Google Scholar]
  53. Reich, S.; dos Santos Rolo, T.; Letzel, A.; Baumbach, T.; Plech, A. Scalable, large area compound array refractive lens for hard X-rays. Appl. Phys. Lett. 2018, 112, 151903. [Google Scholar] [CrossRef]
Figure 1. Images of the lens array: (a) scanning electron microscope (SEM) image where the two planes of cylinder lenses can be seen (X-ray direction in use is perpendicular to the smooth surface); (b) tomogram through a horizontal plane; (c,d) radiographs from the lateral and front side. In (c) three vertical irregularities can be seen which originate from the printing process (marked with red arrows). Scale bars are 200 μ m.
Applsci 08 00737 g001
Figure 2. Schematic illustration of the experimental setup with the flat X-ray beam coming from the synchrotron getting disturbed by the sample and consequently analyzed by the Shack-Hartmann sensor for hard X-rays (SHARX) and measured by the detector. The crossed cylinder lenses lead to small spots on the detector which may get shifted, broadened or/and attenuated as depicted by the blue arrow. CRL: compound refractive X-ray lenses.
Applsci 08 00737 g002
Figure 3. (a) Spot sizes for the scanned distance between lens array and detector. The focal distance (average of all 400 spots) is about 200 mm (for 9 keV), defined where spots have the smallest width. The spots have a slightly different width for the x- and y-direction, which arises from different source sizes in horizontal and vertical axis; (b) Line plots through three spot rows (red and blue offset shifted), showing the intensity profile in x-direction at a distance of 200 mm as well as the incoming X-ray intensity (dashed lines).
Applsci 08 00737 g003
Figure 4. Reconstruction of the phase shift of the beam introduced by a diamond lens. (a) shows in the left half the unperturbed beamlet array and in the right half the pattern with diamond lens introduced (rim indicated by red dashed line, intensity inverted and contrasts optimized for better comparison); (b) shows the vector field of the spot shifts; (c) displays the reconstructed phase shift as surface plot with selected cuts in x, y and z; (d) shows the deflection of X-rays along two orthogonal lines crossing the CRL center (red and black markers) as derived by the Shack-Hartmann setup. A comparison with deflection angles computed based on the real lens shapes as determined by microtomography data (dashed line) is shown; (e) shows (from top to bottom) the differential phase (as beam deflection) in x and y-direction and the diffraction in x and y-direction.
Applsci 08 00737 g004
Figure 5. Results of a multi-contrast imaging of a transient cavitation bubble during ablation under liquid at its maximum expansion. Two separate measurements were repeated at two selected positions relative to the bubble, as indicated in the bright-field radiogram in (f) and merged after reconstruction. (ad) show the different contrasts after averaging over 700 individual exposures of 33 μ s each. Note that the diffraction is the mean of the two directional values as no anisotropic scattering is expected. The graph in (e) shows the calculated sensitivity curve on scattering particle size. The graph in (g) shows clearly the correspondence of transmission and differential phase (shown in beam deflection) as function of bubble height above the target.
Applsci 08 00737 g005

