Large Scale Imaging by Fine Spatial Alignment of Multi-Scanning Data with Gel Cube Device


1
NanoSquare Research Institute, Osaka Prefecture University, Osaka 599-8570, Japan
2
Department of Bioscience and Informatics, Osaka Prefecture University, Osaka 599-8570, Japan
3
Department of Biological Functions Engineering, Kyushu Institute of Technology, Kitakyushu 808-0196, Japan
*
Author to whom correspondence should be addressed.
Appl. Sci. 2018, 8(2), 235; https://doi.org/10.3390/app8020235
Submission received: 10 January 2018
/
Revised: 31 January 2018
/
Accepted: 1 February 2018
/
Published: 4 February 2018
(This article belongs to the Special Issue Microfluidics in Biology and Medicine)
Abstract
:In vitro three-dimensional (3D) culturing is considered essential in many biological fields. However, the imaging of developed 3D formations is often difficult, especially if the size of the sample is relatively large. The z-resolution of fluorescent imaging is low using low magnification lenses (4× and 10×) due to large focal depths. This paper describes 3D culture platform enabling large scale 3D imaging by fine spatial alignment of the image dataset obtained from multiple directions. A gel cube device was employed to conduct the multi-scanning and then a self-fluorescent microstructure in a cubic frame allows us spatially align image dataset within a few pixels. By synthesizing data from multiple scans, the platform enables us to visualize millimeter-sized 3D sample structure and individual cellular actin filaments at the same time. Millimeter depth imaging of a developed bronchial tree was achieved with high z-resolution. The device, which is applicable to most microscopy systems, can enhance the image quality without modifying current systems.
1. Introduction
In vitro three-dimensional (3D) culture is highly important in many biological fields. The extracellular matrix (ECM) in 3D cultures provides cellular microenvironments completely different from those of 2D cultures, as illustrated by chemical and mechanical interactions with the ECM, molecular gradients, and substrate stiffness [1,2,3]. Thus, cell responses in 3D culture are different from those in 2D culture. Many morphological processes, including epithelial sheet folding [4,5,6] and the helical motion of cells [7,8] during tissue formation, arise only when cells are surrounded by ECM. However, imaging developed 3D structures is often difficult, especially if samples are several millimeters in size. Laser microscopic systems, such as confocal microscopy [9] and two photon microscopy [10] systems, are used to obtain detailed molecular information from cultured samples, but these laser microscopic systems have poor resolution in the z-direction when samples are imaged at a broad view with small magnification lenses (4× and 10×). In addition, fluorescent signals are hard to detect at deep area when an objective lens with low numerical aperture (NA) is used. Sectioning of biological samples following paraffin embedding or freezing can yield better images for thick samples, but samples may deteriorate during slicing, and it is difficult to see correlations between large scale of tissue form and molecular expression. Light sheet microscopy [11,12,13] can overcome these problems and image tissue-sized samples, but these samples must be transferred to a special container for imaging, a process that may damage the sample. In addition, this system is quite expensive and not accessible to all researchers. Various laser microscopy systems are now commercially available, but there is no universal system for all imaging purposes. Therefore, systems or platforms, which have broad utility and do not alter users’ current experimental setup, are required to enhance image quality for large-scale tissue samples.
The method of sample setup may result in enhanced image quality. For example, a vertical confocal observation system has been found to enhance z-resolution by magnetic rotation of the sample, but these samples are limited to a single cell level cultured in 2D [14]. By contrast, we developed a 3D culture device composed of two different hydrogel types in a cubic frame, enabling transfer and rotation of a bio-sample with ECM during culturing. The device does not deteriorate cell viability comparing to the one cultured in a dish and the size of the device can be varied depending on the sample size and applications as described previously [15]. Besides, it is capable of culturing any bio-sample and is applicable to most commercial culture devices and microscopes. However, the images taken from multiple directions were hard to align spatially as 3D data and it prevented from capturing detailed 3D structure of large sample. This study describes a novel in vitro 3D culture platform that utilizes this gel cube device to image large-scale samples by achieving fine alignment of image dataset. To overcome the drawbacks of low magnification lenses, including large focal depth and low NA, samples were scanned from six sides and the imaged data were aligned precisely by self-fluorescent microstructure fabricated by photolithography. This device is applicable to the most of experimental setup while enabled clear images in the x-y-z direction to be obtained for millimeter-sized tissue samples.
2. Materials and Methods
2.1. Fabrication of the Gel Cube Device with Alignment Mark
A cubic polycarbonate (PC) frame, 3 mm on each side, was machined by drilling and grinding. The thickness of the frame was 0.5 mm. Then, microstructure fabricated by photolithography was attached to the vertex of the PC frame by polydimethylsiloxane (PDMS). The frame was placed on a precooled glass slide, and 4.5 µL of 1.5% agarose (A9414; Sigma-Aldrich, St. Louis, MO, USA) was dropped inside the bottom frame to form a gel. The frame was subsequently rotated, and the other five surfaces were covered with gel. Karl Zeiss LSM-700 or Keyence BZ-X 700 sectioning module was used for z-stack imaging.
2.2. Three Dimensional Culture of NHBE in the Gel Cube Device
Normal human bronchial epithelial (NHBE) cells were purchased from Lonza (CC-2541; Walkersville, MD, USA). The growth factor-reduced reconstituted basement membrane Matrigel (#356230; Corning, NY, USA) was used as a culture gel for 3D culture experiments. Eight microliters of Matrigel was added to the gel cube device from the top, open surface. After centrifugation, 0.5 µL of concentrated NHBE (2.5 × 10⁴ cells/µL) was injected into the center of the Matrigel and incubated for 25 min at 37 °C to facilitate gelatinization. Agarose was dropped onto the top surface to confine the culture gel and sample, and the cube was incubated with medium in a well plate. The cell culture medium consisted of a one-to-one mixture of bronchial epithelial growth medium (BEGM, CC-3170; Lonza; Walkersville, MD, USA) and endothelial growth medium (EGM-2, CC-3162; Lonza; Walkersville, MD, USA) supplemented with 50 IU/mL penicillin and 50 µg/mL streptomycin. Two milliliters of this medium were added to each well, and the medium was changed every day.
2.3. Immunostaining
For fixation of NHBE, 4% paraformaldehyde (Wako Pure Chemical Industries, Ltd.; Osaka, Japan) was applied over the gel cube device at room temperature for 20 min, followed by two washes for 10 min each with phosphate buffered saline (PBS). The samples were permeabilized by incubating them in PBS containing 0.5% Triton X-100 for 10 min at 4 °C, followed by three washes for 10 min each with PBS containing 100 mM glycine. The samples were incubated with 10% goat serum in IF-buffer (0.2% Triton X-100, 0.1% BSA, and 0.05% Tween-20 in PBS) for 60 min at room temperature as a primary blocking step, followed by incubation with 1% goat anti-mouse IgG and 10% goat serum in IF-buffer for 40 min at room temperature as a secondary blocking step. The samples were incubated with rabbit monoclonal anti-FGFR2 antibody (1:50, ab5476; Abcam plc), overnight at 4 °C, followed by three washes for 20 min each with IF-buffer and incubation with Alexa fluor 555-labeled secondary antibodies (1:200, Thermo Fisher Scientific Inc.; Waltham, MA, USA). To stain actin filaments, the cells were incubated for 20 min at room temperature with Alexa fluor 488-labeled phalloidin (Lifetechnologies; Grand Island, NY, USA), followed by three washes for 20 min each with PBS.
2.4. Spatial Alignments of Scanning Dataset by Self-Fluorescent Microstructure
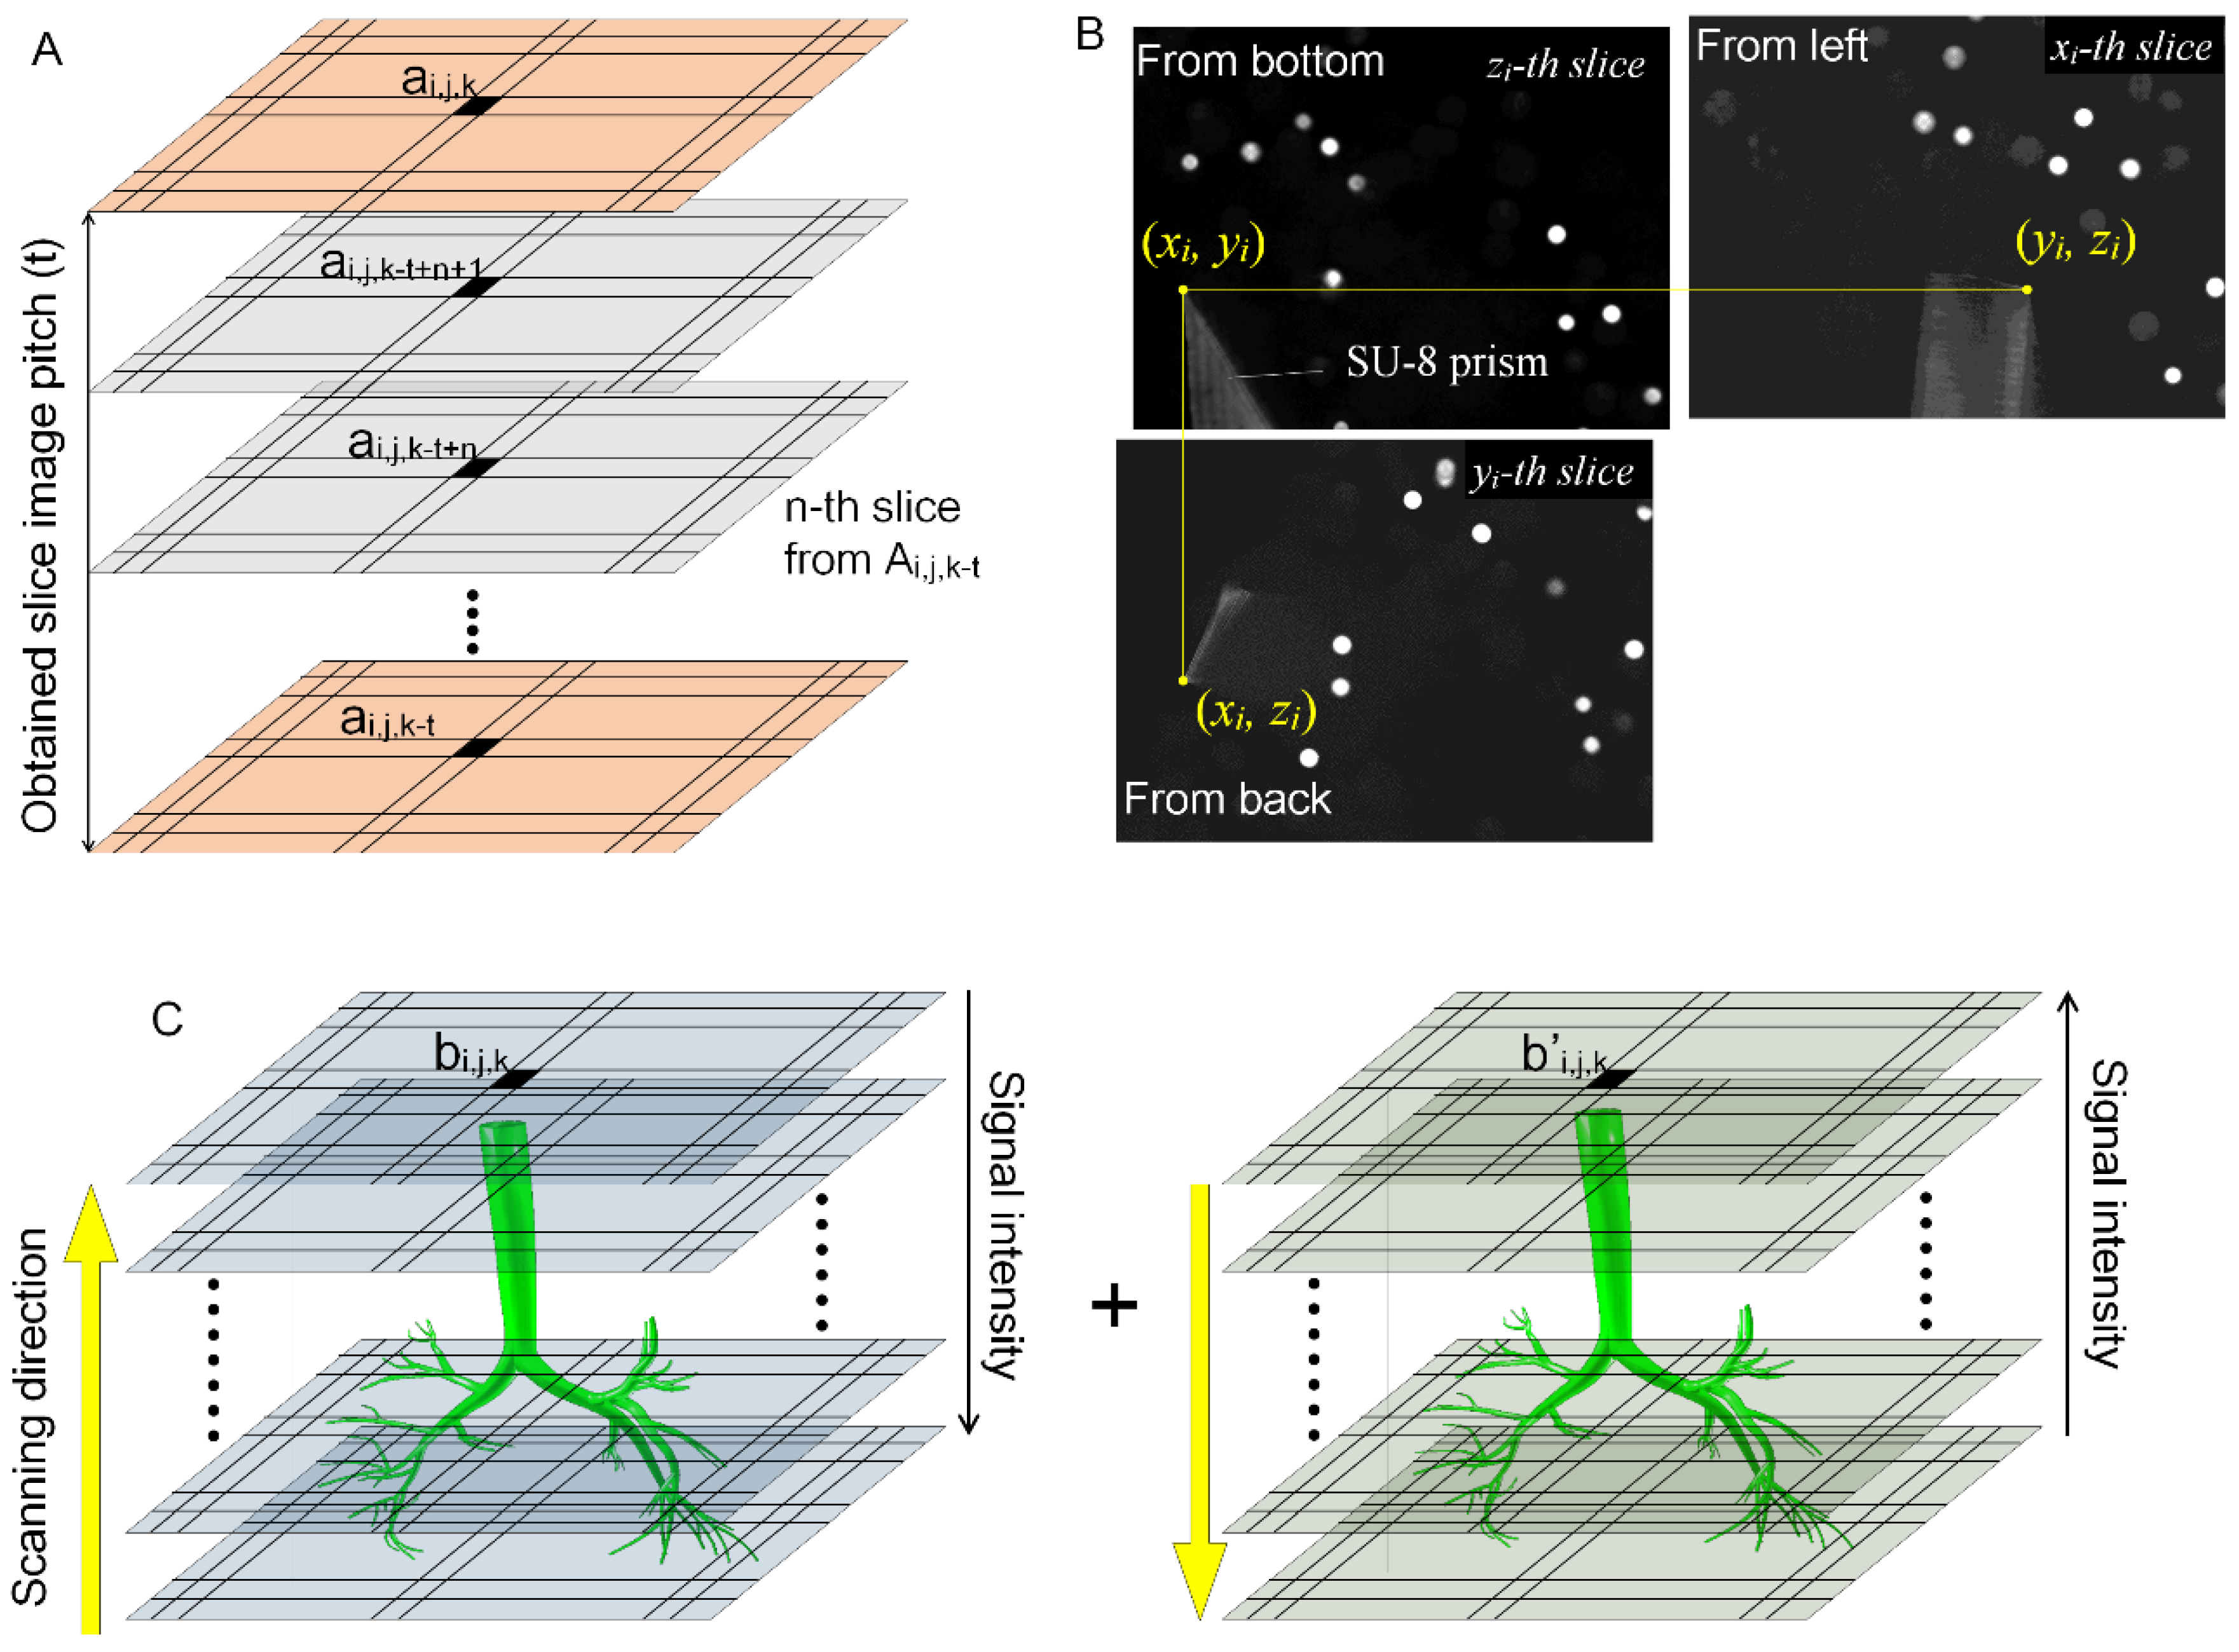
The large interval of z-stack scanning was employed to shorten total scanning time. This does not result in a deterioration of imaging quality because of the large focal depth with low magnification lenses. Rather, the intensity between slices was interpolated linearly to match the spatial resolution of the images from different sides. The linear interpolation could be expressed mathematically as (Appendix A, Figure A1A):
where ai,j,k indicates the fluorescent intensity at the (i, j, k) grid, t indicates the obtained slice pitch in pixels, and n represents the number of slices from the last obtained image. In this study, t was set at 4 pixels for a 10× magnification lens at a resolution of 2.27 µm/voxel. The sharpest vertex point of the prism alignment mark made by SU-8 observed from three directions was selected for the spatial alignments (Appendix A, Figure A1B).
2.5. Synchronizing Projected Section Images of the x-y, y-z and z-x Planes
The images taken from opposite sides were averaged to cover the farthest side from the objective lens, where fluorescent signals tend to be weak (Appendix A, Figure A1C). The averaged data along an arbitrary axis can be expressed as:
The data obtained from the six sides were compounded into three datasets along the x, y, and z axes with the same spatial resolution and scale.
The section images were read as three datasets for the x-y, y-z and z-x planes and displayed with Matlab software (Math Works, Inc., Natick, MA, USA). The grid size (i, j, k) = (480, 640, 480) was used at a resolution of 2.27 µm/voxel. The spatial position was obtained from the position of the mouse in a plane, and the slice images in the other two planes were synchronously switched in accordance with the position of the mouse.
2.6. Reconstruction of a 3D Image from Multi-Directional Imaging
To reconstruct a 3D voxel image from the obtained data, a simply averaged intensity dataset was generated. After interpolating the slice data based on Equation (1) for the six scanning datasets, the fluorescent intensity was averaged for each voxel. The reconstructed 3D image was displayed with IMARIS software (Bitplane AG, Zurich, Switzerland).
3. Results
3.1. Large-Scale 3D Imaging of Tissue Sample with a Low Magnification Lens
Laser microscopy systems are widely used to visualize specific molecular distribution, 3D outer structure, inner structure, and cellular characteristics (e.g., cell type, differentiation, and polarity). It frequently happens that undesired noise deteriorates the laser illumination imaging, and many studies of measurement systems [16,17], image algorithms [18,19], and reagent for sample preparation [20,21] have been improved to enhance image quality. However, achieving large-scale (millimeters) high-resolution 3D imaging remains difficult, due to the trade-off between the viewing range and NA of an objective lens. Imaging of a large-scale sample like tissue, requires a low magnification lens to obtain a broader view and larger focal distance; however, this results in a smaller NA and a larger focal depth. For example, use of a 10× magnification lens with NA 0.45 results in a theoretical focal depth of approximately 80 µm, making it impossible to obtain detailed information in the z-direction. Nevertheless, x-y resolution is relatively high (1–3 µm) even when using a low magnification lens (Figure 1A).
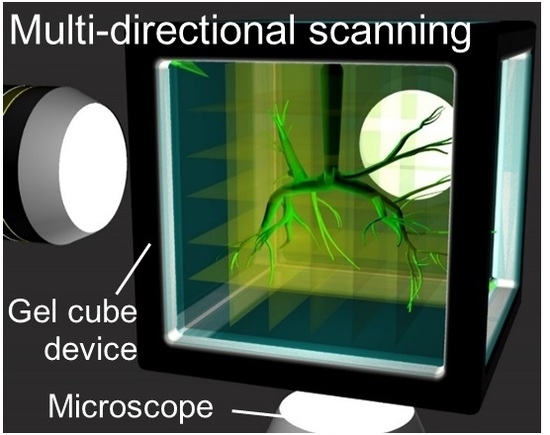
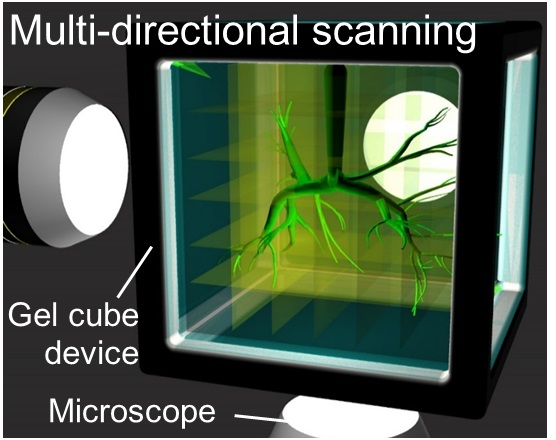
Figure 1B shows measurement errors in image dimension and shape measured in y-z and z-x planes for a 10 µm bead viewed by confocal microscopy. A Carl Zeiss LSM-700 confocal microscopy system was used, along with 10× (NA 0.45), 20× (NA 0.8) and 40× (NA 0.95) objective lenses. As the magnification of the objective lens decreased, the measurement error of dimension and shape increased, with a 300% measurement error generated when a 10× lens was used due to the large focal depth. By contrast, dimension and shape accuracy were relatively high in the x-y plane, even when using a low magnification lens, because there was no focal depth problem and the measurement resolution depended on the viewing range and charge-coupled device (CCD) camera resolution. By rotating the sample 90 degrees and obtaining z-stack images from multiple directions, it would be possible to compensate for the poor z-resolution with the x-y resolution (Figure 1C). The hybrid gel cube device (Figure 1D) allows sample rotation during 3D culturing because of its permeability to nutrients and the durability of the agarose material [15]. Multiple z-stack image datasets obtained from six sides and spatial alignments of the datasets can result in high-resolution large-scale imaging with a low magnification lens (Figure 1E).
3.2. Self-Fluorescent Microstructure for Spatial Alignment of Multi-Directional Images
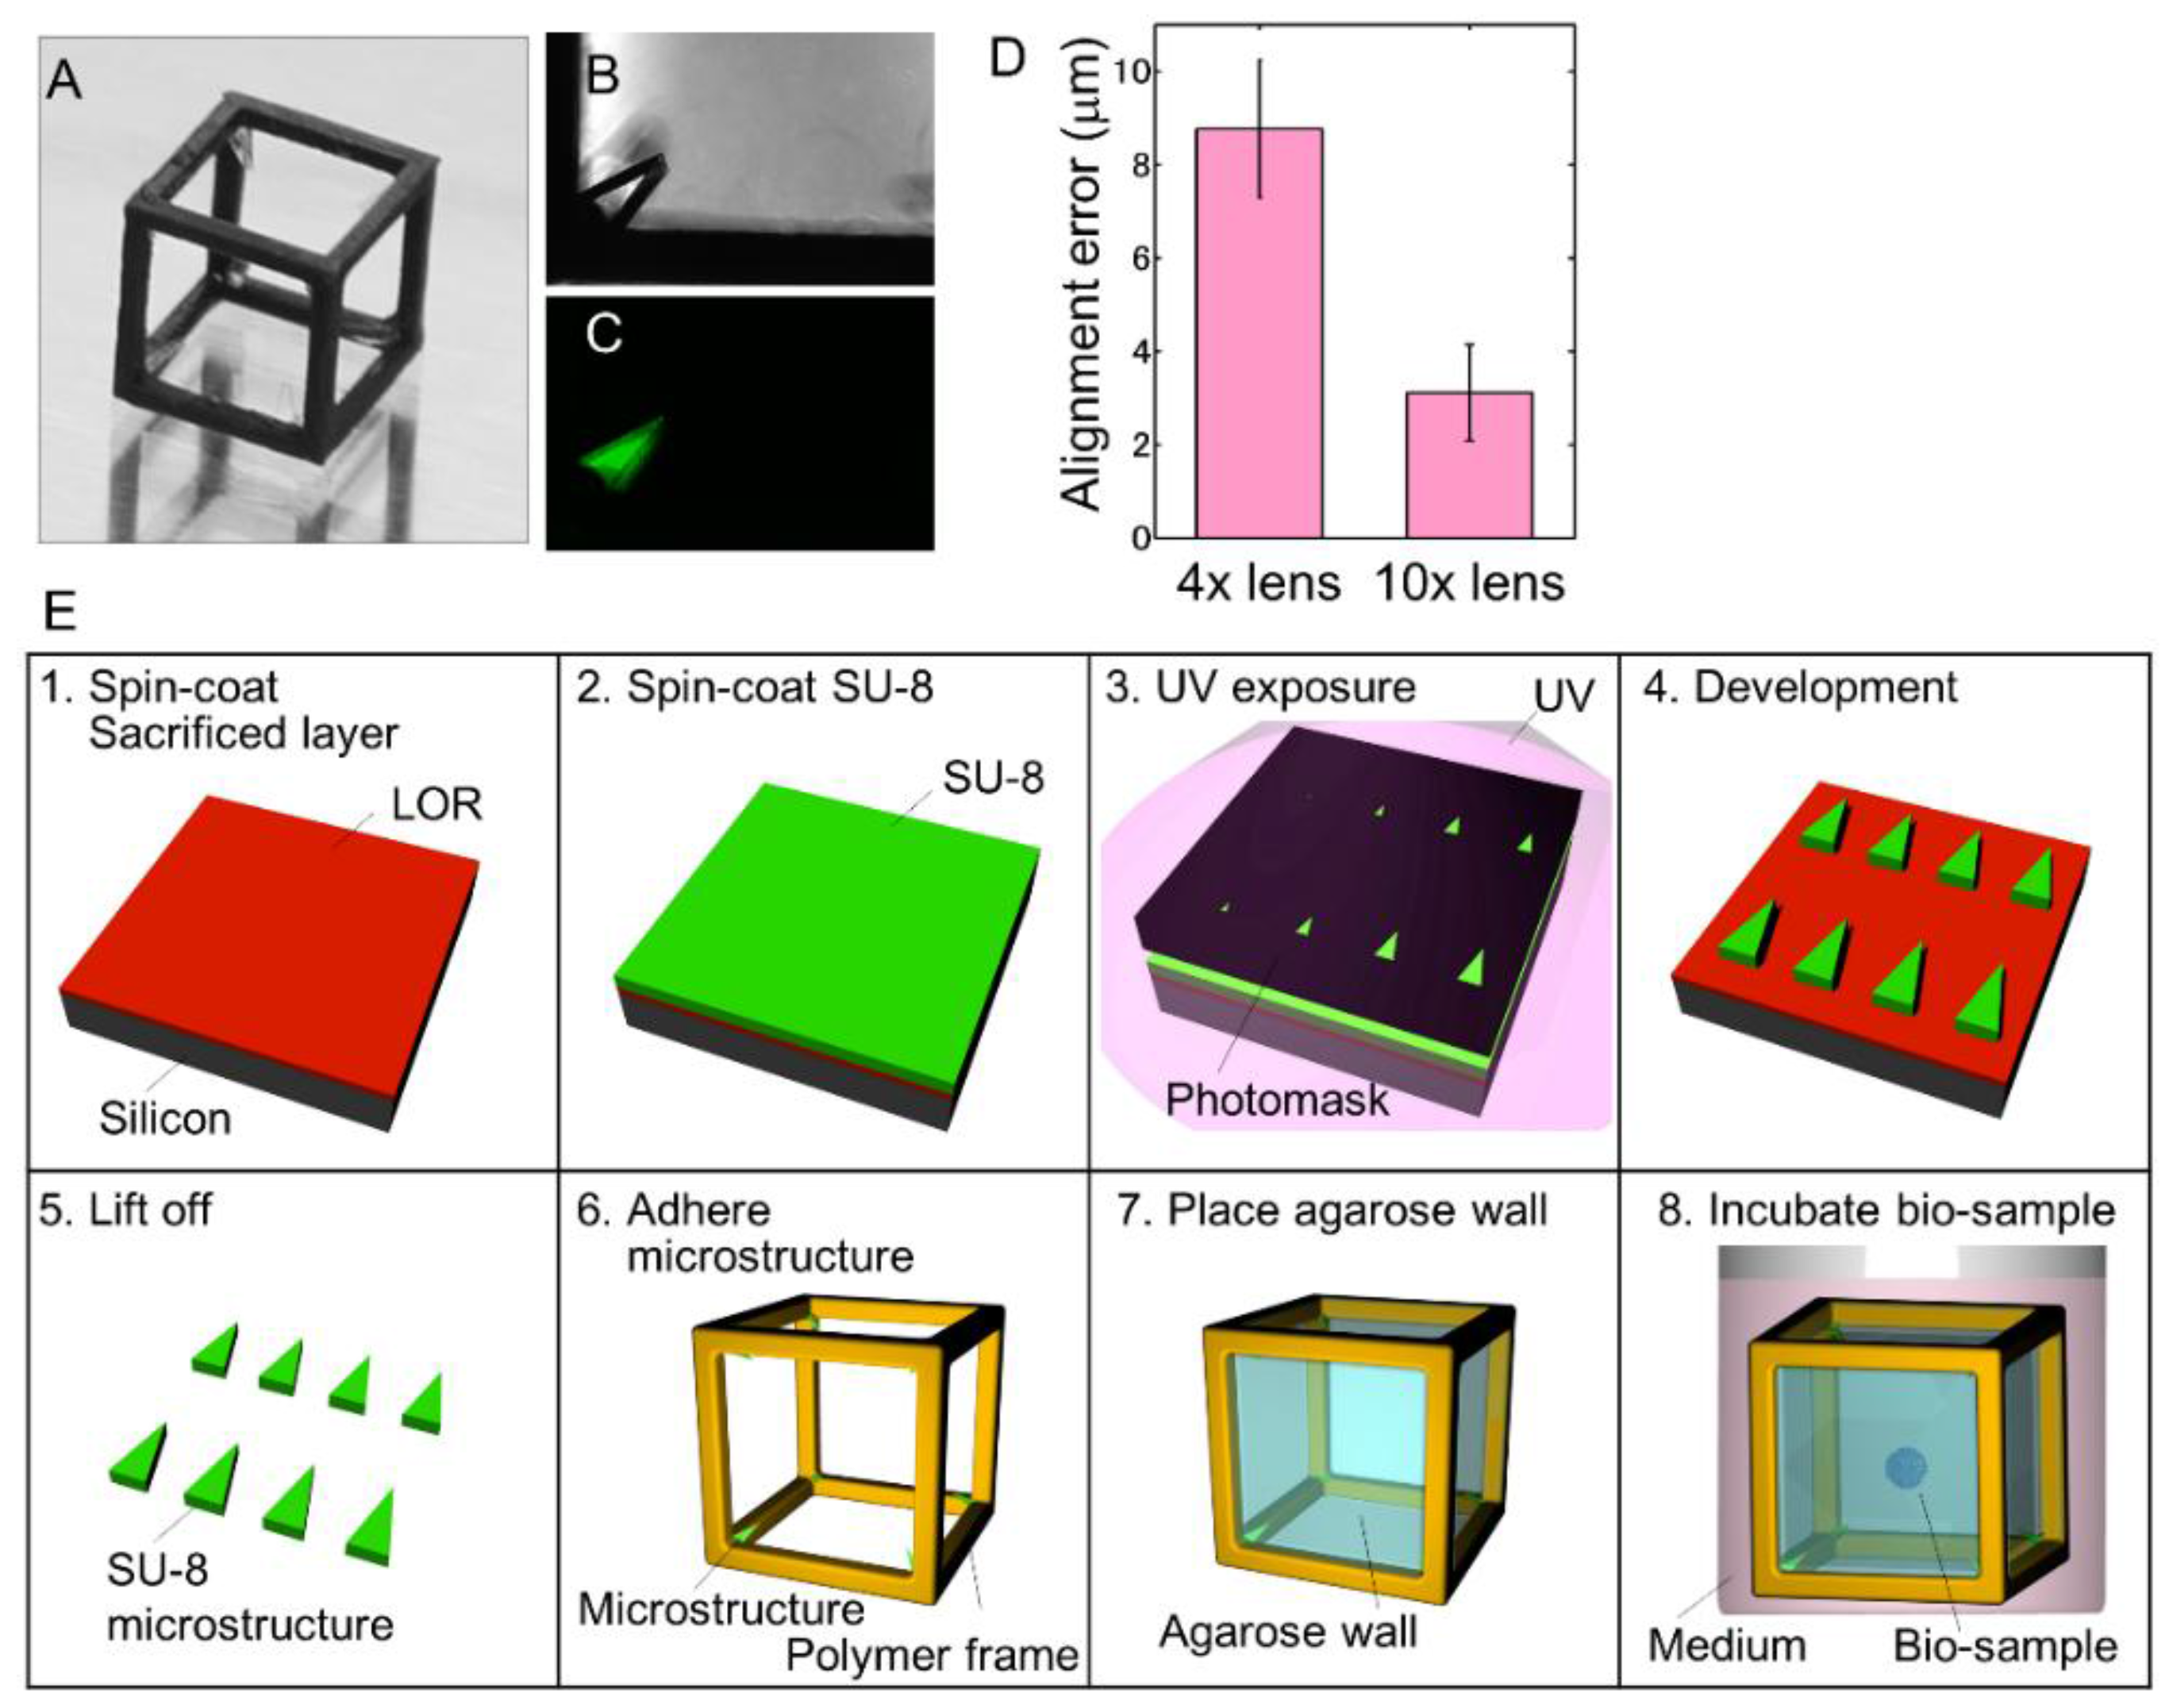
Accurate spatial alignment is the key to acquiring high-resolution images from multiple scanning data from six sides. Because alignment error may be high when the sample structure does not have a unique shape, spatial reference points are required to align the image data from different sides. The alignment marks were placed onto the polymer frame of the hybrid gel cube (Figure 2A). Negative permanent photoresist (SU-8; MicroChem Corp, MA, USA) was used to fabricate the alignment mark because of self-fluorescent ability of SU-8 as well as precision of fabrication by photolithography (Figure 2B,C). The triangular prism shape was designed for easy identification of the single point made by the vertex. Figure 2D shows the alignment error when two fabricated microstructures were used to align image data obtained from three sides. The average errors using 4× and 10× magnification lens were 8.7 µm and 3.1 µm, respectively. Relative to view range and sample size, the error in alignments does not result in deterioration of image quality.
The fabrication process is shown in Figure 2E. First, sacrificed layer, such as LOR (Nippon Kayaku, Japan), was spin coated onto a silicon wafer, followed by spin coating of SU-8 photoresist and UV exposure of the designed photomask. The SU-8 was subsequently developed with 2-methoxy-1-methylethyl acetate (Wako Pure Chemical Industries, Ltd., Osaka, Japan), and the sacrificed layer was dissolved in isopropyl alcohol to lift off the self-fluorescent microstructure. The fabricated microstructure was then attached to the polymer cubic frame at its vertexes using polydimethylsiloxane (PDMS; Dow Corning, MI, USA). Agarose was attached, and a bio-sample was placed in the cubic device with ECM as described [15]. The size of the alignment mark has a known distance and can be used as a calibration reference for z-length, under conditions where the optical length can differ from stage movement, depending on the refractive index of the surrounding environment [22].
3.3. Multi-Directional Imaging of a Large Branching Structure with a Low Magnification Lens
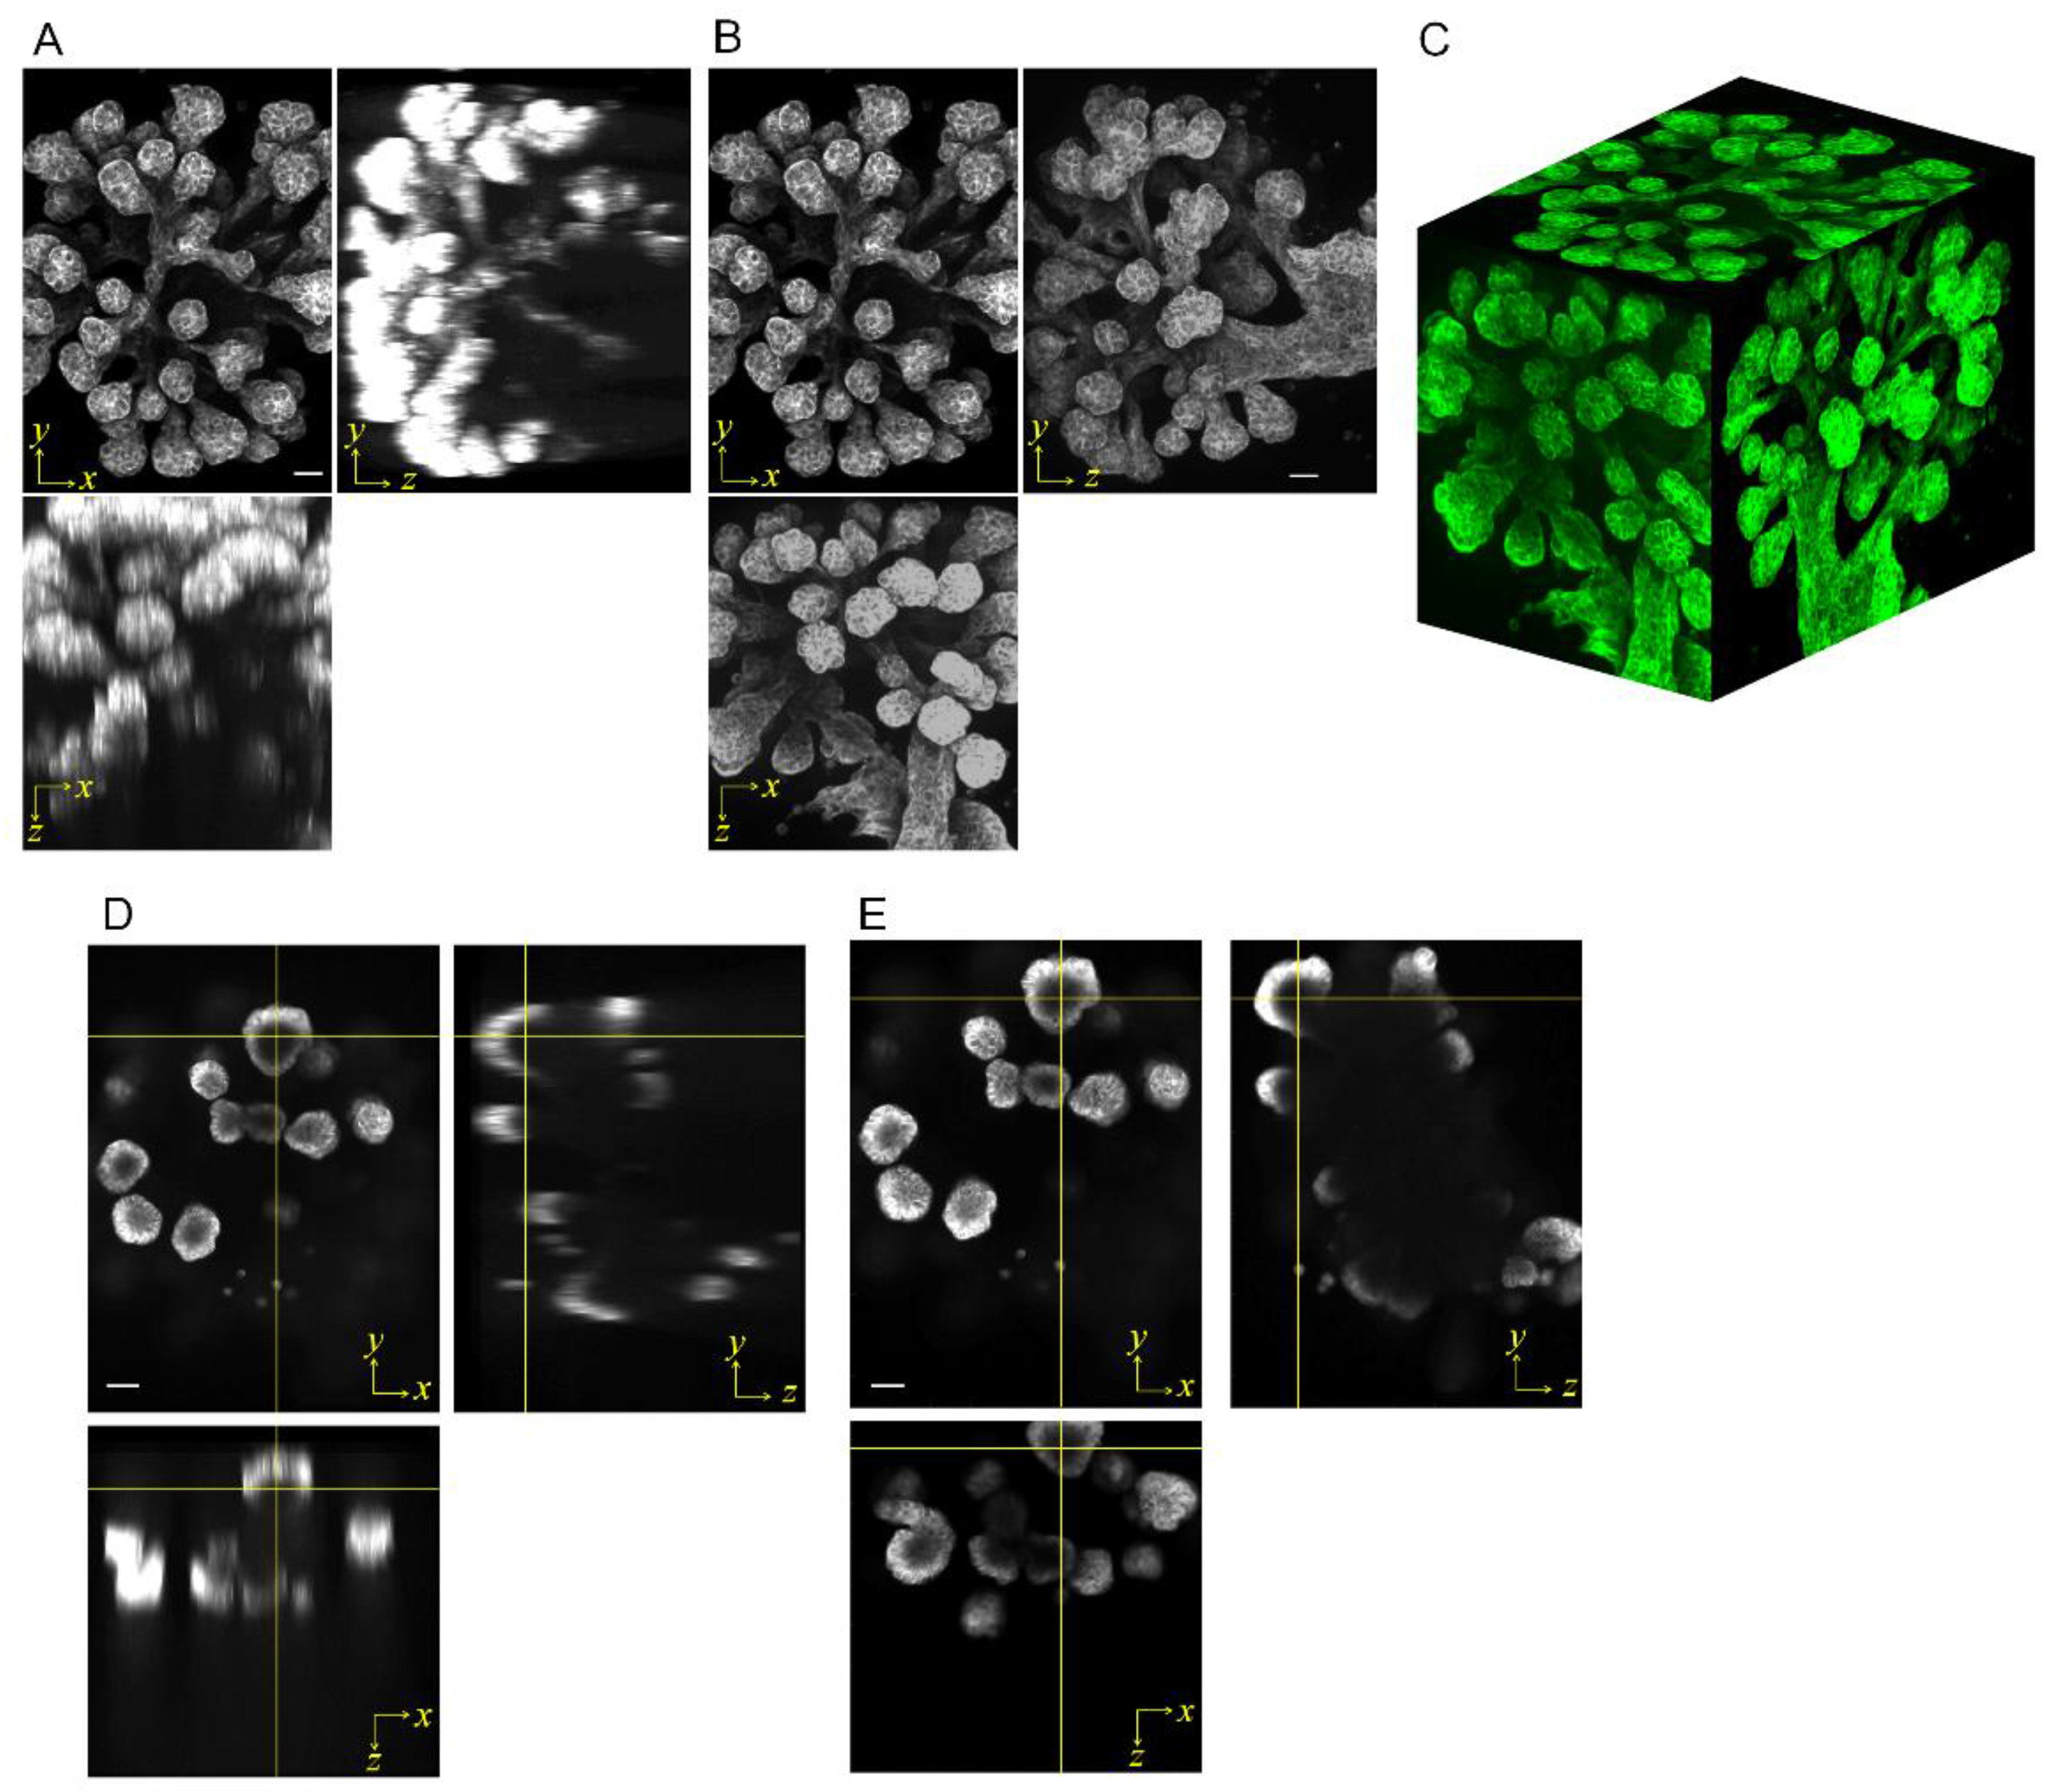
To demonstrate the capability of the gel cube device with a fine alignment mark, normal human bronchial epithelial (NHBE) cells were cultured to develop branches [23] in the fabricated cube and actin filaments were imaged. Figure 3A shows the projected images of the developed branching structure in three planes, based on z-stack imaging data obtained from a single side. Imaging of the millimeter-sized branching structure with a 10× magnification lens (NA 0.45) resulted in very poor resolution in the z-direction because of the large focal depth. Moreover, despite the expansion of branches, the signal was barely detected along the z-direction due to small NA. By contrast, Figure 3B shows projected image data obtained from six sides to the three planes. Following fine image alignment based on the alignment mark, the intensities of z-stack images from opposite sides (bottom and top, left and right, front and back) were averaged. These images are shown to be considerably superior to those in Figure 3A, as actin filaments in the y-z, z-x and x-y planes can be clearly recognized, and the entire structure can be determined precisely. This large-scale imaging with a low magnification lens resulted in a resolution high enough to detect actin filaments in the z-direction. The poor z-resolution resulting from the large focal depth was overcome by compensation with the imaging data obtained from multiple directions. In addition, assembling projected images from six sides can clearly show an overview of the entire structure of millimeter-sized bronchial trees in any arbitrary direction (Figure 3C and Supplemental Video S1).
The section images obtained from one side (Figure 3D) and six sides (Figure 3E) are also shown. The image in the x-y plane of Figure 3D suggested that branches had hollow structures, whereas the images in the y-z and z-x planes provided a negative impression due to the undetected signals on the upper side of the tube. By contrast, the hollow structure was clearly imaged in all three planes (x-y, y-z and z-x) of Figure 3E (Supplemental Video S2). These section images were taken at relatively large focal depth in each plane, with the sections being approximately 20–50 µm thick, or only 2–4% of the view range of a 10× objective lens. However, the entire structure of millimeter-sized tissue samples can be imaged clearly, with limited backlash resulting from the thickness of the sections.
3.4. Reconstructed 3D Images of Large-Sized Branch Structures
Voxel data was developed to reconstruct a 3D image of a cultured NHBE bronchial tree, which was stained for actin and fibroblast growth factor receptor 2 (FGFR2). Various sophisticated algorithms have been developed to reconstruct 3D images from multiple plane data [24,25]. In this paper, a simple algorithm, that intensity data from six datasets were averaged, was employed to demonstrate the capability of the hardware and the method using the gel cube device for large-scale imaging. The objective lens used was of 10× magnification with NA 0.45.
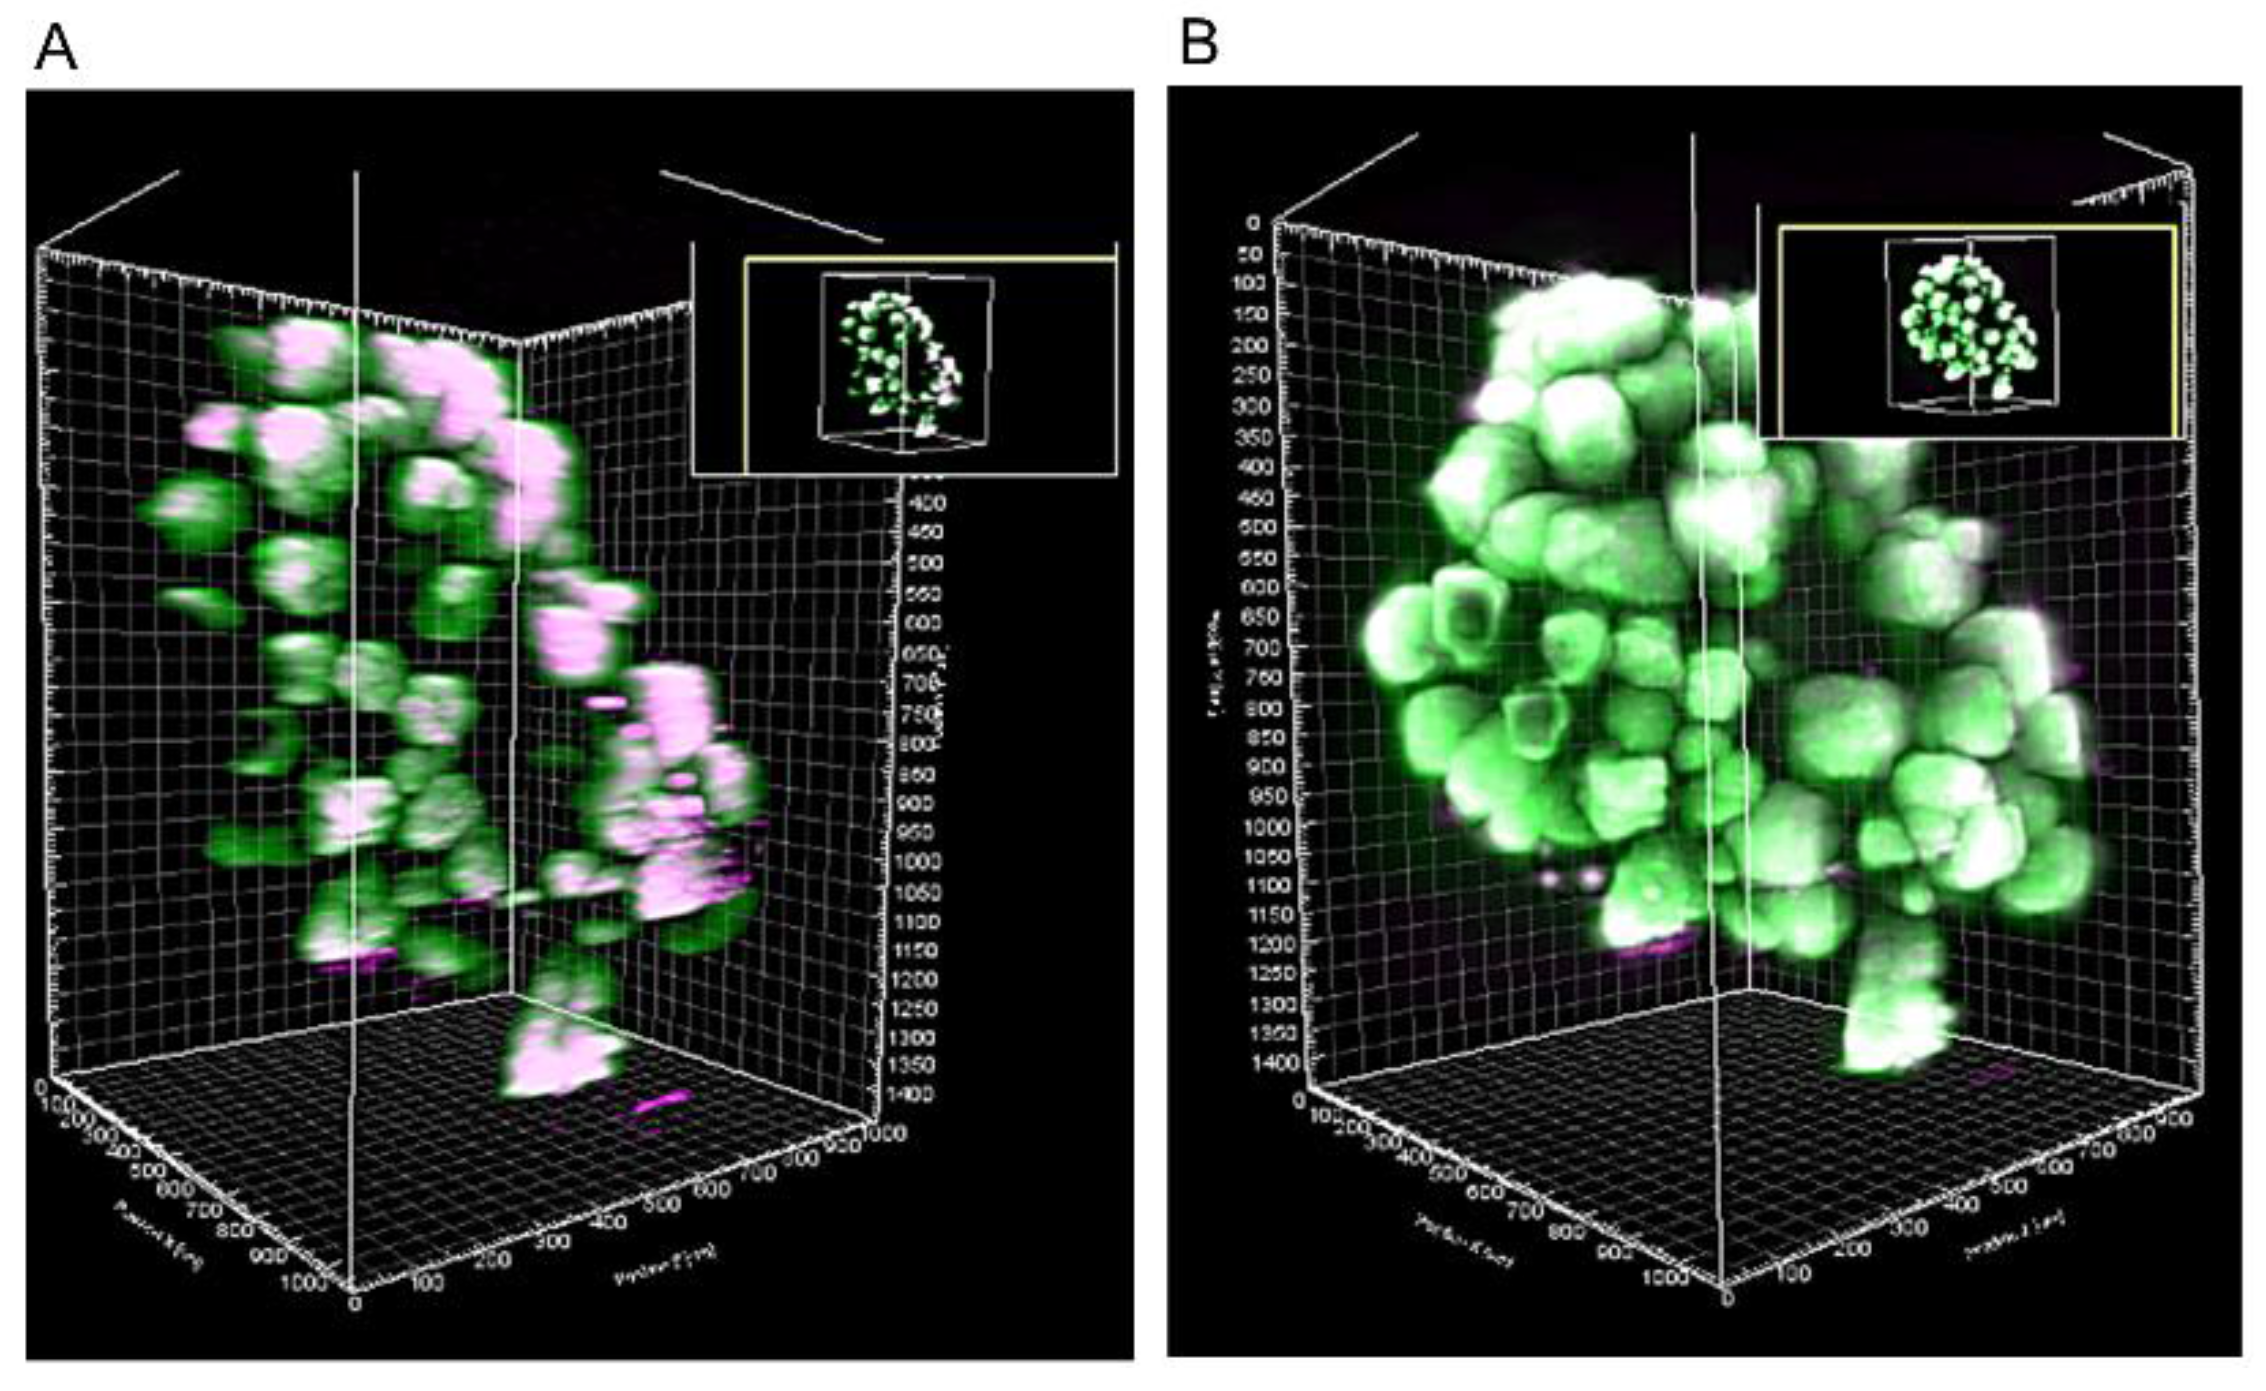
Figure 4A and Supplemental Video S3 show the 3D image reconstructed by z-stack imaging data from one side. Half of the bronchial tree was not properly imaged, and the other half had an elongated signal, although actin and FGFR2 were partially imaged. By contrast, the 3D image reconstructed by z-stack imaging data from six sides revealed the entire 3D bronchial tree structure through actin staining, with FGFR2 expressed at most branch tips (Figure 4B and Supplemental Video S4), confirming the results of imaging frozen sections [26]. The sample did not have to be physically sliced for the gel cube device to enhance image quality with multi-directional scanning. The entire sample measured 1090 × 1090 × 1544 µm, at a resolution of 2.27 µm/voxel.
4. Discussion and Conclusions
We have achieved to develop the platform enabling fine alignment of obtained datasets by multi-scanning by employing gel cube device in order to improve the resolution in the z-direction significantly, despite using a low magnification lens. A millimeter-sized branching structure could be successfully imaged without slicing the sample or employing very expensive illumination microscopy systems. The projection image obtained from multi-direction showed the entire bronchial tree structure, without encountering focal depth problems, and section images revealed the tubular structure inside the branches. Actin filaments and FGFR2 were displayed clearly. By contrast, conventional one-sided imaging showed only half the sample with low z-resolution. The algorithm used in this study to develop multi-directional images into voxel data was a simple average of the intensity values from multiple datasets. Other sophisticated algorithms [24,25] also have the potential to improve image quality of 3D reconstructions.
Multi-directional imaging systems, such as light sheet fluorescent microscopy and optical projection tomography, have been already available but the obtained images in these systems are based on planar rotation of the sample, while the methodology described in this paper supplies image datasets from three axes. In addition, the platform developed in this study is compatible with most available microscopes and culture systems, and therefore does not need to modify current experimental conditions. Other technologies that enhance image quality, including super-resolution systems, tissue transparent reagents, and molecular labeling, can be applied simultaneously; however, the gel cube device can further enhance imaging data by multi-directional scanning. In addition, the production cost of the hybrid gel cube with alignment mark is surprisingly low because only widely prevailing commercial products are employed. This device has the potential to promote research required for 3D cultures, e.g., in developmental biology, drug development, and regenerative medicine.
Supplementary Materials
The following are available online at www.mdpi.com/link, Supplemental Video S1: All-around view of assembled projected images from six sides shown in Figure 3C, Supplemental Video S2: Motion picture of Figure 3E to demonstrate spatial synchronization of the section images from multiple directions, Supplemental Video S3: All-around view of reconstructed 3D image from scanning data taken at a single side as shown in Figure 4A, Supplemental Video S4: All-around view of reconstructed 3D image from scanning data taken at six sides as shown in Figure 4B.
Acknowledgments
This work was financially supported by JSPS KAKENHI (15H05512) and the Program to Disseminate Tenure Track System, MEXT, Japan.
Author Contributions
Masaya Hagiwara and Tomohiro Kawahara conceived and designed the experiments; Rina Nobata performed the experiments; Masaya Hagiwara and Rina Nobata analyzed the data; Masaya Hagiwara and Tomohiro Kawahara wrote the paper.
Conflicts of Interest
The cubic culture device, which was previously published, was licensed to a company (Nippon Medical and Chemical Instruments Co. Ltd., Osaka, Japan) for commercialization. Authors declare no competing interest for the technologies in this paper.
Appendix A
Figure A1: Image processing for synchronizing multiple datasets.
Figure A1.
Image processing for synchronizing multiple datasets. (A) Slice images were linearly interpolated to match the resolution in the z-direction. (B) Overview image of spatial alignment using the SU-8 alignment mark. The most easily recognized vertex point from multiple directions was selected, and its (xi, yi, zi) position was determined. Images were aligned by setting this single point as a global reference point. (C) Scanning data from two opposite sides were averaged to reduce differences in signal intensity that depend on the distance from the objective lens.

References
- Baker, B.M.; Chen, C.S. Deconstructing the third dimension—How 3D culture microenvironments alter cellular cues. J. Cell Sci. 2012, 125, 3015–3024. [Google Scholar] [CrossRef] [PubMed]
- Watt, F.M.; Huck, W.T.S. Role of the extracellular matrix in regulating stem cell fate. Nat. Rev. Mol. Cell Biol. 2013, 14, 467–473. [Google Scholar] [CrossRef] [PubMed]
- Gattazzo, F.; Urciuolo, A.; Bonaldo, P. Extracellular matrix: A dynamic microenvironment for stem cell niche. Biochim. Biophys. Acta 2014, 1840, 2506–2519. [Google Scholar] [CrossRef] [PubMed]
- Lecuit, T.; Lenne, P.F. Cell surface mechanics and the control of cell shape, tissue patterns and morphogenesis. Nat. Rev. Mol. Cell Biol. 2007, 8, 633–644. [Google Scholar] [CrossRef] [PubMed]
- Tawk, M.; Araya, C.; Lyons, D.A.; Reugels, A.M.; Girdler, G.C.; Bayley, P.R.; Hyde, D.R.; Tada, M.; Clarke, J.D. A mirror-symmetric cell division that orchestrates neuroepithelial morphogenesis. Nature 2007, 466, 797–800. [Google Scholar] [CrossRef] [PubMed]
- Eiraku, M.; Takata, N.; Ishibashi, H.; Kawada, M.; Sakakura, E.; Okuda, S.; Sekiguchi, K.; Adachi, T.; Sasai, Y. Self-organizing optic-cupmorphogenesis in three-dimensional culture. Nature 2011, 472, 51–56. [Google Scholar] [CrossRef] [PubMed]
- Wyngaarden, L.A.; Vogeli, K.M.; Ciruna, B.G.; Wells, M.; Hadjantonakis, A.K.; Hopyan, S. Oriented cell motility and division underlie early limb bud morphogenesis. Development 2011, 137, 2551–2558. [Google Scholar] [CrossRef] [PubMed]
- Wang, H.; Lacoche, S.; Huang, L.; Xue, B.; Muthuswamy, S.K. Rotational motion during three-dimensional morphogenesis of mammary epithelial acini relates to laminin matrix assembly. Proc. Natl. Acad. Sci. USA 2013, 110, 163–168. [Google Scholar] [CrossRef] [PubMed]
- Minsky, M. Memoir on inventing the confocal scanning microscope. Scanning 1988, 10, 128–138. [Google Scholar] [CrossRef]
- Denk, W.; Strickler, D.H.; Webb, W.W. Two-photon laser scanning fluorescence microscopy. Science 1990, 248, 73–76. [Google Scholar] [CrossRef] [PubMed]
- Huisken, J.; Swoger, J.; Del Bene, F.; Wittbrodt, J.; Stelzer, E.H. Optical sectioning deep inside live embryos by selective plane illumination microscopy. Science 2004, 305, 1007–1009. [Google Scholar] [CrossRef] [PubMed]
- Verveer, P.J.; Swoger, J.; Pampaloni, F.; Greger, K.; Marcello, M.; Stelzer, E.H. High-resolution three-dimensional imaging of large specimens with light sheet-based microscopy. Nat. Methods 2007, 4, 311–313. [Google Scholar] [CrossRef] [PubMed]
- Andilla, J.; Jorand, R.; Olarte, O.E.; Dufour, A.C.; Cazales, M.; Montagner, Y.L.; Ceolato, R.; Riviere, N.; Olivo-Marin, J.C.; Loza-Alvarez, P.; et al. Imaging tissue-mimic with light sheet microscopy: A comparative guideline. Sci. Rep. 2017, 7, 44939. [Google Scholar] [CrossRef] [PubMed]
- Teshima, T.; Onoe, H.; Tottori, S.; Aonuma, H.; Mizutani, T.; Kamiya, K.; Ishihara, H.; Kanuka, H.; Takeuchi, S. High-Resolution Vertical Observation of Intracellular Structure Using Magnetically Responsive Microplates. Small 2013, 12, 3366–3373. [Google Scholar] [CrossRef] [PubMed]
- Hagiwara, M.; Kawahara, T.; Nobata, R. Tissue in Cube: In Vitro 3D Culturing Platform with Hybrid Gel Cubes for Multidirectional Observations. Adv. Healthc. Mater. 2016, 5, 1566–1571. [Google Scholar] [CrossRef] [PubMed]
- Preibisch, S.; Saalfeld, S.; Schindelin, J.; Tomancak, P. Software for bead-based registration of selective plane illumination microscopy data. Nat. Methods 2010, 7, 418–419. [Google Scholar] [CrossRef] [PubMed]
- Chhetri, R.K.; Amat, F.; Wan, Y.; Hockendorf, B.; Lemon, W.C.; Keller, P.J. Whole-animal functional and developmental imaging with isotropic spatial resolution. Nat. Methods 2015, 12, 1171–1178. [Google Scholar] [CrossRef] [PubMed]
- Short, K.; Hodson, M.; Smyth, I. Spatial mapping and quantification of developmental branching morphogenesis. Development 2013, 140, 471–478. [Google Scholar] [CrossRef] [PubMed]
- Pallotto, M.; Watkins, P.V.; Fubara, B.; Singer, J.H.; Briggman, K.L. Extracellular space preservation aids the connectomic analysis of neural circuits. eLife 2015, 4, E08206. [Google Scholar] [CrossRef] [PubMed]
- Tainaka, K.; Kubota, S.I.; Suyama, T.Q.; Susaki, E.A.; Perrin, D.; Tadenuma, M.U.; Ukai, H.; Ueda, H.R. Whole-Body Imaging with Single-Cell Resolution by Tissue Decolorization. Cell 2014, 159, 911–924. [Google Scholar] [CrossRef] [PubMed] [Green Version]
- Murray, E.; Cho, J.H.; Goodwin, D.; Ku, T.; Swaney, J.; Kim, S.Y.; Choi, H.; Park, Y.G.; Park, J.Y.; Hubbert, A.; et al. Simple, scalable proteomic imaging for high-dimensional profiling of intact systems. Cell 2015, 163, 1500–1514. [Google Scholar] [CrossRef] [PubMed]
- Hell, S.; Reiner, G.; Cremer, C.; Stelzer, E.H.K. Aberrations in confocal fluorescence microscopy induced by mismatches in refractive index. J. Microsc. 1993, 169, 391–405. [Google Scholar] [CrossRef]
- Hagiwara, M.; Peng, F.; Ho, C.M. In vitro reconstruction of branched tubular structures from lung epithelial cells in high cell concentration gradient environment. Sci. Rep. 2014, 5, 8054. [Google Scholar] [CrossRef] [PubMed]
- Sakaguchi, K.; Shinohara, H.; Hashimoto, T.; Yokoi, T.; Uno, K. An iterative reconstruction using median root prior and anatomical prior from the segmented m-map for count-limited transmission data in PET imaging. Ann. Nucl. Med. 2008, 22, 269–279. [Google Scholar] [CrossRef] [PubMed]
- Kudo, H.; Suzuki, T.; Rashed, E.A. Image reconstruction for sparse-view CT and interior CT—Introduction to compressed sensing and differentiated backprojection. Quant. Imaging Med. Surg. 2013, 3, 147–161. [Google Scholar] [PubMed]
- Hagiwara, M.; Maruta, N.; Marumoto, M. In Vitro Experimental Model for the Long-Term Analysis of Cellular Dynamics during Bronchial Tree Development from Lung Epithelial Cells. Tissue Eng. Part C Methods 2017, 23, 323–332. [Google Scholar] [CrossRef] [PubMed]
Figure 1.
Large-scale tissue imaging concept. (A) 3D image taken by a confocal microscope with a 40× objective lens. The projected image of microbeads 10 µm in diameter to the y-z and z-x planes was elongated due to the focal depth. (B) Quantitative evaluation of the relationship between magnification of objective lens and measurement errors in dimension and shape. Using a 10× magnification lens, the measurement error for both dimension and shape was 300% in both the y-z and z-x planes, but was considerably smaller in the x-y plane. (C) Conceptual diagram showing a method to improve resolution in the z-direction. Deep focal depth with a low magnification lens results in a deterioration of spatial resolution. However, sample rotation after z-stack imaging could convert poor z-resolution to rich x-y resolution. (D) Representative image of a gel cube device. The agarose walls were sufficiently rigid to maintain extracellular matrix (ECM) and a bio-sample inside, while being sufficiently permeable to allow high molecular weight nutrients to pass into the device from the culture medium. Thus, a bio-sample can be cultured by immersing the device in culture medium and by picking up and rotating the cubic device containing ECM during culturing. (E) Conceptual image of large-scale imaging with a low magnification lens by the gel cube device. Rotating the sample by 90 degrees allowed multiple scanning in six directions, resulting in high-resolution imaging of millimeter-sized samples.
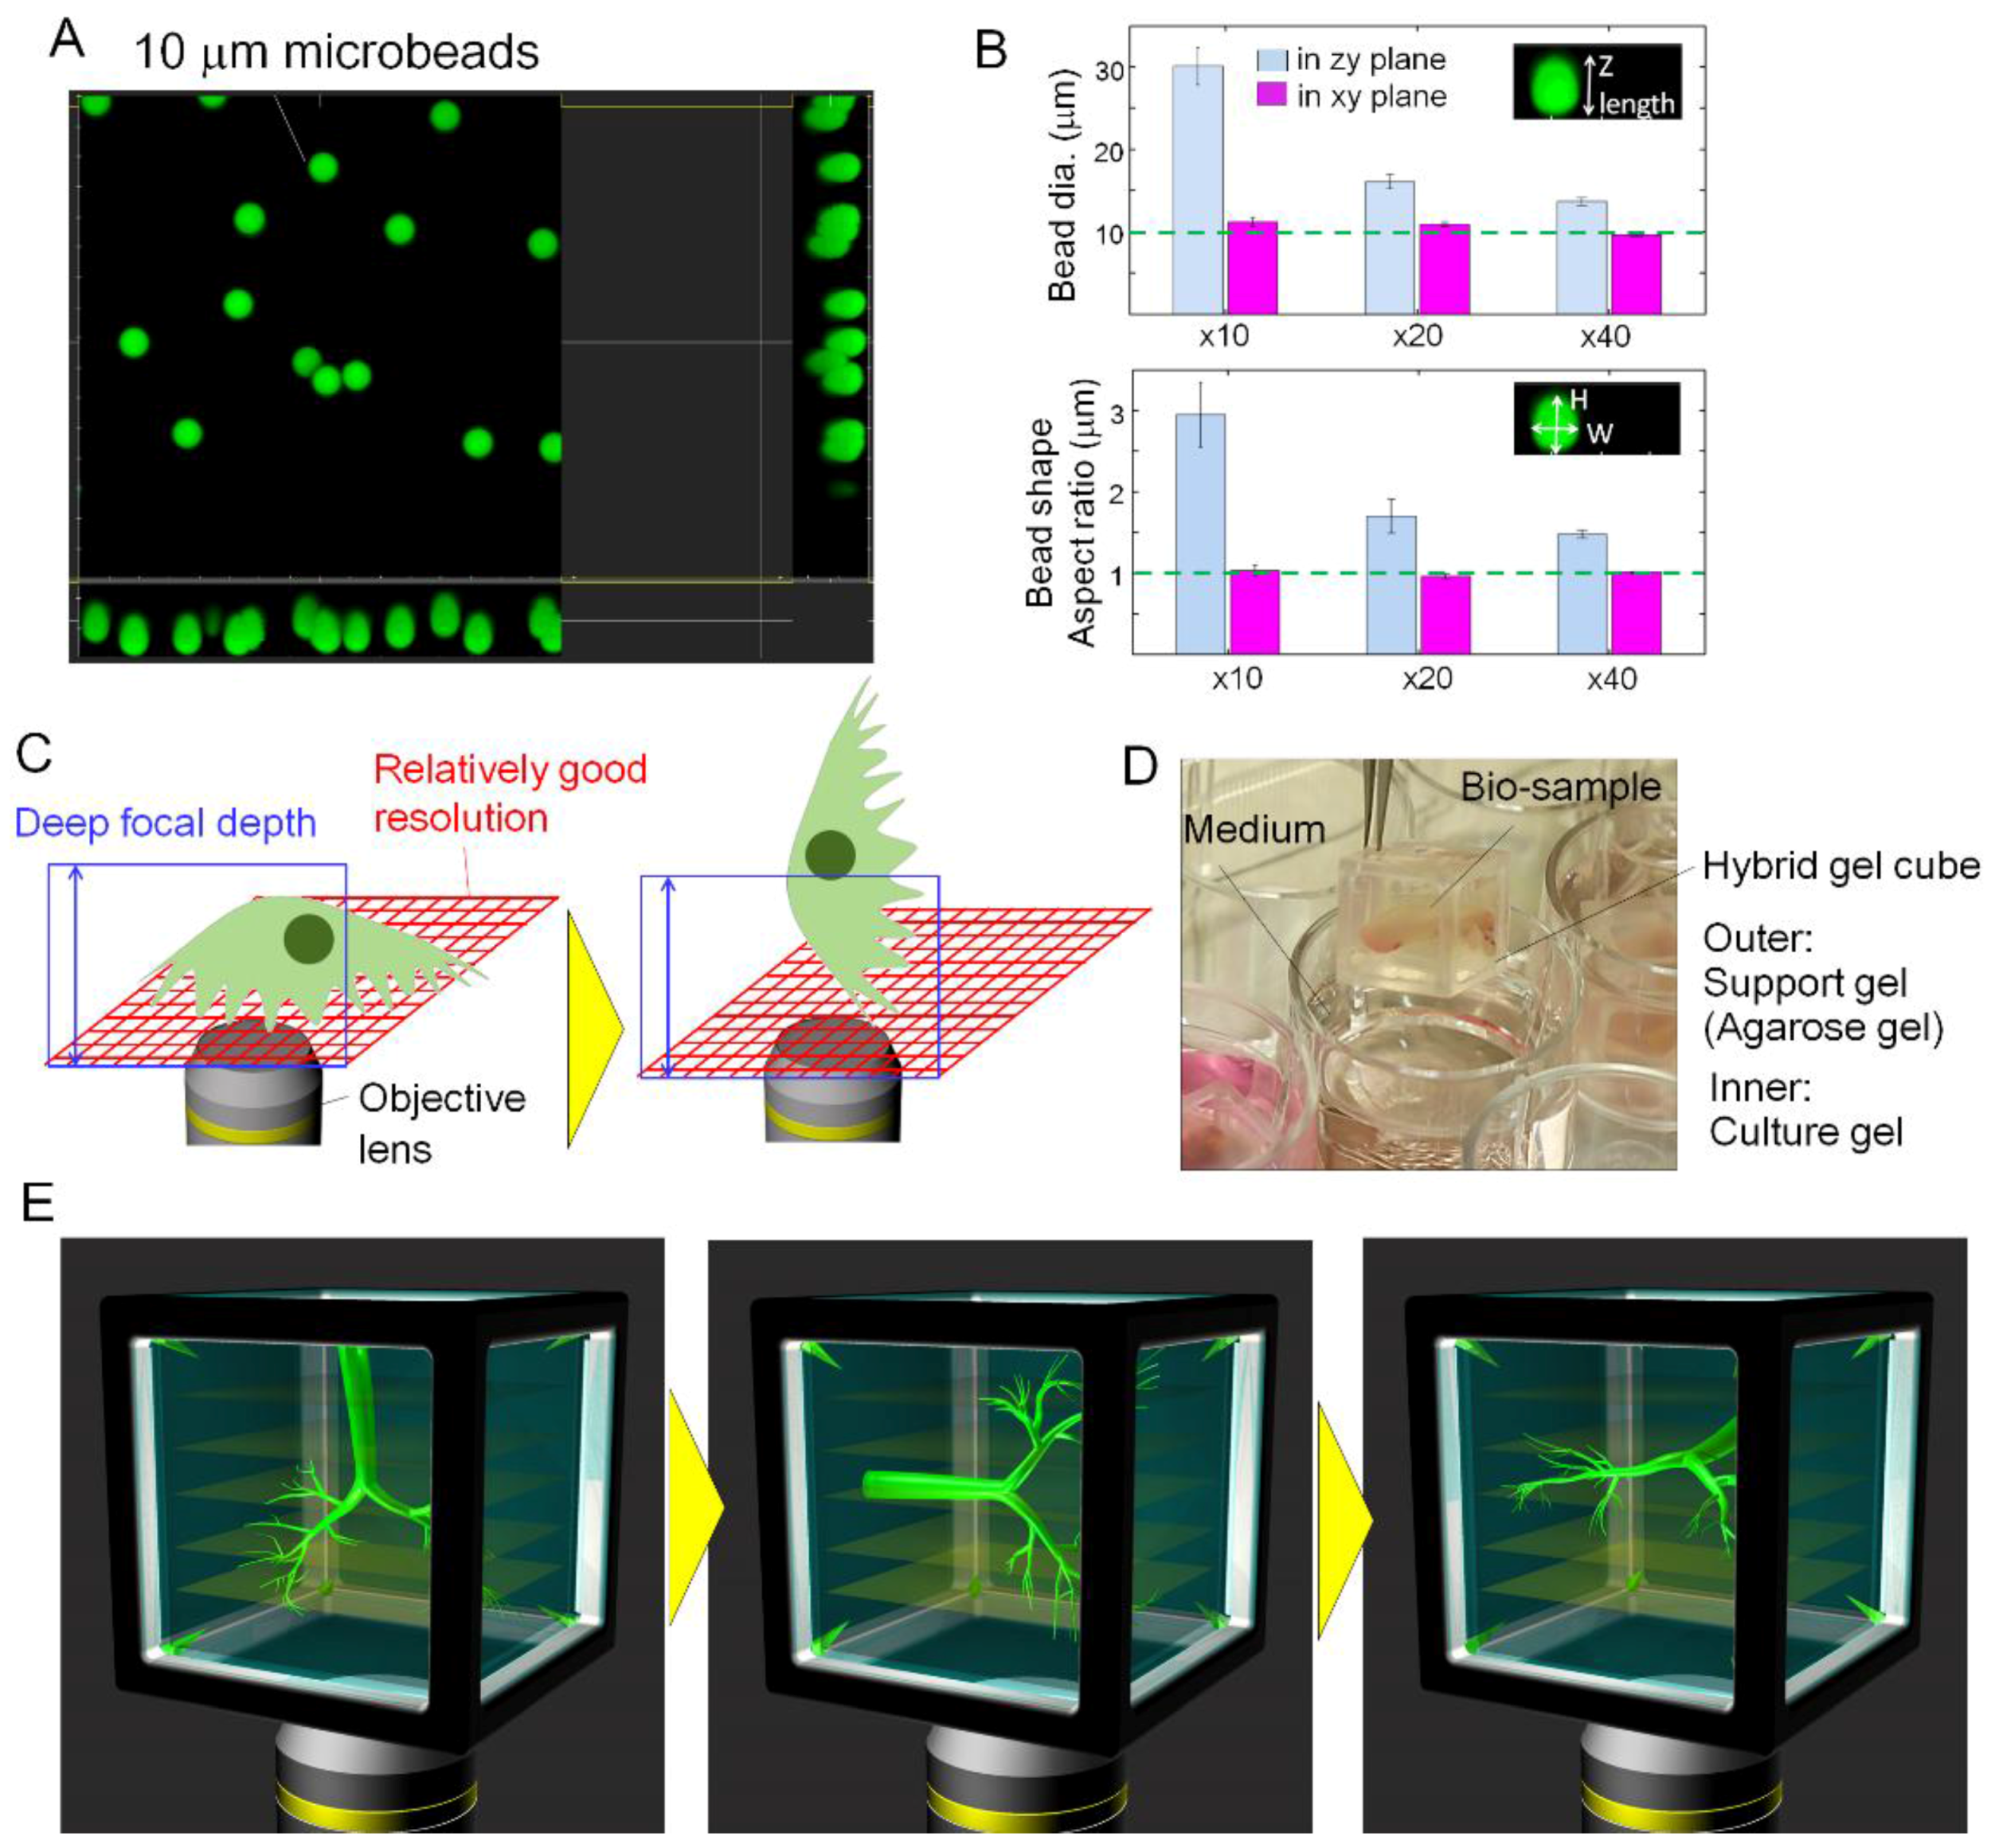
Figure 2.
Self-fluorescent microstructure for fine alignments of scanning images obtained from multi-directional scanning. (A) Overview of the SU-8 microstructure attached to the vertex of a polycarbonate frame. The larger structure was used for easier visualization. (B) Bright field image of the SU-8 microstructure. (C) Fluorescent image of the SU-8 microstructure. (D) Magnitude of alignment error using a prism-shaped alignment mark. For both 4× and 10× magnification lens, the average errors were within 2 pixels (n > 15). (E) Process of fabricating a gel cube device with an SU-8 alignment mark. The lift off process was followed by photolithography.

Figure 3.
Comparison of projected and section images of a developed bronchial tree in a gel cube taken from a single ordinal side and from six sides. Actin filaments were stained. The objective lens used had 10× magnification (NA 0.45), and the scanning area was 1087 × 1450 × 1087 µm. (A) Images of scanning z-stack data projected from one side to the x-y, y-z and z-x planes. Most undetected signals were at the high z-portion, and resolution was very low along the z-direction. (B) Projection images of three datasets obtained from six scanning datasets to the x-y, y-z and z-x planes. The image quality was sufficiently high to clearly show actin filaments in all planes, whereas the millimeter-sized whole branch sample was covered. (C) Assembled projected images from six sides. Shown is an overview of the entire structure of a millimeter-scaled bronchial tree, which can be clearly viewed from any arbitrary direction. (D) Section images taken from one side. In the x-y plane, the developed branch had a hollow structure. These findings were not supported by images in the y-z and z-x planes due to undetected areas on the upper sides of the branches. (E) Section images taken from six sides. Images in the x-y, y-z and z-x planes showed that the branch had a hollow structure. Scale bar: 100 µm.

Figure 4.
Reconstructed 3D voxel image for the developed bronchial tree. The bronchial tree was stained for expression of actin and FGFR2. The scanned area measured 1087 × 1450 × 1087 µm. (A) Image reconstructed from scanning data taken at a single side. Signals corresponding to both actin and FGFR2 could not be detected from half the developed branches. (B) Image reconstructed from scanning data taken from six sides. The fluorescent intensities were averaged to show the capability of the gel cube device. The entire structure could be clearly observed by staining for actin and FGFR2.
© 2018 by the authors. Licensee MDPI, Basel, Switzerland. This article is an open access article distributed under the terms and conditions of the Creative Commons Attribution (CC BY) license (http://creativecommons.org/licenses/by/4.0/).
Share and Cite
MDPI and ACS Style
Hagiwara, M.; Nobata, R.; Kawahara, T. Large Scale Imaging by Fine Spatial Alignment of Multi-Scanning Data with Gel Cube Device. Appl. Sci. 2018, 8, 235. https://doi.org/10.3390/app8020235
AMA Style
Hagiwara M, Nobata R, Kawahara T. Large Scale Imaging by Fine Spatial Alignment of Multi-Scanning Data with Gel Cube Device. Applied Sciences. 2018; 8(2):235. https://doi.org/10.3390/app8020235
Chicago/Turabian StyleHagiwara, Masaya, Rina Nobata, and Tomohiro Kawahara. 2018. "Large Scale Imaging by Fine Spatial Alignment of Multi-Scanning Data with Gel Cube Device" Applied Sciences 8, no. 2: 235. https://doi.org/10.3390/app8020235
Note that from the first issue of 2016, this journal uses article numbers instead of page numbers. See further details here.