Fingerprinting Acoustic Localization Indoor Based on Cluster Analysis and Iterative Interpolation


1
School of Artificial Intelligence, Hebei University of Technology, Tianjin 300130, China
2
Engineering Research Center of Intelligent Rehabilitation, Ministry of Education, Tianjin 300130, China
*
Author to whom correspondence should be addressed.
Appl. Sci. 2018, 8(10), 1862; https://doi.org/10.3390/app8101862
Submission received: 6 August 2018
/
Revised: 29 September 2018
/
Accepted: 4 October 2018
/
Published: 10 October 2018
(This article belongs to the Special Issue Modelling, Simulation and Data Analysis in Acoustical Problems)
Abstract
:Fingerprinting acoustic localization usually requires tremendous time and effort for database construction in sampling phase and reference points (RPs) matching in positioning phase. To improve the efficiency of this acoustic localization process, an iterative interpolation method is proposed to reduce the initial RPs needed for the required positioning accuracy by generating virtual RPs in positioning phase. Meanwhile, a two-stage matching method based on cluster analysis is proposed for computation reduction of RPs matching. Results reported show that, on the premise of ensuring positioning accuracy, two-stage matching method based on feature clustering partition can reduce the average RPs matching amount to 30.14% of the global linear matching method taken. Meanwhile, the iterative interpolation method can guarantee the positioning accuracy with only 27.77% initial RPs of the traditional method needed.
1. Introduction
With the development of signal processing technology and artificial intelligence technology, voice interaction has been gaining extensive attention in the smart device field [1,2,3]. Nowadays, the autonomous robot, as the representative of intelligent equipments, is expected to interact with people in a human-like way [4], and voice interaction can effectively improve its intelligence level. During human–robot interaction (HRI) process, acoustic localization technology can provide necessary reference for robot’s pose adjustment to enhance the HRI reliability [5,6]. In recent years, great advancement of theory and application has been made in acoustic localization field. Most existing acoustic localization methods are parametric positioning methods, which are based on the space geometrical propagation models of acoustical signal [6,7,8,9,10,11]. Usually, these models are simplified with the assumptions of the sound source and the transmission channel listed as follow:
- (1)
- The sound source is a particle without size and shape.
- (2)
- The signal propagates in homogeneous space.
- (3)
- The sound signal is omnidirectional.
The geometry model acoustic localization methods can achieve acceptable results outdoors, where the actual signal propagation model is similar to the ideal assumptions mentioned above. However, for indoor circumstances, the signal propagation model may be altered by the multipath effect, shadowing effect, fading effect, and delay distortion from walls, floors, furniture, or ceilings [12,13]. Meanwhile, it is difficult to provide compensation for model distortion analytically [14,15].
Different from the acoustic localization methods based on geometry model, the fingerprinting acoustic localization method simply adopted in our previous work [16], as a nonparametric location approach, can effectively accomplish sound positioning task according to the idea of environment perception. Compared with the precondition of the parametric localization method mentioned above, avoiding dramatic environment changes in target area, as the necessary requirement of the fingerprinting localization method, is easier in the practical application [17,18].
Many studies indicate that the positioning accuracy of non-parametric positioning method largely depends on the sampling density [19,20]. Therefore, for high resolution positioning indoor, considerable amount of sampling work for the database construction is needed in the offline phase. Additionally, during the online phase, the involved algorithms need considerable number of data, and large amounts of memory and computation resources to carry out the target position estimation in real time.
Interpolation is a mathematical tool to estimate the value of a function at a certain point using available values at other arguments. Interpolation methods for scattered data are widely implemented in mathematical, industrial and manufacturing applications. Radial basis function (RBF) [21], Linear [22], Inverse Distance Weighting (IDW) [23], and kriging [24] are well-known interpolation methods for positioning database expansion. Even though the numerous methods are effective to reduce sampling task quantity under the premise of ensuring the positioning accuracy [25], there are still many problems in the existing interpolation methods to be solved. In our previous work [26], the interpolation methods were executed in global interpolation way, which resulted in the rapid expansion of virtual RPs quantity and increase the calculation amount for RP matching [27]. Meanwhile, the conventional interpolation methods usually rely on the experience of the implementer and cannot accurately reckon the quantity of virtual RPs needed. In this paper, we propose an iterative interpolation method to refine the interpolation scope and, at the same time, the interpolation process can be monitored to avoid unnecessary virtual RPs. The estimation result of each iteration process can be compared with the one of the previous iteration process, and the interpolation will end when the different of the estimation results between the two adjacent process is less then the given threshold value.
The Selective matching combination of the target point (TP) and the RPs can reduce the matching task, thus improve the positioning efficiency of fingerprinting acoustic localization. Therefore, the positioning database is considered to be divided into a certain number of sub-databases in the offline phase, and then the matching scope can be shrunk to a smaller one through the search of adjacent sub-database [28]. For the database division method, the coordinate space partition is investigated firstly, which is easy to implement and can reduce the influence of outliers. However, this method has the defects of uncertain partitioning results and large positioning error. That is mainly because the division result is greatly influenced by the subjective judgment in the coordinate space partition. The adjacent RPs of the TP may be divided into different sub-databases, which will cause the RPs matching error. In machine learning technology, cluster analysis, as a precursor process of other learning tasks, is often used for classification of unlabeled samples. The RPs with similar features can be assigned to the same sub-database automatically by cluster analysis technique to accomplish the purpose of the database partition [29].
The rest of the paper is organized as follows: In Section 2, the general process of the fingerprinting acoustic localization is briefly introduced. In Section 3, the positioning database partition by cluster analysis and the adjacent RPs searching based on the two-stage matching method are stated, and then the iterative interpolation method is proposed to generate the virtual RPs for ensuring the target position estimation accuracy with few initial RPs. Section 4 presents the implementation details and evaluates the performance of the novel methods from the results obtained. Finally, some conclusions are drawn in Section 5.
2. The Fingerprinting Localization Model
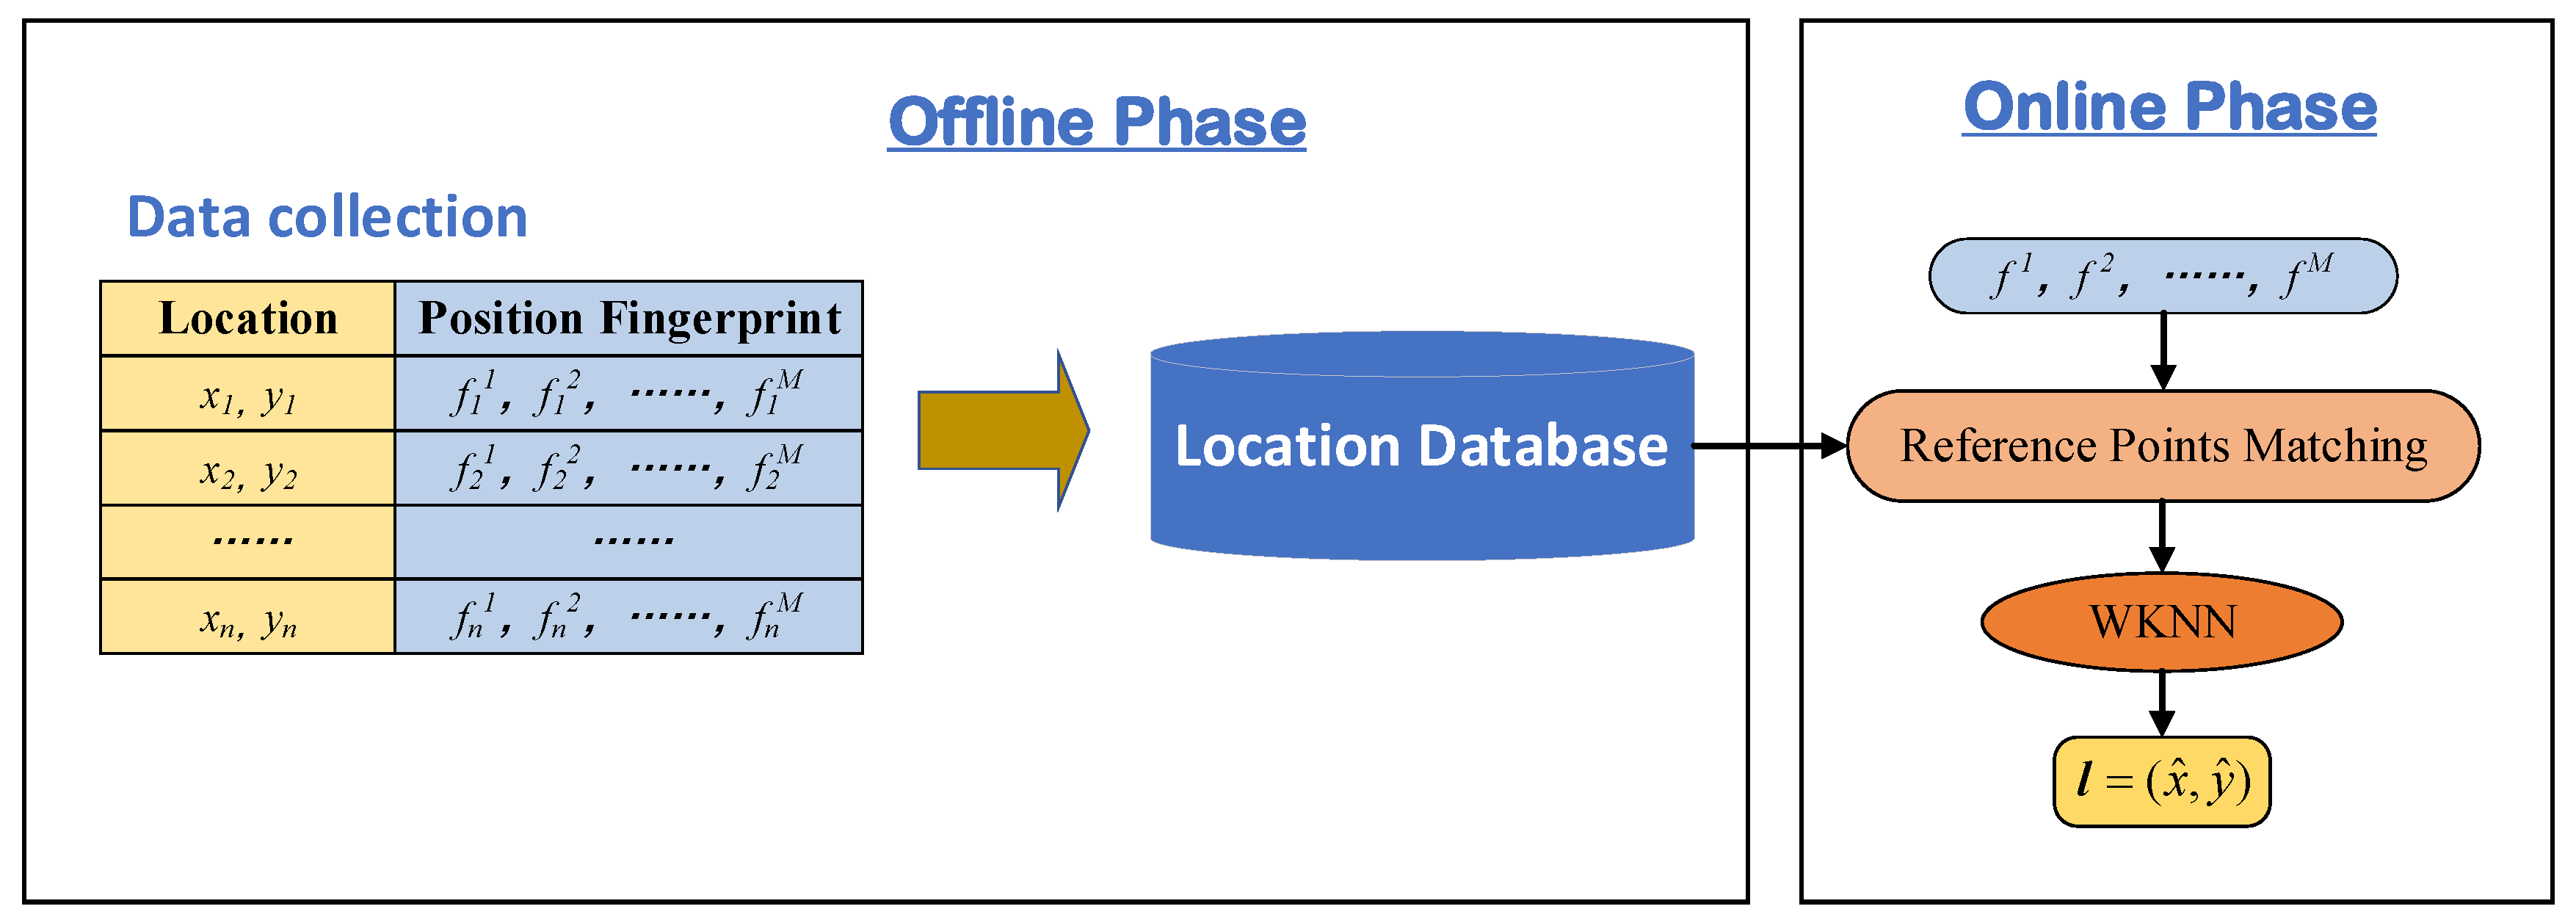
Fingerprinting localization method is a database matching approach. As Figure 1 shows, the fingerprinting localization method uses the position information and the related features measured in the target region to establish the positioning database. In the actual positioning, the signal captured by the positioning system will match with the samples in the positioning database, and the samples most similar to the target signal are selected to accomplish the position estimation.
As what has been introduced in our previous work [16], fingerprinting acoustic localization method requires an offline phase to construct the positioning database and an online phase for acoustic target location [30].
In the offline phase, the positioning database can be constructed by the coordinate of position marks and the corresponding features. The coordinates of the position marks are usually determined according to the site environment of the positioning area and the location accuracy requirements of the task. As the location-related feature in this work, time difference of arrival (TDOA) is widely used in real-time acoustic positioning applications for its low computational complexity and small data size [31,32,33,34,35]. Finally, samples, also known as position fingerprints, are formed by the coordinate of position marks and their corresponding features. The fingerprints in each position mark are collected and the location fingerprint database is established.
In the online phase, the feature vector of the observed target signal is matched with each sample of the positioning database. A specific number of samples are selected as the adjacent RPs according to the similarity with the target. Finally, the position of the target can be calculated by the specific position estimation algorithm based on the adjacent RPs according to the matching result. Exactly the same estimation algorithm used in the RADAR system, weighted-nearest neighbor (WKNN) [36] is usually used for the fingerprinting localization process.
3. The Proposed Fingerprinting Acoustic Localization Approach
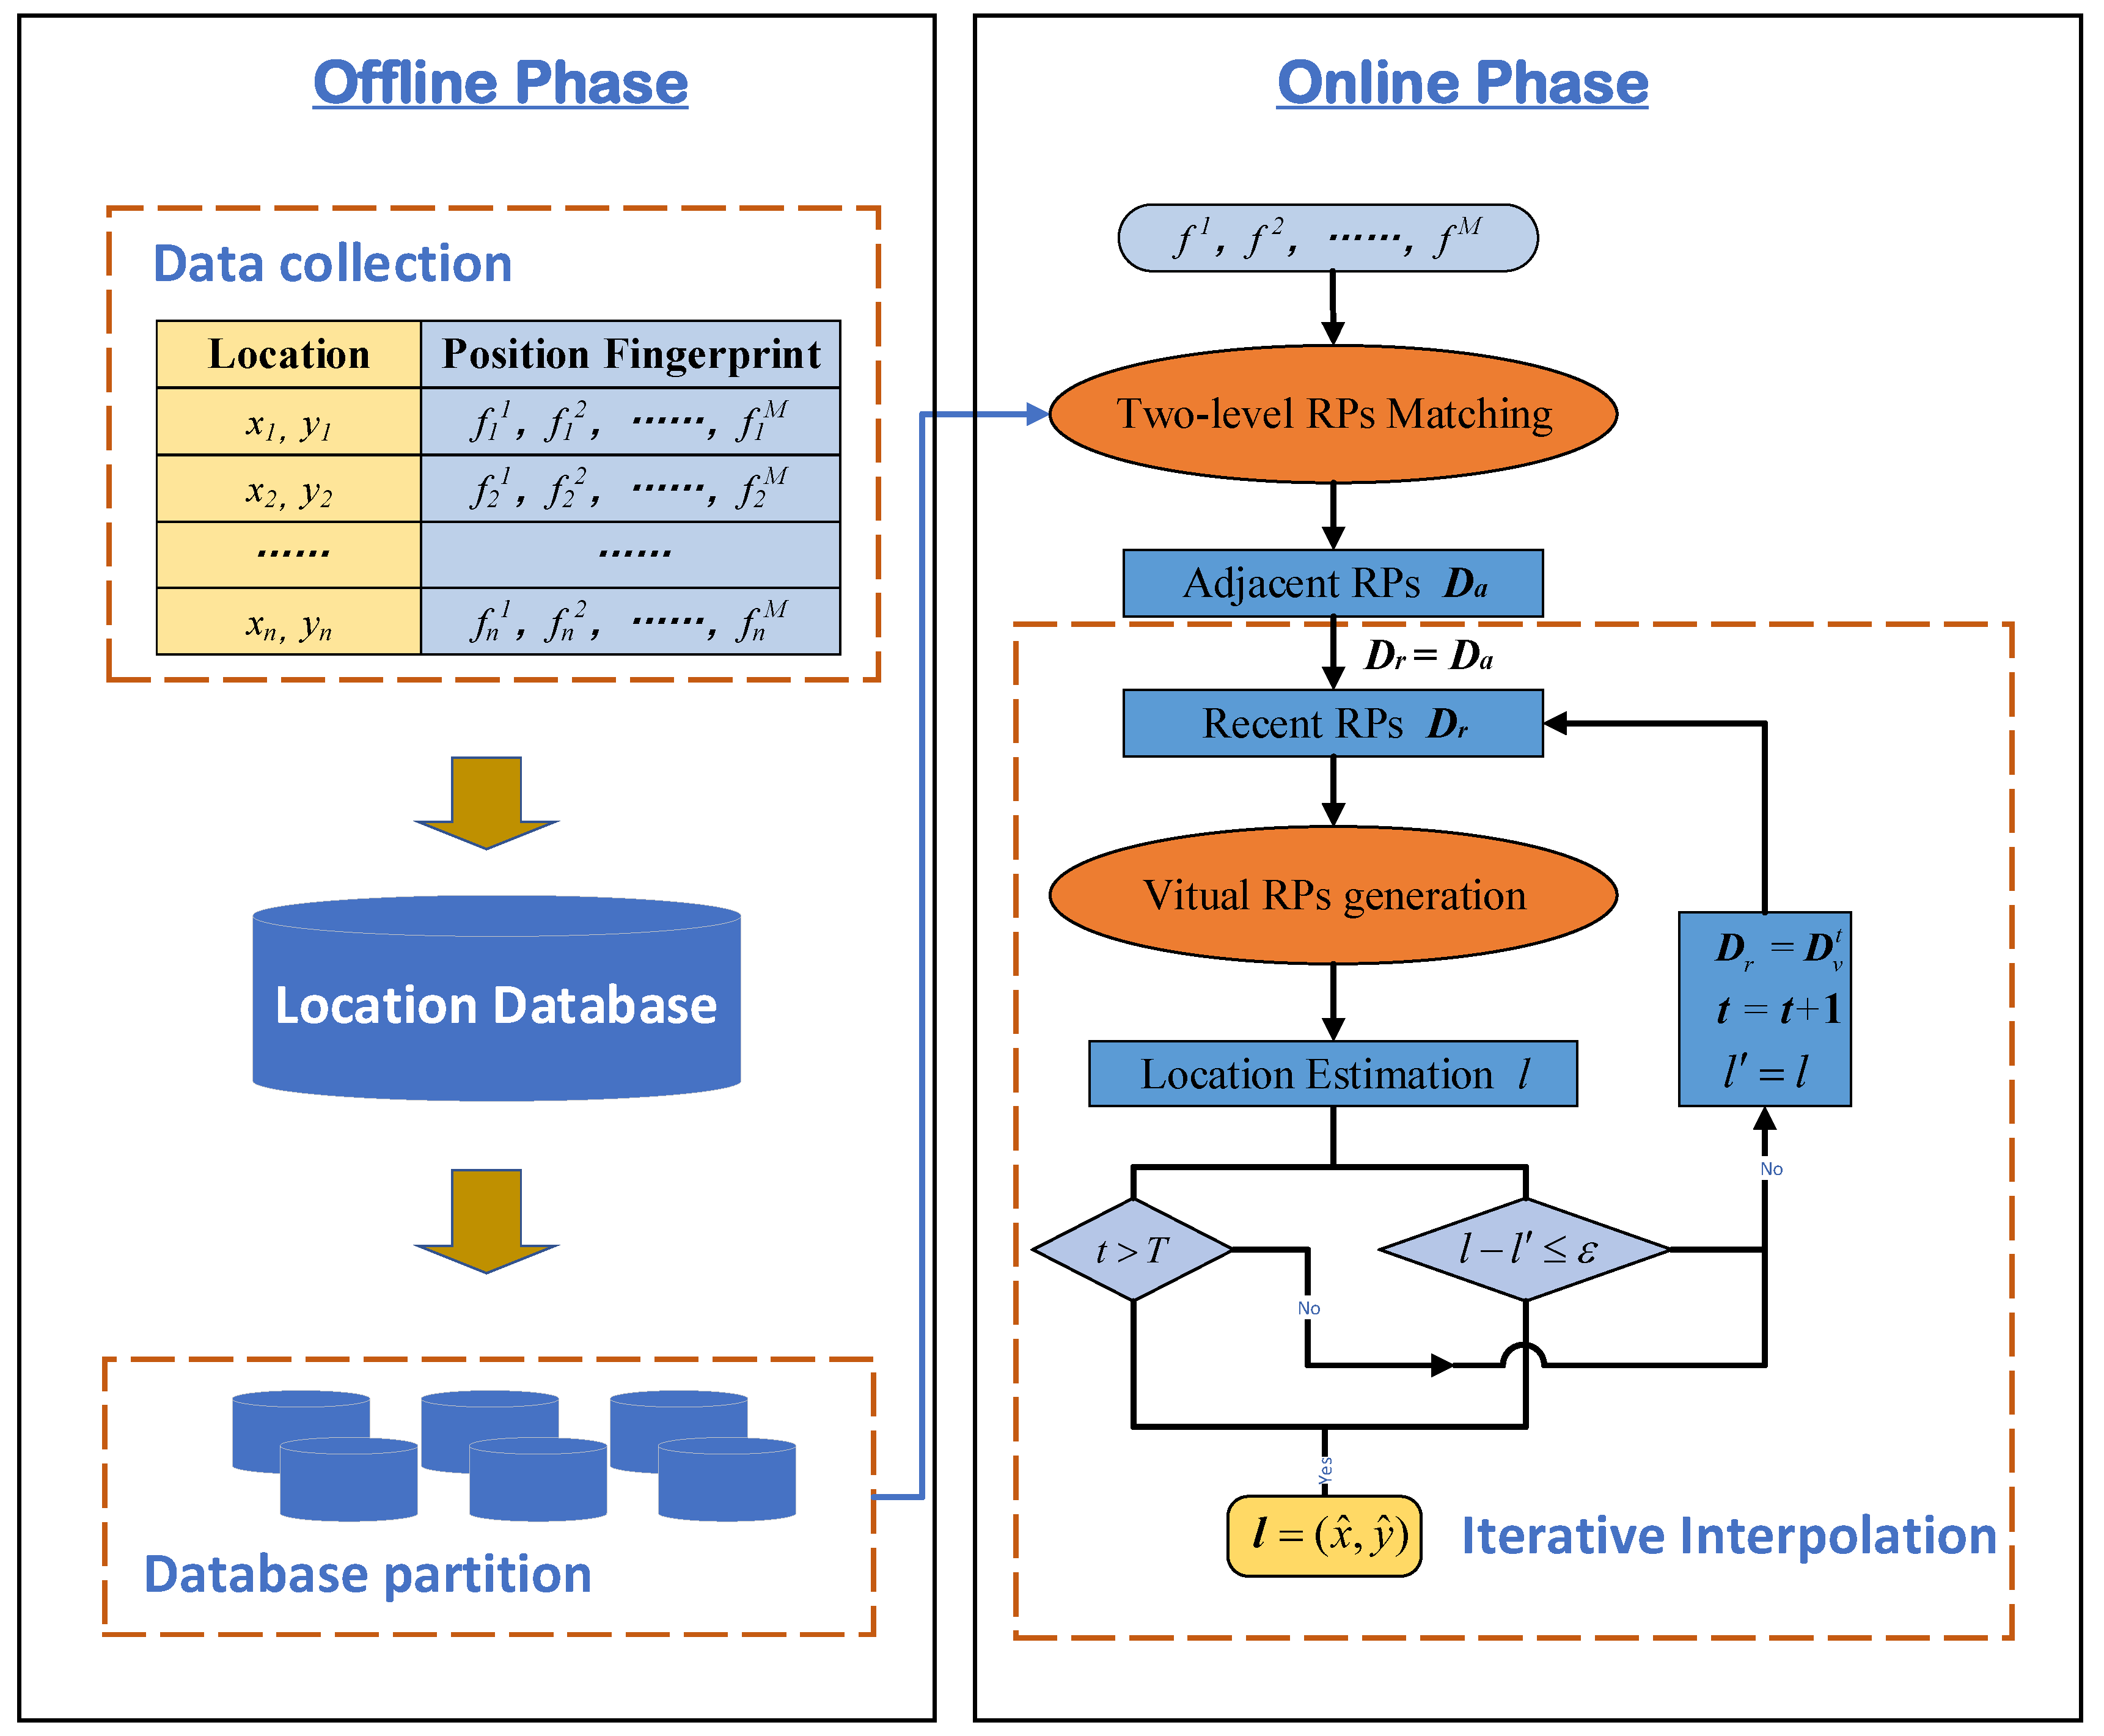
In the traditional fingerprinting localization approach, the target signal needs to match with all samples in the database to select its adjacent RPs for location estimation. Therefore, the large scale positioning database that the fingerprinting localization accuracy depends on means the complexity of matching operation improvement and the efficiency of positioning reduction. Aiming at solving the contradictory in traditional fingerprinting localization approach, this paper makes some improvements. As Figure 2 shows, after the database construction in the offline sampling phase, the entire positioning database is divide into sub-databases. Then, in the online positioning phase, the matching scope can be narrowed by the adjacent sub-database matching stage, and the adjacent RPs searching can be accomplished with a small amount of matching computation.
Meanwhile, the offline phase of the fingerprinting localization approach requires a great sampling effort as the mobile sensor has to be placed at every position marks in the location area. To reduce the initial sampling effort, the database can be constituted using the sparse samples in the target area and extended afterwards by interpolation functions. As Figure 2 shows, an iterative interpolation method is presented to further refine the interpolation scope to avoid unnecessary virtual RPs. At the same time, the estimation result of each iteration process is compared with the one of the previous iterations, and the interpolation ends when the difference of the estimation results between the two adjacent process is less than the given threshold value.
The novel acoustic localization approach consists of three main stages:
- (1)
- Divide the positioning database into a certain number of sub-databases by K-Means clustering algorithm after database construction in the offline sampling phase.
- (2)
- Select the adjacent RPs of target point by the two-stage RPs matching method.
- (3)
- Conduct the position estimation of the target point by the iterative interpolation method.
3.1. Database Partition by Clustering Method
Clustering is an elements grouping process according to some specific features, which is called the cluster key, such as the TDOA value we choose in this paper. The prototype-based clustering method has the advantages of simple, fast and efficient process for big datasets classification. As one of the prototype-based clustering algorithms, K-Means clustering algorithm is a classical and efficient algorithm for cluster analysis [37].
The database partition process by K-Means clustering algorithm includes three steps. Suppose there is a database with N samples that needs to be partitioned to K (K < N) groups. The clustering algorithm for the sound-position fingerprint database can be described as Algorithm 1.
| Algorithm 1: The K-Means clustering algorithm for positioning database partition. |
 |
Firstly, K samples are randomly selected from the positioning database as the initial cluster center . Then, the remaining samples are assigned to the most similar clusters according to the similarity with each cluster center in feature space. Then, the cluster center is updated by , where means the samples clustered to . The clustering process is repeated until the cluster centers stop updating, and finally .
3.2. Two-Stage RPs Matching
The vocal target can be located in the positioning area after the RPs sampling and the database construction. In the positioning phase, a two-stage matching algorithm is proposed to compare the feature vector of vocal target with each simple in database to find the adjacent RPs with the minimum matching error.
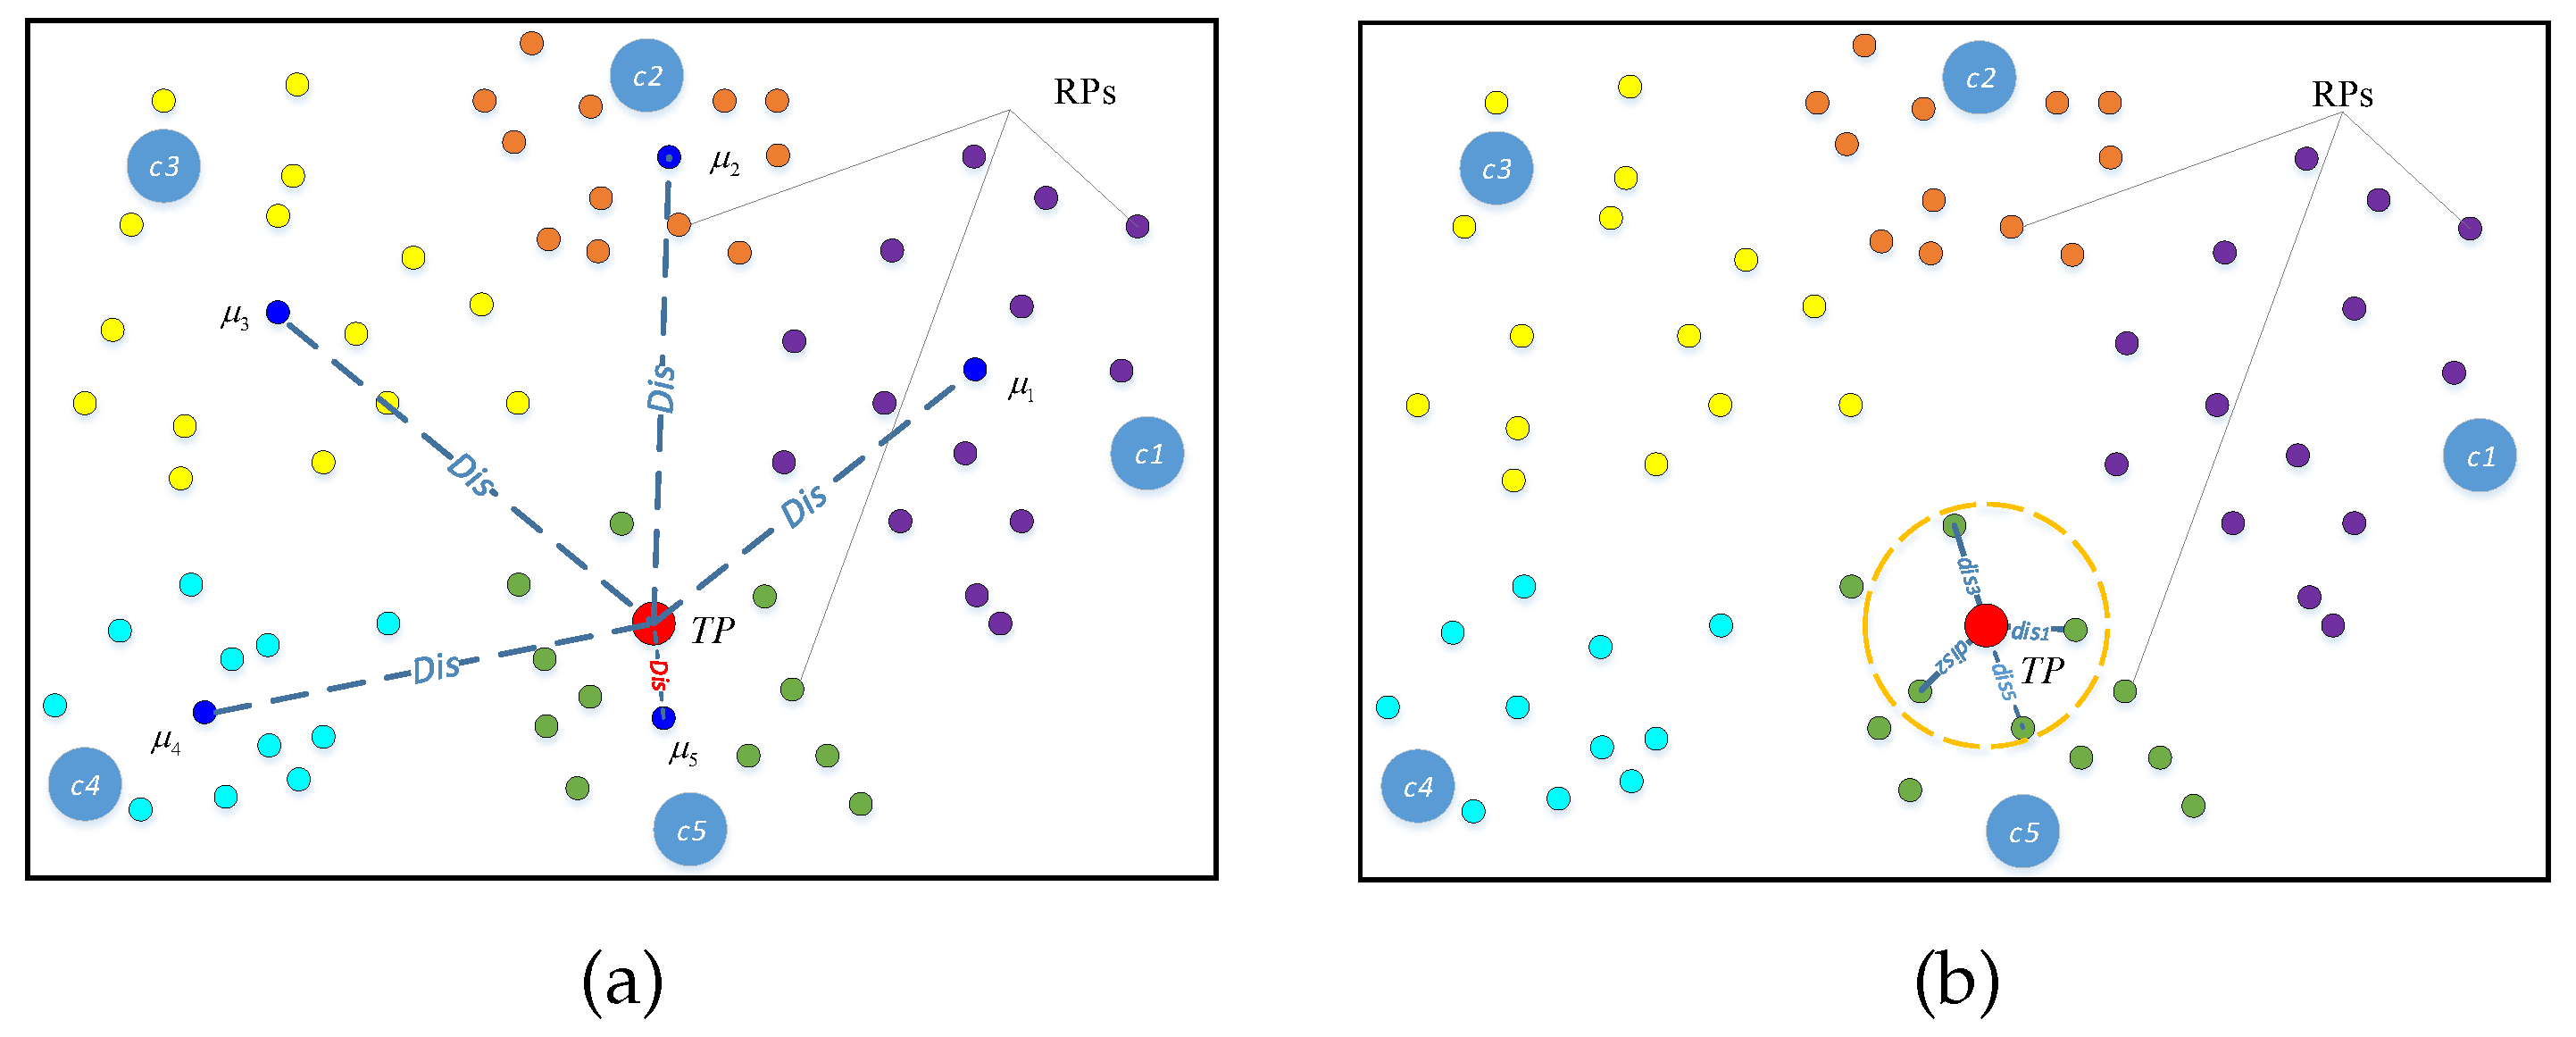
The Euclidean distance between target point and cluster center of cluster can be defined by:
The adjacent cluster can be chosen through:
Then, as shown in Figure 3b, the adjacent RPs can be searched according to the Euclidean distance distance between the target point and each sample of the adjacent cluster in feature space.
The distance can be defined as:
where is the feature vector of the jth RP in adjacent clustering , and denotes the total number of samples in . Adjacent RPs set can be gathered by:
Because the complexity of matching process is far greater than the other parts of the location process, and the computation complexity of the other parts in the positioning process is almost the same, the computational complexity of matching operations is investigated in this paper. N denotes the total number of RPs in the database and K is the number of clusters. The complexity of linear matching process is , and the average complexity of matching process based on cluster analysis is . Comparing with the conventional matching method, the proposed approach can reduce the complexity of matching process to its .
Firstly, as Figure 3a shows, adjacent cluster is determined based on the Euclidean distance between the target point and each cluster center in feature space.
3.3. Location Estimation Based on Iterative Interpolation
To reduce the sampling effort, global interpolation methods are usually used to improve the positioning accuracy under the sparse sample points collection. However, the global interpolation method usually results in the rapid expansion of virtual RPs quantity, and cannot accurately reckon the quantity of virtual RPs required for the satisfactory positioning accuracy. In this paper, we propose an iterative interpolation method to avoid the unnecessary virtual RPs and further improve the location efficiency.
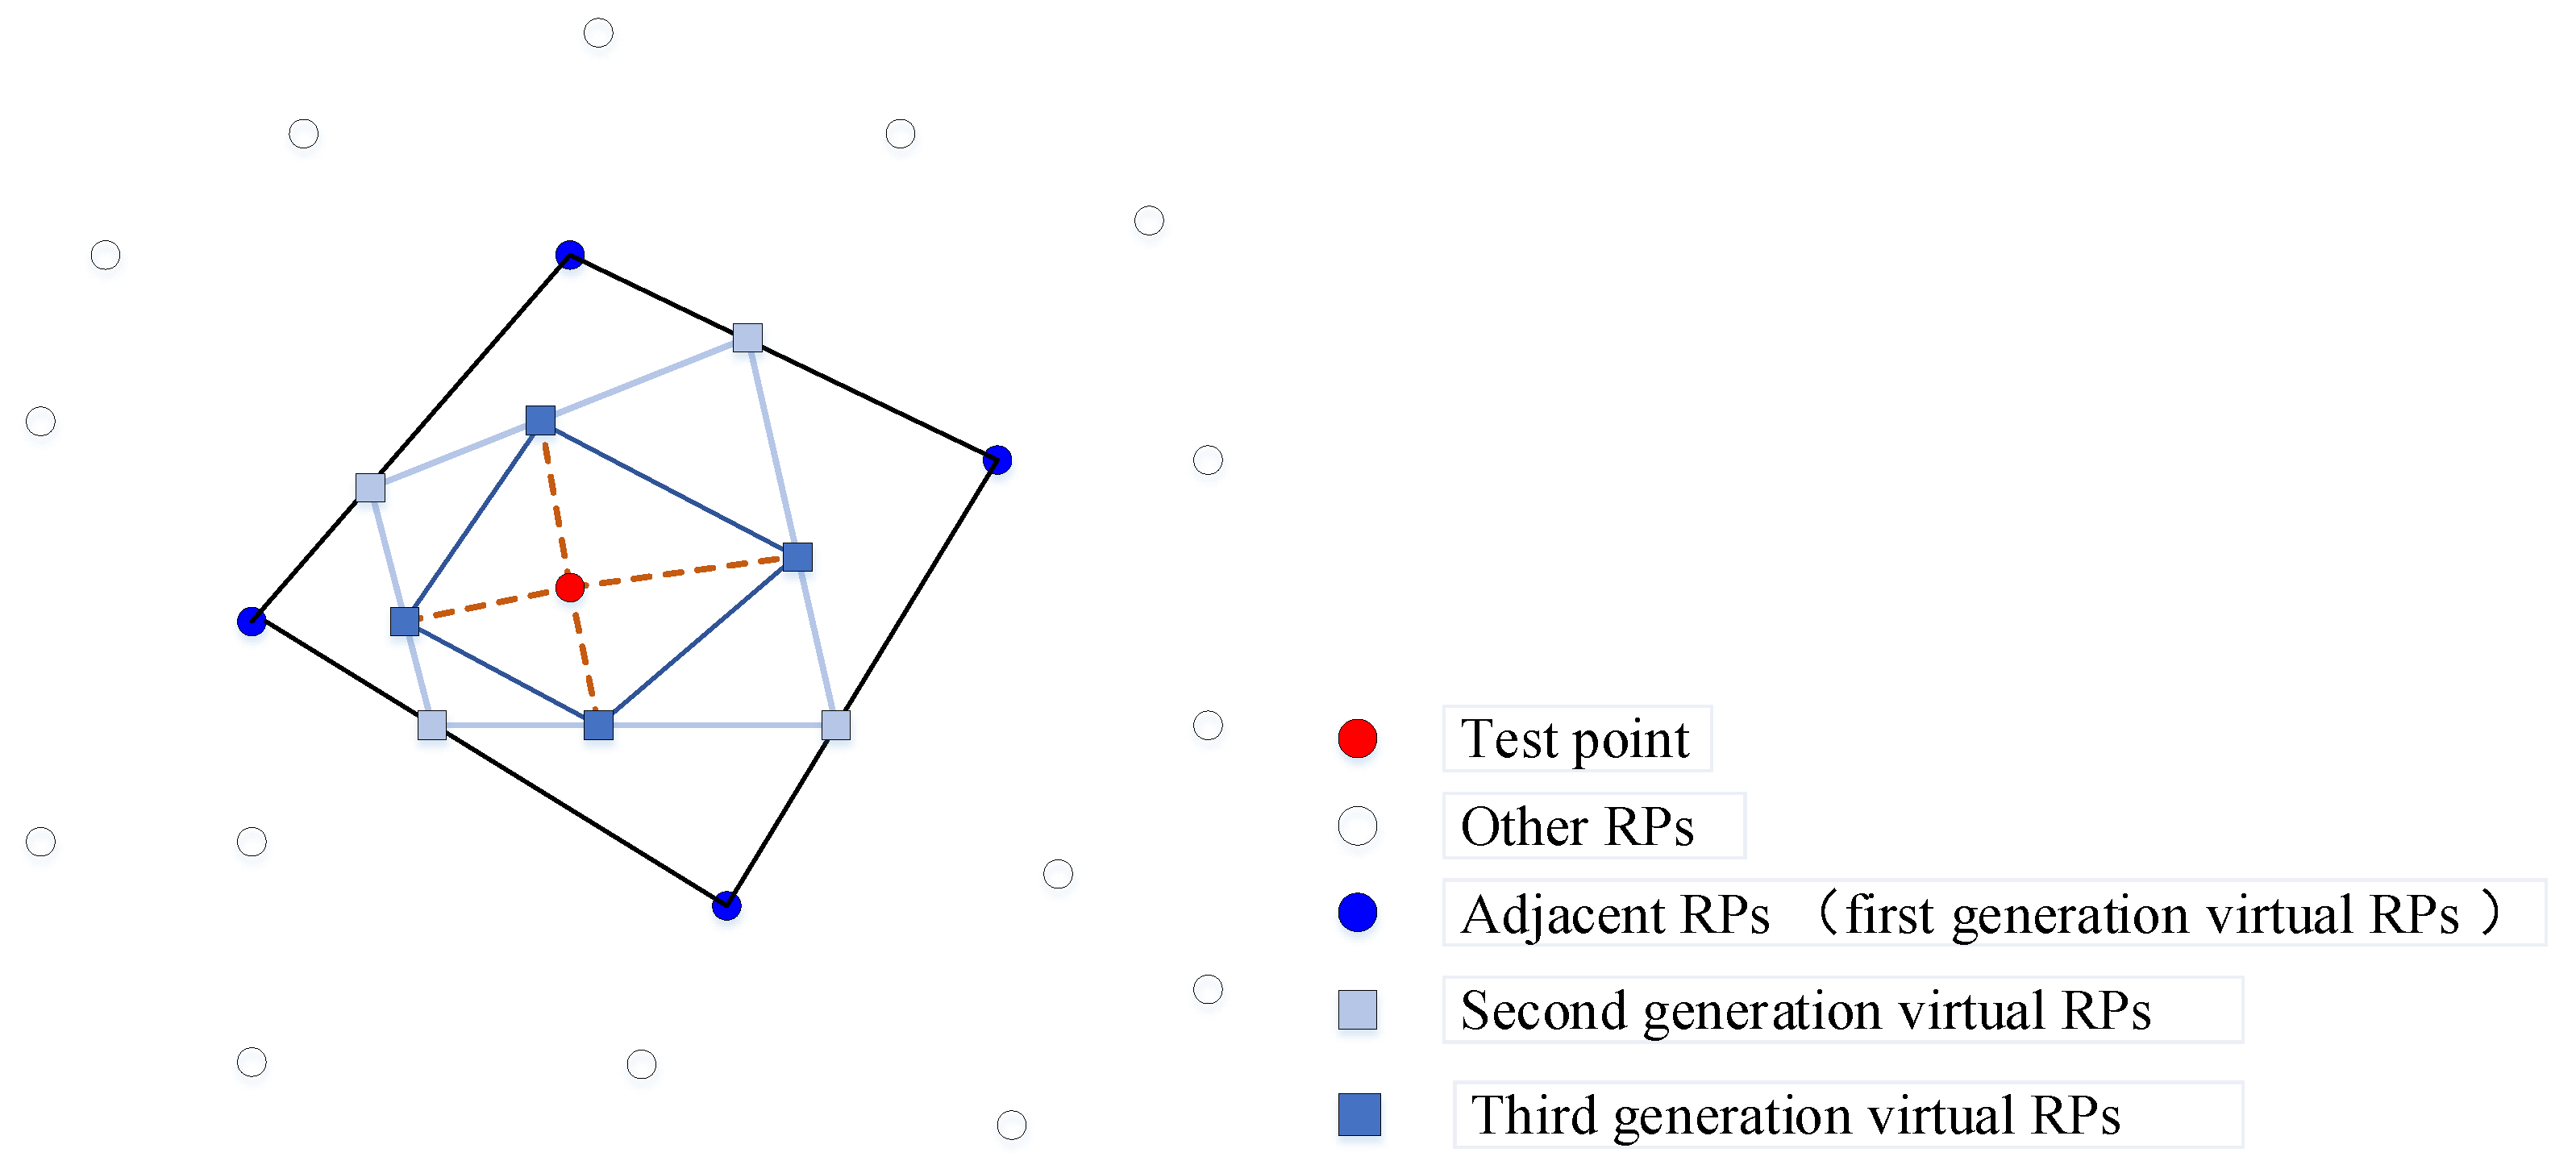
In the online positioning process, the virtual RPs can be generated by the iterative interpolation method, as Figure 4 shows, where the iteration interpolation process is based on four adjacent RPs. In the interpolation process, the first generation virtual RPs are defined as the adjacent RPs selected before as . During the iteration interpolation process, the elements of are refreshed by:
where is the nth element of tth generation , and is the according weight that can be calculated through IDW method by the feature space Euclidean distance between recent generation virtual RPs and the target point that needs to be located.
As Algorithm 2 shows, online positioning process based on the iteration process continues until the iteration time beyond the maximum iteration value T or the difference between two-estimation process results is satisfied with , where is the iterative process end threshold value.
| Algorithm 2: The location estimation process based on iterative interpolation. |
 |
4. Experimental Validation
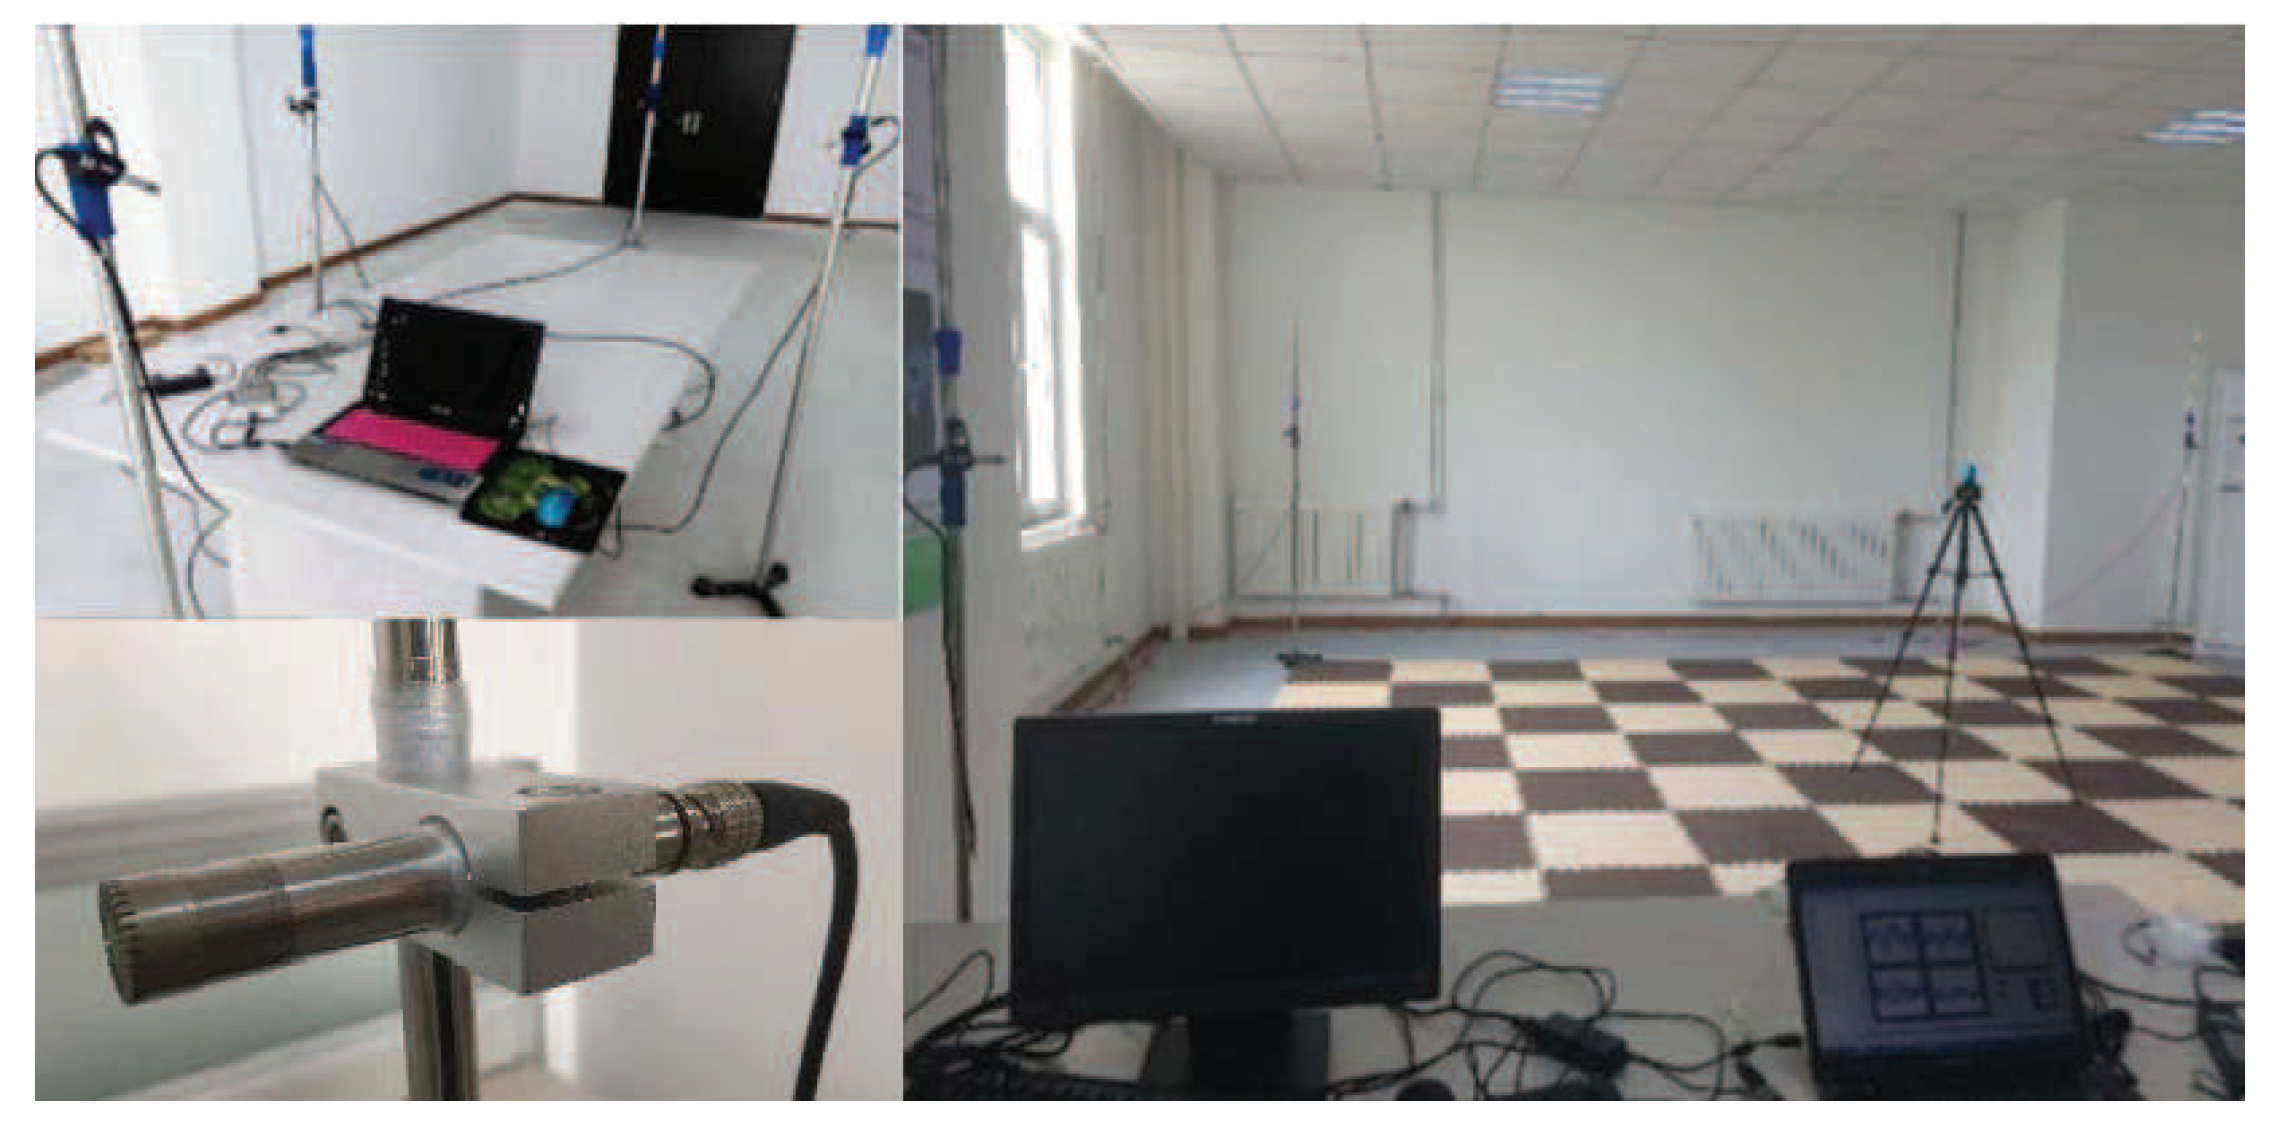
To demonstrate the performance of the proposed acoustic localization approach based on the cluster analysis and iterative interpolation, real-world experiments have been carried out in a practical room. The room is w 9.64 × 7.04 × 2.95 m, where the noise is about 40 dB and the walls are not insulated. The scene and equipment of the experiments are shown in Figure 5. The target area is a rectangular plane with the length of about 6 m and width of about 5 m. The four-channel microphone array is composed of the MPA201 microphones produced by the BSWA Technology Co., Ltd., Beijing, China. The microphones are installed at the four vertices of the positioning area with the height about 1.35 m above the floor. The type of the acquisition card is known as NI9215A from NI company, Austin, USA. The sampling frequency is set as 100 kHz, and the sampling period is 1 s. The sound source is a Bluetooth speaker with the same height as microphone array. A system-provided text tone called “Popcom” in iPhone 6 is selected for localization sound signal.
In the sampling process, the coordinates of the samples are uniformly distributed in the location area by grid division, and the distance between each samples is 0.593 m. The total number of the samples prepared for database construction is 72, and 13 test points are used for target point estimation.
4.1. Analysis of the Two-Level RPs Matching Method
According to Section 3.3, more subsets in the positioning database partitioned means more online positioning efficient improvement by two-level RPs matching method. However, the same as the coordinate space partition method, when the subsets reaches a certain number, distinguishing between sub-databases partitioned by feature clustering partition method is no longer obvious. Then, the adjacent RPs may be divided into different sub-databases, which will cause RP matching error.
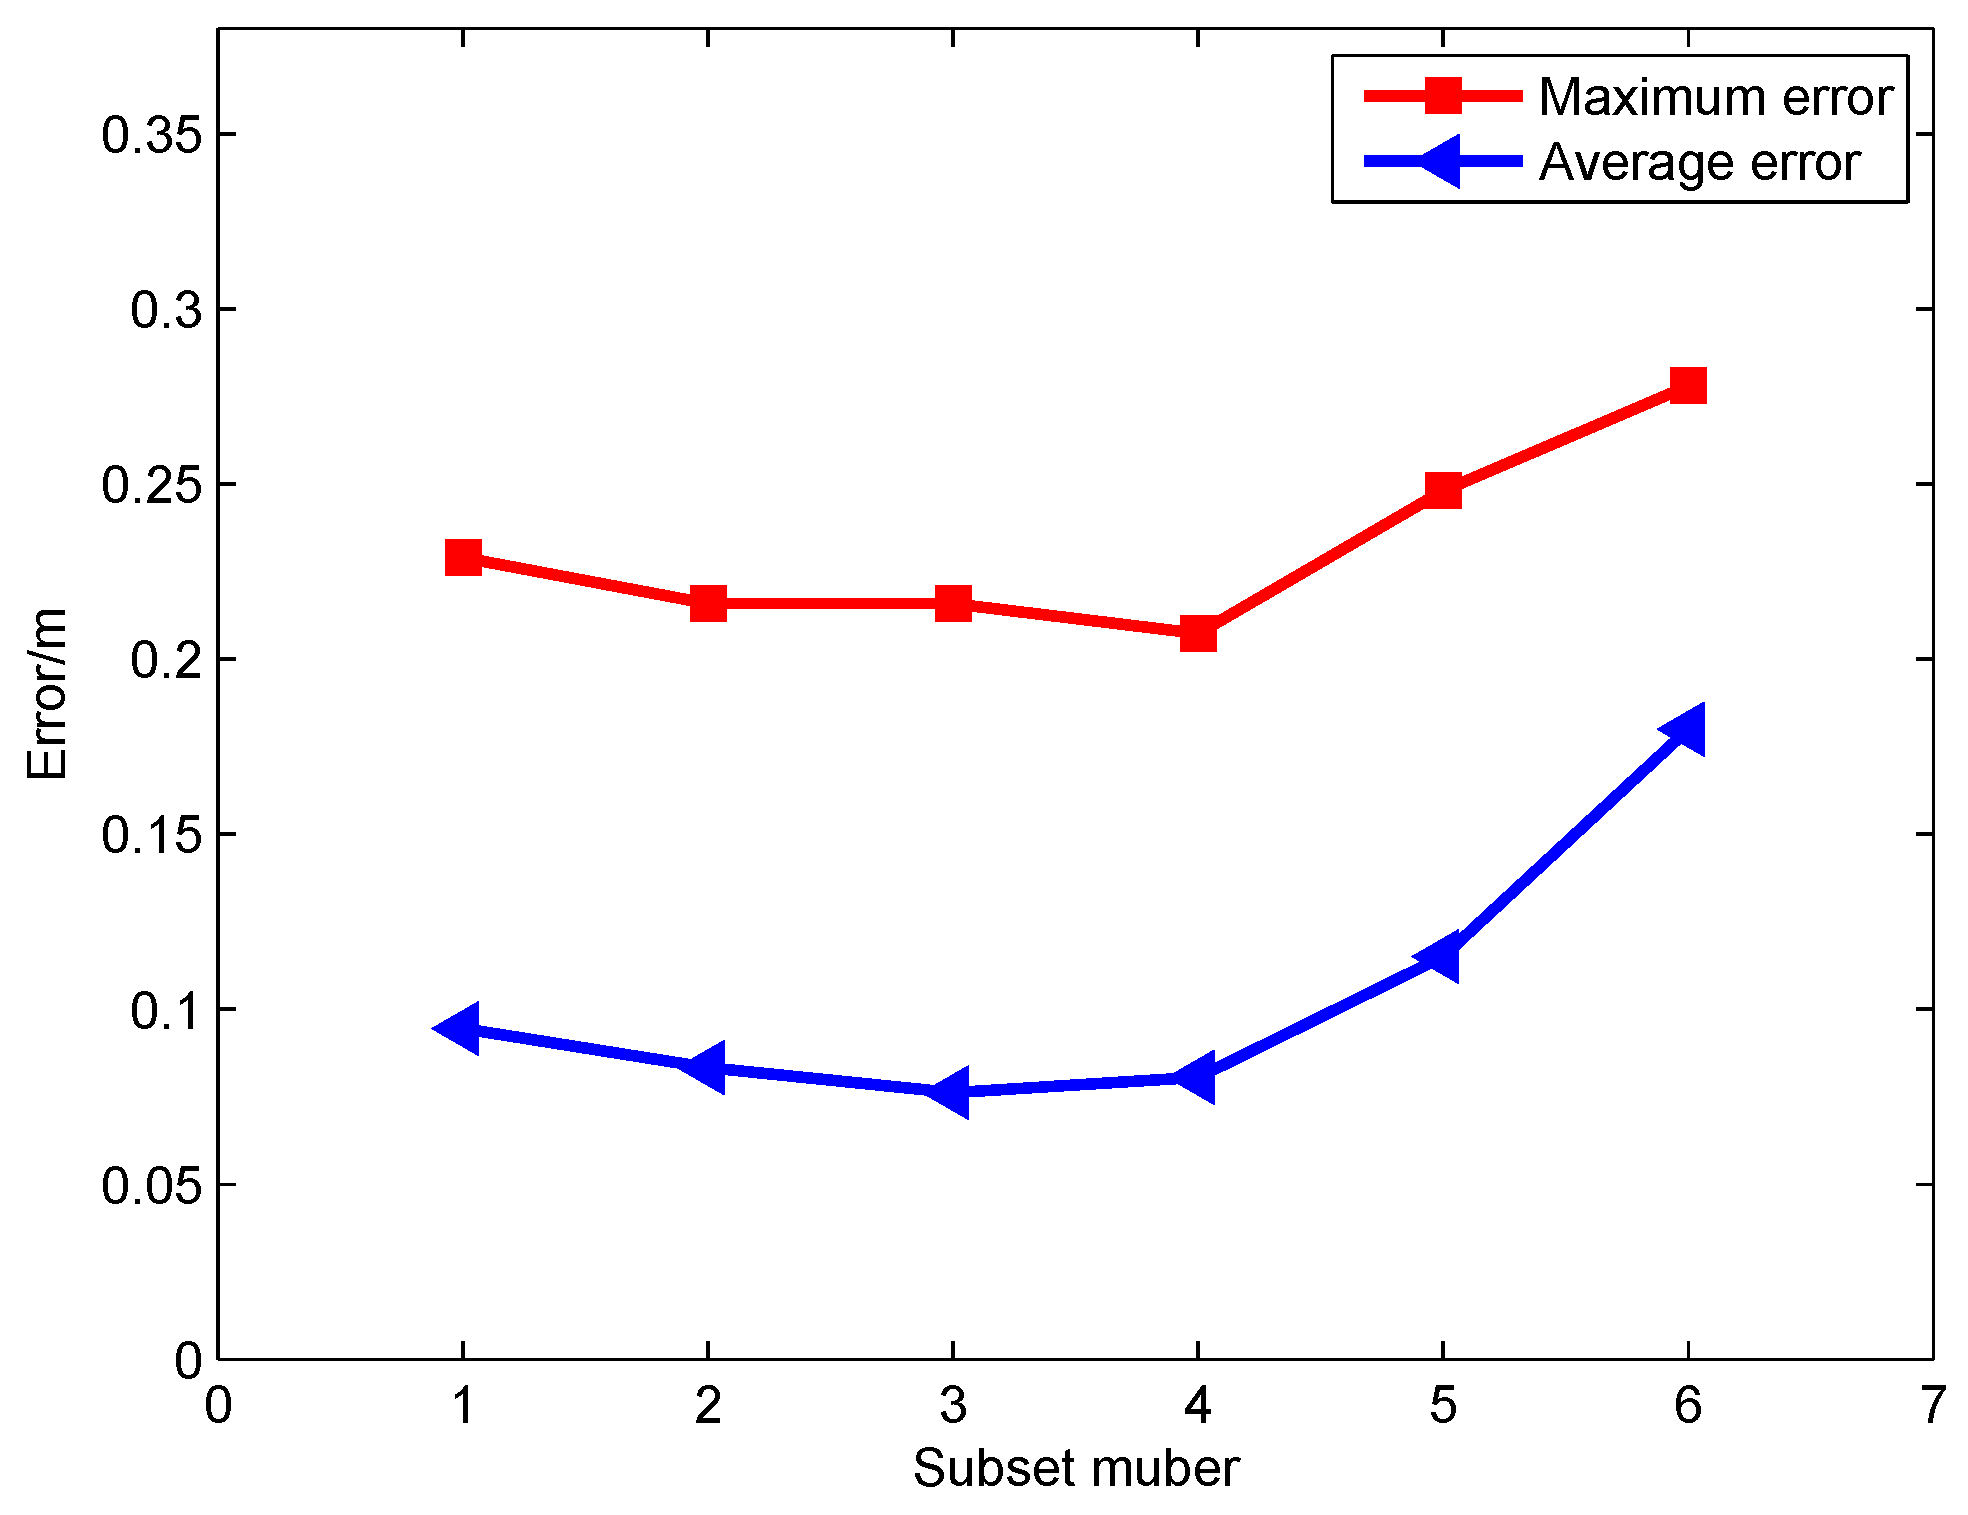
To investigate the effect of the division number on location accuracy, we explored the localization results with division number from 1 to 6, where 1 means the the matching process without partition, that is, global linear matching localization.
As shown in Figure 6, when division number increased from 2 to 4, positioning accuracy slightly improved compared with global linear matching. That is mainly because, according to the clustering results, the outlier points with large measurement errors in the sub-database can be eliminated by outlier test method. However, when the number of sub-databases increased to 5, the localization result began to deteriorate significantly. Moreover, when the division number increased to 6, the average error exceeded 0.18 m, while the maximum error reached 0.2780 m and 61.5% of the test point positioning accuracy could not meet the 0.20 m positioning requirements.
To compare the positioning effect between the coordinate space partition method and feature clustering partition method, the average matching amount, matching time and the average positioning error were considered when the division number is 4. As shown in Table 1, the average matching amount and average matching time of the two different partition methods in the RPs matching process are basically the same, and their online positioning efficiencies greatly improved compared with the global linear matching method. Among them, the feature clustering partition method can reduce the average matching amount and the average matching time to 30.13% and 29.89% of the global linear matching method, respectively, while the coordinate space partition method was 30.97% and 30.13%. In comparison to the positioning accuracy, the positioning error of 0.0813 m based on feature clustering partition method is significantly superior to the 0.1214 m based on the coordinate partitioning partition method, and the positioning accuracy is improved by 13.97% compared with the traditional linear matching method.
4.2. Analysis of the Iterative Interpolation Method
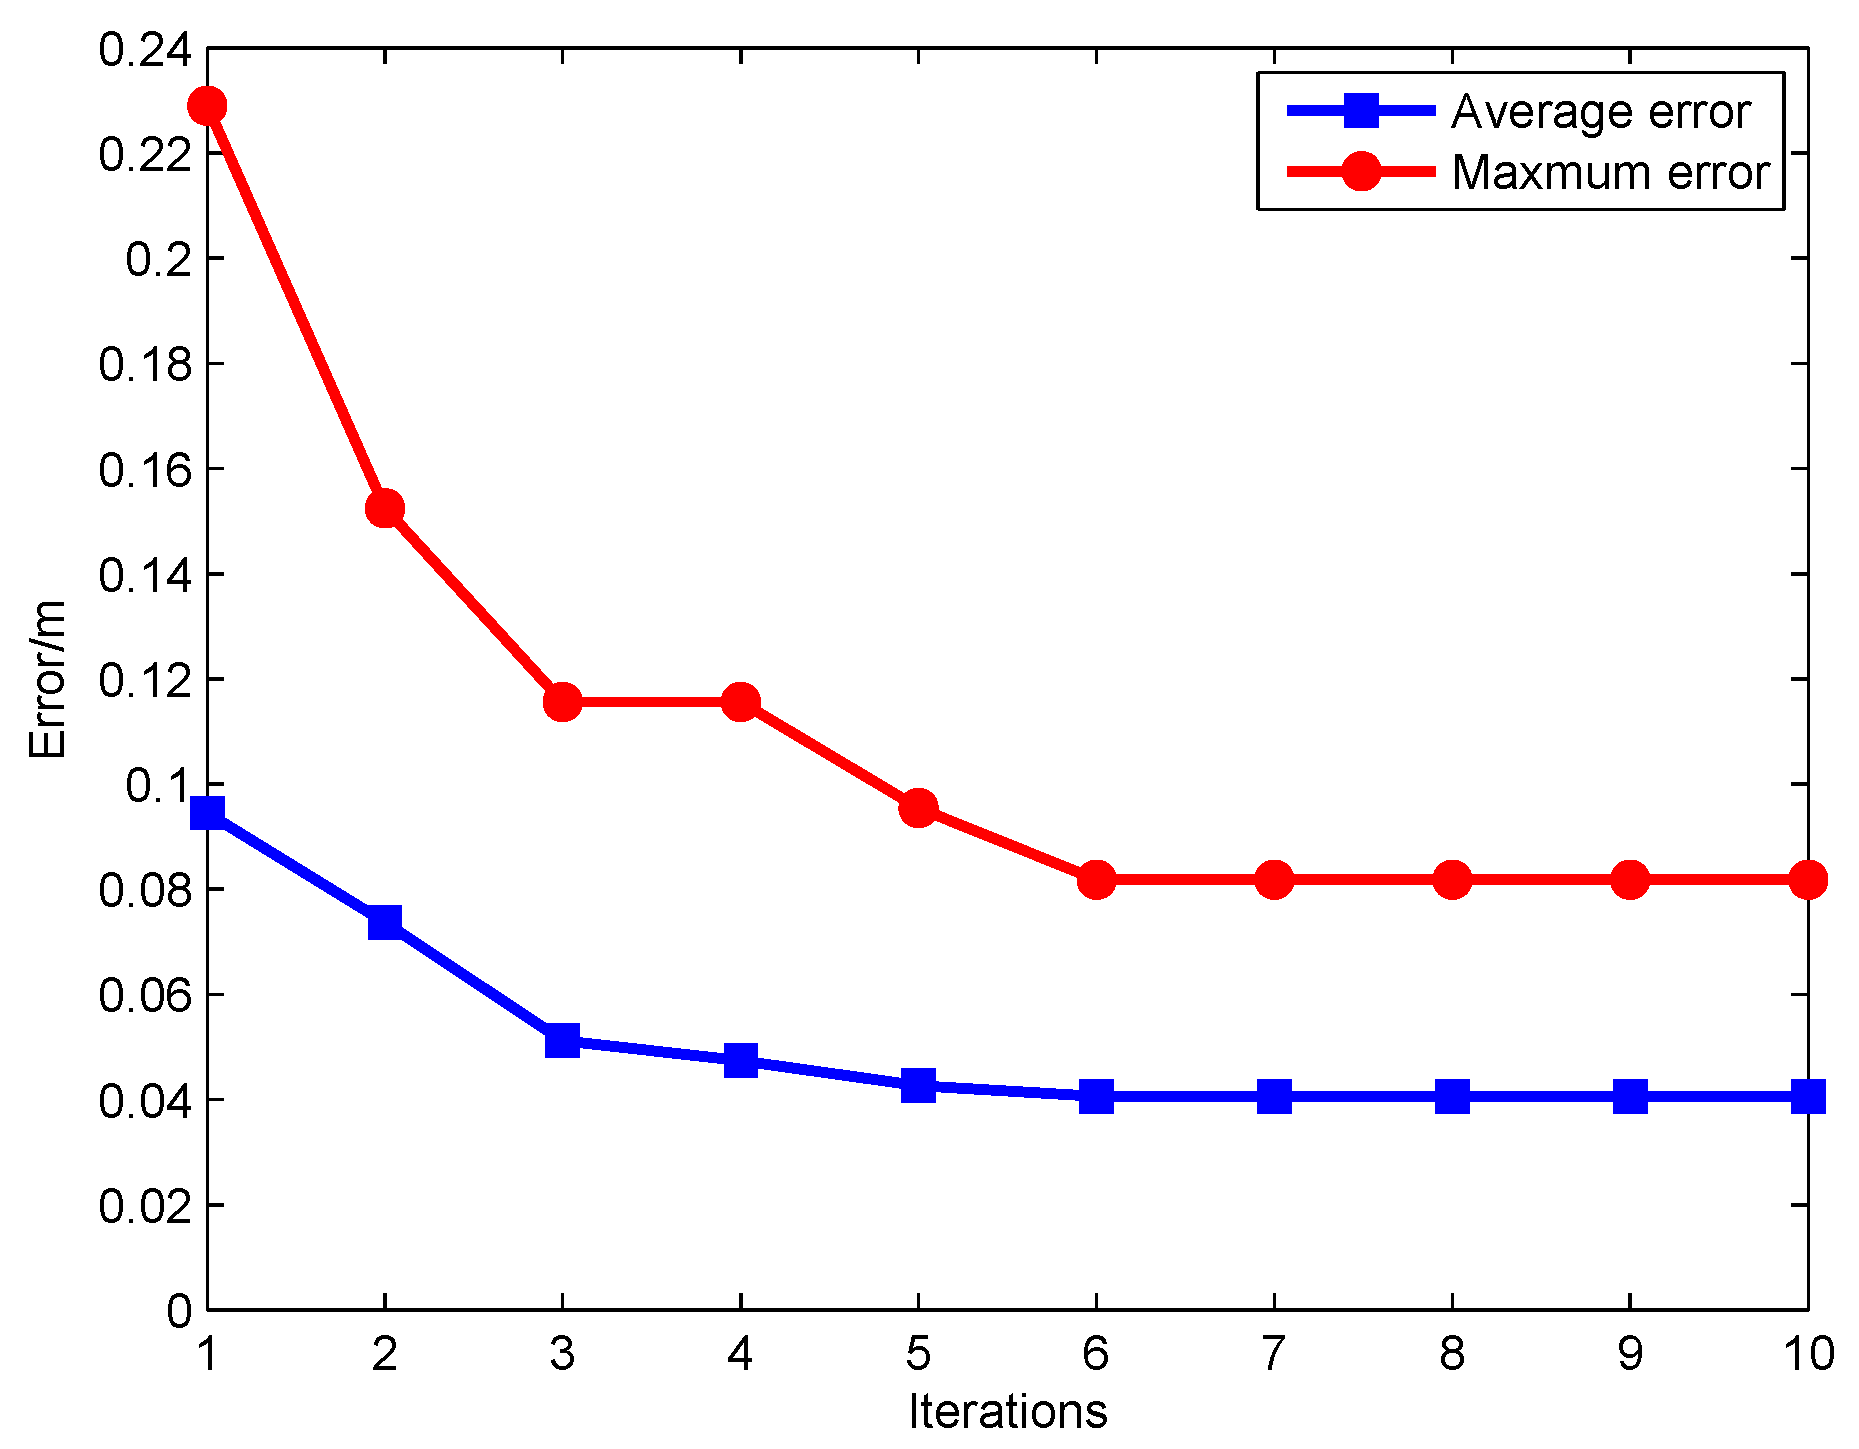
In this work, four adjacent RPs selected by the global linear matching method are used for target location estimation. In the process of virtual RPs generation, the maximum number of iterations is set as = 10. In addition, when the difference between the results of two adjacent iterations interpolation positioning process is less than = 0.0001 m, the iteration process will end.
The global positioning results by examining the average error and maximum error of the positioning results of 13 test points has been evaluated. As shown in Figure 7, the iterative interpolation method can reduce the average error from 0.0945 m to 0.0406 m, and the maximum error from 0.2290 m to 0.0818 m. In the process of iterative interpolation, the effect of location accuracy improvement is obvious in the first six iterations. However, along with the iterative process and the improvement of positioning accuracy, the effect is gradually weakened. The same phenomenon also occurred at the maximum error.
As Table 2 shows, 6 cases were considered to compare the positioning effect of different interpolation methods. The maximum errors and average errors were selected as the evaluation indicators. For iterative interpolation methods, the V-RPs is defined as the average value of the virtual RPs generated during the localization process of the test points.
According to Table 2, in the fingerprinting acoustic localization process without interpolation, 72 RPs can provide apparently higher accuracy than the one with 20 RPs. The results confirmed the viewpoint that improving RPs density can directly improve the positioning accuracy.
In the cases of global interpolation method, the interpolation method can make further improvement for the positioning accuracy. On the other side, the initial RPs ratio can also affect the location results. That is, when the total RPs of the acoustic localization process based on global interpolation method are the same, more initial RPs means better positioning accuracy, but the influence of initial RPs ratio is weaker than the number of the total RPs.
In the case of iterative interpolation method, it is easy to see that iterative interpolation method needs only 12.3% virtual RPs of the global interpolation method for similar precise location results when the number of initial RPs is 20. When the number of initial RPs is 72, iterative interpolation method needs only 10.5% virtual RPs of the global interpolation method for a slightly less precise positioning results.
4.3. Analysis of the Novel Method
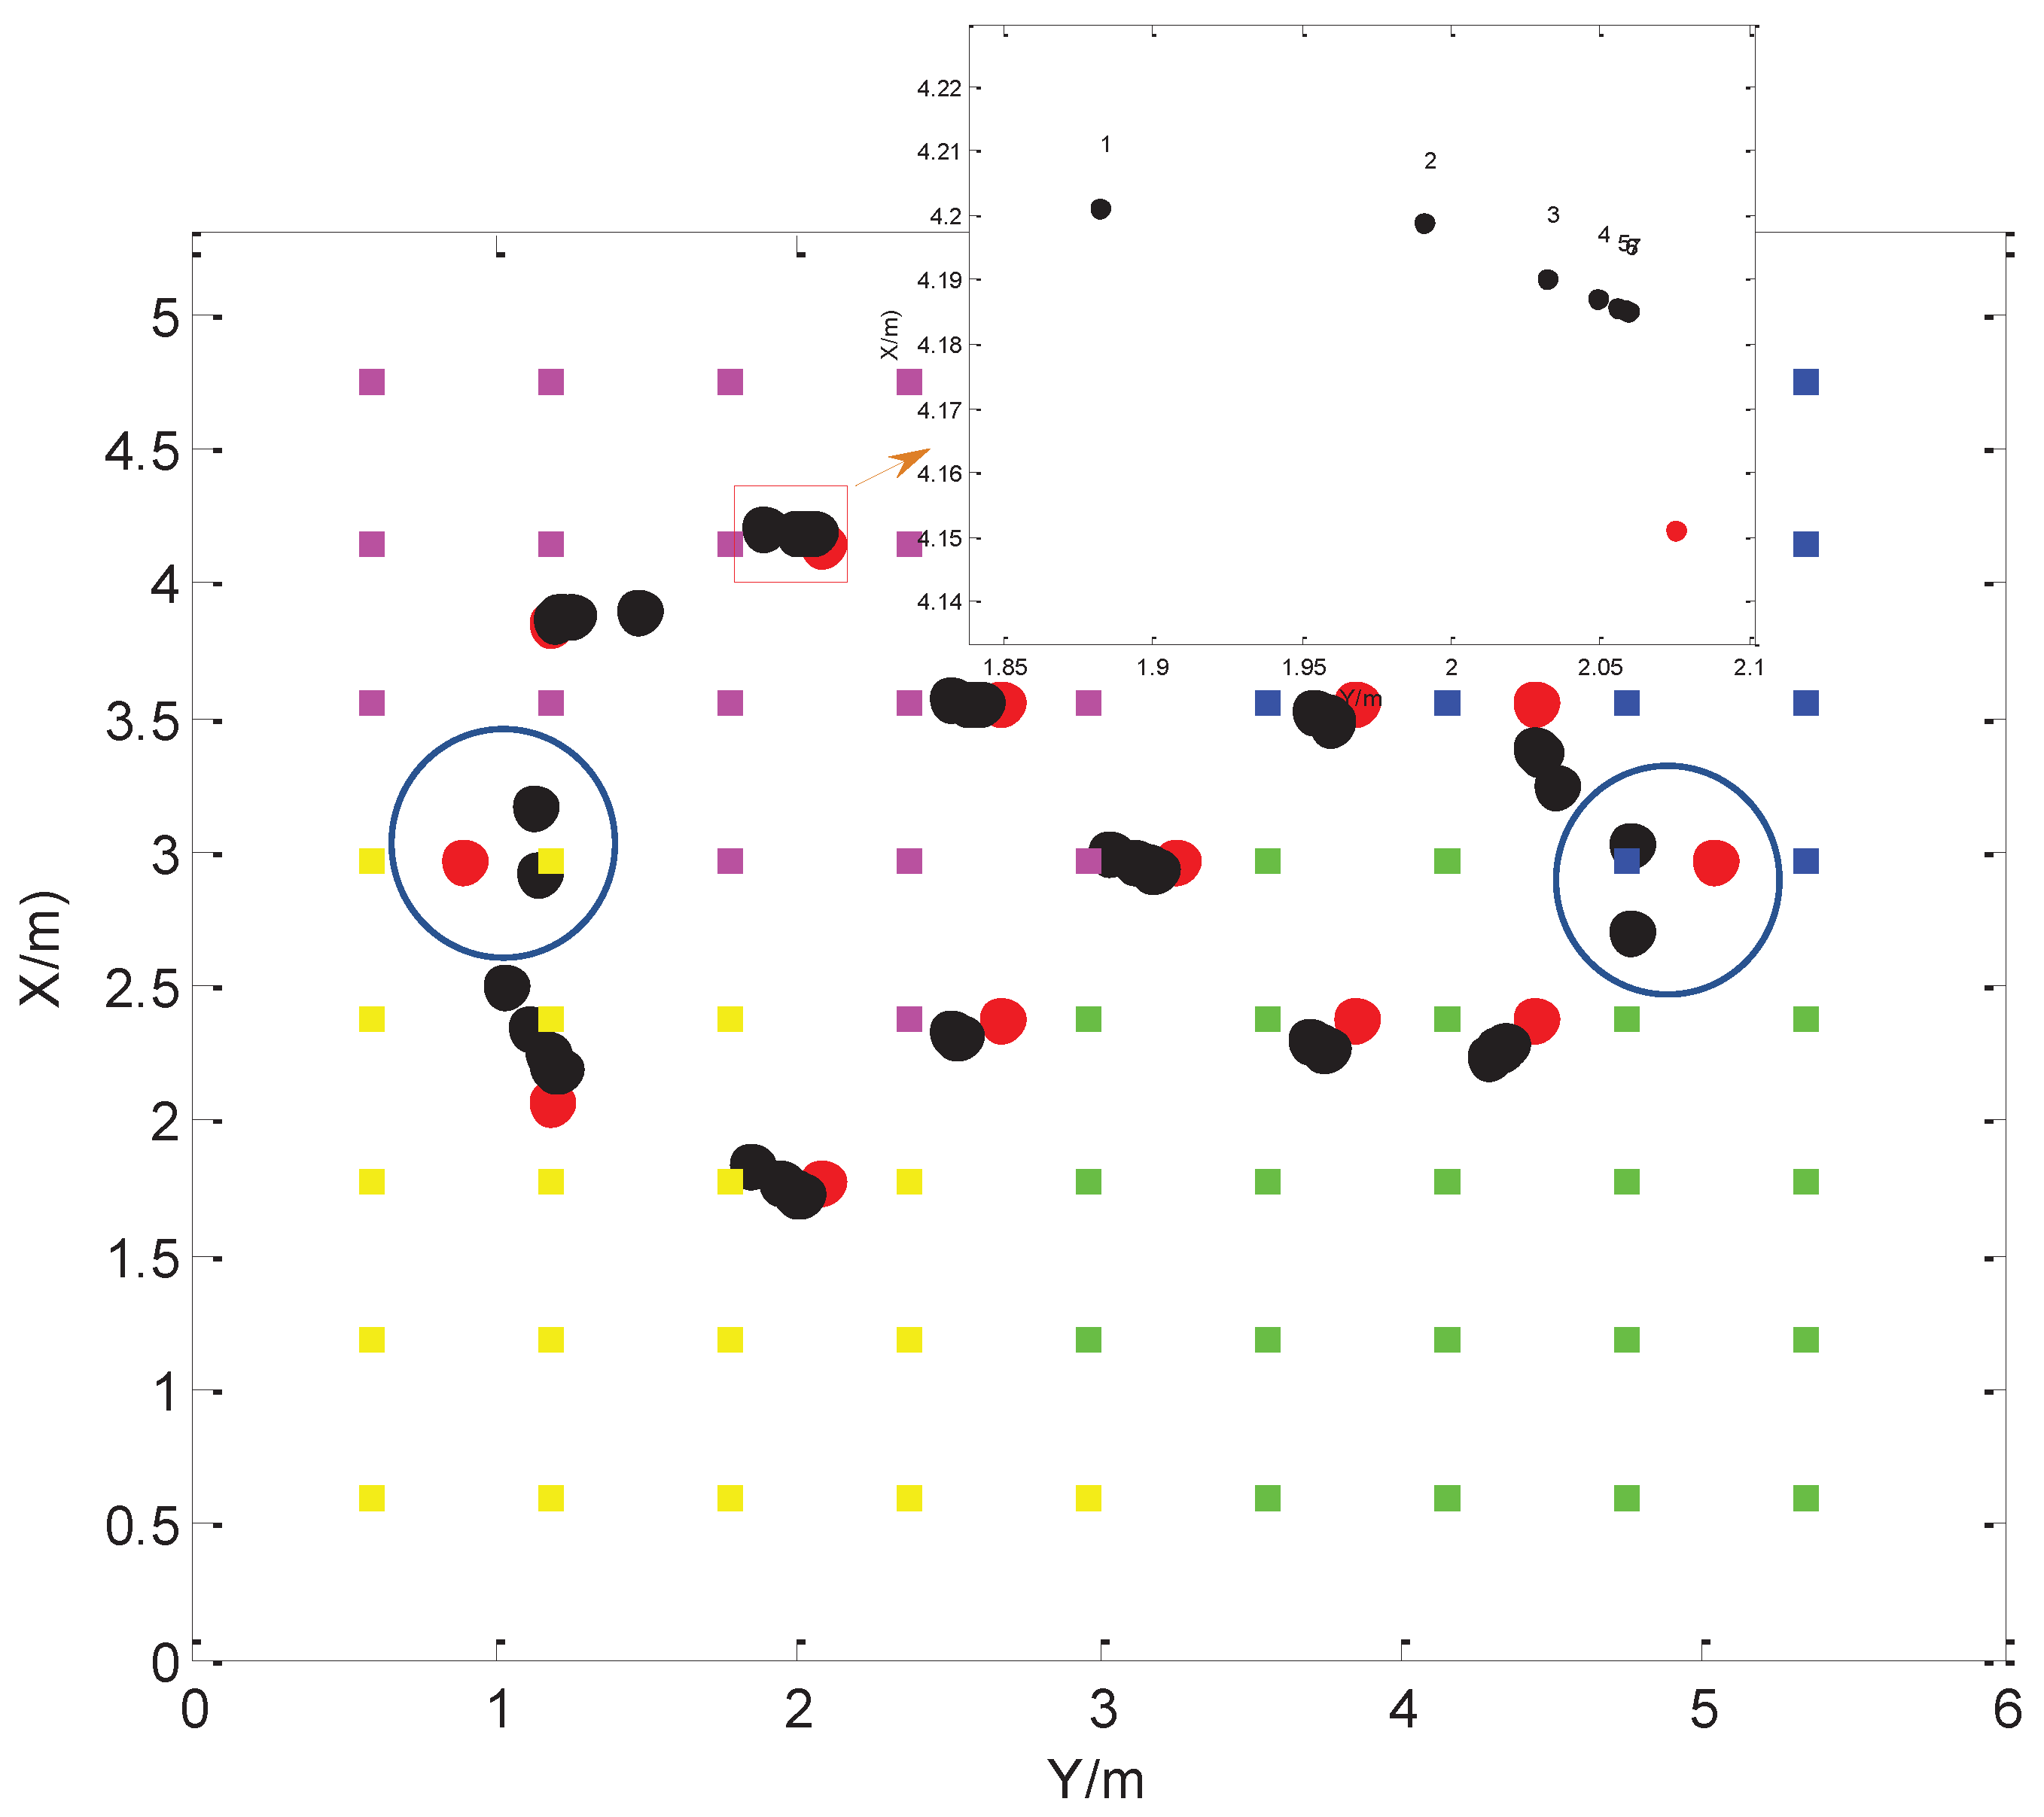
The fingerprinting acoustic localization approach based on iterative interpolation and cluster analysis is presented in this work. The positioning database consisting of 72 initial RPs is divided into four sub-databases by K-Means clustering algorithm, and four adjacent RPs selected by the two-stage matching method are used for 13 test point’s location estimation based on iterative interpolation.
As Figure 8 shows, all of the estimated positions of the 13 target points obtained good concordance with the true positions. Meanwhile, the interpolation process at most target points ended in five iterations. Take Test Point 3, for instance: the location error decreased during iterative interpolation process and ended at the seventh iteration.
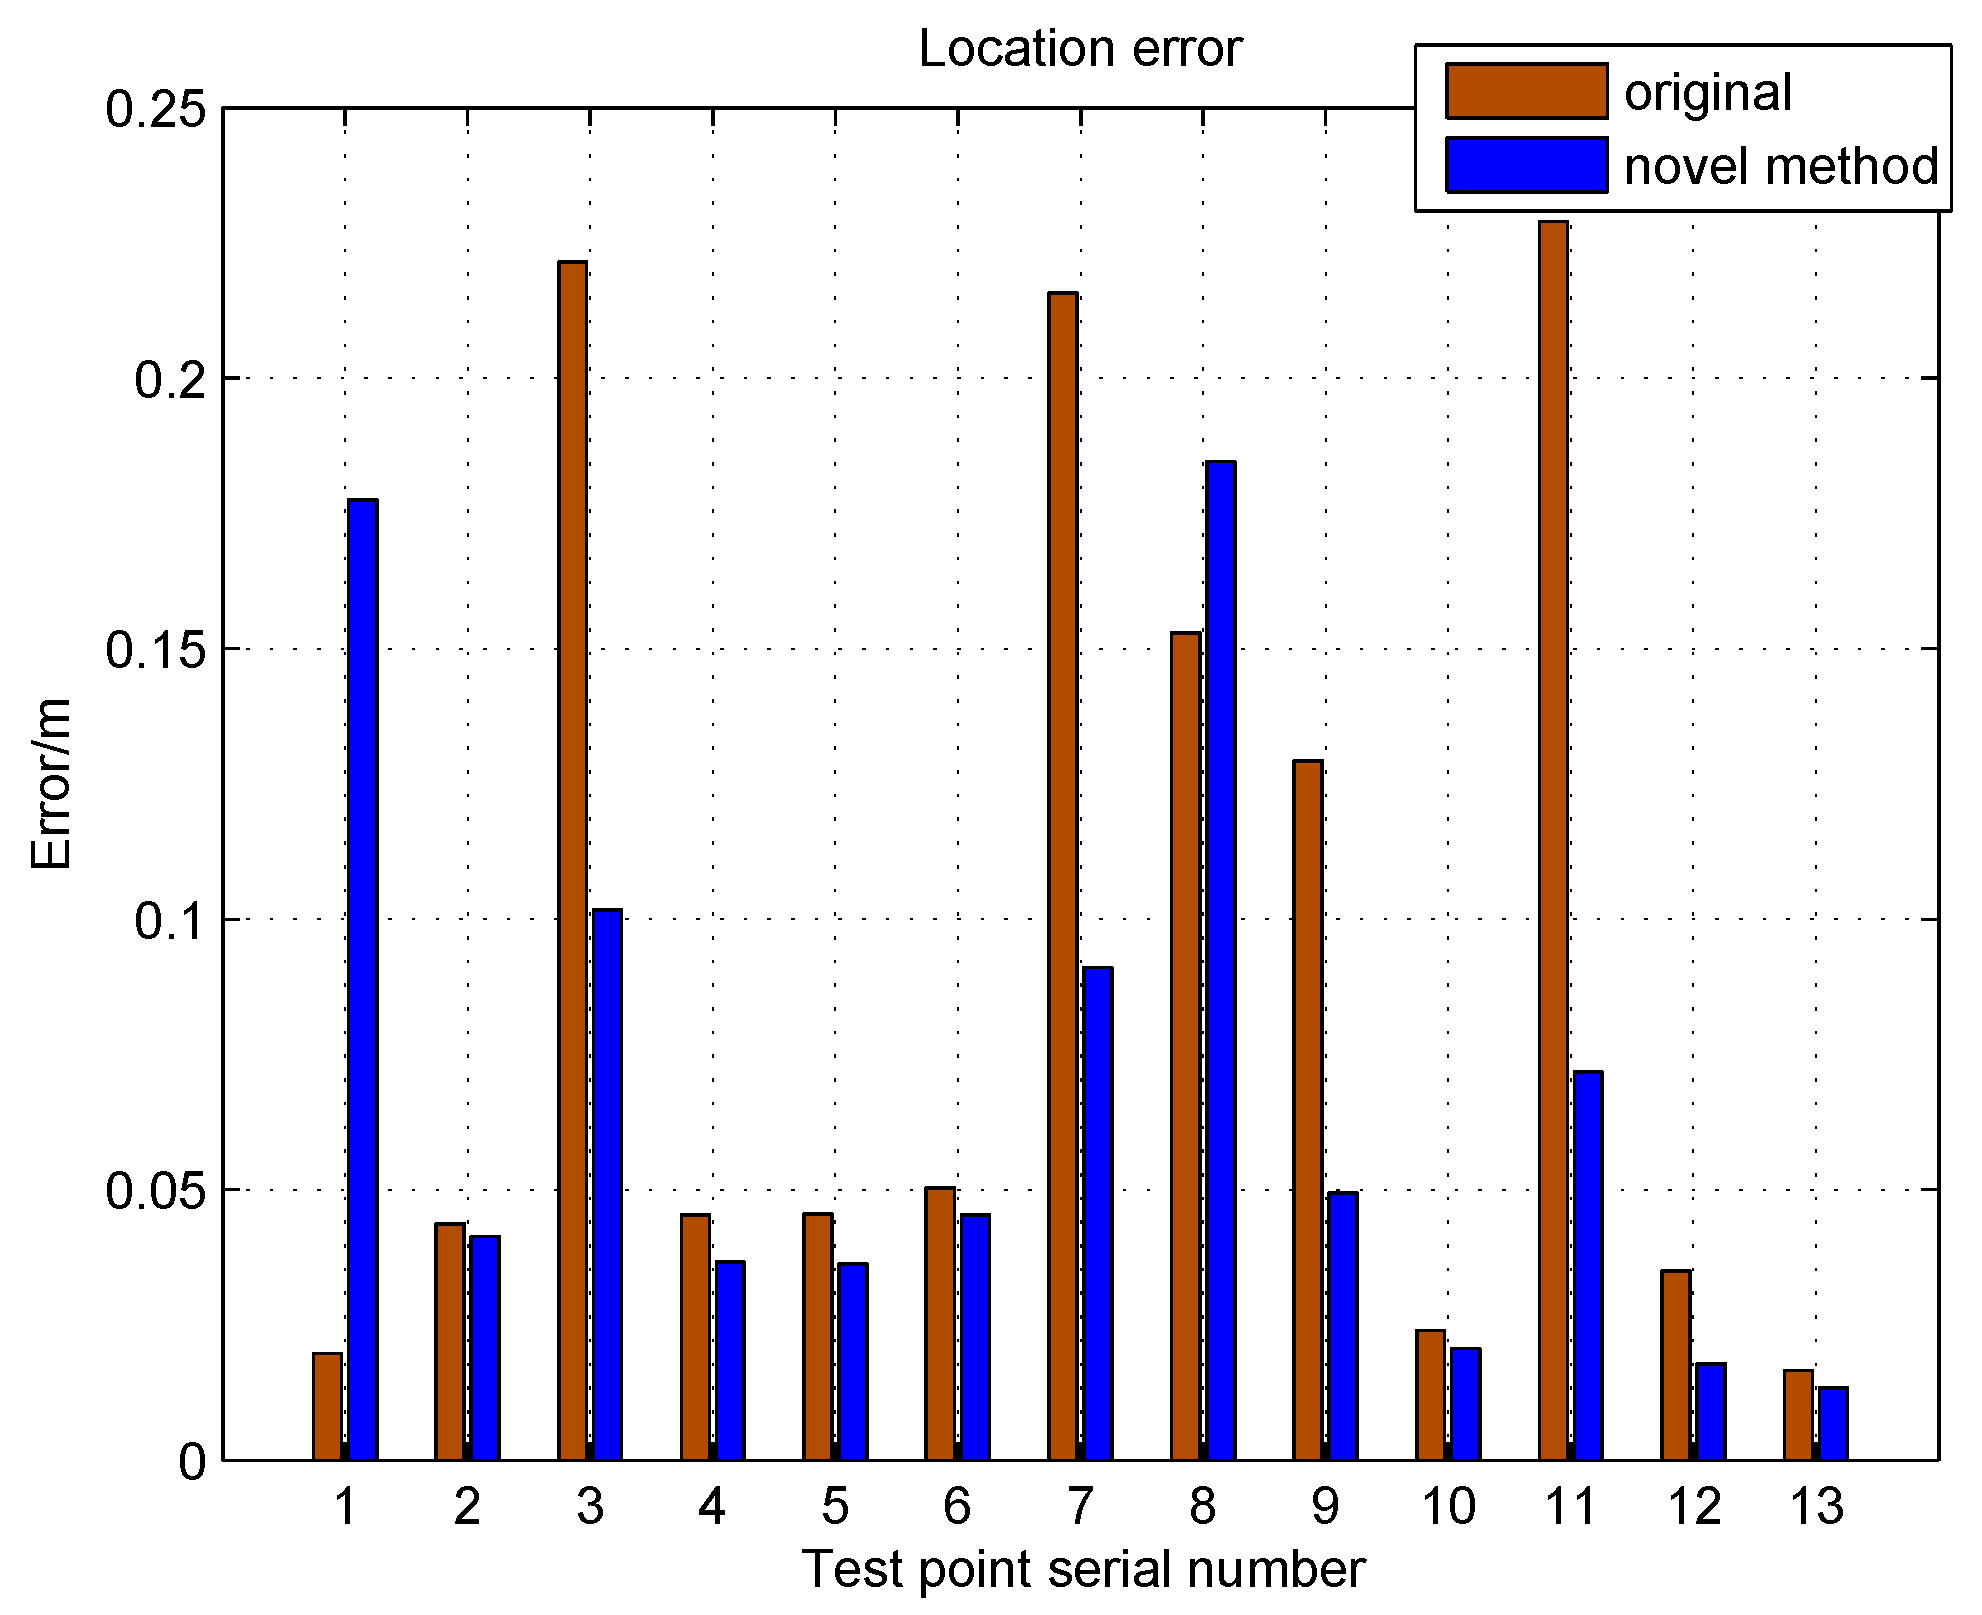
To analyze the influence at different test points, the position accuracy comparison of the novel method and the original method were taken on each test point. As Figure 9 shows, the novel method brought significant improvement of positioning accuracy for 11 of the 13 test points. In the novel method, the errors of Test Points 3, 7, 9, 11 and 12 decreased more than 50% from the original location method. However, Test Points 2, 4, 5, 6, 10 and 13 were not sensitive to interpolation process because they already had relatively high positioning accuracy. It must to be pointed out that the location results of Test Points 1 and 8 got worse and result in no apparent improvement in maximum error. That is because these points were located at the boundary of two sub-databases, and their adjacent RPs were assigned to different clusters by feature clustering partition method. The causes of location error are complex and varied; to further decrease the location error, improvements of other links in fingerprinting acoustic localization process are also needed.
5. Conclusions
In this paper, the iterative interpolation method and cluster analysis method has been presented for improving the positioning efficiency of indoor fingerprinting acoustic localization. In the fingerprinting acoustic localization process, the calibration efforts in offline phase can be reduced due to the sparse sampling treatment, and the satisfactory positioning accuracy can be guaranteed by virtual RPs generated by the iterative interpolation method. Meanwhile, the K-Means cluster analysis method was adopted for database partition, and a two-level RPs matching method was used to speeding up the online positioning phase. The results show that the fingerprinting acoustic localization method can achieve satisfactory accuracy with few initial RPs sampling in offline phase and a more rapid RPs matching process in online phase by iterative interpolation and cluster analysis. As future works, an extension of the clustering method to reduce the location results deterioration of the frontier points and various types of complex tasks for further verification of the novel method are being considered.
Author Contributions
S.W. conceived and designed the experiments and wrote the paper. P.Y. and H.S. contributed to project research scheme formulation. All authors contributed to the final version.
Funding
This research was funded by the National Natural Science Foundation of China (No. 61373017), Natural Science Foundation of Hebei Province (No. F2014202121), and Graduate Student Innovation Funding Project of Hebei Province (No. 220056).
Acknowledgments
The authors thank all the reviewers and editors for their valuable comments and work.
Conflicts of Interest
The authors declare no conflict of interest.
References
- Zhen, J.G.; Aoki, H.; Sato-Shimokawara, E.; Yamaguchi, T. Interactive system for sharing objects information by gesture and voice recognition between human and robot with facial expression. In Proceedings of the IEEE/SICE International Symposium on System Integration, Fukuoka, Japan, 16–18 December 2012; pp. 293–298. [Google Scholar]
- Li, X.F.; Liu, H. A survey of sound source localization for robot audition. CAAI Trans. Intell. Syst. 2012, 1, 9–20. [Google Scholar]
- Yu, Q.; Yuan, C.; Fu, Z. Research of the Localization of Restaurant Service Robot. Int. J. Adv. Robot. Syst. 2010, 7, 227–238. [Google Scholar]
- Breazeal, C. Social interactions in HRI: The robot view. IEEE Trans. Syst. Man Cybern. Part C 2004, 34, 181–186. [Google Scholar] [CrossRef]
- Li, X.F.; Liu, H. Sound Source Localization for HRI Using FOC-Based Time Difference Feature and Spatial Grid Matching. IEEE Trans. Cybern. 2013, 4, 1199–1212. [Google Scholar] [CrossRef] [PubMed]
- Park, J.S.; Kim, J.H.; Oh, Y.H. Feature vector classification based speech emotion recognition for service robots. IEEE Trans. Consum. Electron. 2009, 3, 1590–1596. [Google Scholar] [CrossRef]
- Wang, H.; Kaveh, M. Coherent signal subspace processing for the detection and estimation of angles of arrival of mutiple wide-band sources. IEEE Trans. Acoust. Speech Signal Process. 1985, 4, 823–831. [Google Scholar] [CrossRef]
- Wax, M.; Kailath, T. Optimum localization of multiple sourcesby passive arrays. IEEE Trans. Acoust. Speech Signal Process. 1983, 5, 1210–1217. [Google Scholar] [CrossRef]
- Cater, G.C. Variance bounds for passively locating an acoustic source with a symmetric line array. J. Acoust. Soc. Am. 1977, 4, 922–926. [Google Scholar] [CrossRef]
- Knapp, C.H.; Carter, G.C. The generalized correlation method for estimation of time delay. IEEE Trans. Acoust. Speech Signal Process. 1976, 4, 320–327. [Google Scholar] [CrossRef]
- Carter, G.C. Special issue on time delay estimation. IEEE Trans. Acoust. Speech Signal Process. 1981, 3, 461–624. [Google Scholar] [CrossRef]
- Liu, H.; Darabi, H.; Banerjee, P.; Jing, L. Survey of wireless indoor positioning techniques and systems. IEEE Trans. Syst. Man Cybern. Part C 2007, 6, 1067–1080. [Google Scholar] [CrossRef]
- Dehkordi, M.B.; Abutalebi, H.R.; Taban, M.R. Sound source localization using compressive sensing-based feature extraction and spatial sparsity. Digit. Signal Process. 2013, 4, 1239–1246. [Google Scholar] [CrossRef]
- Song, Z.; Jiang, G.; Huang, C. A Survey on Indoor Positioning Technologies. In Proceedings of the Second International Conference on International Conference on Theoretical and Mathematical Foundations of Computer Science, Singapore, 5–6 May 2011; pp. 198–206. [Google Scholar]
- Gu, Y.; Lo, A.; Niemegeers, I. A survey of indoor positioning systems for wireless personal networks. IEEE Commun. Surv. Tutor. 2009, 11, 13–32. [Google Scholar] [CrossRef] [Green Version]
- Wang, S.P.; Sun, H.; Yang, P. Indoor sound-position fingerprint method based on scenario analysis. J. Beijing Univ. Technol. 2017, 2, 224–229. [Google Scholar]
- Wan, Q. From parametric localization to non-parametric localization. In Indoor Positioning Theory, Method and Application; Electronic Industry Press: Beijing, China, 2012; pp. 8–14. [Google Scholar]
- Chen, Z.; Li, Z.; Wang, S.W.; Yin, F.L. A microphone position calibration method based on combination of acoustic energy decay model and TDOA for distributed microphone array. Appl. Acoust. 2015, 95, 13–19. [Google Scholar] [CrossRef]
- He, S.; Ji, B.; Chan, S.H.G. Chameleon: Survey-free updating of a fingerprint database for indoor localization. IEEE Pervasive Comput. 2016, 15, 66–75. [Google Scholar] [CrossRef]
- Chen, L.N.; Li, B.H.; Zhao, K.; Rizos, C.; Zheng, Z.Q. An Improved Algorithm to Generate a Wi-Fi Fingerprint Database for Indoor Positioning. Sensors 2013, 8, 11085–11096. [Google Scholar] [CrossRef] [PubMed]
- Krumm, J.; Platt, J.C. Minimizing Calibration Effort for an Indoor 802.11 Device Location Measurement System; Technical Report for MSRTR-2003-82; Microsoft Research Microsoft Corporation One Microsoft Way: Washington, DC, USA, 2003. [Google Scholar]
- Li, B.; Wang, Y.; Lee, H.K.; Dempster, A.; Rizos, C. Method for yielding a database of location fingerprints in WLAN. IEE Proc.-Commun. 2005, 152, 580–586. [Google Scholar] [CrossRef]
- Ouyang, R.W.; Wong, K.S.; Lea, C.T.; Chiang, M. Indoor Location Estimation with Reduced Calibration Exploiting Unlabeled Data via Hybrid. IEEE Trans. Mob. Comput. 2012, 11, 1613–1626. [Google Scholar] [CrossRef]
- Kuo, S.P.; Tseng, Y.C. Discriminant minimization search for largescale RF-based localization systems. IEEE Trans. Mob. Comput. 2011, 10, 291–304. [Google Scholar]
- Lee, M.; Han, D. Voronoi Tessellation Based Interpolation Method for Wi-Fi Radio Map Construction. IEEE Commun. Lett. 2012, 16, 404–407. [Google Scholar] [CrossRef]
- Yang, P.; Xu, J.; Wang, S. Position fingerprint localization method based on linear interpolation in robot auditory system. In Proceedings of the Chinese Automation Congress, Jinan, China, 20–22 October 2017; pp. 2766–2771. [Google Scholar]
- Atia, M.M.; Noureldin, A.; Korenberg, M.J. Dynamic online-calibrated radio maps for indoor positioning in wireless local area networks. IEEE Trans. Mob. Comput. 2013, 9, 1774–1787. [Google Scholar] [CrossRef]
- Yook, D.; Lee, T.; Cho, Y. Fast sound source localization using two-level search space clustering. IEEE Trans. Cybern. 2016, 46, 20–26. [Google Scholar] [CrossRef] [PubMed]
- Abusara, A.; Hassan, M.S.; Ismail, M.H. Reduced-complexity fingerprinting in WLAN-based indoor positioning. Telecommun. Syst. 2017, 65, 407–417. [Google Scholar] [CrossRef]
- Au, A.W.S.; Chen, F.; Shahrokh, V.; Sophia, R.; Sameh, S.; Samuel, N.M.; Deborah, G.; Keith, G.; Moshe, E. Indoor tracking and navigation using received signal strength and compressive sensing on a mobile device. IEEE Trans. Mob. Comput. 2013, 10, 2050–2062. [Google Scholar] [CrossRef]
- Steen, K.A.; Mcclellan, J.H.; Green, O.; Karstoft, H. Acoustic source tracking in long baseline microphone arrays. Appl. Acoust. 2015, 87, 38–45. [Google Scholar] [CrossRef]
- Wang, G.; Li, Y.; Ansari, N.A. Semidefinite Relaxation Method for Source Localization Using TDOA and FDOA Measurements. IEEE Trans. Veh. Technol. 2013, 2, 853–862. [Google Scholar] [CrossRef]
- Kim, U.H.; Nakadai, K.; Okuno, H.G. Improved sound source localization in horizontal plane for binaural robot audition. Appl. Intell. 2015, 1, 63–74. [Google Scholar] [CrossRef]
- Kwak, K.C.; Kim, S.S. Sound source localization with the aid of excitation source information in home robot environments. IEEE Trans. Consum. Electron. 2008, 2, 852–856. [Google Scholar] [CrossRef]
- Tian, Y.; Chen, Z.; Yin, F.L. Distributed Kalman filter-based speaker tracking in microphone array networks. Appl. Acoust. 2015, 89, 71–77. [Google Scholar] [CrossRef]
- Bahl, P.; Padmanabhan, V.N. RADAR: An In-Building RF-based User Location and Tracking System. In Proceedings of the Nineteenth Joint Conference of the IEEE Computer and Communications Societies, Tel Aviv, Israel, 26–30 March 2000; pp. 775–784. [Google Scholar]
- Zhou, Z.H. Prototype-based clusterings. In Machine Learning; Tsinghua University Press: Beijing, China, 2016; pp. 202–211. [Google Scholar]
Figure 1.
Illustration of the fingerprinting localization process.

Figure 2.
Fingerprinting acoustic localization process based on cluster analysis and iterative interpolation.
Figure 2.
Fingerprinting acoustic localization process based on cluster analysis and iterative interpolation.

Figure 3.
Two-stage RPs matching process: (a) the adjacent cluster matching process; and (b) the adjacent RPs matching process. The purple, orange, yellow, blue and green dots are the RPs clustered to different clusters marked as c1 to c5; the dark blue dots are the cluster centers marked as to ; the red dot denotes the TP; means the Euclidean distance between TP and each cluster center; and means the Euclidean distance between TP and each RP in adjacent cluster.

Figure 4.
Virtual RPs generation process.

Figure 5.
The fingerprint-based acoustic localization system and experiment scene.

Figure 6.
The effect of sub-database number on positioning.

Figure 7.
The changes of mean error and maximum error of location estimation according with the iterate interpolation process.
Figure 7.
The changes of mean error and maximum error of location estimation according with the iterate interpolation process.

Figure 8.
The positioning results of the fingerprinting acoustic localization based on iterative interpolation method. The green, pink, blue and yellow dots are the RPs clustered to different clusters, red dots denote the test points, and the black dots are the estimation results of each interpolation.

Figure 9.
The positioning results comparison of the acoustic localization without interpolation process and acoustic localization base on iterative interpolation process.
Figure 9.
The positioning results comparison of the acoustic localization without interpolation process and acoustic localization base on iterative interpolation process.


Table 1.
Comparison of the influence on positioning effect between database partition methods. A-amount, average matching amount; A-time, average matching time; A-error, average positioning error.
Table 1.
Comparison of the influence on positioning effect between database partition methods. A-amount, average matching amount; A-time, average matching time; A-error, average positioning error.
| Cases | A-Amount | A-Time (s) | A-Error (m) |
|---|---|---|---|
| No partition | 72 | 0.0271 | 0.0945 |
| Coordinate partition | 22.3 | 0.0084 | 0.1214 |
| Cluster analysis partition | 21.7 | 0.0081 | 0.0813 |
Table 2.
The location results comparison of different fingerprinting acoustic localization methods. I-RPs, initial RPs; V-RPs, virtual RPs; M-error, maximum positioning error; A-error, average positioning error.
Table 2.
The location results comparison of different fingerprinting acoustic localization methods. I-RPs, initial RPs; V-RPs, virtual RPs; M-error, maximum positioning error; A-error, average positioning error.
| Cases | Total RPs | I-RPs | V-RPs | M-Error (m) | A-Error (m) |
|---|---|---|---|---|---|
| No interpolation | 20 | 20 | 0 | 0.4505 | 0.2385 |
| 72 | 72 | 0 | 0.2290 | 0.0945 | |
| Global interpolation | 255 | 20 | 235 | 0.1656 | 0.0772 |
| 255 | 72 | 183 | 0.1330 | 0.0534 | |
| Iterative interpolation | 48.9 | 20 | 28.9 | 0.1773 | 0.0791 |
| 91.2 | 72 | 19.2 | 0.1542 | 0.0652 |
© 2018 by the authors. Licensee MDPI, Basel, Switzerland. This article is an open access article distributed under the terms and conditions of the Creative Commons Attribution (CC BY) license (http://creativecommons.org/licenses/by/4.0/).
Share and Cite
MDPI and ACS Style
Wang, S.; Yang, P.; Sun, H. Fingerprinting Acoustic Localization Indoor Based on Cluster Analysis and Iterative Interpolation. Appl. Sci. 2018, 8, 1862. https://doi.org/10.3390/app8101862
AMA Style
Wang S, Yang P, Sun H. Fingerprinting Acoustic Localization Indoor Based on Cluster Analysis and Iterative Interpolation. Applied Sciences. 2018; 8(10):1862. https://doi.org/10.3390/app8101862
Chicago/Turabian StyleWang, Shuopeng, Peng Yang, and Hao Sun. 2018. "Fingerprinting Acoustic Localization Indoor Based on Cluster Analysis and Iterative Interpolation" Applied Sciences 8, no. 10: 1862. https://doi.org/10.3390/app8101862
Note that from the first issue of 2016, this journal uses article numbers instead of page numbers. See further details here.