1. Introduction
The communication networks are complex systems that support a wide variety of applications, many of them in real time; this has led to a change in the network management scheme. Network administrators must deploy multiple tools to obtain the visibility and control necessary to operate today’s complex networks, some of these tools are: software agents, active networks and policy languages [
1].
The integration of intelligent agents into the management system facilitates the evaluation of the parameters that determine the network performance. An agent has the capacity to detect changes in the environment, and respond in accordance, in order to isolate or anticipate failures making the system proactive; thus, the direct intervention of the network administrator becomes unnecessary in the situations that the agents can handle.
Agent-based modeling is a powerful tool for complex system simulation. A computer network can be described as a complex system because it is dynamic, has nonlinear interactions, and its components exhibit unpredictable reactions that results in behavior patterns [
2,
3]. In the proposed model, when a micro behavior, as a congestion, emerges in a network node, the agent needs to make a decision according to its preferences.
The topology of a network contributes valuable information to analyze its structure. Network managing considering the complex networks approach allows the identification and classification of the nodes using the metrics of centrality and clustering degree, among others.
Autonomic network management is a complex task and consists in the automaticity of the system to protect, configure, optimize and heal itself without human intervention. In networks, the property of automaticity allows self-management, given a set of policies from the administrator, which depicts the agent’s high-level goals [
4]. The proposed model applies a distributed management to avoid attacks over the central nodes in the network.
This paper is structured as follows: in
Section 2, autonomic networking management is defined, in
Section 3, network metrics based on graph theory principles are presented. Next, in
Section 4, we introduce the architecture of the agent-based model and the algorithm proposed is explained. In
Section 5, the simulation experiment and the results obtained are presented. Finally, concluding remarks are given in
Section 6.
2. Autonomic Networking Management
Today, people are using networks to communicate, and networks have become bigger and more complex. The network management is a complicated task that goes beyond technical support and device configuration. To simplify the network management, the automation of the management tasks are critical. The International Business Machines Corporation (IBM) has proposed five levels according to the degree of automaticity in the network management [
4,
5].
Level 1: Refers to the continuous monitoring of the elements of the system by means of software tools handled by people who provide manual support in the event of a failure.
Level 2: Consists of a set of monitoring applications that intelligently collect information to reduce the workload of the network administrator, and is known as the management level.
Level 3: This level can recognize certain behavior patterns of the network in addition to suggesting actions to be taken by the support staff; this level is also called predictive.
Level 4: Uses level 3 tools but attempts to minimize human intervention by helping with Service Level Agreements (SLAs); this level is known as adaptive.
Level 5: Business policies and objectives dynamically manage the system at this level. Its disadvantage is that the automaticity is very closed only based on certain rules, and this level is recognized as autonomous.
The proposed agent-based model is a step forward to reach the fifth level of automaticity, by the integration of intelligent agents that determine the path that will follow the data flows when a congested node situation emerges. The rules used for these agents rely on the preferences of each network node.
3. Measures of Centrality in Networks
A network is a set of nodes and links [
6]. Modeling a network helps to determine the structural issues relevant at a given time. The topology of the network can be illustrated applying an adjacency matrix or adjacency list. The decision of which one has to be used depends on the analysis type.
An adjacency matrix is a mathematical representation of a network, which allows the analysis of the clustering relation between the nodes. When search algorithms are used to enumerate components, the disadvantage of this matrix is the inefficient use of memory, but this is not a problem when a particular element is accessed [
7,
8]. Different techniques for network interpretation and visualization are used nowadays; one of these techniques is based on clustering algorithms, in which the use of an adjacency matrix is more convenient.
One of the measures that is applied to adjacency matrix is the centrality, which captures the hierarchy of the network nodes [
9]. The awareness of the node relevance is crucial to manage any network because this will lead to the determination of the main nodes. The nodes are classified by their betweenness centrality. Eigenvalue centrality is an extension of degree centrality [
8], and the topology of the network has an effect on both measures. The use of a node classification based on the centrality allows the network manager to realize the importance of the nodes. A definition of eigenvalue centrality of a node
i is shown in Equation (
1):
where
is defined by the sum of the
s the centrality of i neighbors, and
is an element of the adjacency matrix. The interpretation of eigenvalues tells if a node is growing or shrinking according to the amount of neighbors. In the model, this measure is used to identify the hierarchy of each node. Links allow communication to reach a remote node. Here, the betweenness centrality of a node has a relevant role. Clustering coefficient
describes how extended a node is, Equation (
2) shows how to calculate it, where Equation (
3) is the degree of the node
and
is the amount of neighbors of the node
i [
2,
10]:
In a heterogeneous network, the nodes with higher clustering degree are called hubs. In [
11], it is affirmed that high degree nodes play a very significant role because the packets are routed through these hubs, and, in a social network, the people highly connected distribute information better than isolated people [
12].
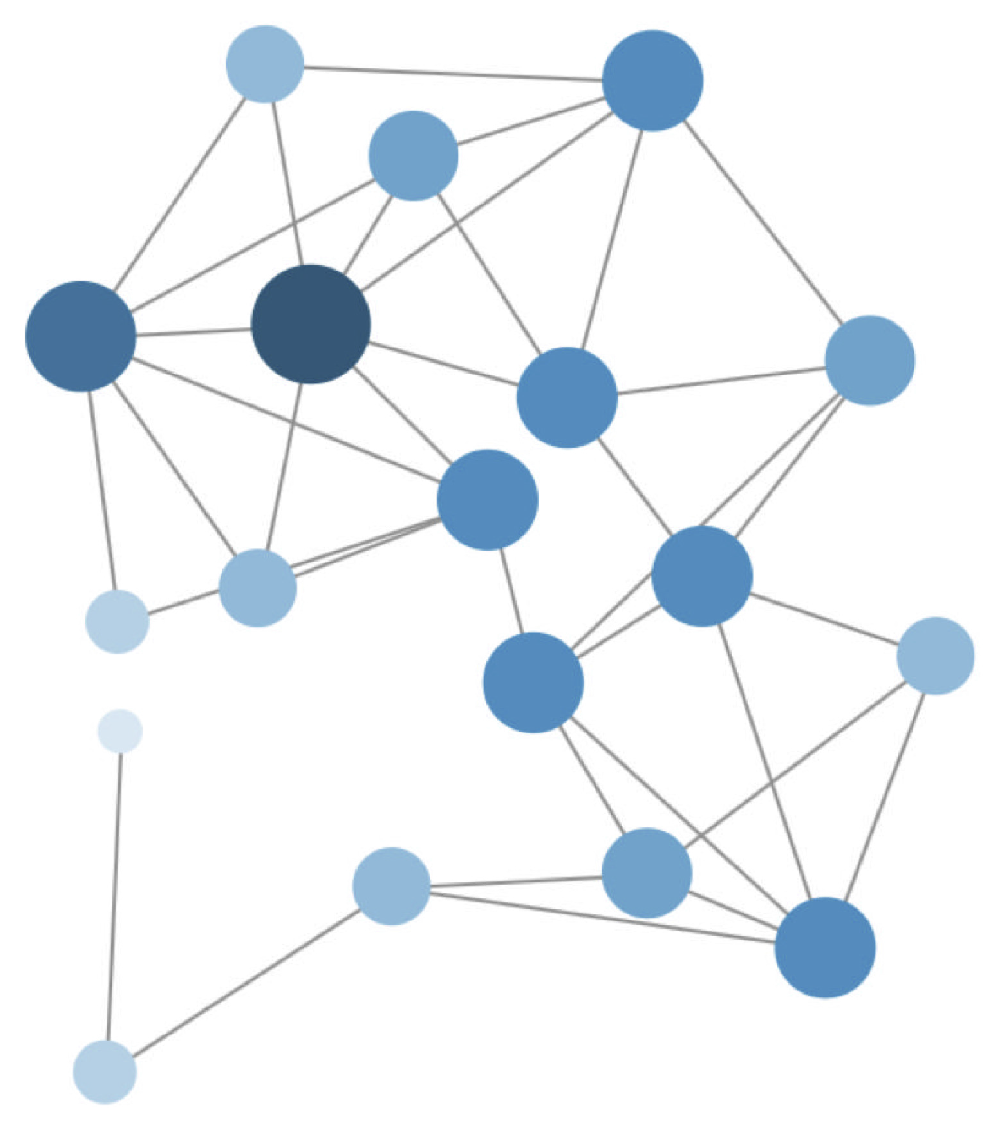
Figure 1 shows a representation of hub nodes in a network where the size of the nodes is proportional to its degree, defined as
k(i) = , where
N(
i) is the amount of the neighbors of a node
i [
10], using this metric, a node hierarchy is obtained. The proposed agent-based model detects clusters of nodes when the flow preferences are assigned.
4. Architecture of the Agent-Based Model
An agent-based model is useful to analyze an approach for decision-making under conditions of deep uncertainty because it has the ability to connect heterogeneous micro and macro behaviors [
13]. In a network model, the micro behaviors represent the interactions of different types of flows (data, video and voice), each one gives information for understanding the network behavior. The flow analysis is critical to the network availability and performance [
14]. Because of this, the proposed agent-based model incorporates into the nodes a set of collaborative agents to collect the information requested by the decision-making level.
4.1. Multi-Agent Architecture for Management of Network Flows
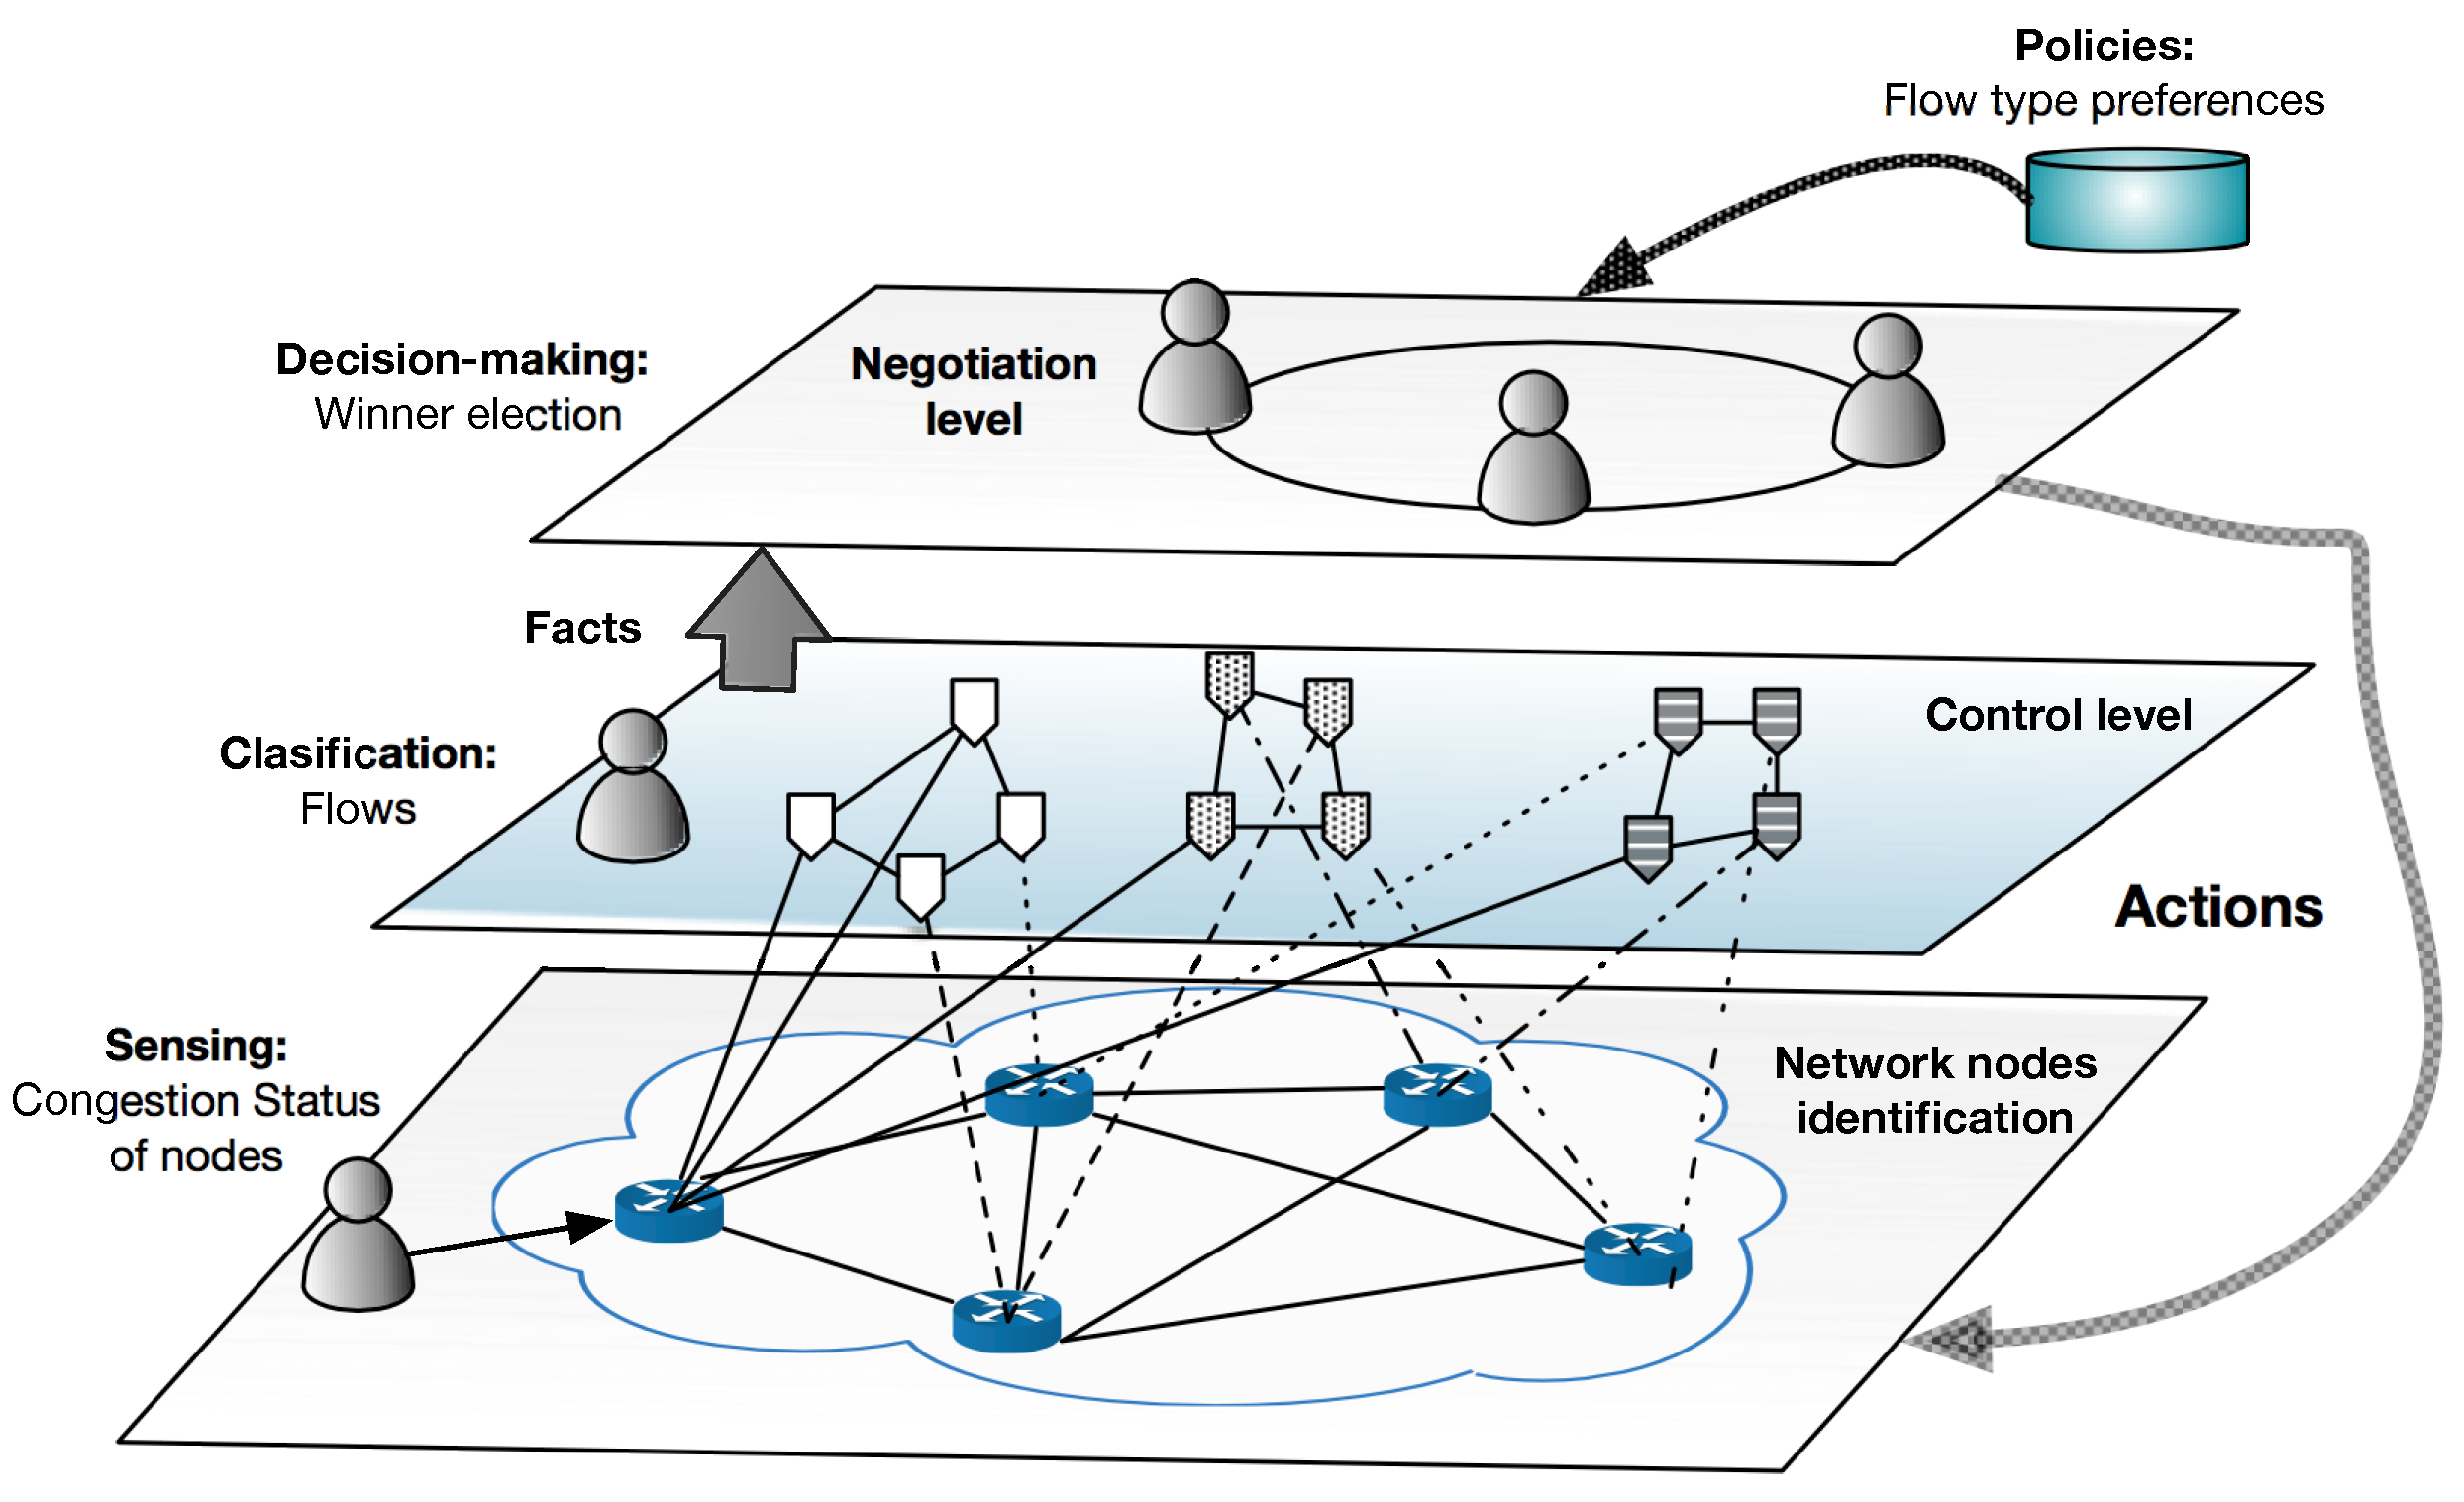
The architecture of the proposed multi-agent model is shown in
Figure 2. The Multi-Agent Architecture for Management of Network Flows, TELEKA, is organized by hierarchy using three levels: Network, Control and Negotiation.
Network: In this level, all nodes are set up with the type of flows that will transmit and their destination. In addition, the agents of each node are initializing with its hierarchy obtained by Equation (
1), and these preferences are assigned by the network administrator depending on their policies, and their utilities are set to zero. The agents collect information related to congestion status by sensing the current state of the nodes. When a congestion is recognized by exceeding a threshold, an
ECG flag changed their value to one, and this will trigger the activation of the negotiation level.
Control: Here, the agents detect and classify the flows that arrive at each node. After this, the agents provide the data to the Negotiation level, which holds the decision-making module.
Negotiation: The algorithm SEHA (Social Election with Hidden Authorities) is triggered in this level when a congestion situation emerges. As a result, a set of actions to be performed by the lower-level agents is selected, achieving with this the optimization of the network status.
4.2. SEHA Social Election with Hidden Authorities Algorithm
According to the social choice theory, the group decision-making process in a multi-agent system should consider that each agent will have their preferences and will vote to choose a winner [
15]. The proposed model considers a set of agents A =
} in a network environment composed by
n number of nodes and
k links with different costs
c.
The tuple that represents an agent is
=
, where
is a set of preferences’ relations
= {
}, they are arranged according to the flow type to transmit and its priority
. Both parameters
and
are configured by the network administrator during the initialization process. The hierarchy of a node
h is calculated by the centrality of each node among the network using the Equation (
1).
The proposed algorithm is activated when a congestion emerges in a node, as is described in Algorithm 1. The SEHA algorithm returns a winner
flow type (data, video or voice) after a voting process between the neighbor’s nodes. The winner flow will have the higher priority in the queue of the congested node. The next step is transmitting the flow through one of its neighboring nodes using the shortest path with minimum cost
c to its destination, the agent of the selected node obtains an utility
u of +1. The rest of the non-preferred flows in the queue of the congested node picks randomly a neighboring node to continue their paths, but the utility
u of the agent is set to
because they are not transmitting the preferred flows.
| Algorithm 1 SEHA Social Election with Hidden Authorities Algorithm |
function Findwinner( , , h)
set [ with max ] of
set modes of
if choices length > 1
set prefered_choice [ with max ] of with max h
else
set
return
end function |
5. Simulated Scenarios and Results
The proposed model analyses the behavior of a network when a congestion situation emerges. In particular, this model aims to enable the implementation of SEHA ( Social Election with Hidden Authorities Algorithm) algorithm to automatically manage the traffic flows across the network. The model validates the TELEKA architecture, which was illustrated in
Figure 2.
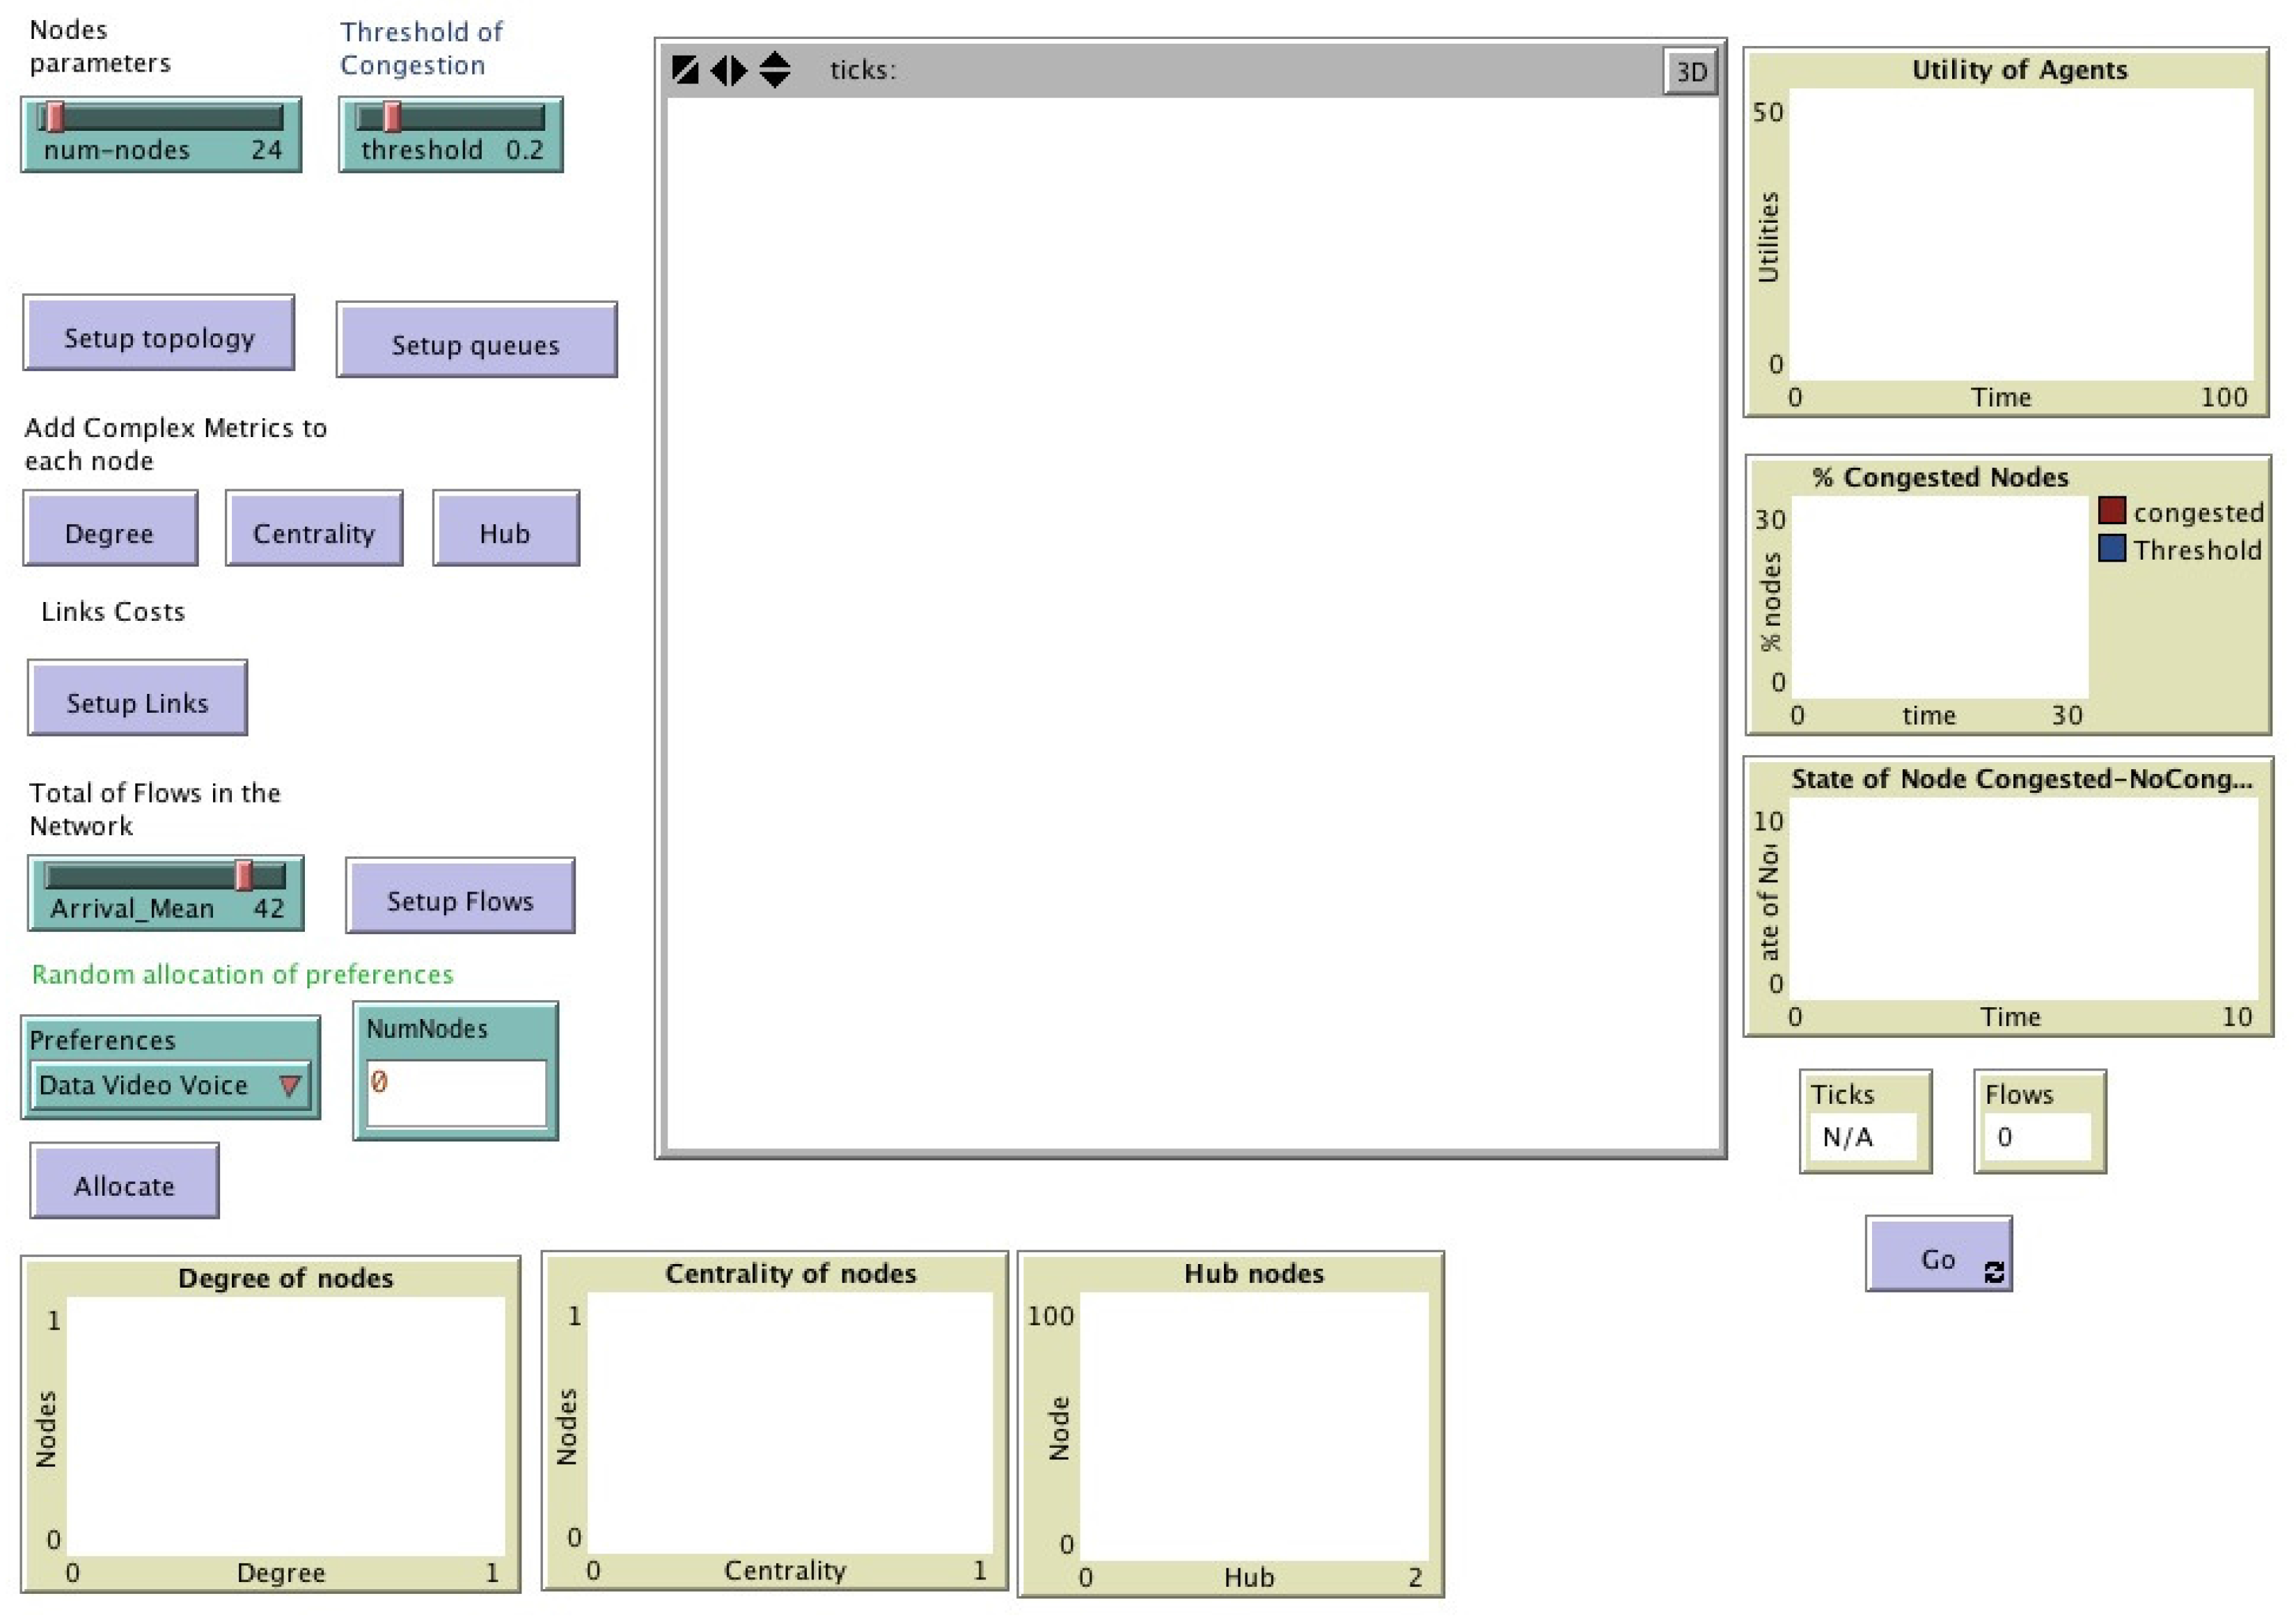
Figure 3 presents the user interface in Netlogo of the model, and also shows the nodes’ parameters as number, degree, centrality, queues threshold of congestion, and topology of the network. The environment where the agents coexist is a network in which the interconnection of the nodes and links are generated by scale-free distribution [
16,
17,
18].
The experiment has the initialization values listed in
Table 1, the hierarchy
h, which corresponds to the values of centrality of each node, are calculated using the Equation (
1), and the values of the preferences
of each node are listed. Link costs are listed in
Table A1 in
Appendix A.
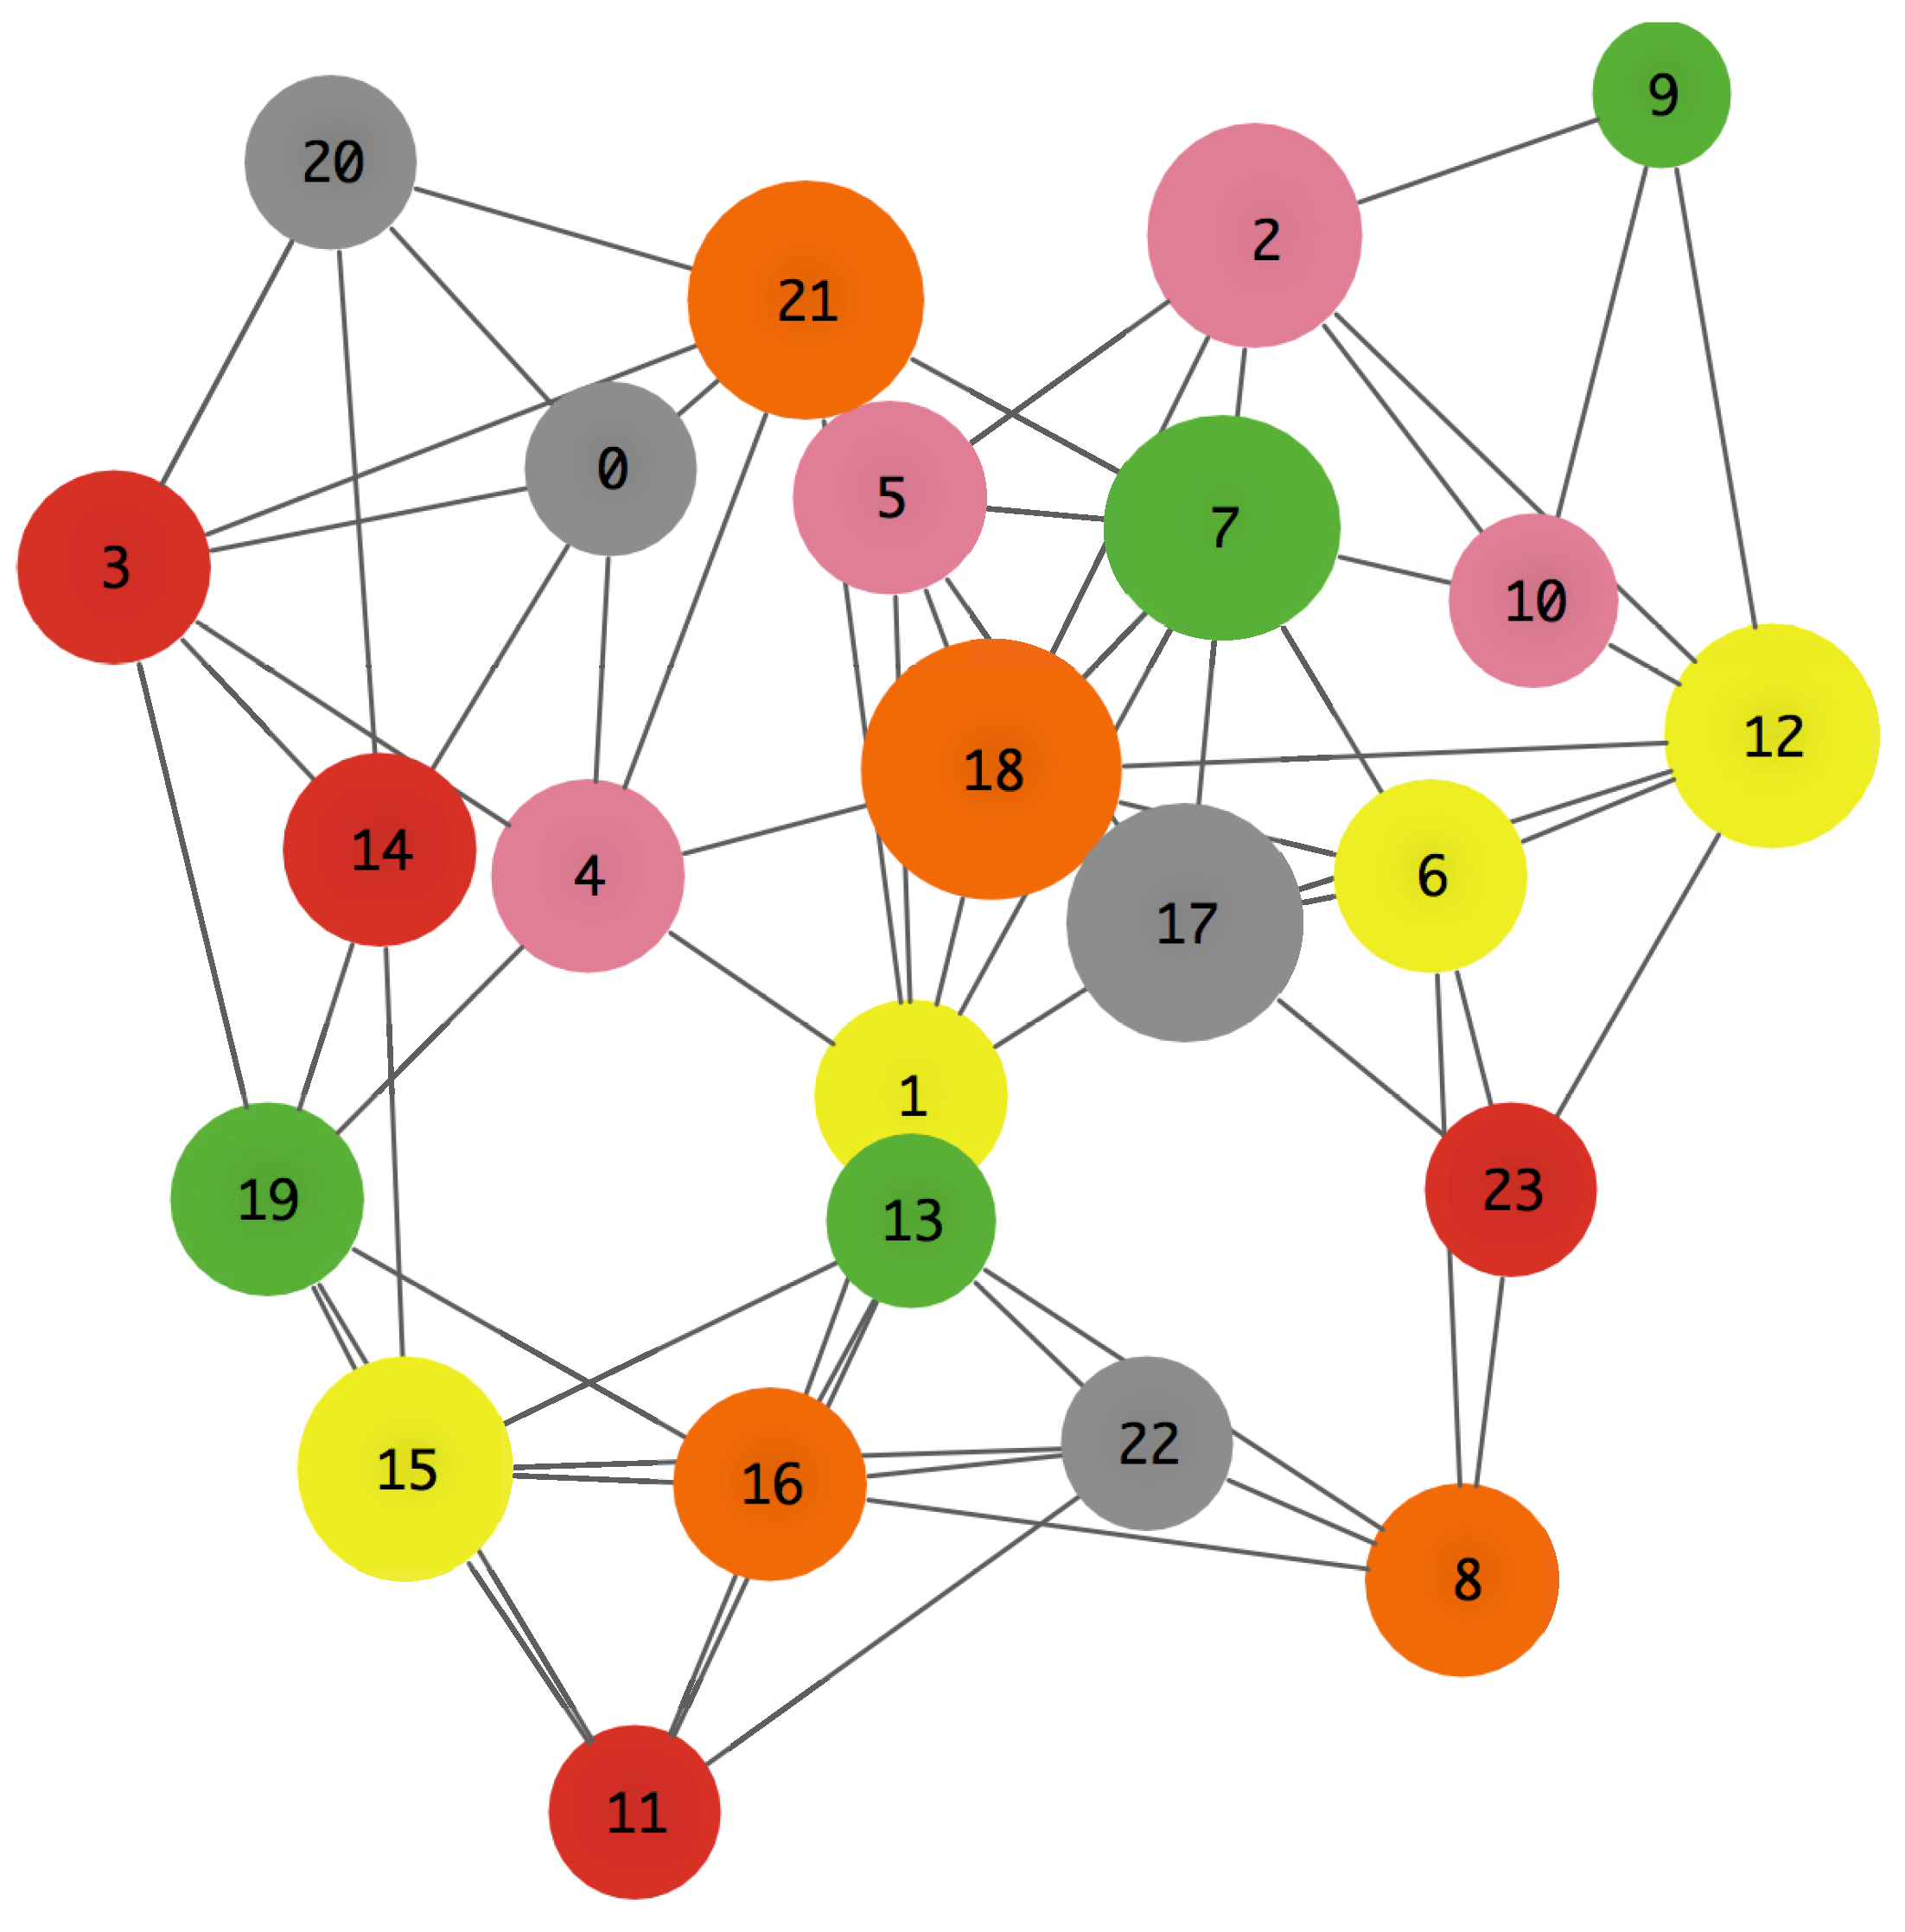
In
Figure 4, the color of each node represents its preferences (see
Table A2 in
Appendix A). The sizes of the nodes are proportional to their degree
k. Finally, the dots inside of each node represents the flows waiting to be transmitted to their destination nodes.
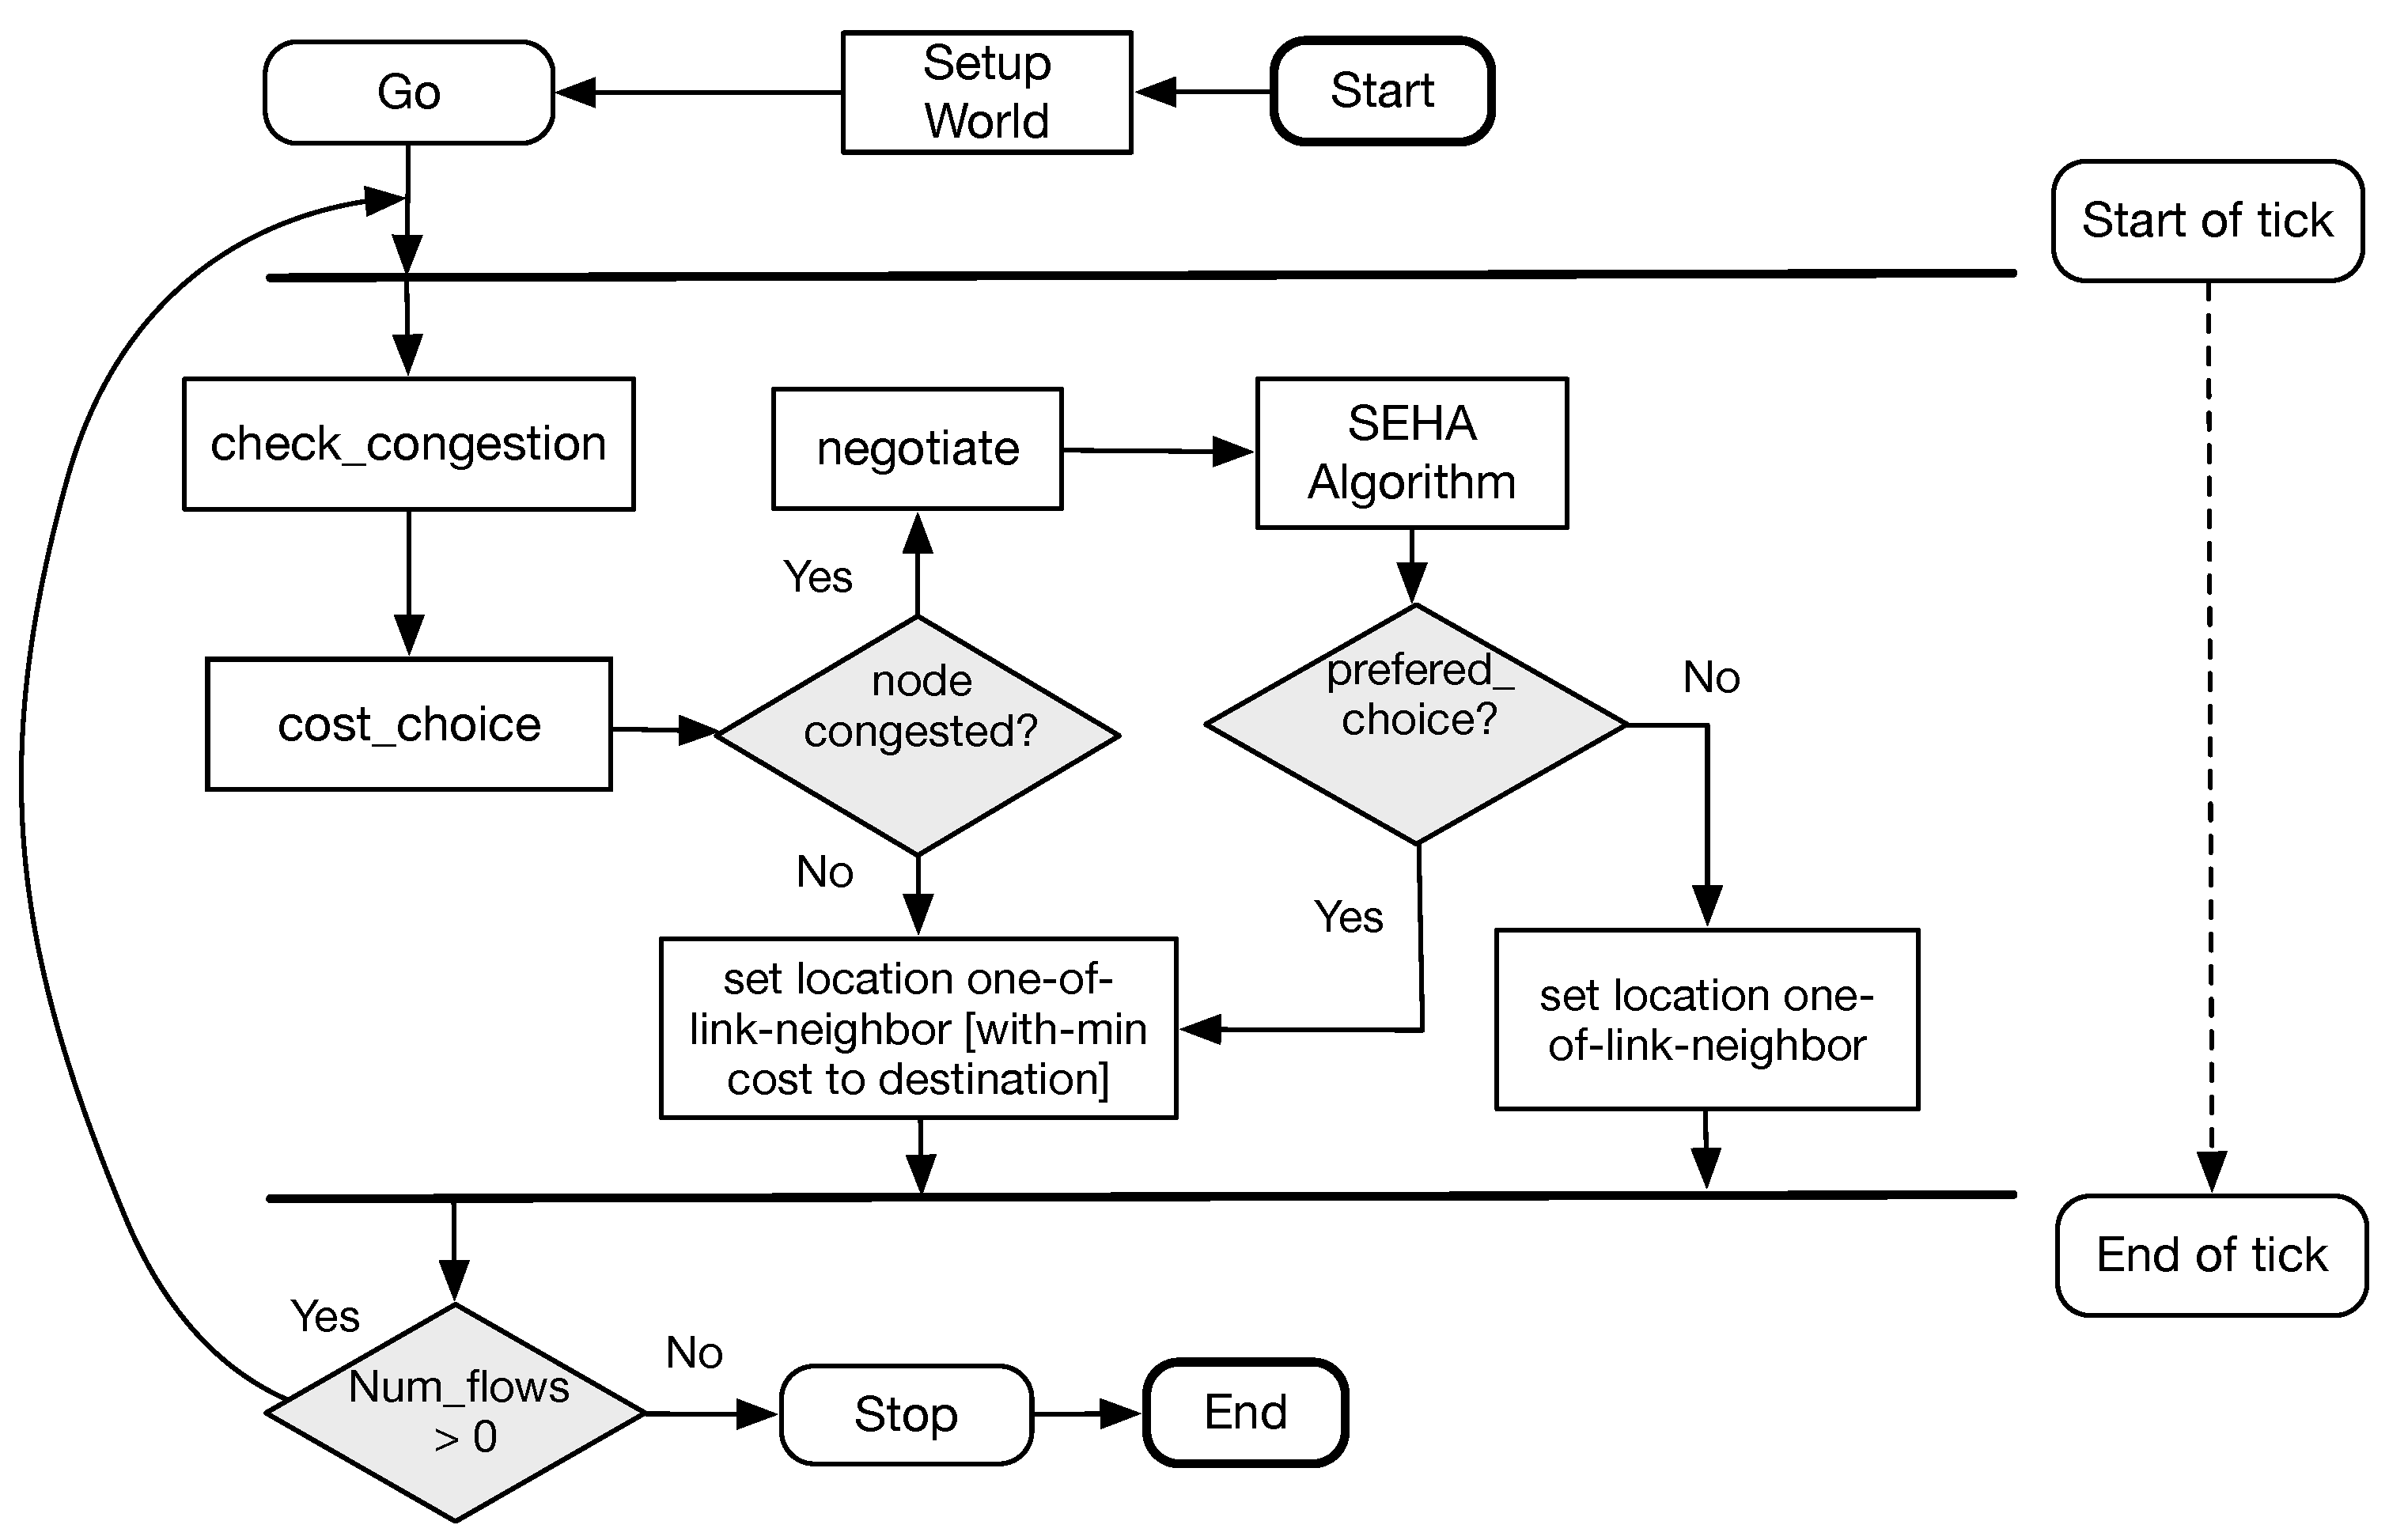
In Netlogo, the next process to activate after the setup of the world is called
Go, and this is illustrated in
Figure 5. The flow diagram represents the actions that are executed within a tick.
5.1. Analysis of Results
Four different scenarios were simulated to analyze the results of the Netlogo model. Two topologies were used: the first topology considers a scale-free distribution and the second one considers a grade distribution. With each topology, the Algorithm 1 was applied, creating the first two scenarios, and it was not applied creating the two remaining scenarios.
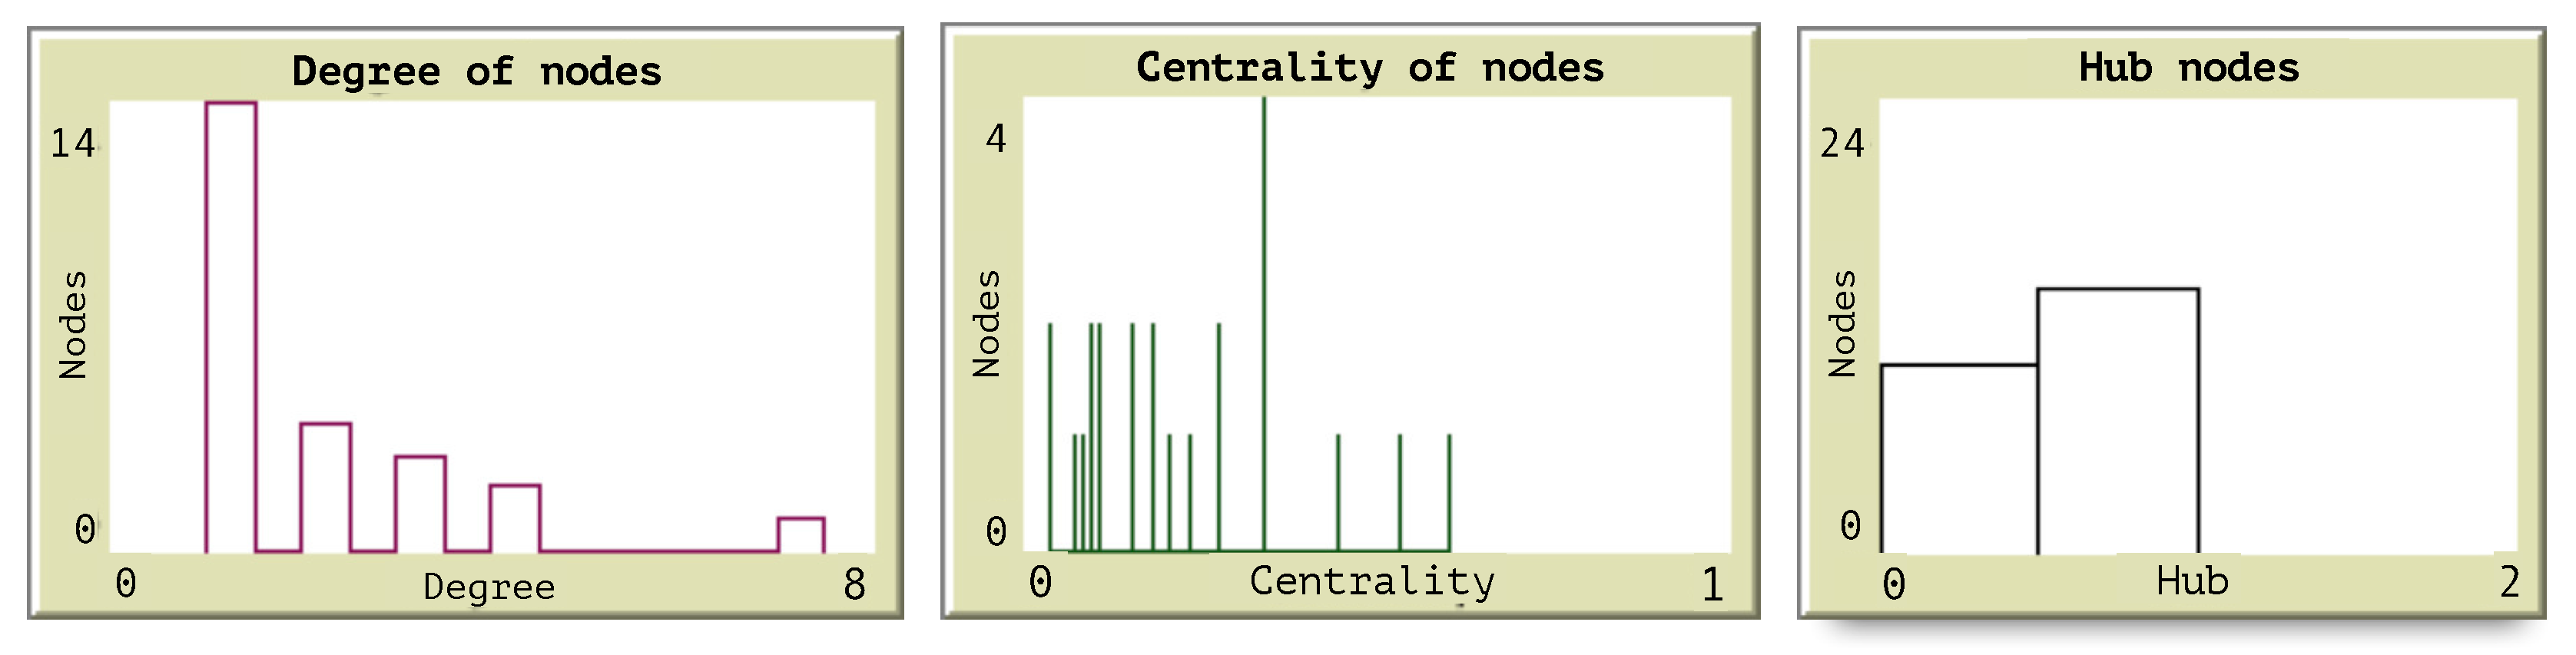
5.2. Simulation Using the Topology with Scale Free Distribution
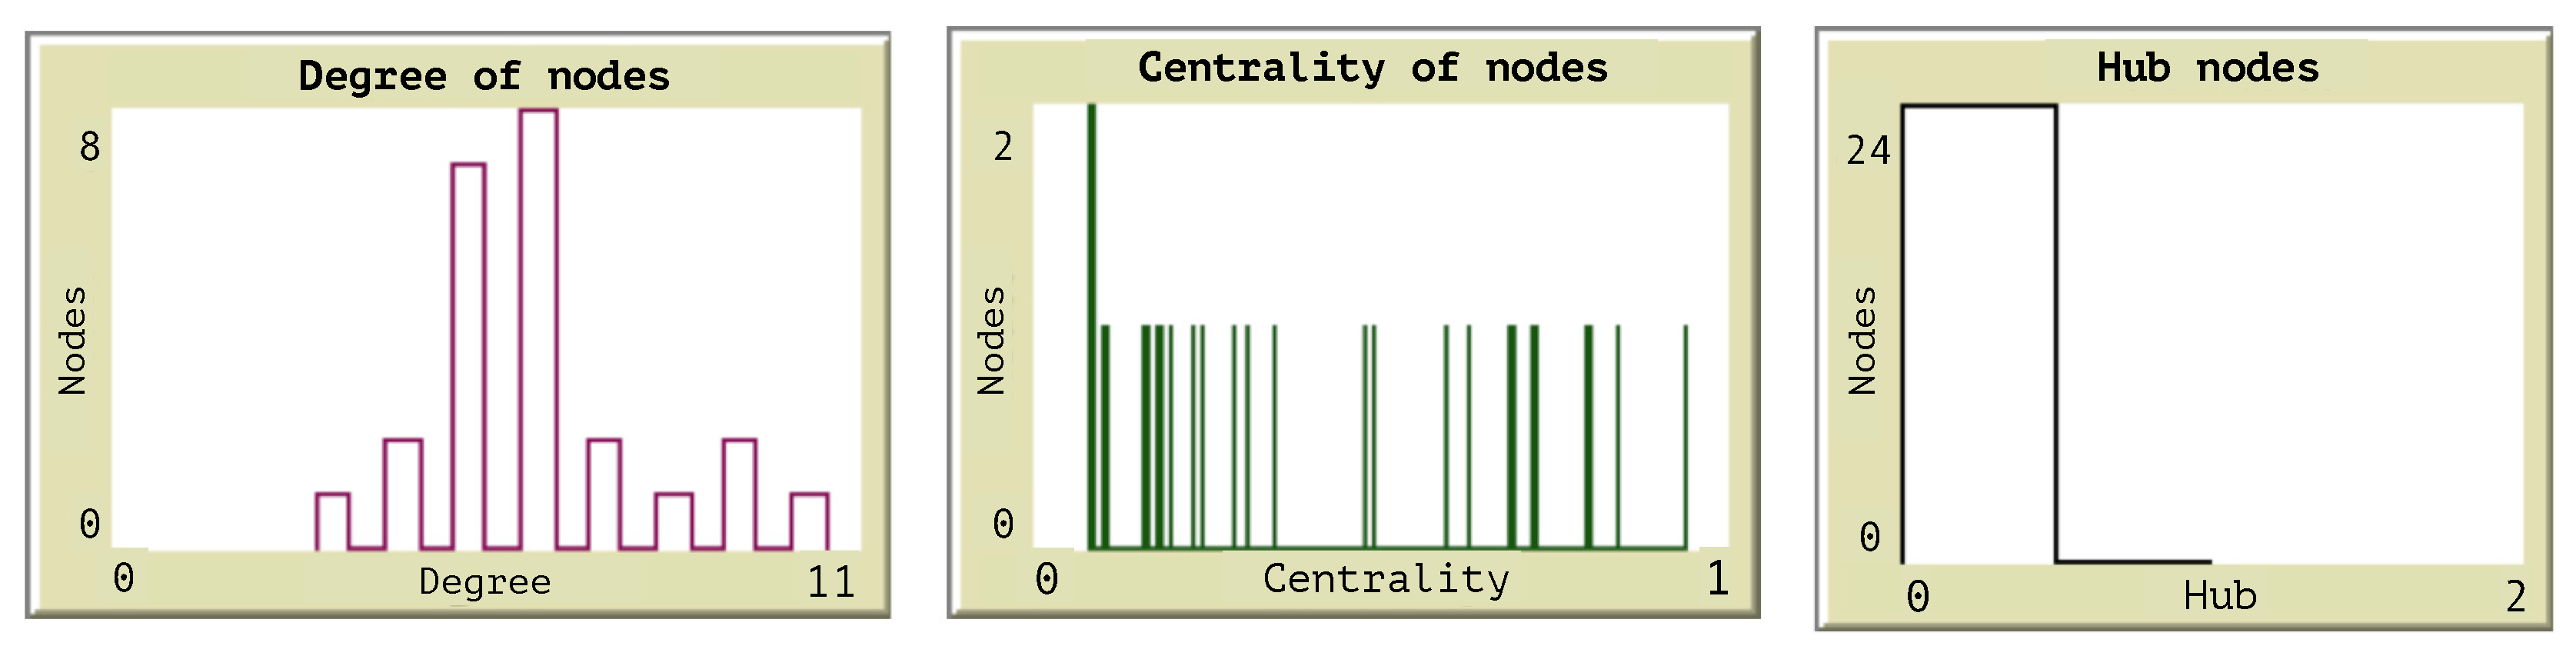
Figure 6 illustrates the histograms obtained from the measures of centrality and the classification of all nodes as hubs or not hubs. The histogram of degree allows the identification of the nodes with the higher degrees as those which are important to consider when a congestion starts.
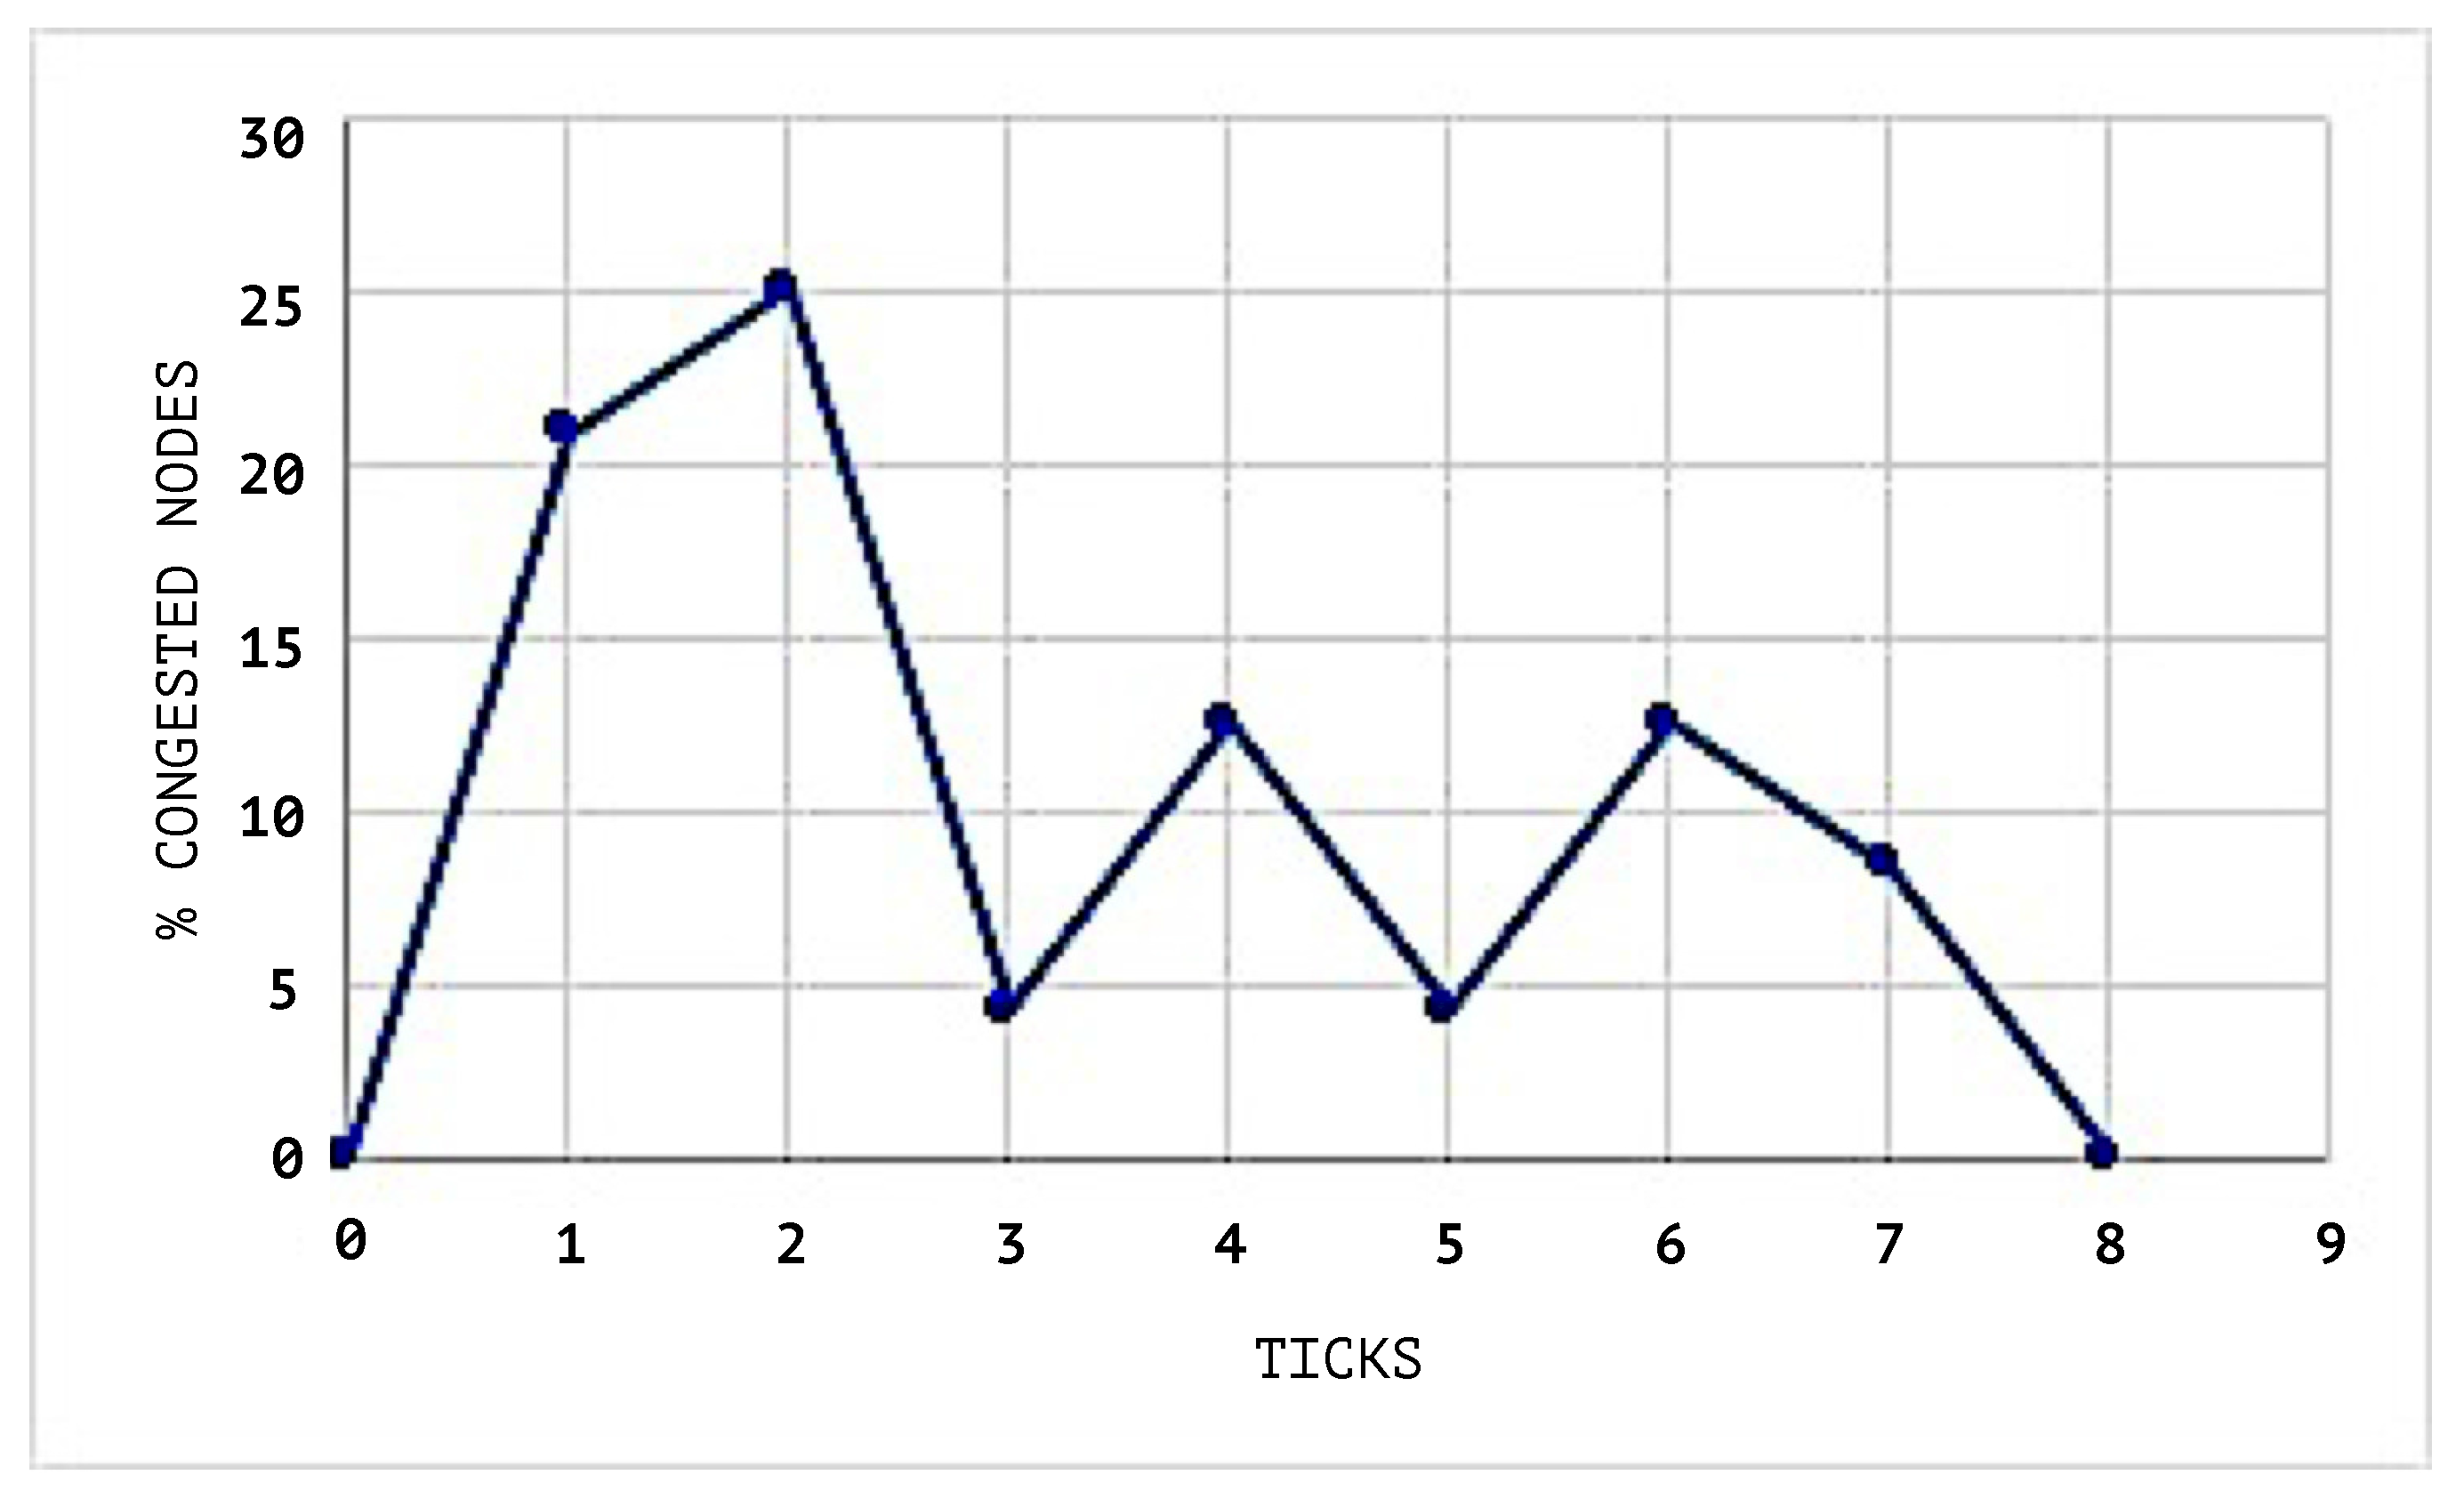
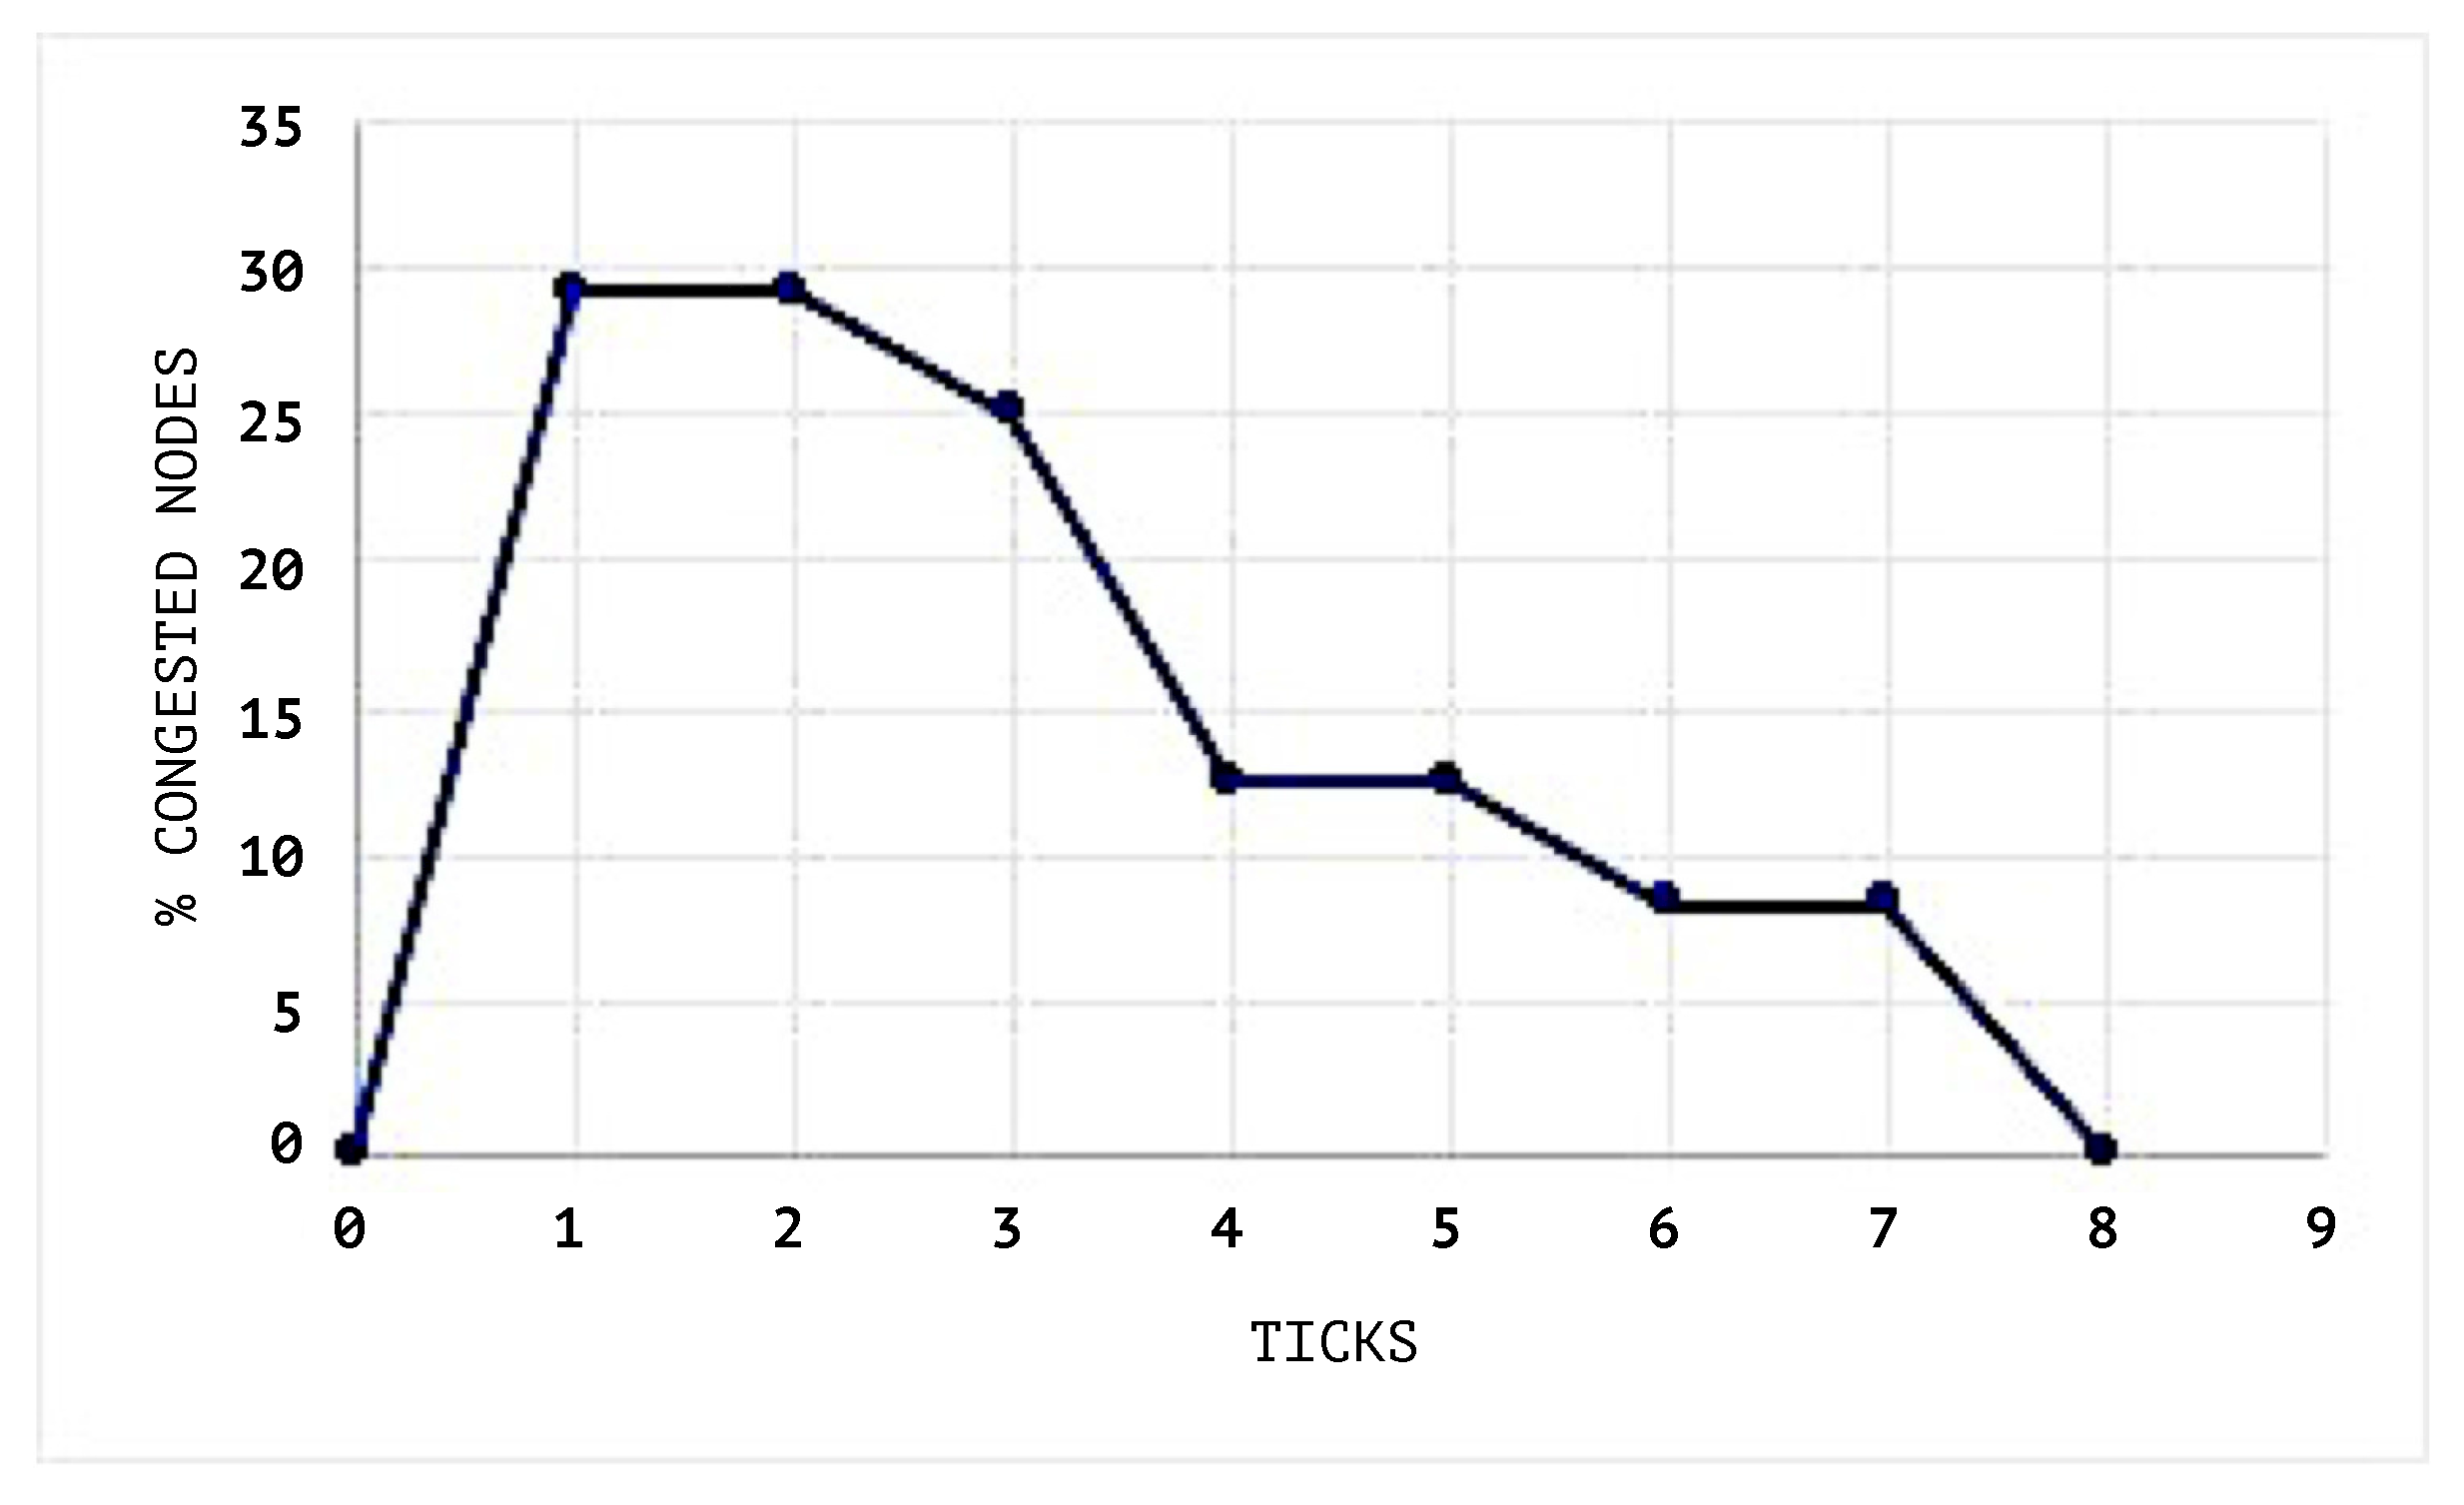
The network during the simulation maintains a maximum congestion limit of 30%. The congestion threshold of each node queue is set to 20%. This means that a value above this will change the status of the node to congested.
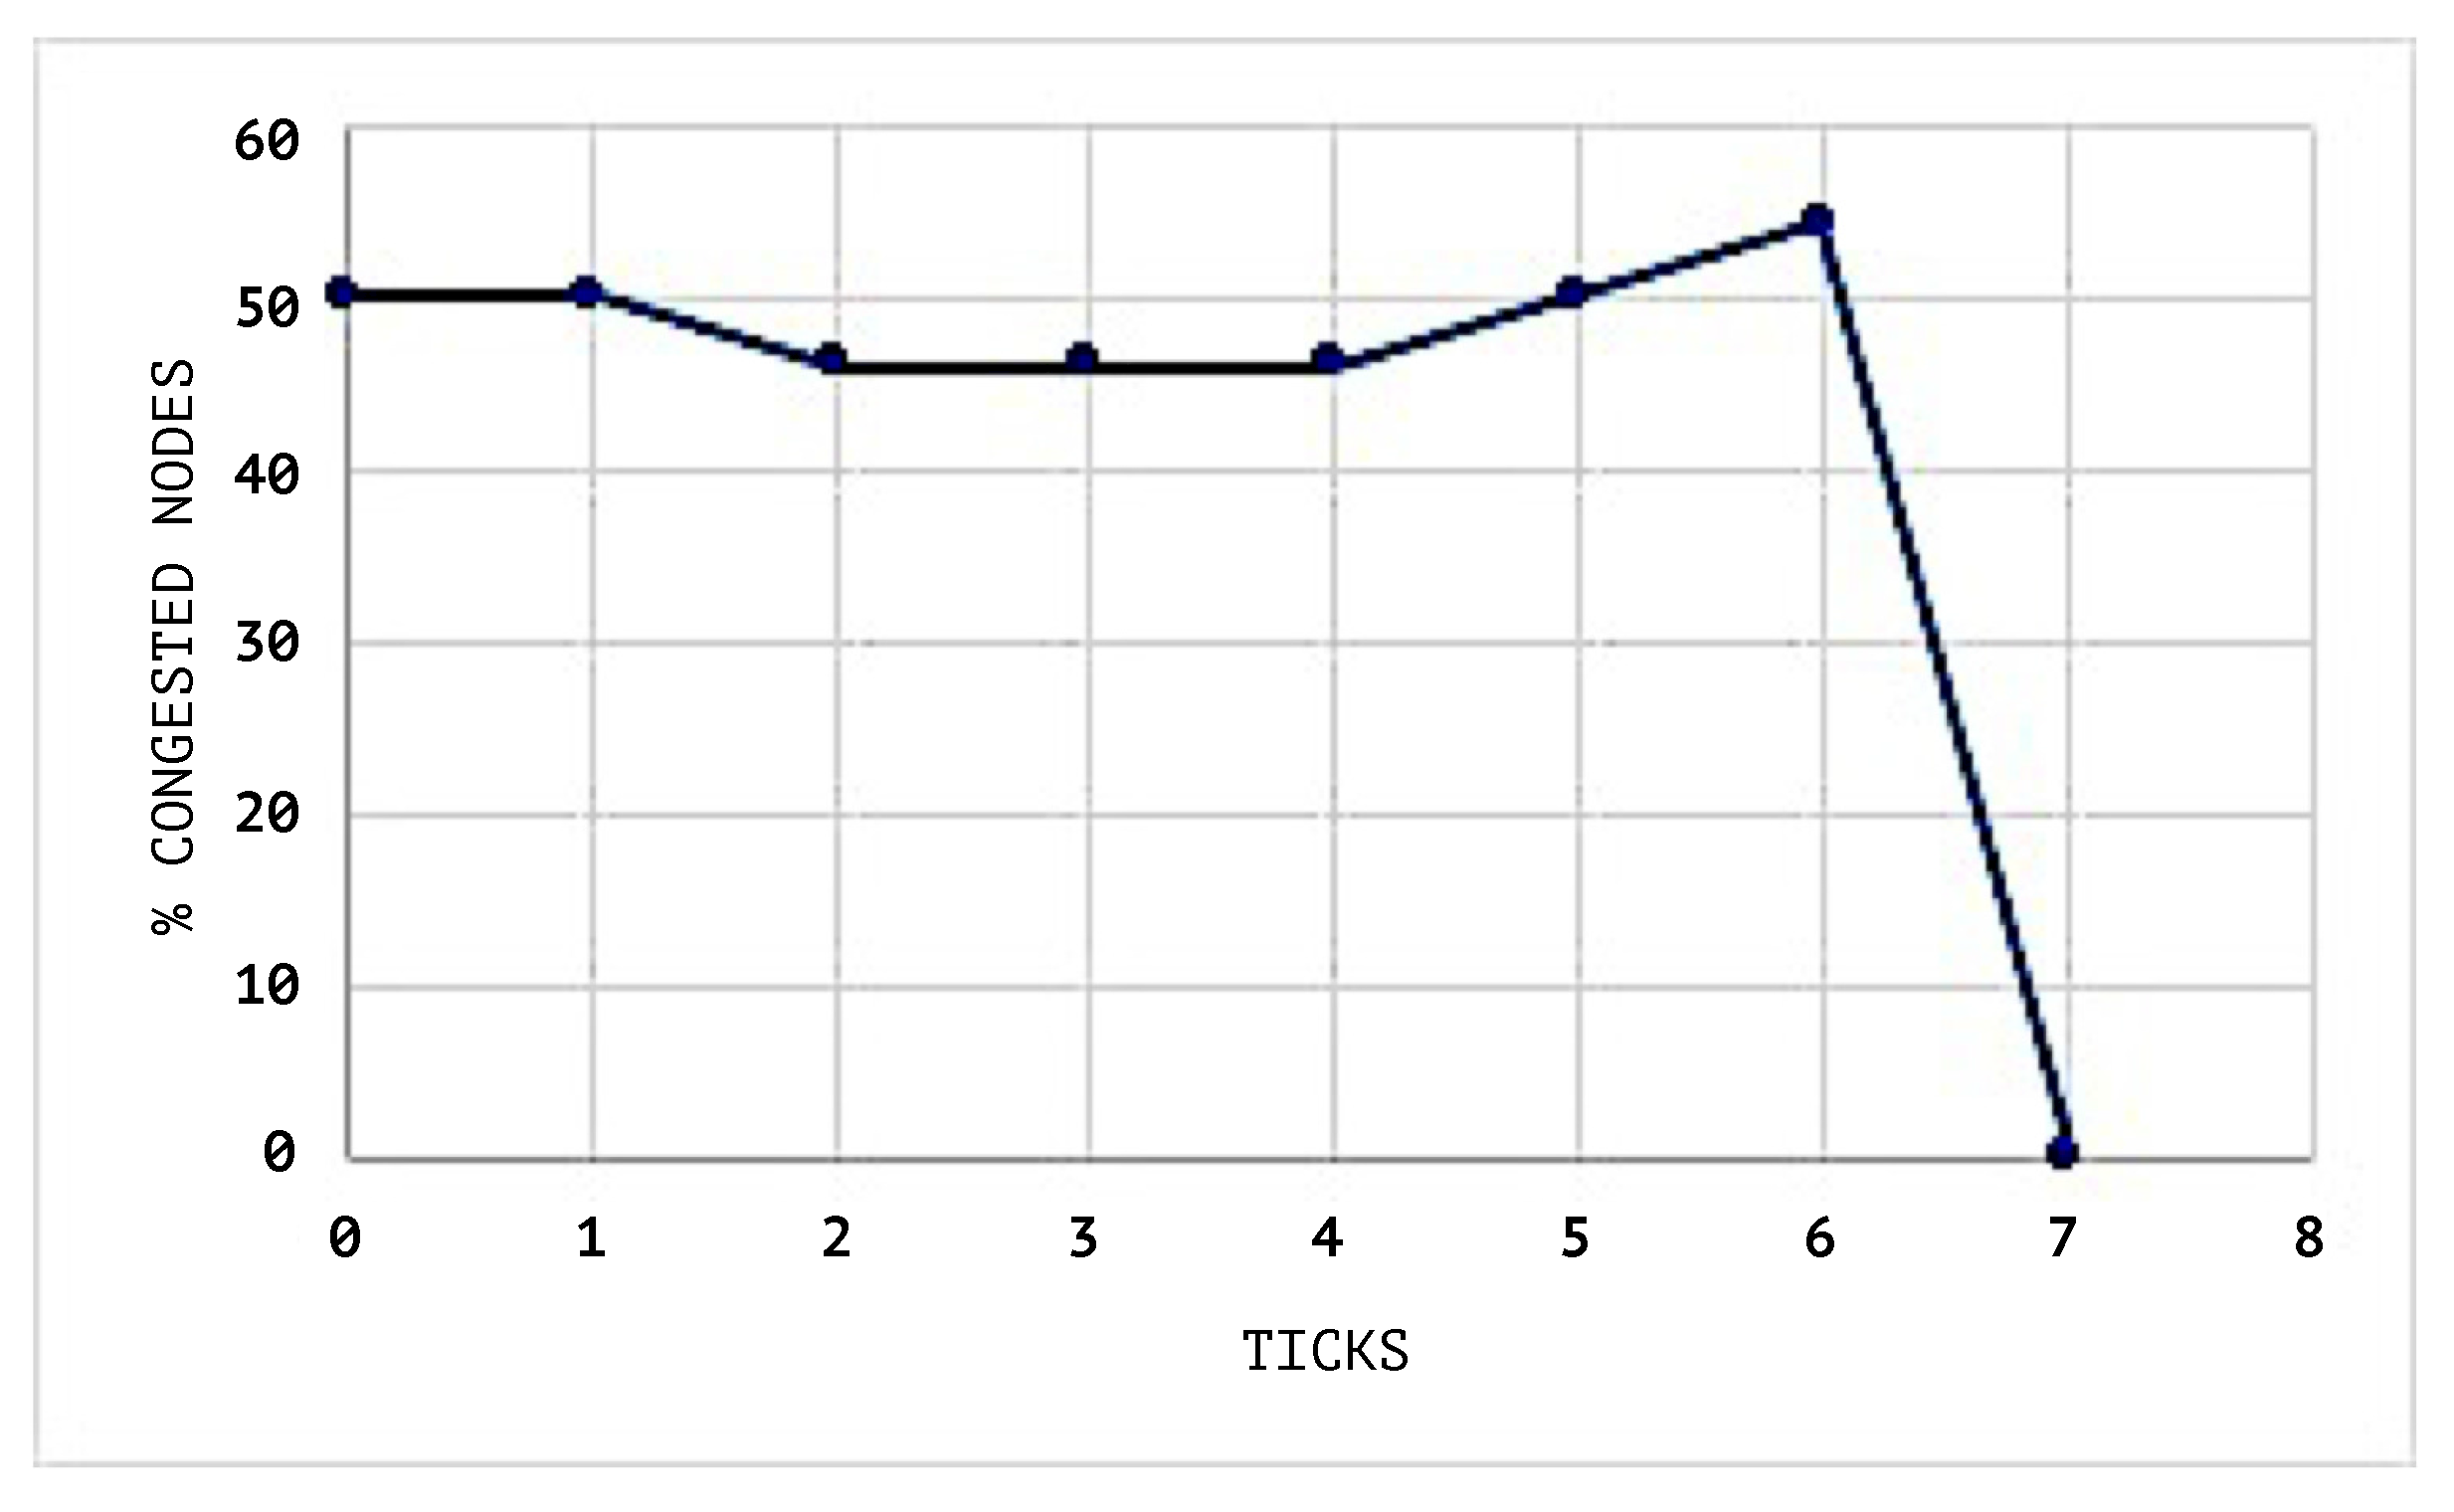
Figure 7 shows the congestion status of the network when the SEHA Algorithm 1 was applied and
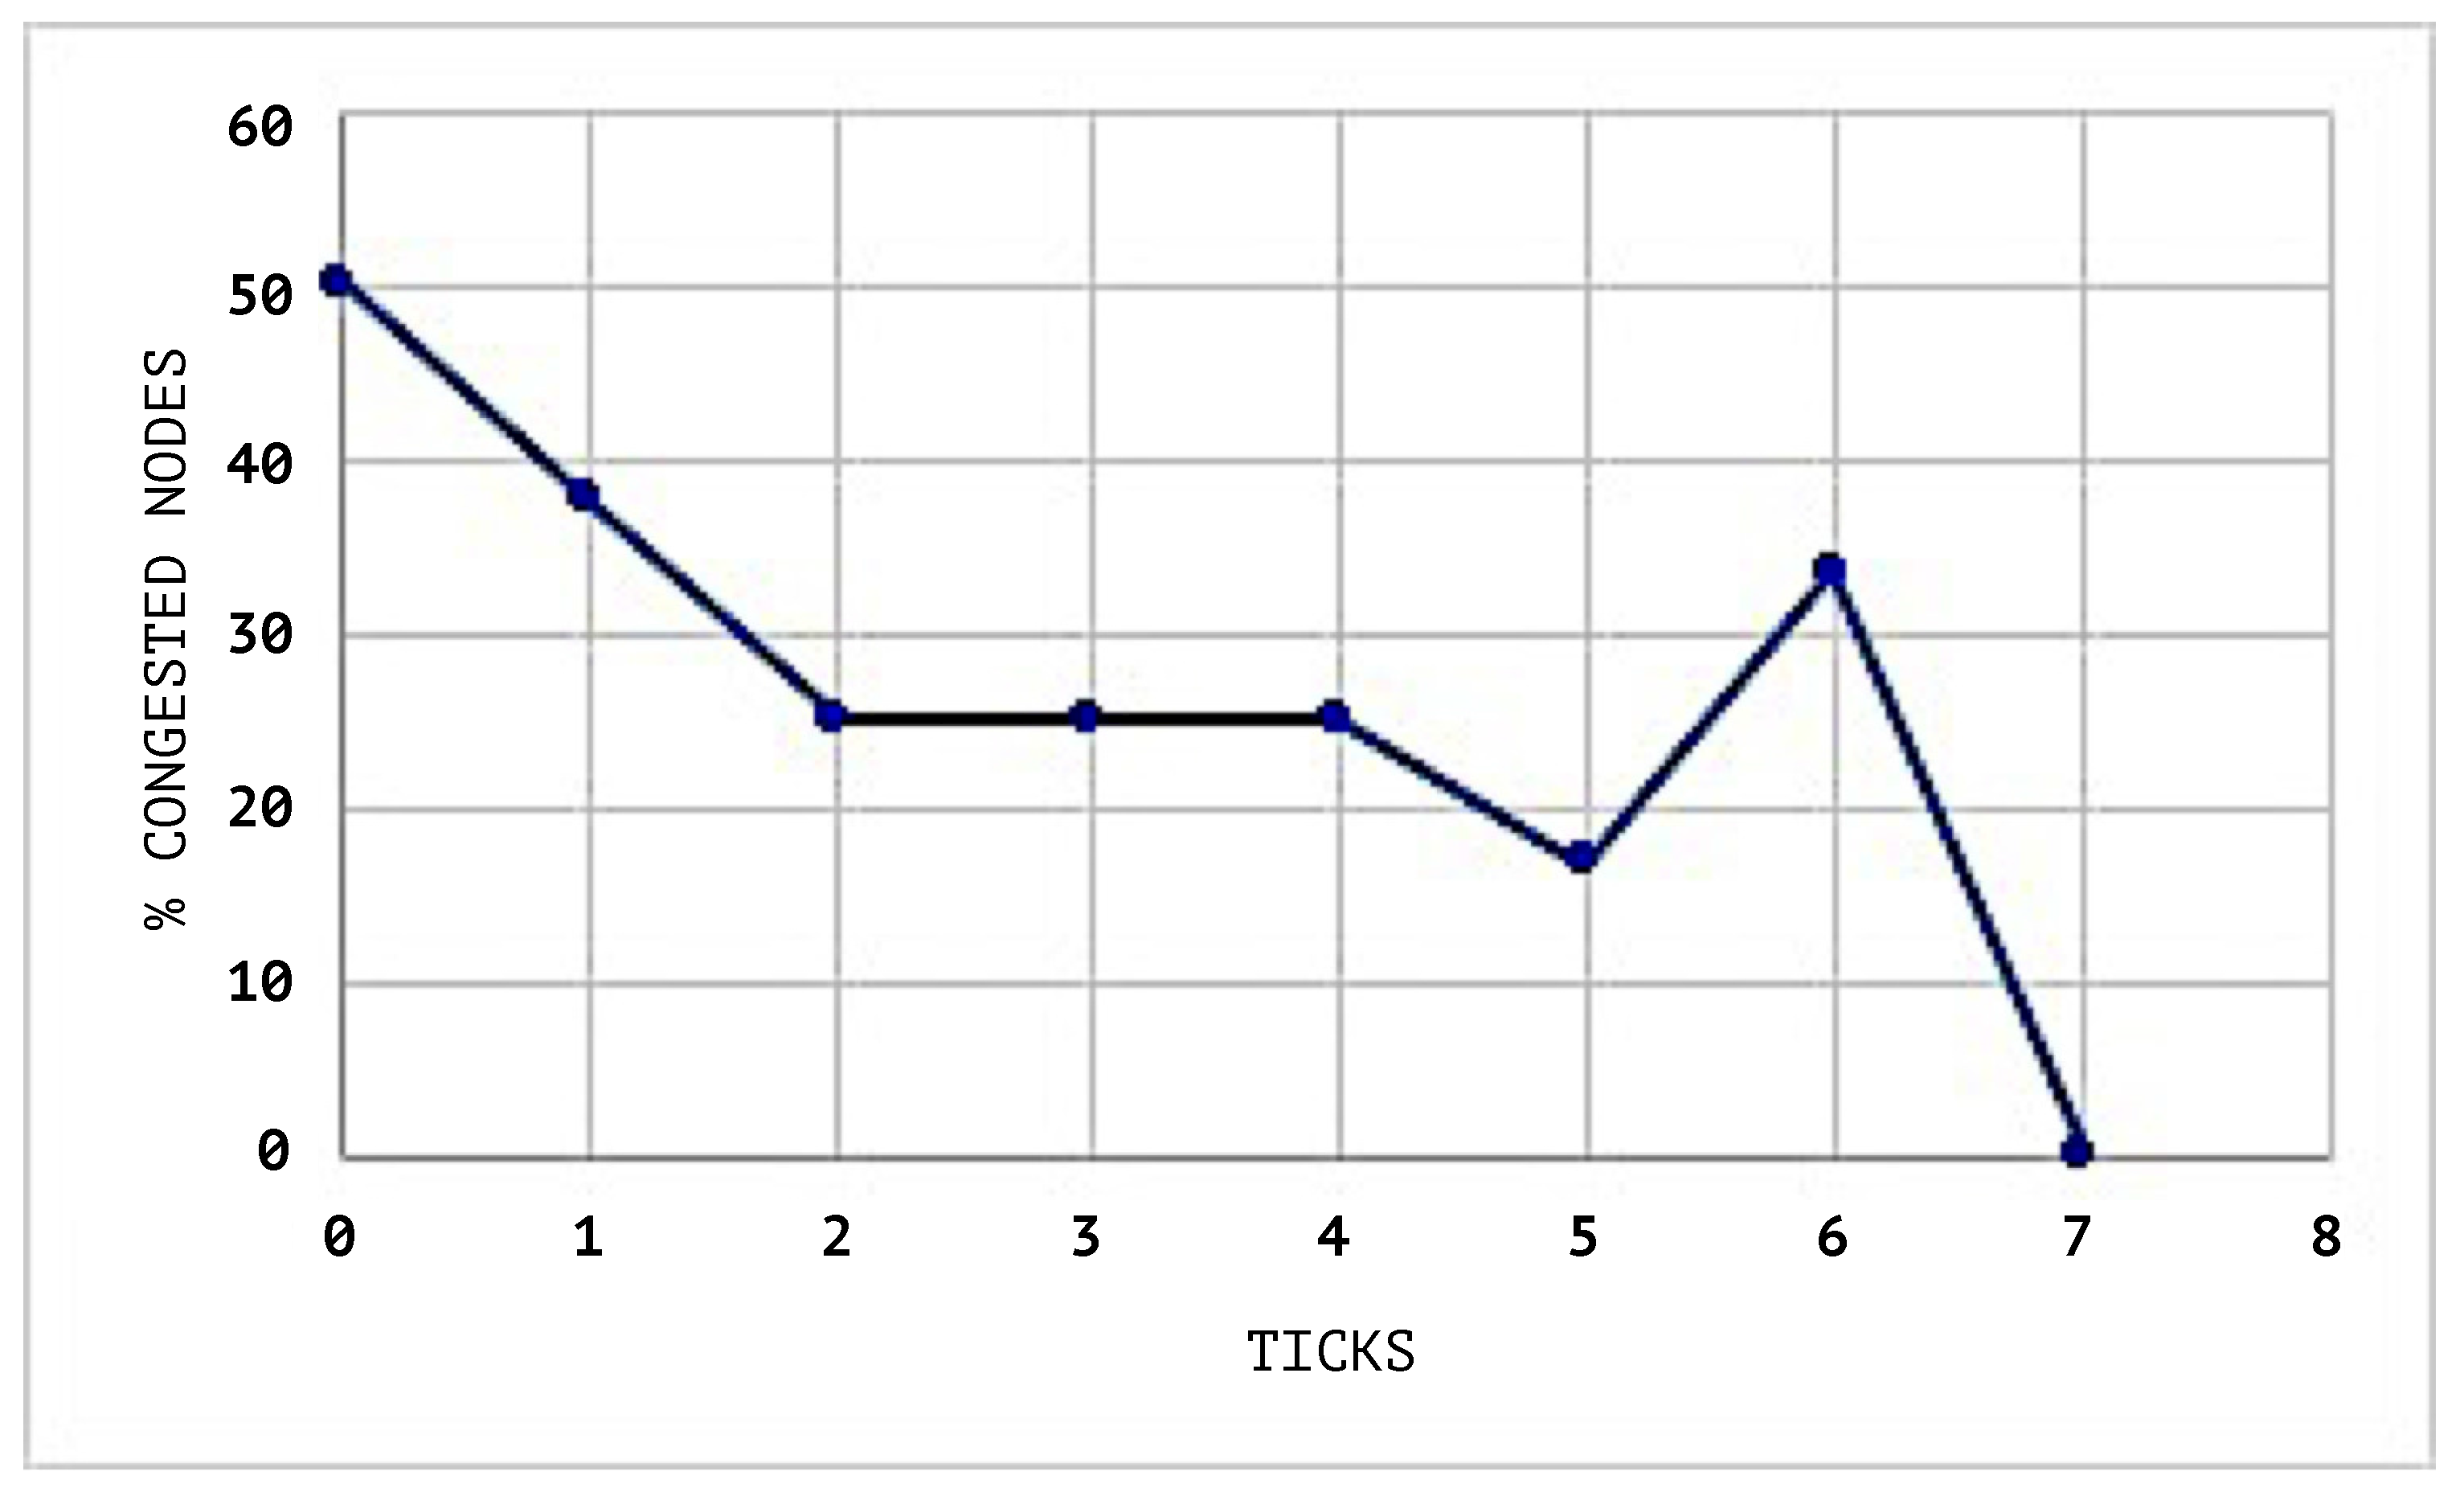
Figure 8 shows the congestion status of the network without using a SEHA Algorithm 1.
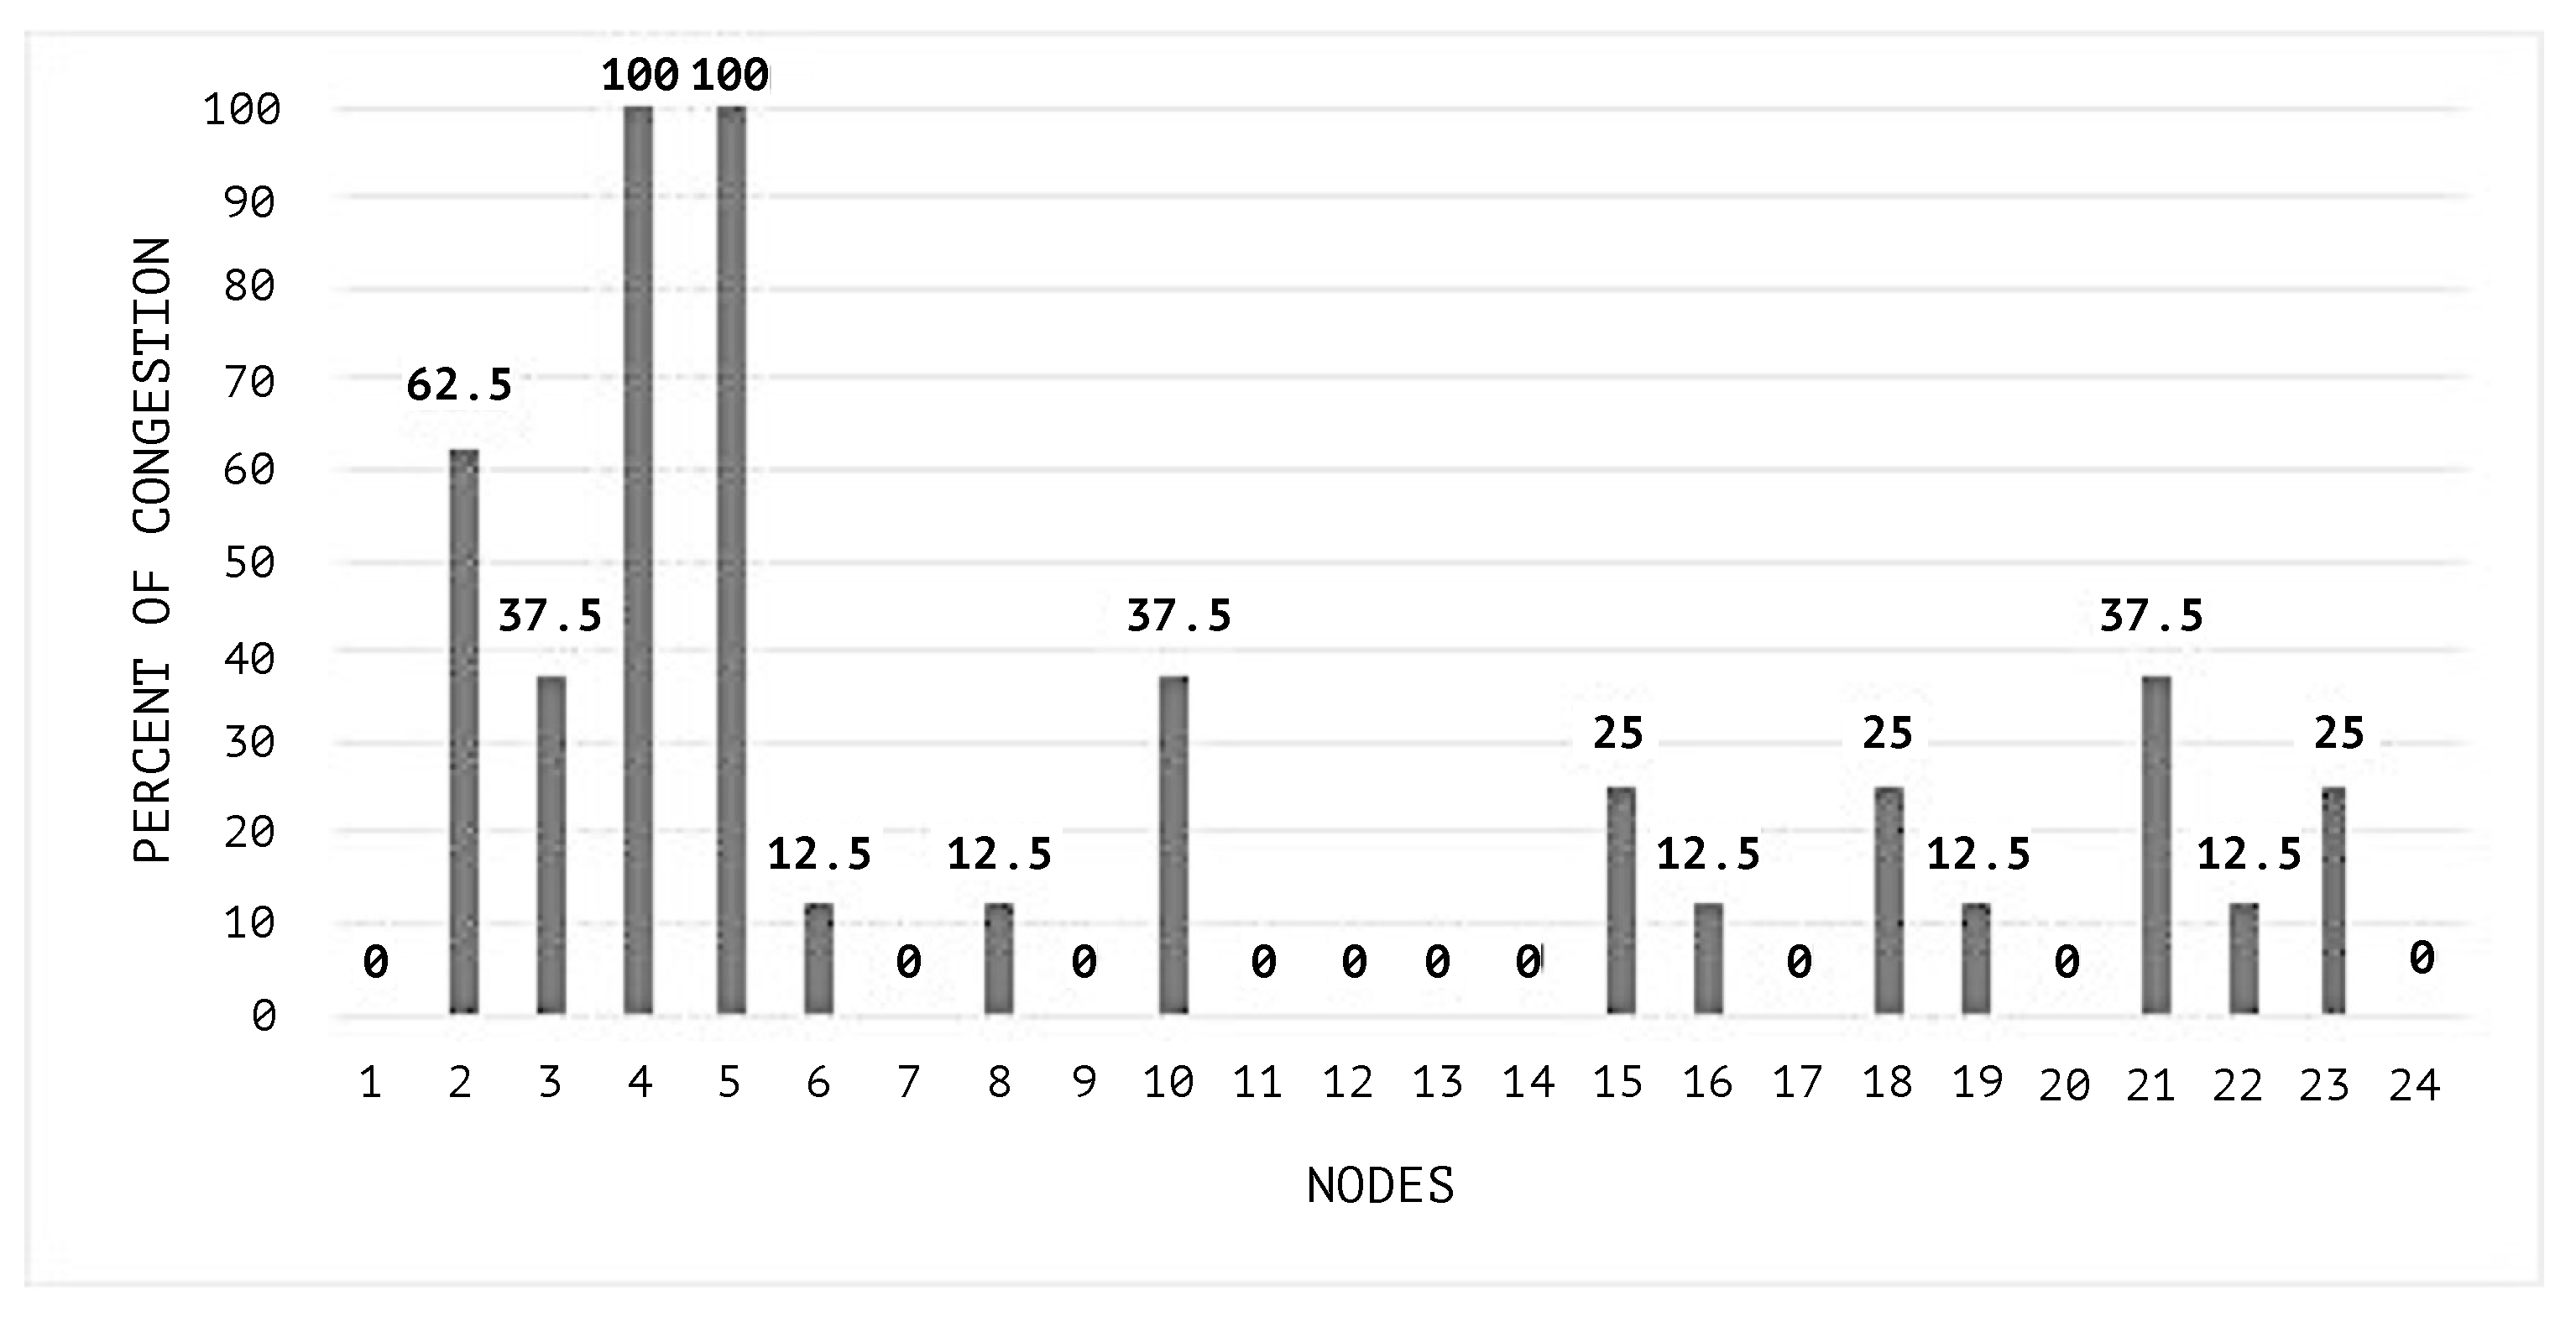
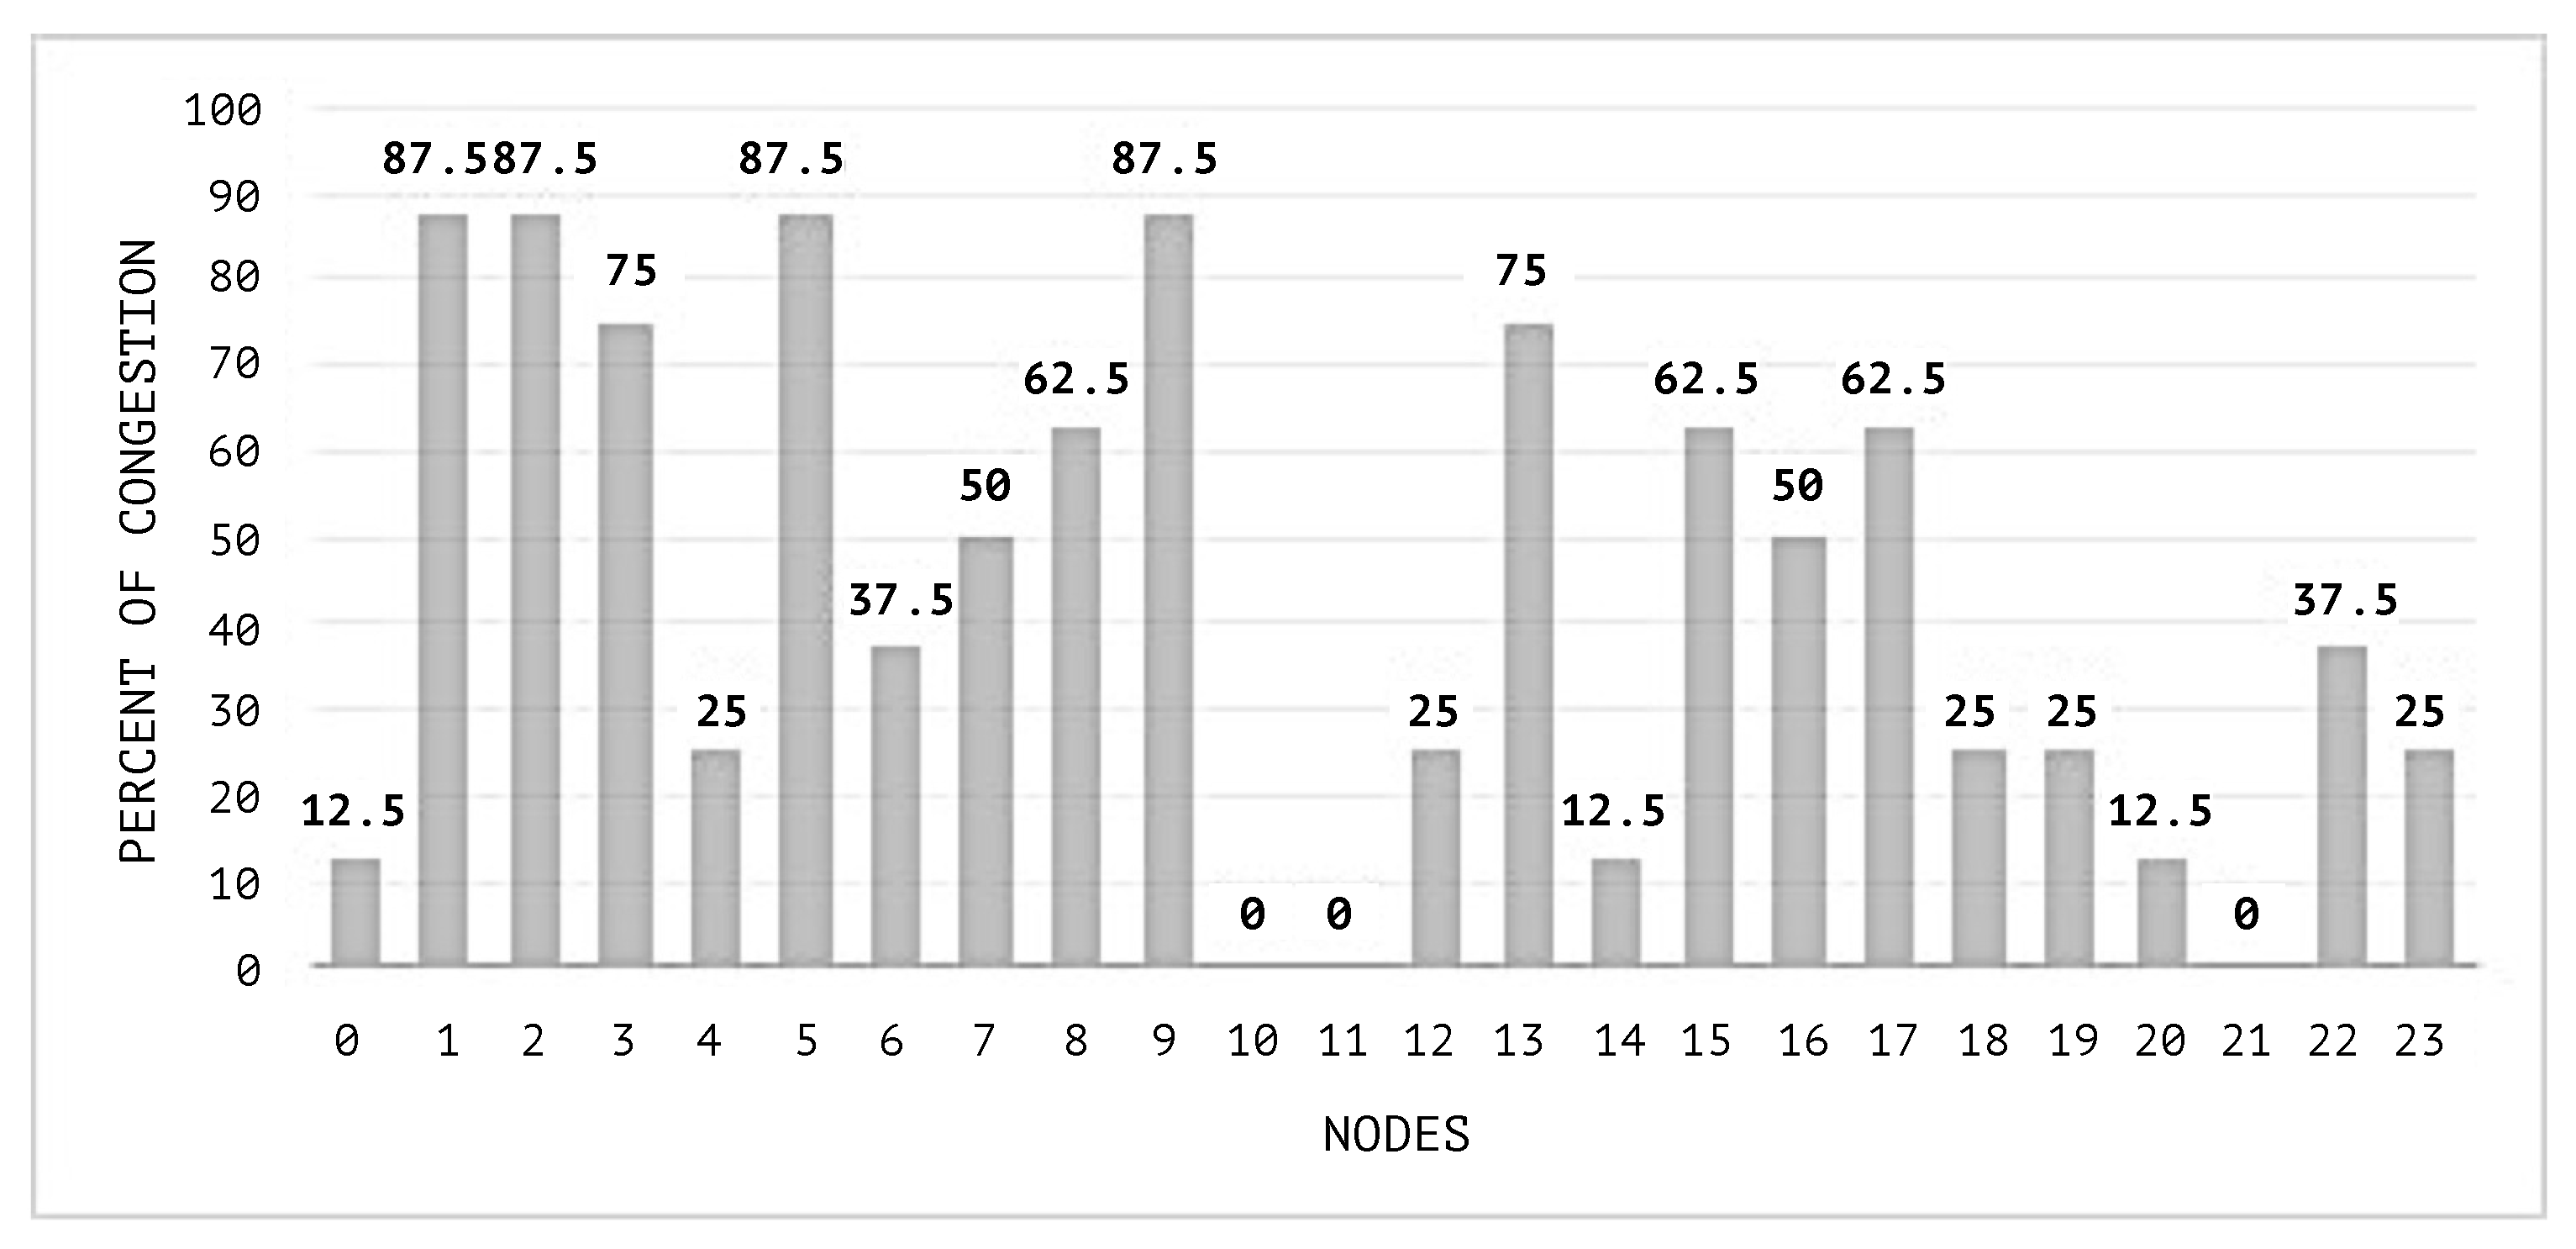
In
Figure 9 and
Figure 10, the congestion averages by node are shown, and it can be noticed that the congested nodes amount are higher than those in the scenarios where SEHA Algorithm 1 was applied.
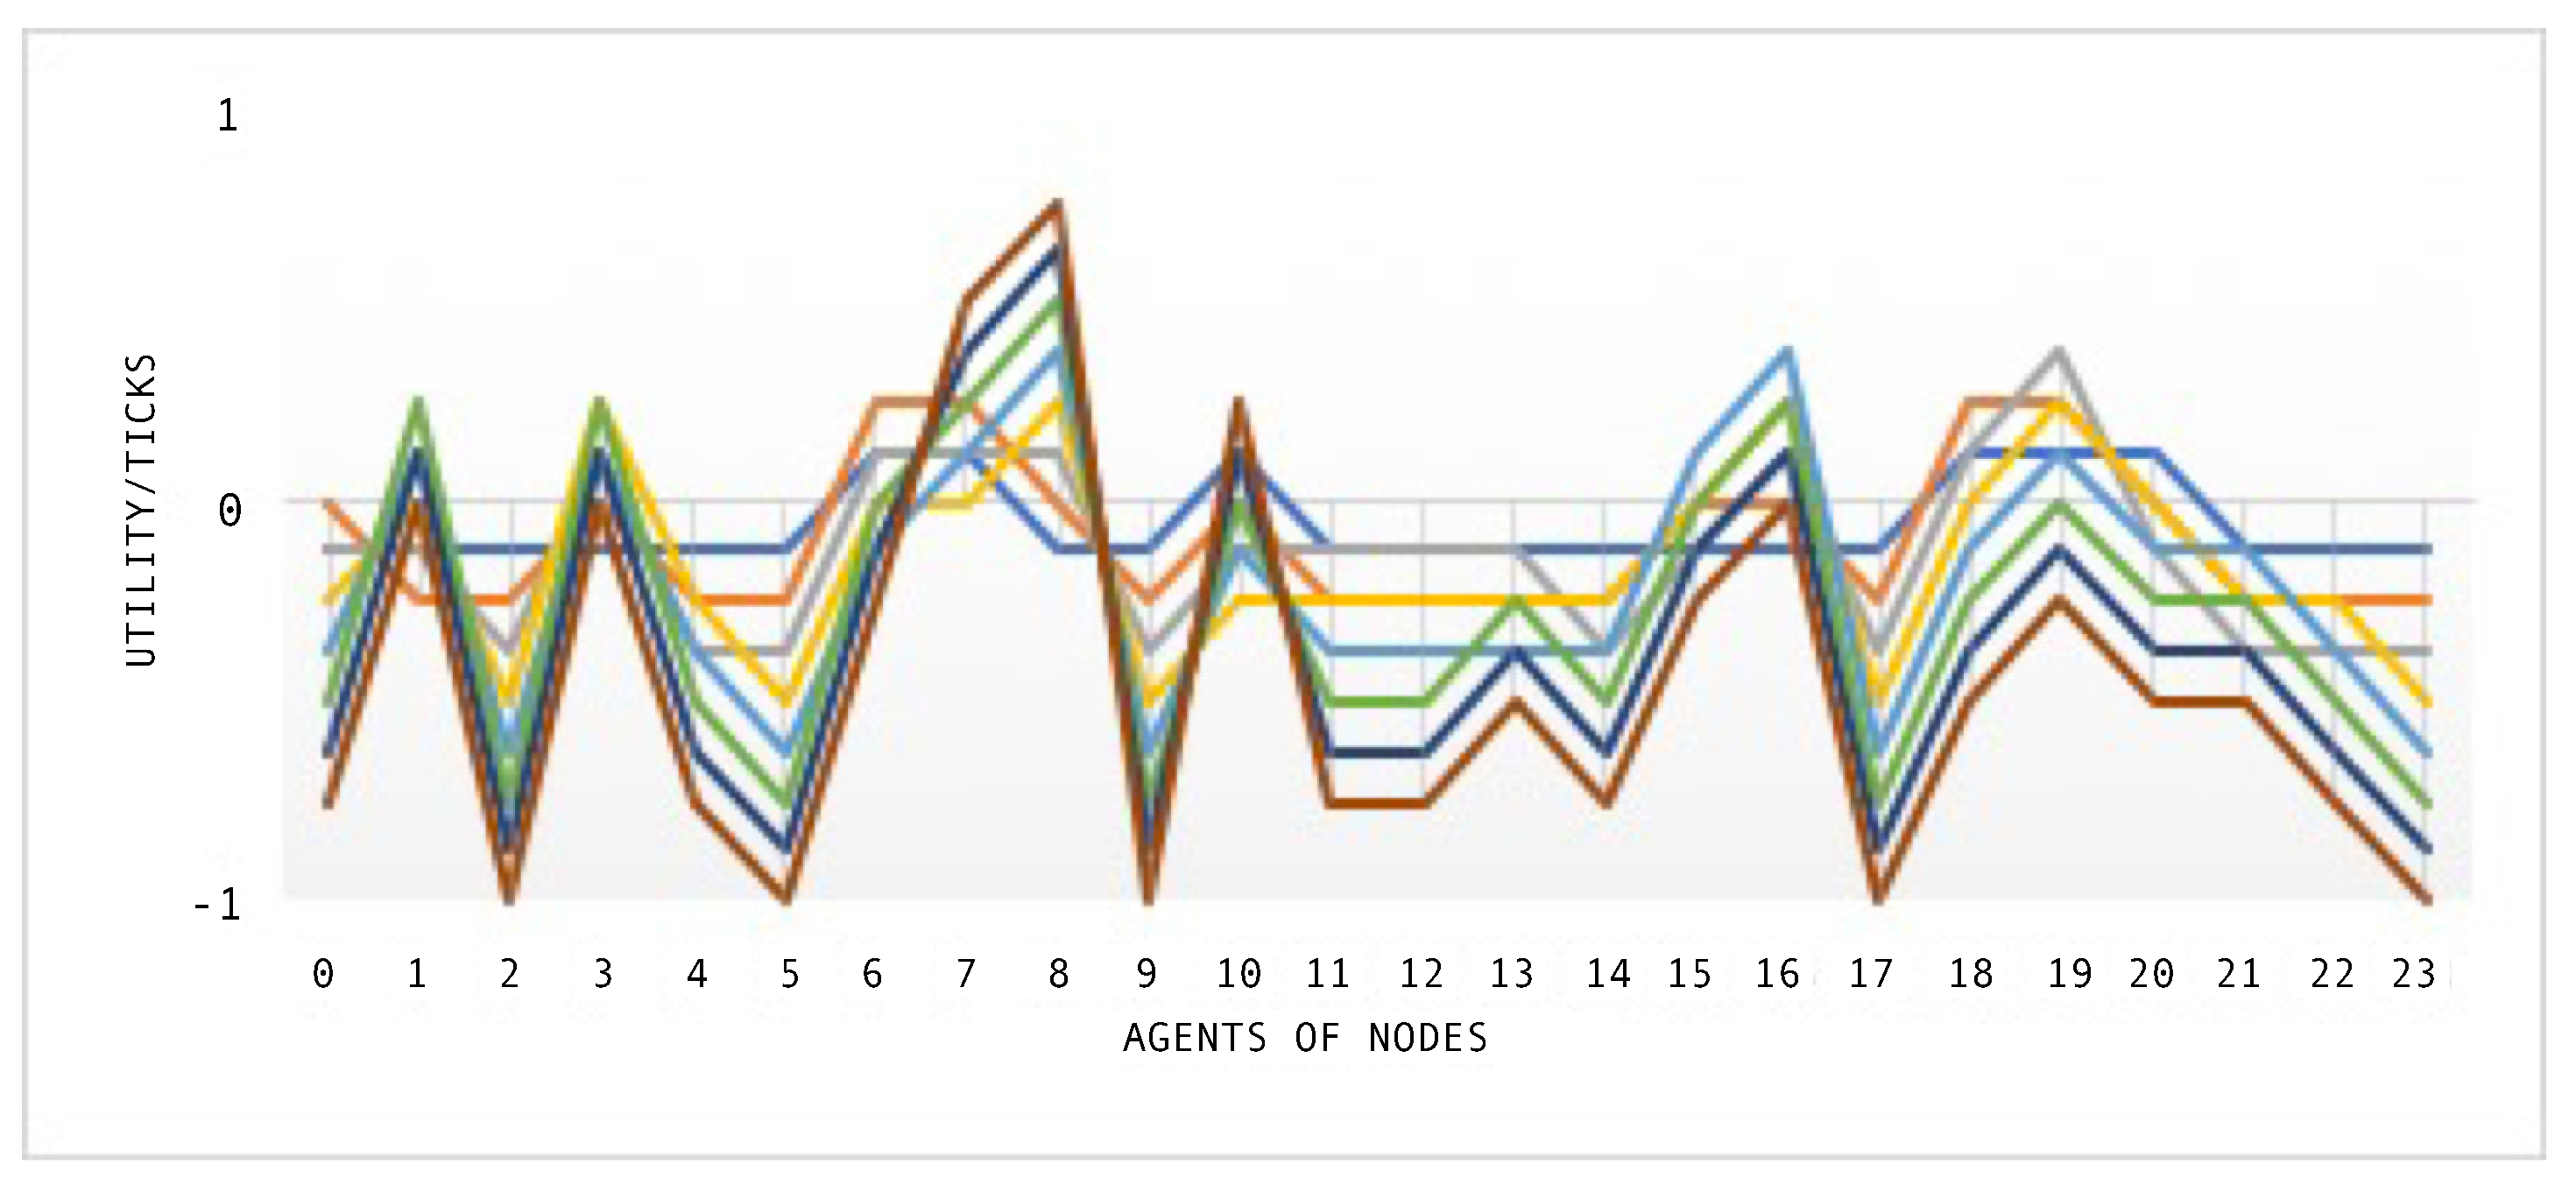
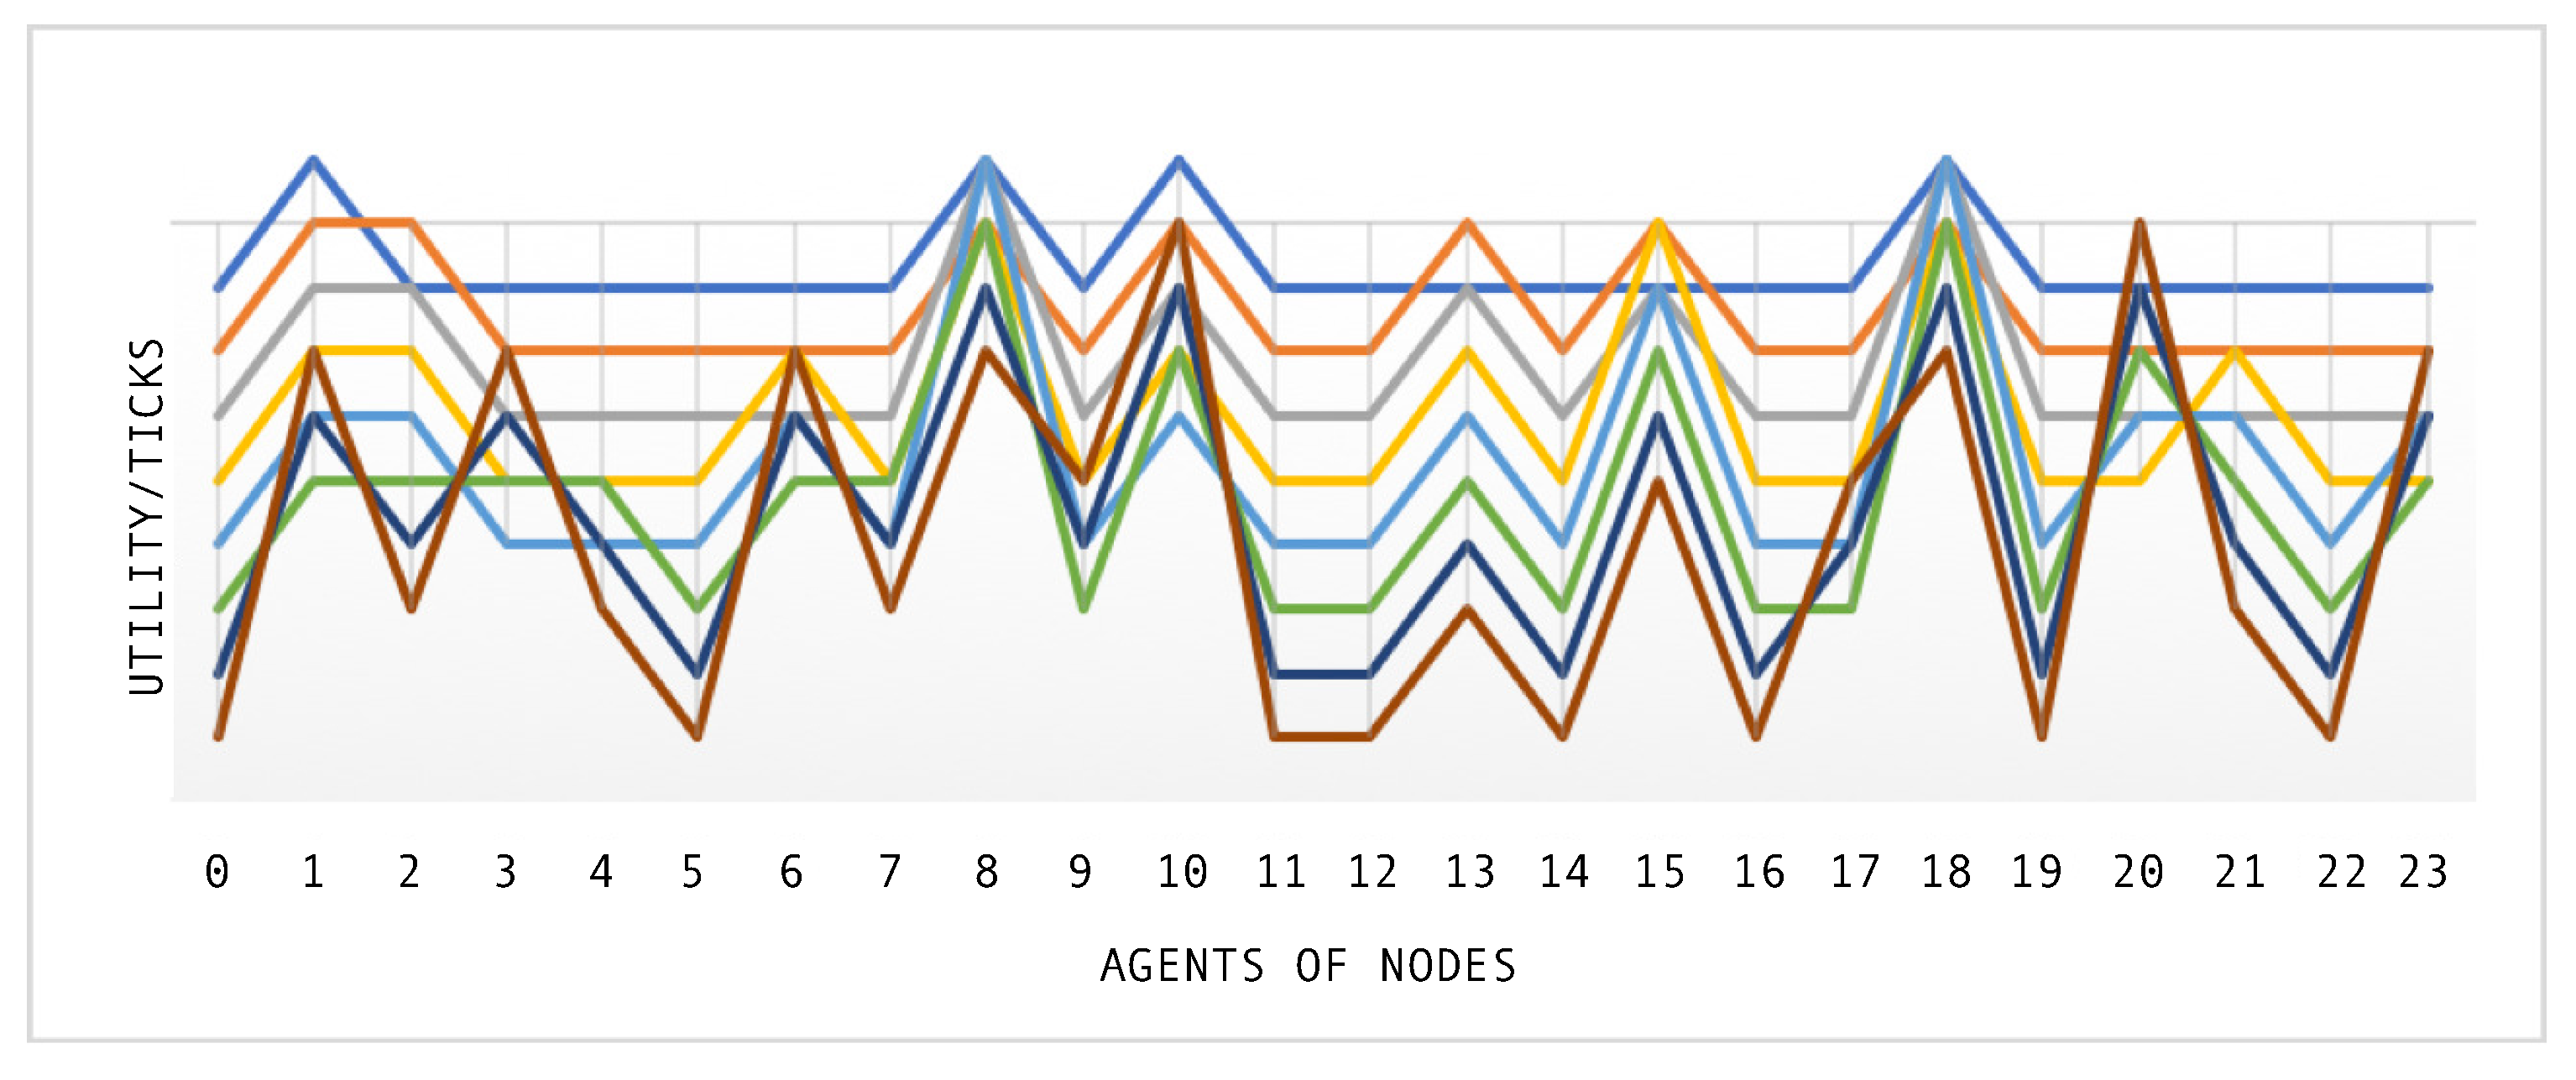
After each agent negotiates, they obtain a utility reward, and
Figure 11 shows the utility of all agents during the simulation time using the SEHA algorithm. During the simulation with a random flow distribution, the agents receive no utility. Both models complete the distribution of 42 flows through the network to its destination node at the eighth tick.
5.3. Simulation Using Topology with Degree Distribution
The following simulation was configured with different topology, using the degree of six as a parameter to generate it.
Figure 12 shows the view of the network in the simulator.
Figure 13 shows the complex metrics of degree, centrality and a classification of nodes in hubs or no hubs obtained by the model when the simulation was initialized.
The results obtained by the second simulation are illustrated in
Figure 14 and
Figure 15. Compared with the results shown in
Figure 14, the higher congested status of the network was less than 26% using the SEHA Algorithm 1.
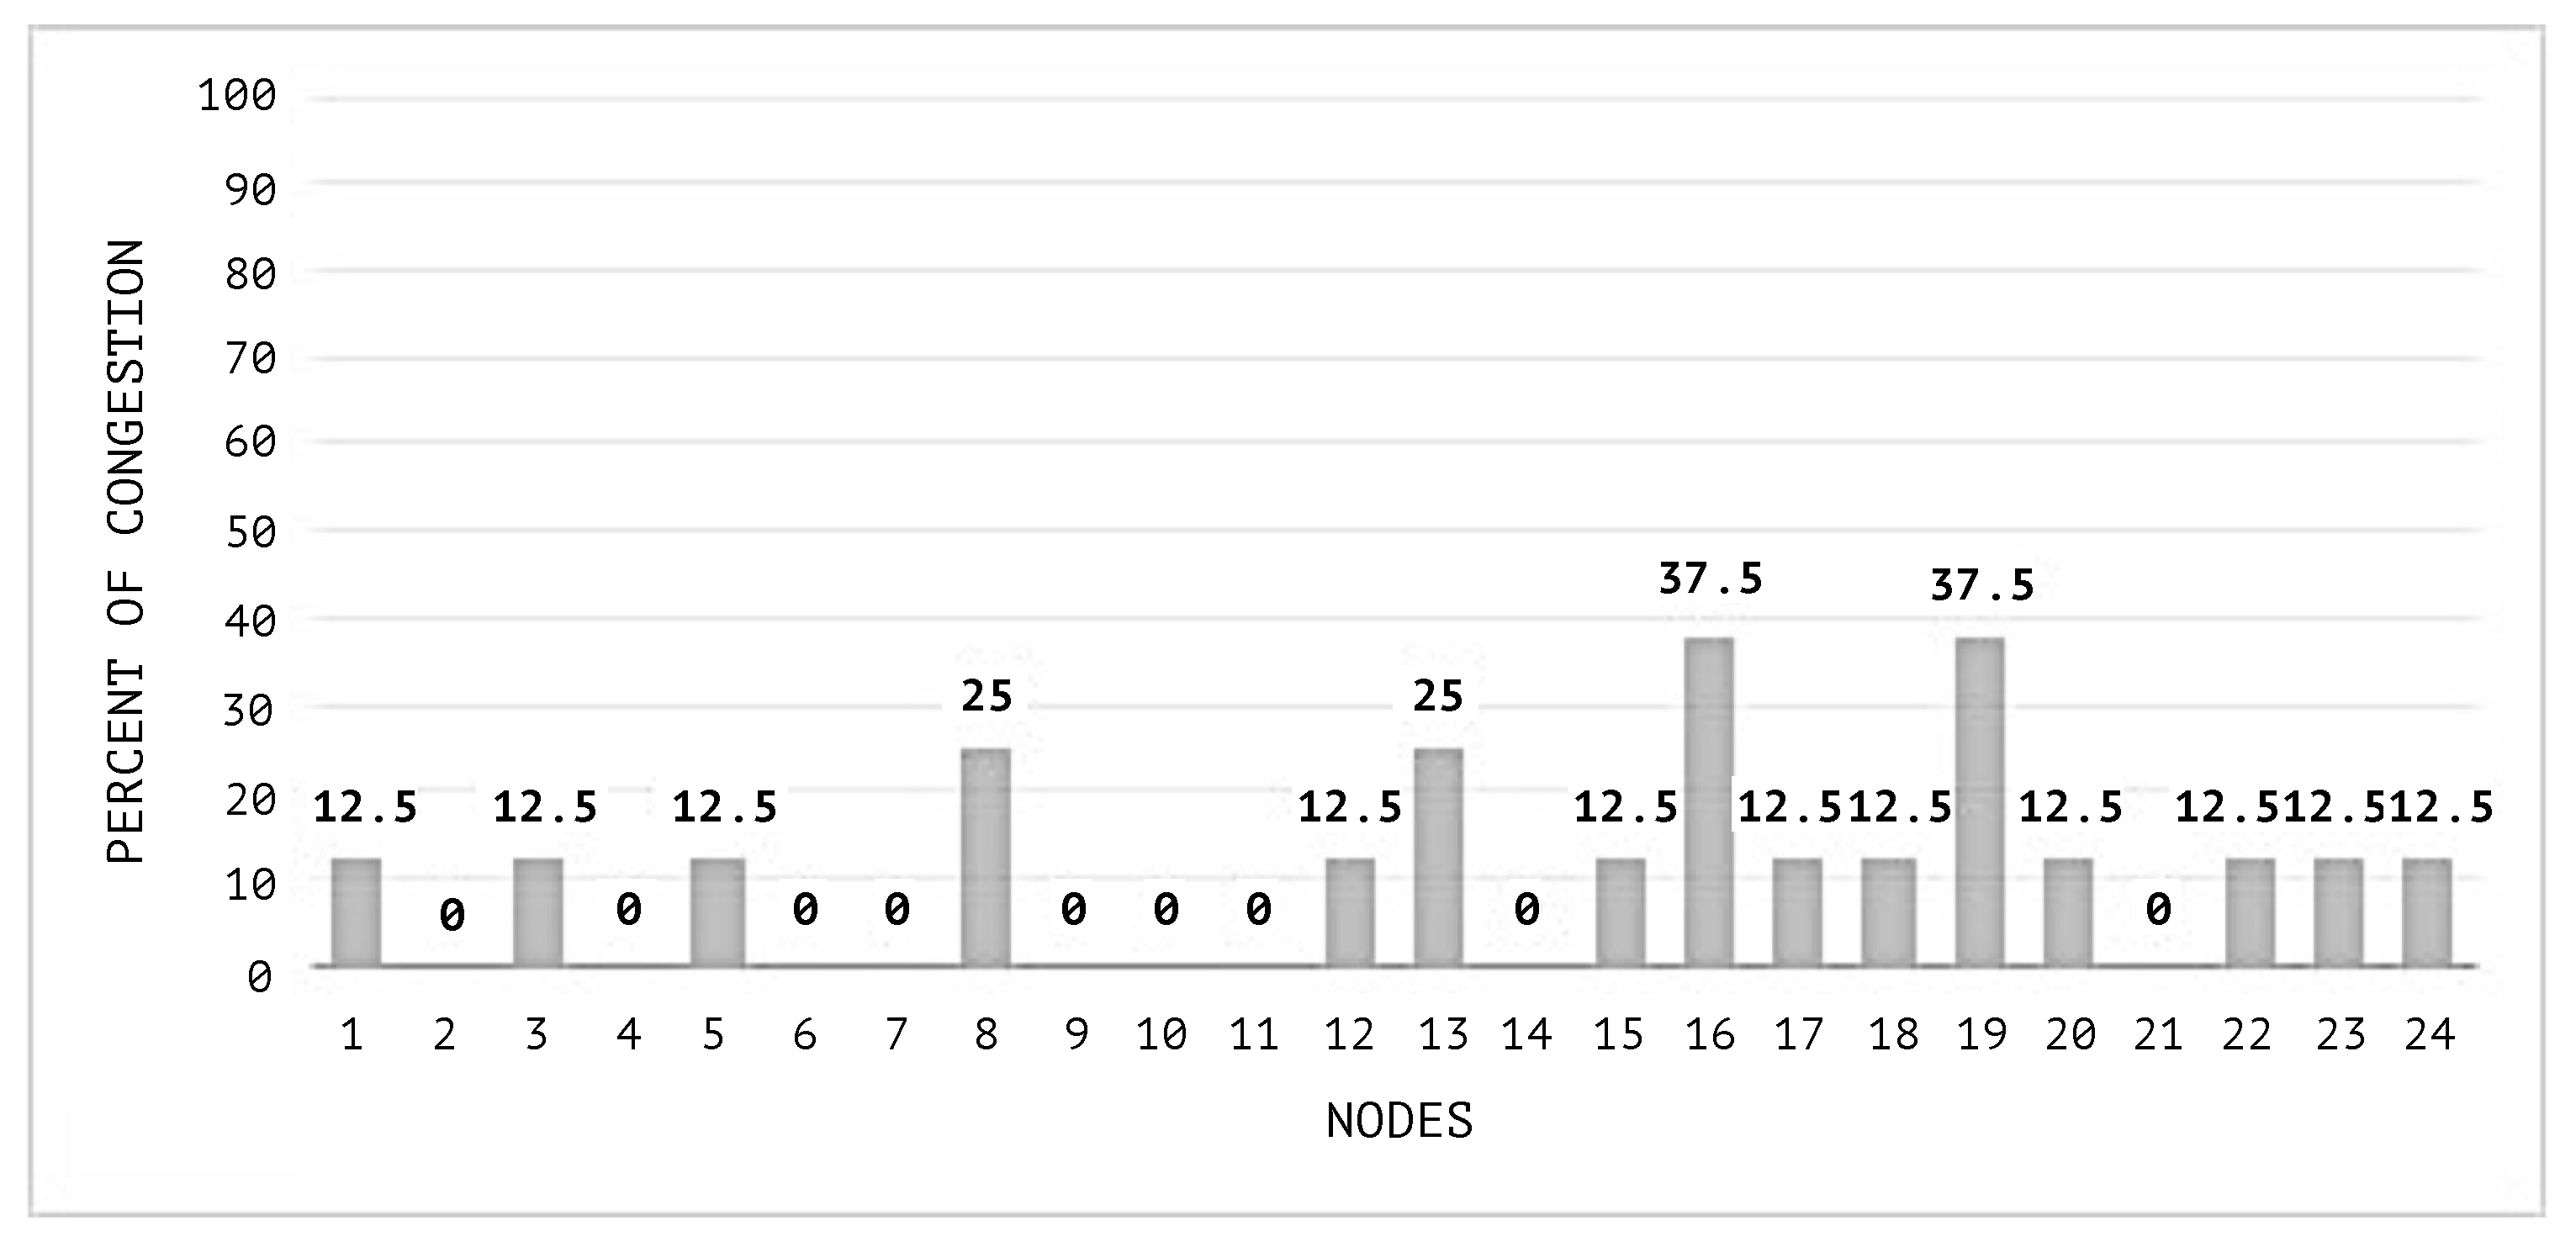
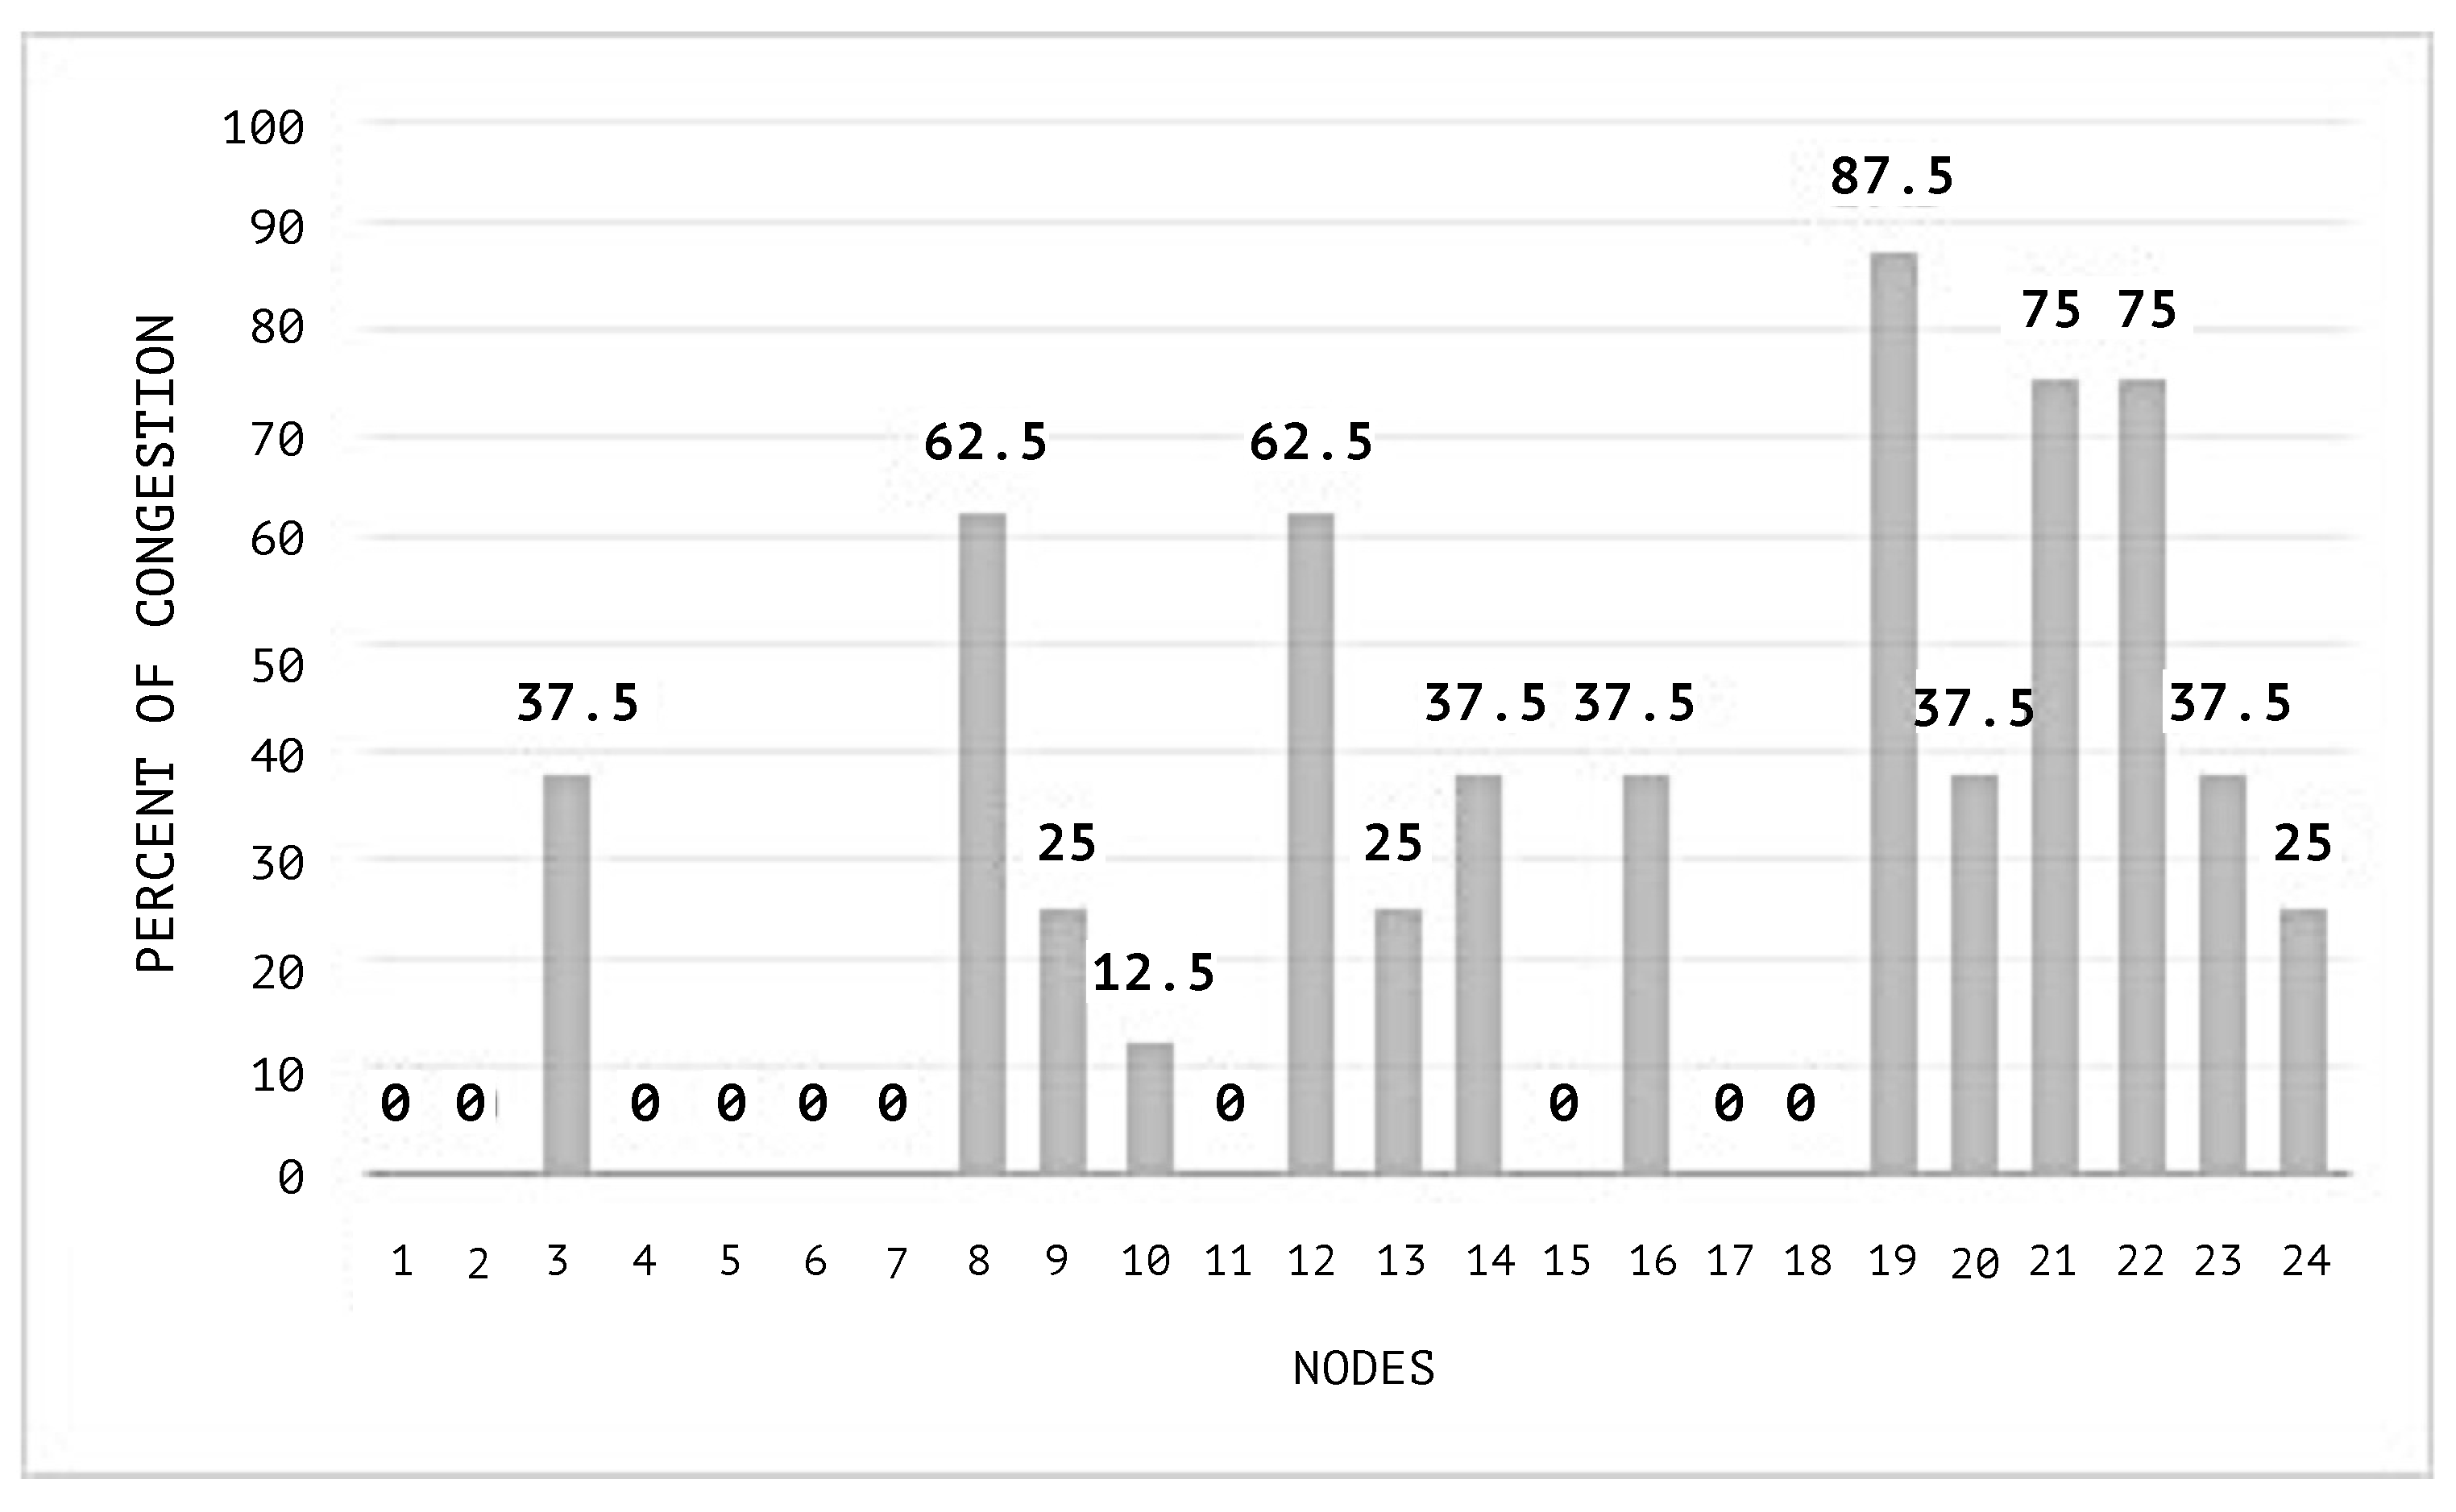
Detailed information of the congestion average by node during both simulations is shown in
Figure 16 and
Figure 17.
According to the illustrations in
Figure 16 and
Figure 17, the impact of congestion on the nodes of the network is lower using the SEHA (Social Election with Hidden Authorities Algorithm) than when a random distribution is used.
Finally, in
Figure 18, the utilities of agents during the simulation are shown. The utilities obtained by the agents represent the most visited nodes when a congestion emerges using the SEHA Algorithm. Random distribution does not obtain utilities because there is no negotiation between agents to determine the new hop of the flow. For better description of the result values, see
Table A4 in
Appendix A.
5.4. Comparison of Results
In
Table 2, the outcome of 600 simulations are shown. The scenarios that were used for these simulations were obtained by means of the link cost variation and a random initial distribution of the flows. The comparison was made between the scenarios where the SEHA (Social Election with Hidden Authorities Algorithm) was applied, in contrast with those in which the flows distribution was performed in a random manner.
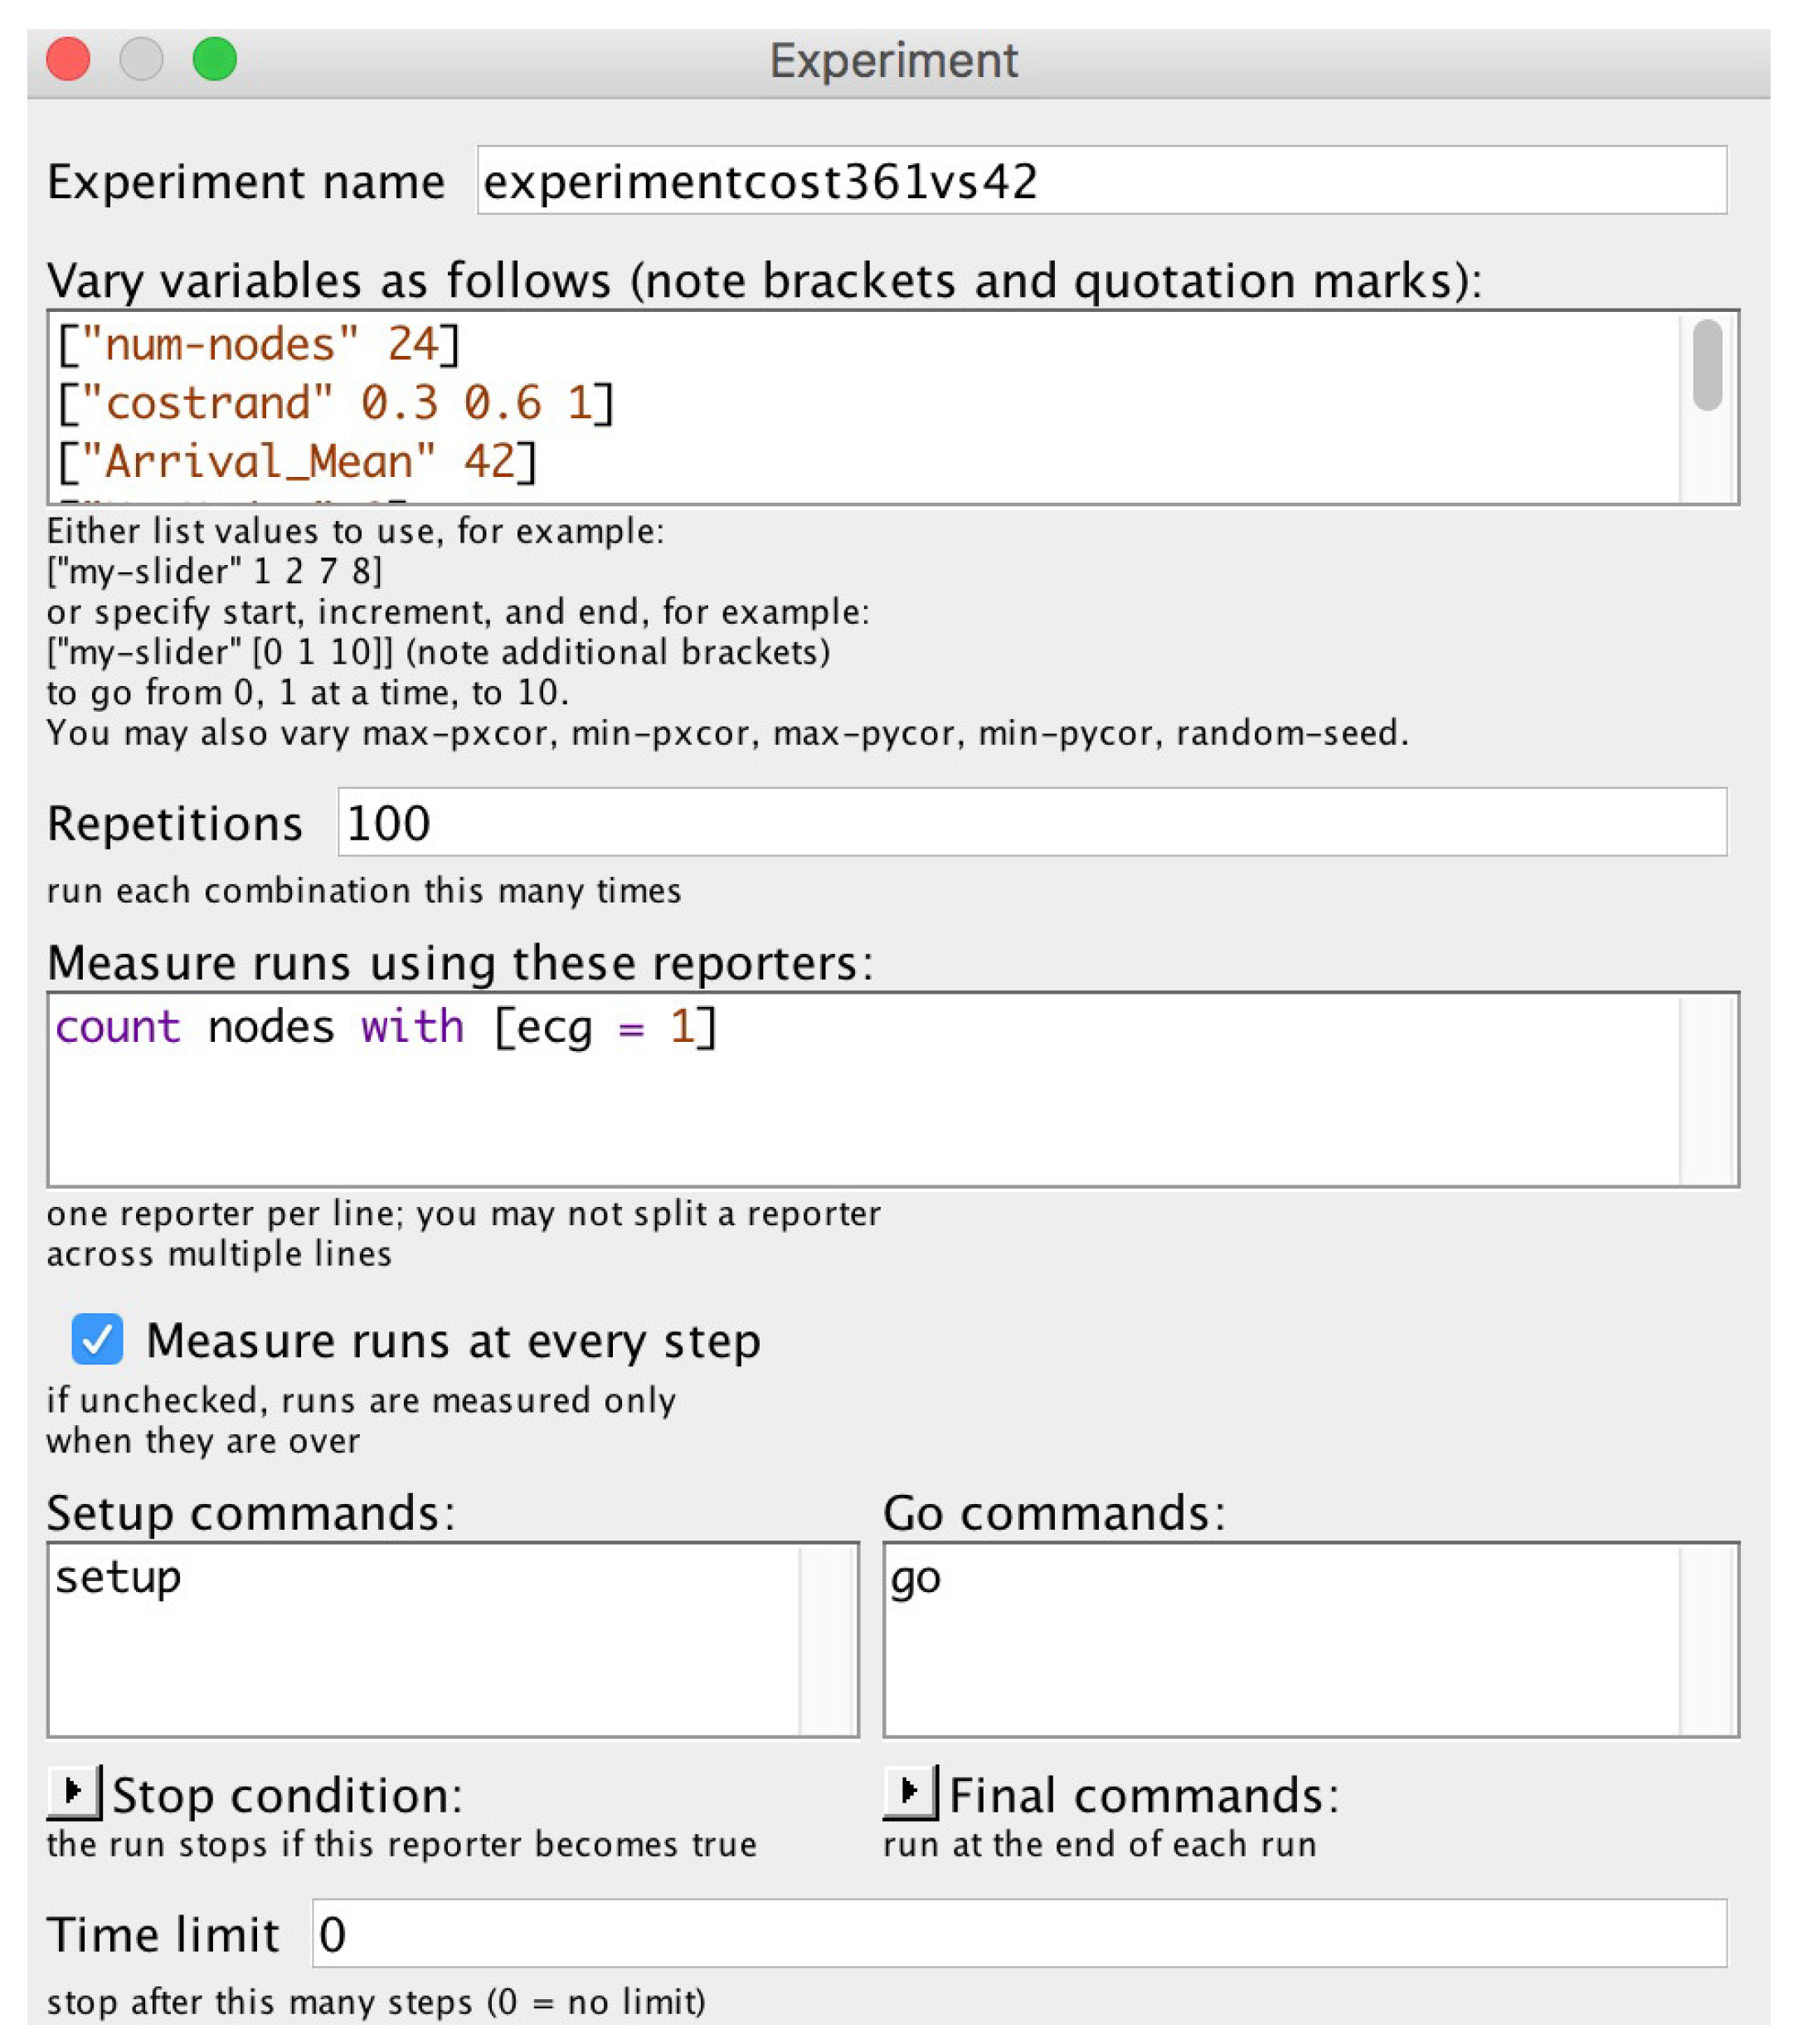
As described 300 additional simulations were generated to verify the behavior of the SEHA (Social Election with Hidden Authorities Algorithm), varying the topology, node preferences and link costs. In addition, 300 simulations were generated by configuring BehaviorSpace following the same procedure, but the flow distribution was performed in a random manner, instead of using the SEHA (Social Election with Hidden Authorities Algorithm). The outcome using NetLogo Behavior Space with the initial values specified in
Figure 19 is illustrated in
Table 2.
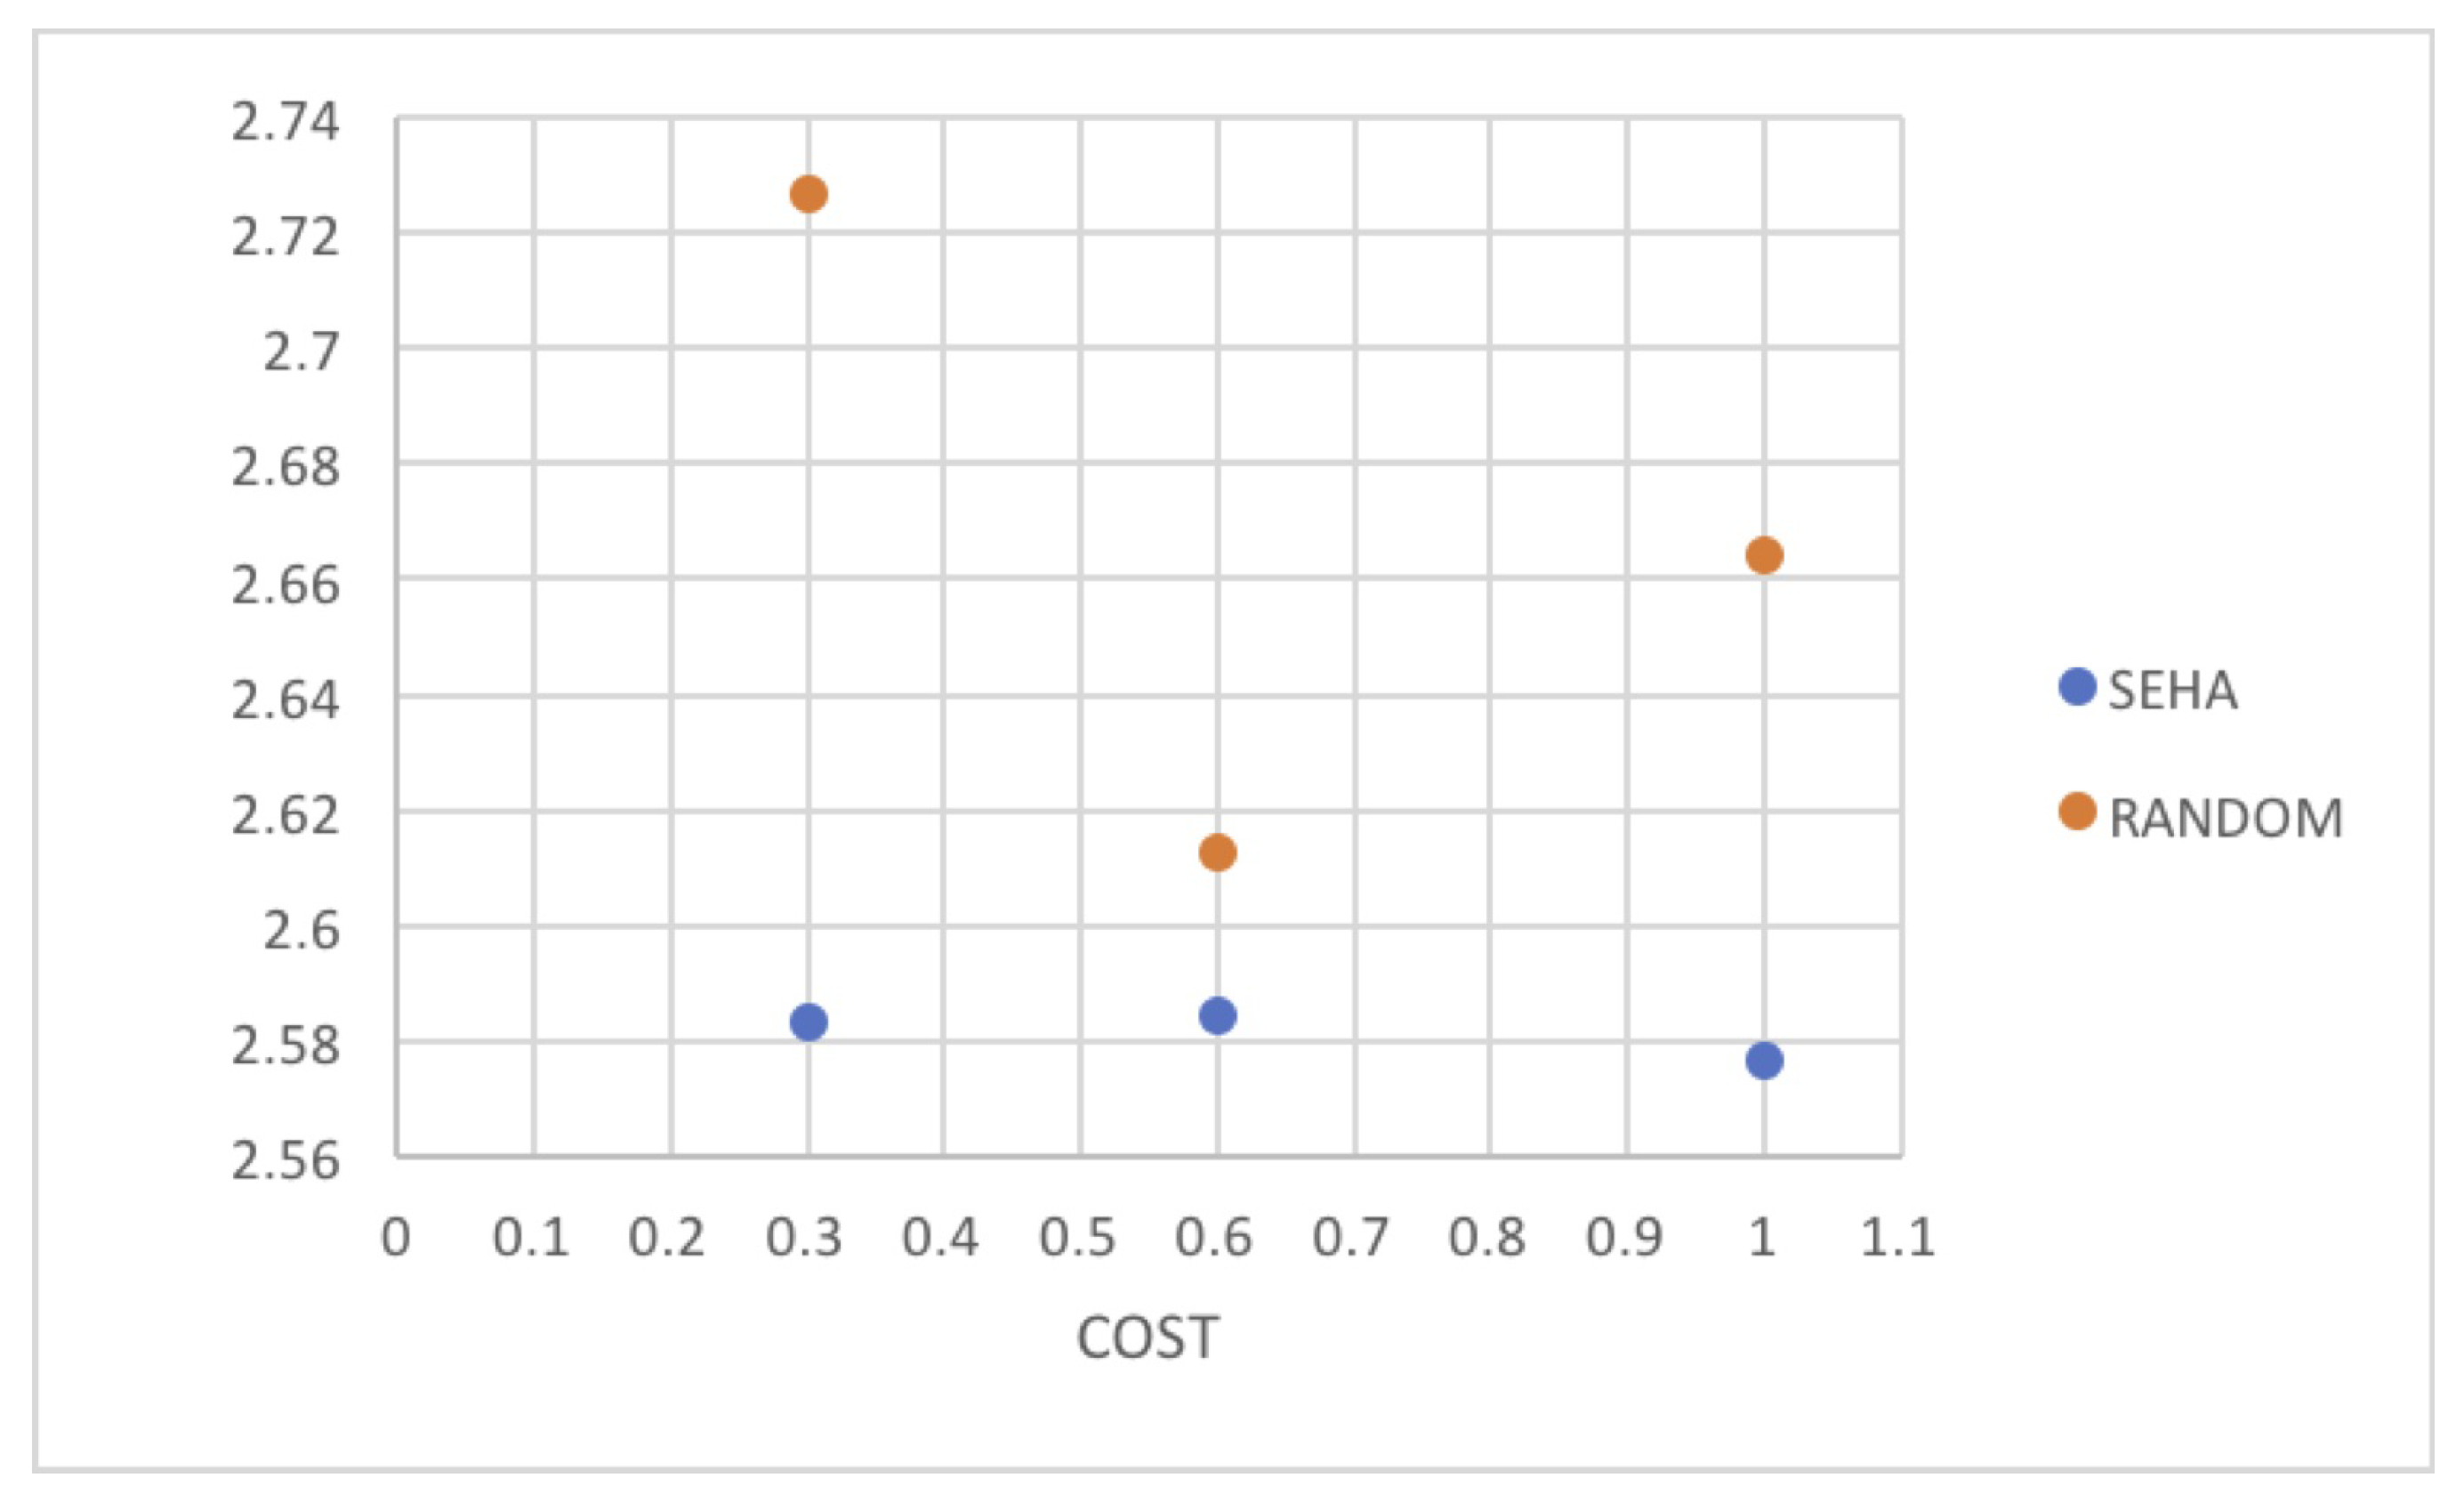
The use of agent-based models to evaluate the performance of an algorithm is a suitable tool. The results shows that, although the variation in the costs greatly influences the random distribution, the affectation is minor when the SEHA (Social Election with Hidden Authorities Algorithm) is applied.
In
Figure 20, the behavior of both simulated scenarios are shown, where it is observed that the outcome variation is smaller when the SEHA (Social Election with Hidden Authorities Algorithm) algorithm is applied than when it is not.
6. Future Work
The integration of an agent that allows the automatic adaptation of network policies would bring us closer to the goal of automating the network-management tasks. This algorithm can be integrated into systems that require self-organization considering the connectivity between its components.
The proposed algorithm can be applied in a social network, where it is possible to identify those members who have a high hierarchy given their number of connections, in order to prioritize the messages that come from high hierarchy members.
7. Conclusions
The agent-based model allows the analysis of the results obtained to identify the patterns of behavior of a network. In addition, the model provides information about how the congestion of a network impacts the transmission of flows when classifying the nodes by their centrality.
Using the model to obtain the measures of complex networks of degree clustering and centrality by considering the network topology is a way to identify the hierarchy of each node. The identification of the nodes with greater centrality is one of the critical parameters of the SEHA Algorithm 1, which allows establishing a tiebreaker and a better flow distribution.
Flow transmission in the network are optimized according to the preferences of the community to which the congested node belongs, which exempts the network administrator from resolving the congestion failure by selecting manually the type of flow that must be transmitted according to its priority.
Considering that complex network metrics in a self-management system improves the network performance by decreasing congestion, this algorithm mainly considers the nodes with greater hierarchy in the network to transmit its flows because they have higher priority. The integration of intelligent algorithms that allows the autonomous negotiation of the resources improves the network performance.

 ,
, 
