The performance of the TXOP PSM-based mechanism, hereafter referred to as TXOP PSM for simplicity, is evaluated in this section. Results were obtained from the analytical model proposed in the previous section and computer-based simulations conducted in an event-driven simulation program written in the Python programming language. Evaluation of various system parameters such as the traffic load, data frame length, PHY data transmission rate, number of STAs, and amount of data frames sent in a burst transmission is considered. In addition, performance comparison between TXOP PSM and different reference mechanisms is presented.
5.1. Reference Mechanisms and Simulation Description
This paper considers two main reference mechanisms, namely IEEE 802.11 DCF and PSM, to compare their performance with that of TXOP PSM. Such mechanisms, as well as TXOP PSM, are assumed to enable the RTS/CTS handshake and can operate either with or without burst transmissions, i.e.,
or
. DCF and PSM with
are considered according to the IEEE 802.11 legacy specification in [
6]. DCF with
(similar to 802.11e EDCA TXOP) operates following the definition in [
25], which is also used in TXOP PSM. PSM with
(similar to 802.11e APSD) is based on the operation of DCF with
in [
25], and is described in more detail below. Finally, TXOP PSM with
accounts for the operation of the mechanisms in [
7,
8,
9,
11], whereas TXOP PSM with
operates as the mechanism in [
12].
A Python simulation program that implements all the operation rules of the aforementioned mechanisms using the network operation and assumptions described in the previous sections was developed. The main motivations for using a custom simulator rather than other available network simulators (e.g., OPNET and ns-3) are the faster execution of the simulations and the fact that advanced sleep mode operations are not yet implemented in other existing simulators. The simulator used in this paper supports all required functionalities to validate the proposed model and to assess how selected system parameters influence the performance of the evaluated mechanisms.
More specifically, the simulated network operation considers an AP and n STAs generating data frames of the same size by following a Poisson process. All the STAs generate data frames addressed to the AP at an equal rate , whereas the rate at which the AP generates data frames is . The destination of each data frame sent by the AP is chosen at random among all the STAs with equal probability . This setting provides balanced bidirectional data flows between the AP and each STA on average. In addition, the AP and the STAs enable a holding time during which they can aggregate up to data frames with the same destination address before attempting to transmit. This holding time allows the creation of more opportunities for multiple data transmissions in each channel access attempt.
The simulated operation of PSM using the holding time and is described as follows. The AP broadcasts a fixed-size beacon frame at each beacon interval, after waiting for the channel to be idle during a Point Coordination Function Interframe Space (PIFS) period. All the STAs wake up to receive the beacon frame and determine if there are buffered data frames for them at the AP. The beacon frame includes buffer status information only for STAs that have buffered data frames at the AP or a buffered data frame with an expired holding time. When an STA has buffered data at the AP, it transmits a PS-Poll frame to the AP and the AP replies with an ACK frame. The AP then delivers up to buffered data frames to an STA, in accordance with the order of received PS-Poll frames, as soon as it gets access to the channel. In addition, an STA can wake up to transmit data only after the expiration of the holding time or whenever there are data frames ready to be transmitted.
The simulated time for each simulation experiment was set to 15 seconds and each simulation experiment was repeated 10 times. The average values of the collected simulation data were employed to compute the simulation results for each parameter set. In addition, confidence intervals of 95% were calculated. Since the width of these confidence intervals is at most 2% of the mean values, they are omitted in the figures for the sake of visualization.
5.2. System Parameters
The system parameters used to obtain the analytical and simulation results correspond to those defined by the 802.11 Extended Rate PHY (ERP) specification with the Orthogonal Frequency Division Multiplexing (OFDM) modulation. This PHY mode can be enabled in either an 802.11b/g interface or an 802.11n/ac interface enabling a single antenna for communications. Such PHY mode provides transmission rates and frame transmission times that allow us to clearly show the significant influence of the awake and sleep transitions on the feasibility of the microsleep operation of TXOP PSM.
More specifically, the available transmission rates of this PHY mode are 6, 9, 12, 18, 24, 36, 48, and 54 Mbps, with their respective Number of Data Bits Per OFDM Symbol (
) 24, 36, 48, 72, 96, 144, 192, and 216. While any of these transmission rates can be used to transmit RTS, PS-Poll (only in PSM), and data frames, only the basic rates 6, 12, and 24 Mbps are allowed for the transmission of CTS and ACK frames. The selection of 6, 12, or 24 Mbps for the CTS and ACK transmissions depends on whether the RTS, PS-Poll, and data frames are sent at 6 or 9, 12 or 18, or 24, 36, 48, or 54 Mbps, respectively. In addition, the beacon frames are broadcast at the lowest basic rate of 6 Mbps. The specification of these basic rate selection rules is provided by the 802.11 Standard [
6].
The time to transmit each frame type
x using the ERP-OFDM PHY mode is computed as
where all the variables and their values are included in
Table 1. More specifically,
denotes the Medium Access Control (MAC) frame length. For a MAC data frame, this length comprises the frame body or MAC Service Data Unit (MSDU) along with a MAC header and a Frame Check Sequence (FCS). For example, using an MSDU of 1500 bytes and RTS/data and CTS/ACK transmission rates of 54 and 24 Mbps, respectively, the values of
,
,
, and
are 30, 34, 254, and 34
s, respectively. It is worth noting that the propagation delay following a frame transmission (
) was neglected in the performance evaluation of the mechanisms.
In addition, other variables presented in
Table 1 are calculated as follows. The PIFS period is obtained by [
6] as
and the DIFS period as
. The EIFS period is computed by [
6] as
(6 Mbps). The holding time was set to 100 ms to run simulations since this duration enables the highest performance for all the evaluated mechanisms with
. The values of power consumption in transmission, reception, idle, and sleep states were obtained from [
15,
16,
17,
18,
19]. The time and power consumption of the awake and sleep transitions were considered according to the results presented in [
15,
16,
17,
18,
19]: (i)
is similar to
, (ii)
is significantly lower than
, and iii)
is significantly higher than
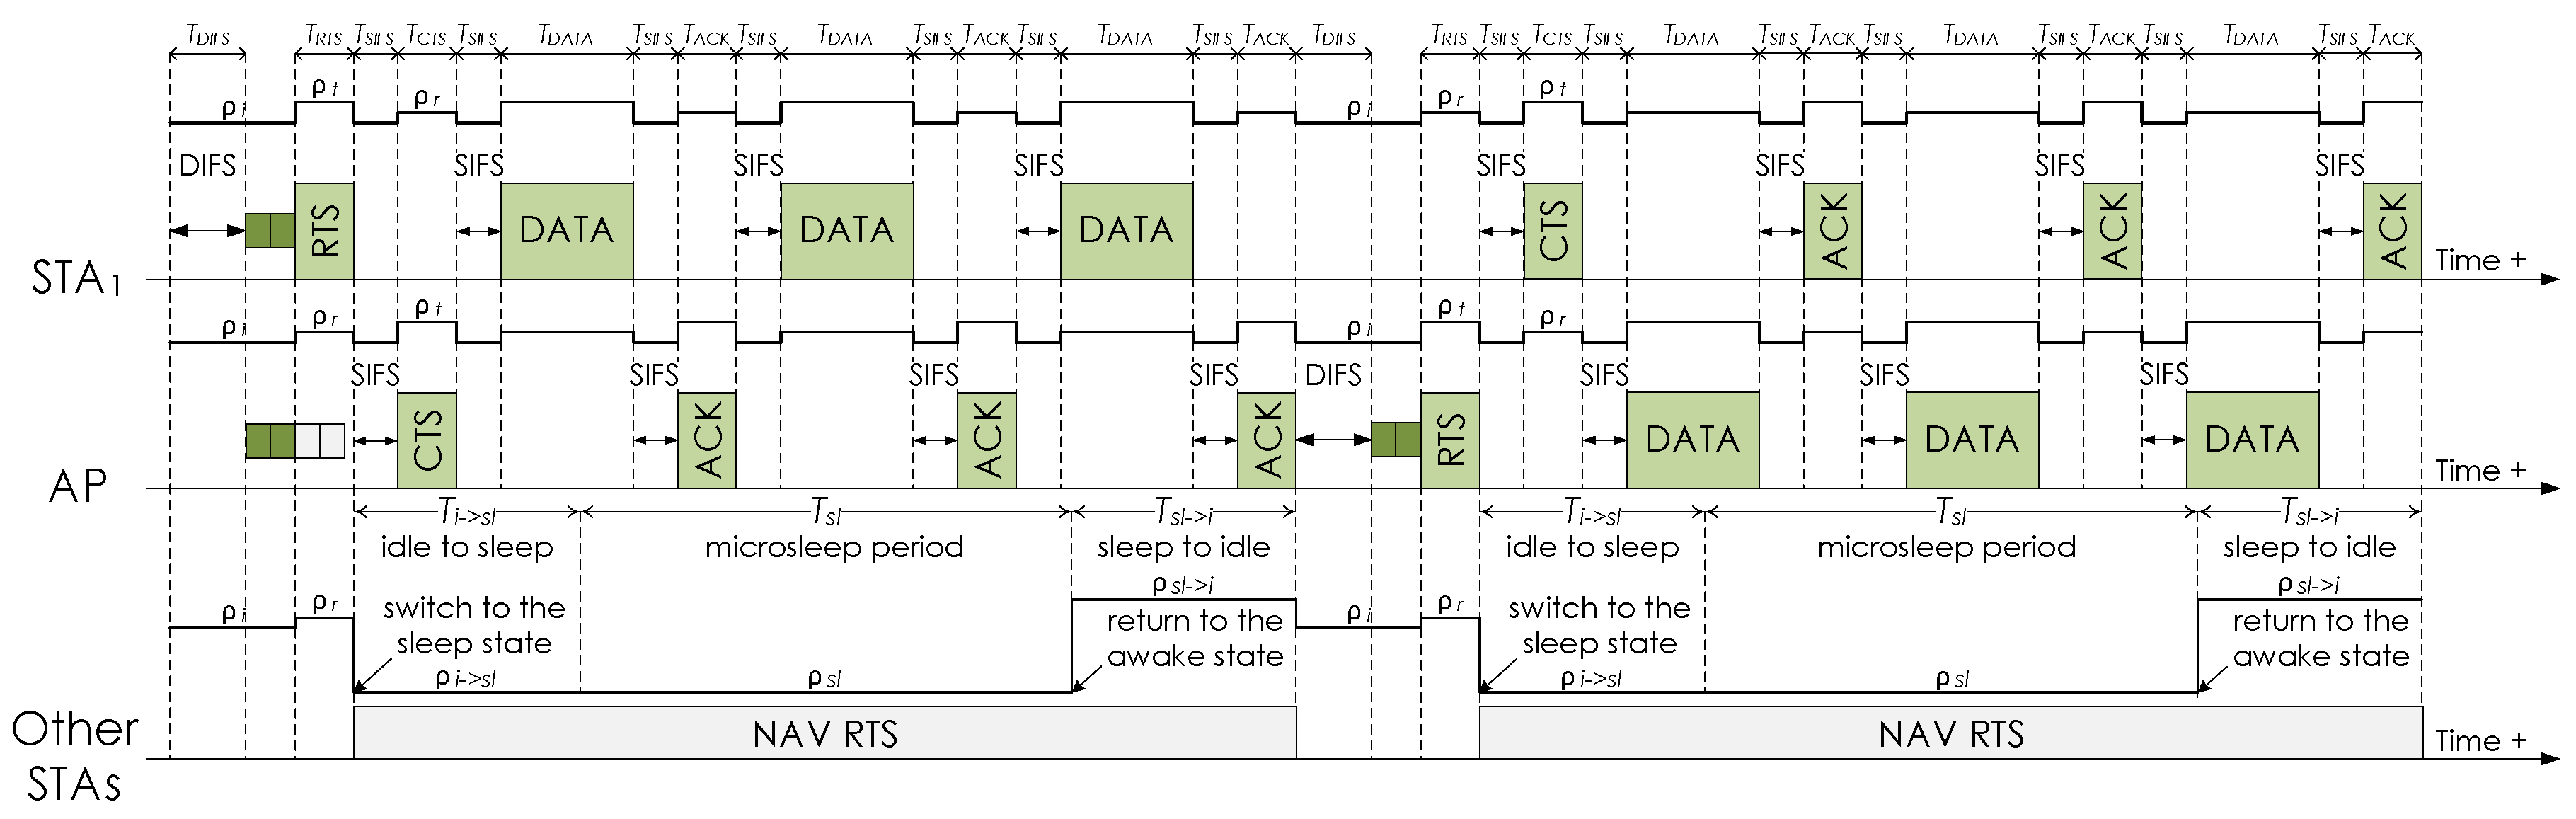
. Consequently, as shown in
Figure 1 for the energy consumption of other STAs, it is assumed that: (i)
is equal to
(the value was obtained from [
15,
16,
17,
18,
19]), (ii)
is equal to
, and (iii)
is modeled as
, where
is defined as the coefficient of power consumption during the transition from sleep to idle and
(
was used according to [
15,
16,
17,
18,
19]).
Unless otherwise specified, an infrastructure BSS consisting of an AP and 20 STAs, a 1500-byte MSDU length, and PHY control and data transmission rates of 24 and 54 Mbps were considered to derive the analytical and simulation results.
5.3. Results
All the figures shown in this section include solid lines referring to the analytical results and markers related to the simulation results. It is also worth noting that the results of energy efficiency of the evaluated mechanisms as a function of the traffic load, MSDU length, and PHY data transmission rate were presented in [
20].
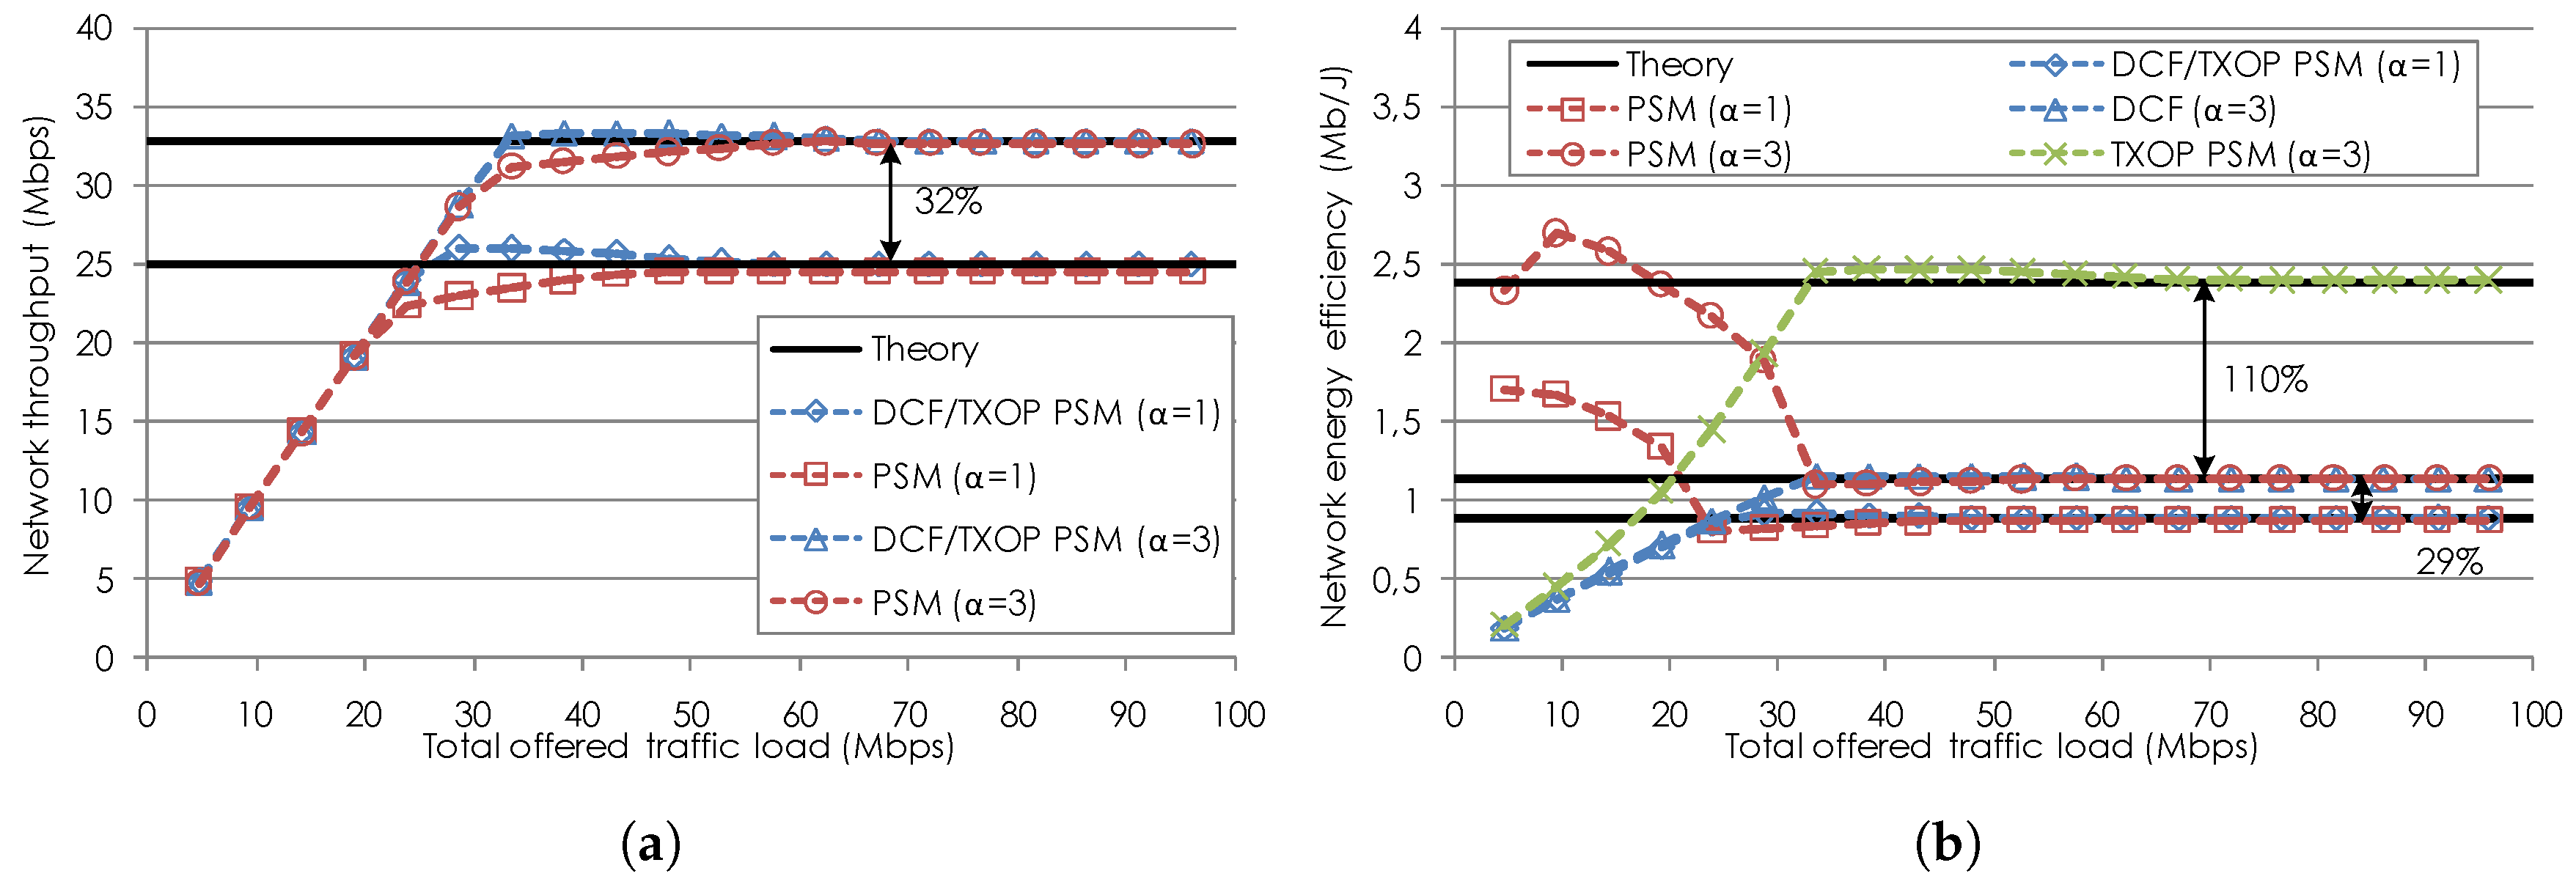
(1) Impact of the Traffic Load
The network throughput and energy efficiency of the evaluated mechanisms with
and
rounds of data transmissions as a function of the total offered traffic load are shown in
Figure 2a and
Figure 2b, respectively. As it can be seen in
Figure 2a, the throughput of the mechanisms linearly increases as the traffic load increases. Each mechanism achieves a maximum stable value of the throughput when the network is in saturation. The saturation throughput of the mechanisms using
is higher than that achieved by the mechanisms when
is employed. The reason is that the AP and the STAs can send up to three data frames in each channel access opportunity, hence enabling the reduction of the overall channel access overhead. In addition, it can be seen that the throughput of DCF and TXOP PSM is the same across all traffic loads whereas PSM attains lower throughput than DCF and TXOP PSM under high traffic loads. This is because PSM, in contrast to TXOP PSM, modifies the operation of the STAs to receive data frames from the AP in order to improve energy efficiency. It is also worth noting that DCF, PSM, and TXOP PSM with
produce a throughput improvement of up to 32% when compared to those with
.
In
Figure 2b, results show the energy efficiency for each mechanism. More specifically, when DCF is employed, the network energy efficiency has a similar shape to that of the throughput, and under saturation conditions it increases up to 29% for DCF using
as compared to DCF with
. This is due to the fact that the energy consumption of the AP and the STAs does not increase significantly with higher traffic loads, while the increase in the amount of transmitted data frames is significant.
As opposed to DCF, the energy efficiency of PSM is the highest under low traffic loads since the STAs can sleep for a long period of time. The energy efficiency of PSM is significantly reduced under high traffic loads, close to the energy efficiency value of DCF. This occurs because the majority of the STAs remain awake most of the time to transmit and receive data. Note that the energy efficiency of PSM with is reduced more slowly than that of PSM with as the traffic load increases. The reason is that the STAs do not wake up until there are at least three data frames to transmit or their holding times expire. For this reason, the energy efficiency of PSM using , being always above that of PSM using , increases a little and then decreases under low to medium traffic loads.
In such range of traffic loads and when
is employed, TXOP PSM attains higher energy efficiency than DCF but lower energy efficiency than PSM, as shown in
Figure 2b. However, under high traffic loads, TXOP PSM improves the energy efficiency of both DCF and PSM by up to 110%. This occurs because the AP and the STAs normally send two or three data frames together in a single channel access attempt, hence enabling listening STAs to sleep and save energy. It is also worth noting that TXOP PSM with
cannot improve the energy efficiency of DCF under high traffic loads. The reason is that, considering the selected system parameters, no STA can sleep during the transmission of a single data frame. This means that the duration of data transmissions are shorter than the transition times of the STAs between awake and sleep states.
Figure 2a,b show that the analytical results corresponding to the saturation network throughput and energy efficiency of all the evaluated mechanisms match the simulation results. In addition, this observation can be made for the rest of the figures presented next.
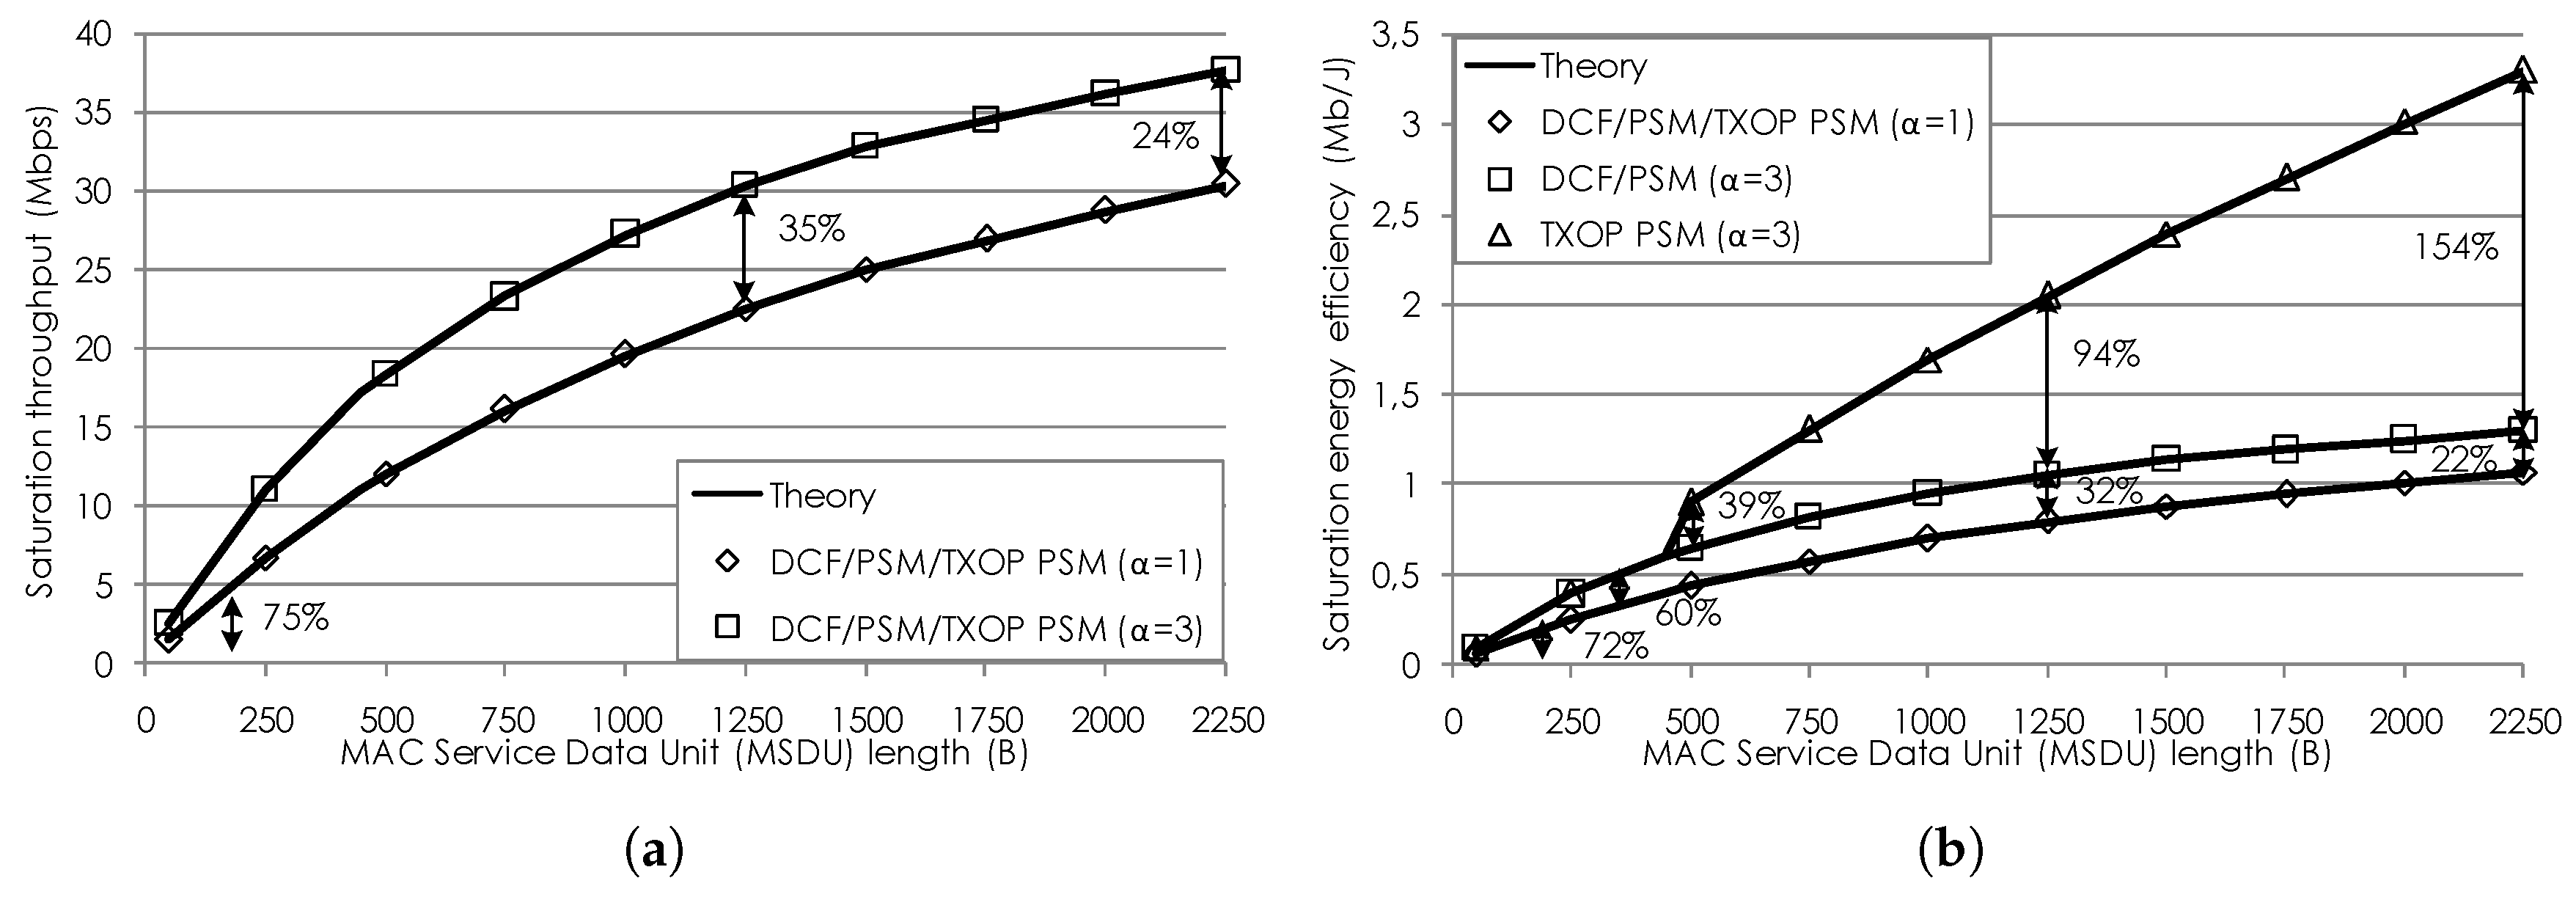
(2) Impact of the MSDU Length
The saturation throughput and energy efficiency of the evaluated mechanisms with
and
as a function of the MSDU length ranging from 50 bytes to 2250 bytes are shown in
Figure 3a and
Figure 3b, respectively. Since DCF and PSM show similar saturation performance, the saturation throughput and energy efficiency of DCF and those of PSM are shown together with a single line and marker for the sake of visualization. This is also used for TXOP PSM with
since TXOP PSM performs the same as DCF, with the exception of the saturation energy efficiency of TXOP PSM when
is employed. In what follows, the terms throughput and energy efficiency will be used to refer to the saturation throughput and the saturation energy efficiency, respectively.
As it can be seen in
Figure 3a, the throughput of the evaluated mechanisms increases as the MSDU length increases since each transmitted data frame includes more information. As in the throughput as a function of the traffic load, DCF, PSM, and TXOP PSM with
outperform these using
for all the MSDU lengths. The throughput improvement ranges from 75% to 24% as the MSDU length increases up to 2250 bytes. This reduction of the throughput improvement is caused by the fact that the longer data frames are the more the data transmission time increases during channel access, thus reducing the influence of the lower channel access overhead enabled by using
. For this reason, the increase in energy efficiency for DCF and PSM using
as compared to these with
also ranges from 72% to 22% as the MSDU length increases, as shown in
Figure 3b .
It can also be seen in
Figure 3b that TXOP PSM with
improves the energy efficiency of DCF and PSM for all the MSDU lengths. The reason is that the STAs are not able to microsleep during data transmissions. In addition, TXOP PSM using
achieves energy efficiency increasing at the same rate as that of DCF and PSM until the MSDU length is long enough to enable microsleep operation. This refers to an MSDU length that provides a non-zero microsleep period (
). For TXOP PSM using
, this requirement is fulfilled when the MSDU length is above 449 bytes. When the MSDU length increases from such value to 2250 bytes, the energy efficiency of TXOP PSM using
is significantly higher than that of DCF and PSM with an improvement ranging from 39% to 154%. This is due to longer microsleep periods as the MSDU length increases, thus allowing the STAs to sleep for a longer period and save more energy.
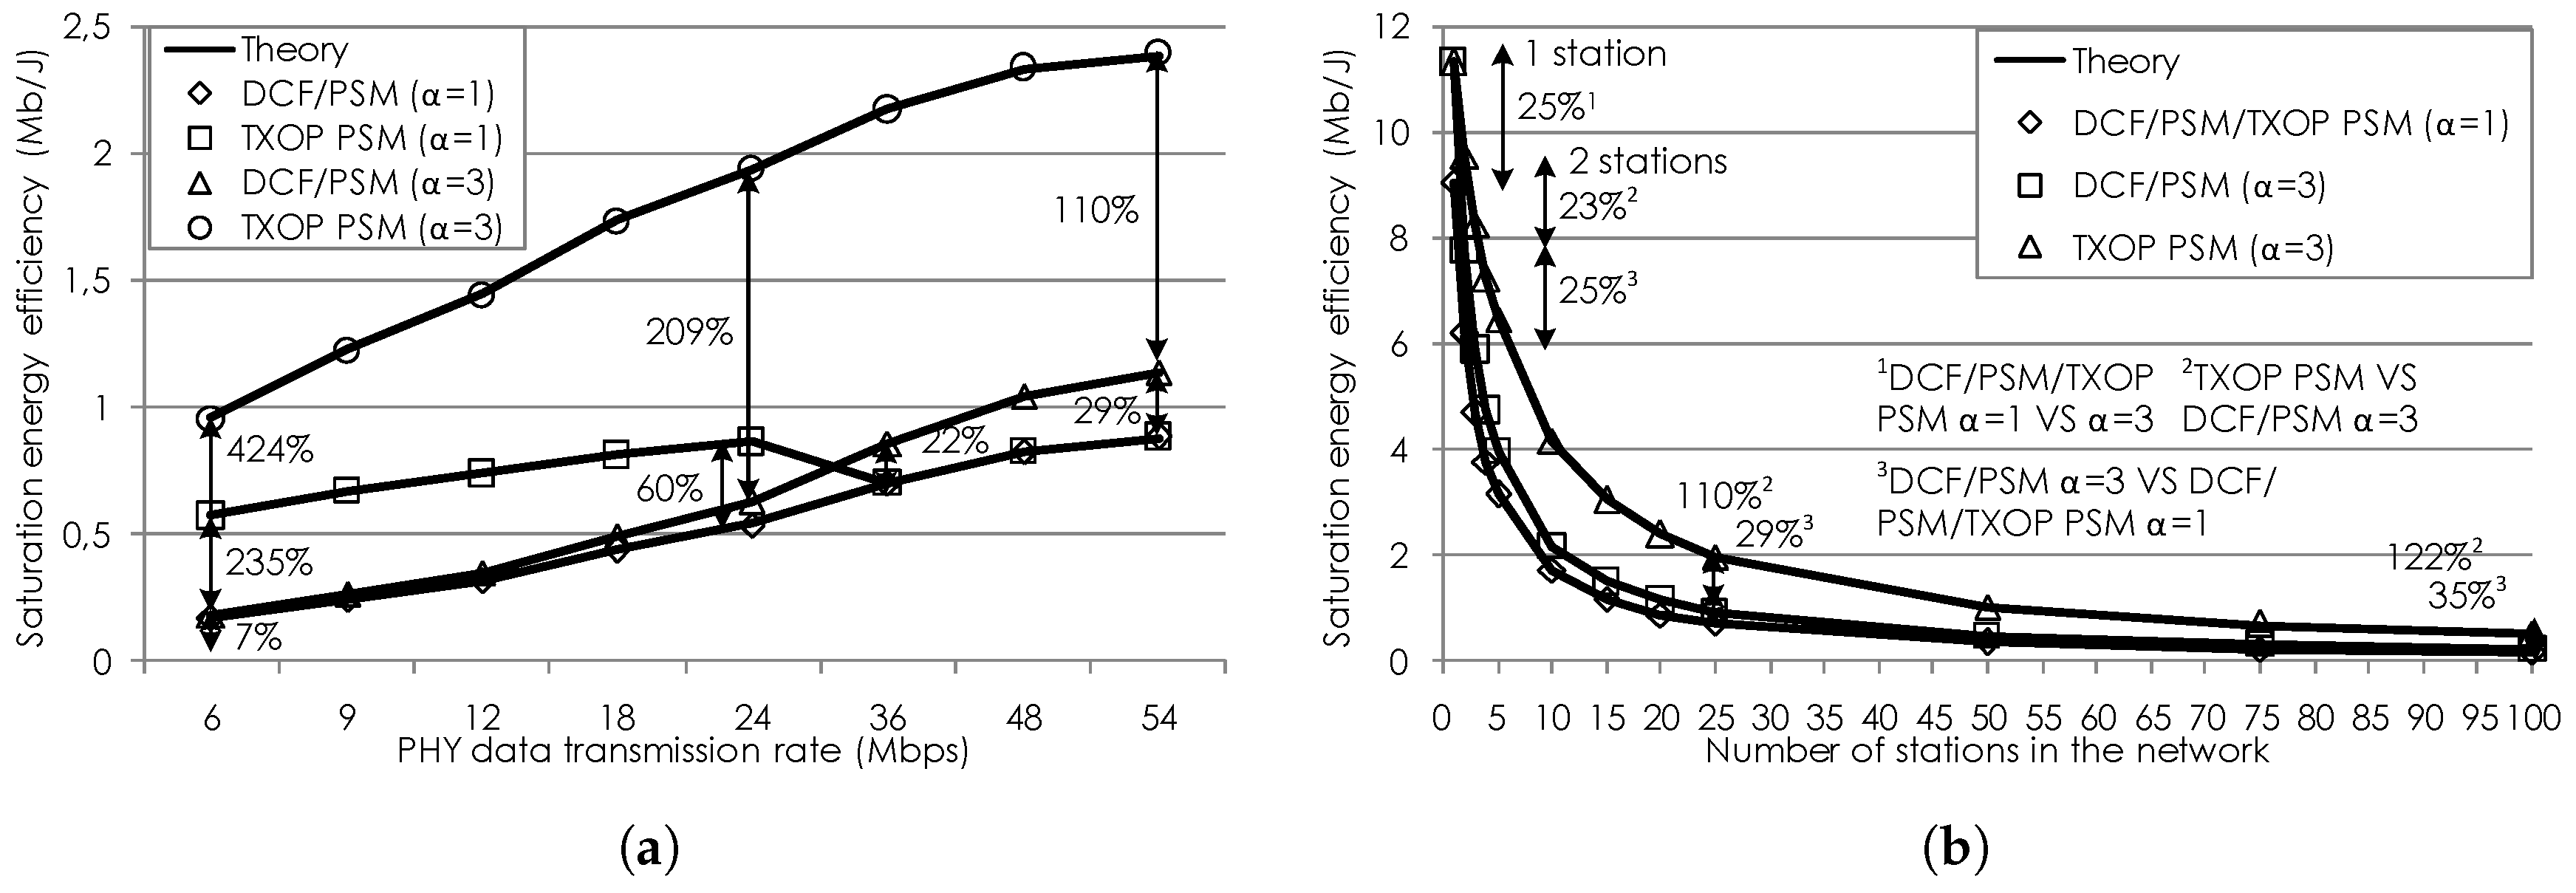
(3) Impact of the PHY Data Transmission Rate
Figure 4 shows the saturation energy efficiency of the evaluated mechanisms as a function of the PHY data transmission rate and the number of STAs. More specifically,
Figure 4a focuses on the PHY data transmission rate ranging from 6 Mbps to 54 Mbps. Results for the energy efficiency of DCF and PSM are plotted together with a single line and marker. On the contrary, the energy efficiency of TXOP PSM is shown with a different line and marker since its behavior is significantly different from those of DCF and PSM. It is also worth noting that the results of the saturation throughput as a function of the PHY data transmission rate are not shown due to their similarities to those presented for the MSDU length. A throughput improvement ranging from 7% to 32% for DCF, PSM, and TXOP PSM using
as compared to these with
is achieved as the PHY data transmission rate increases from 6 Mbps to 54 Mbps.
Figure 4a shows that all the mechanisms attain higher energy efficiency with higher PHY data transmission rates. This is due to the fact that the time to send a data frame becomes shorter, hence resulting in higher efficiency of data transmission. In addition, it can be seen that DCF and PSM using
achieve an increase in energy efficiency from 7% to 29% as compared to DCF and PSM with
when the PHY data transmission rate increases from 6 Mbps to 54 Mbps.
As it can be seen in
Figure 4a, TXOP PSM with
significantly improves the energy efficiency of DCF and PSM for PHY data transmission rates lower than 36 Mbps. The highest increase of 235% in energy efficiency is achieved for the lowest PHY data transmission rate of 6 Mbps. Such increase in energy efficiency decreases from 235% to 60% for higher PHY data transmission rates up to 24 Mbps. The reason is that the transmission duration is shorter or longer depending on whether the PHY data transmission rates increases or decreases, respectively. Shorter data transmission times decrease the time that the STAs can sleep whereas longer transmission times increase the microsleep period. For higher PHY data transmission rates ranging from 36 Mbps to 54 Mbps, TXOP PSM with
performs as DCF and PSM. This occurs because these PHY data transmission rates do not produce data transmission times enabling microsleep operation based on the awake and sleep transition times of the STAs.
In addition, it can be seen in
Figure 4a that TXOP PSM using
can allow the STAs to sleep for all the PHY data transmission rates, achieving the highest energy efficiency value. The improvement ranging from 424% to 110% for TXOP PSM when compared to DCF and PSM is obtained when the PHY data transmission rate increases from 6 Mbps to 54 Mbps.
(4) Impact of the Number of STAs
Figure 4b shows the saturation energy efficiency of the evaluated mechanisms with
and
as a function of the number of STAs up to 100 STAs. The energy efficiency of DCF and PSM as well as that of TXOP PSM with
are shown by a single line and marker. A different line and marker are used to plot the energy efficiency of TXOP PSM with
. In addition, in line with the PHY data transmission rate, results for the saturation throughput as a function of the number of STAs are omitted. DCF, PSM, and TXOP PSM using
achieve a high stable throughput improvement that ranges from 28% to 39% when compared to DCF, PSM, and TXOP PSM with
as the number of STAs increases up to 100 STAs.
As shown in
Figure 4b, the energy efficiency of all the mechanisms decreases as the number of STAs in the network increases. The reason is that more STAs consume energy for overhearing frames sent to the AP or other STAs. More specifically, DCF and PSM with
attain an increase in energy efficiency that ranges from 25% to 35% as compared to when they employ
with larger numbers of STAs up to 100 STAs. This is due to the reduction of the overall channel access overheard enabled by the use of
.
In addition, it can be seen in
Figure 4b that the energy efficiency of TXOP PSM using
is the same as that of DCF and PSM. However, TXOP PSM with
achieves the highest energy efficiency for numbers of STAs above 1 STA as compared to DCF and PSM. No improvement over DCF and PSM is obtained when the network is composed of the AP and an STA, since this STA can never go to sleep. For larger numbers of STAs from 2 STAs to 100 STAs, TXOP PSM provides a significant increase in energy efficiency between 23% and 122%, since more STAs can sleep and consequently save energy.
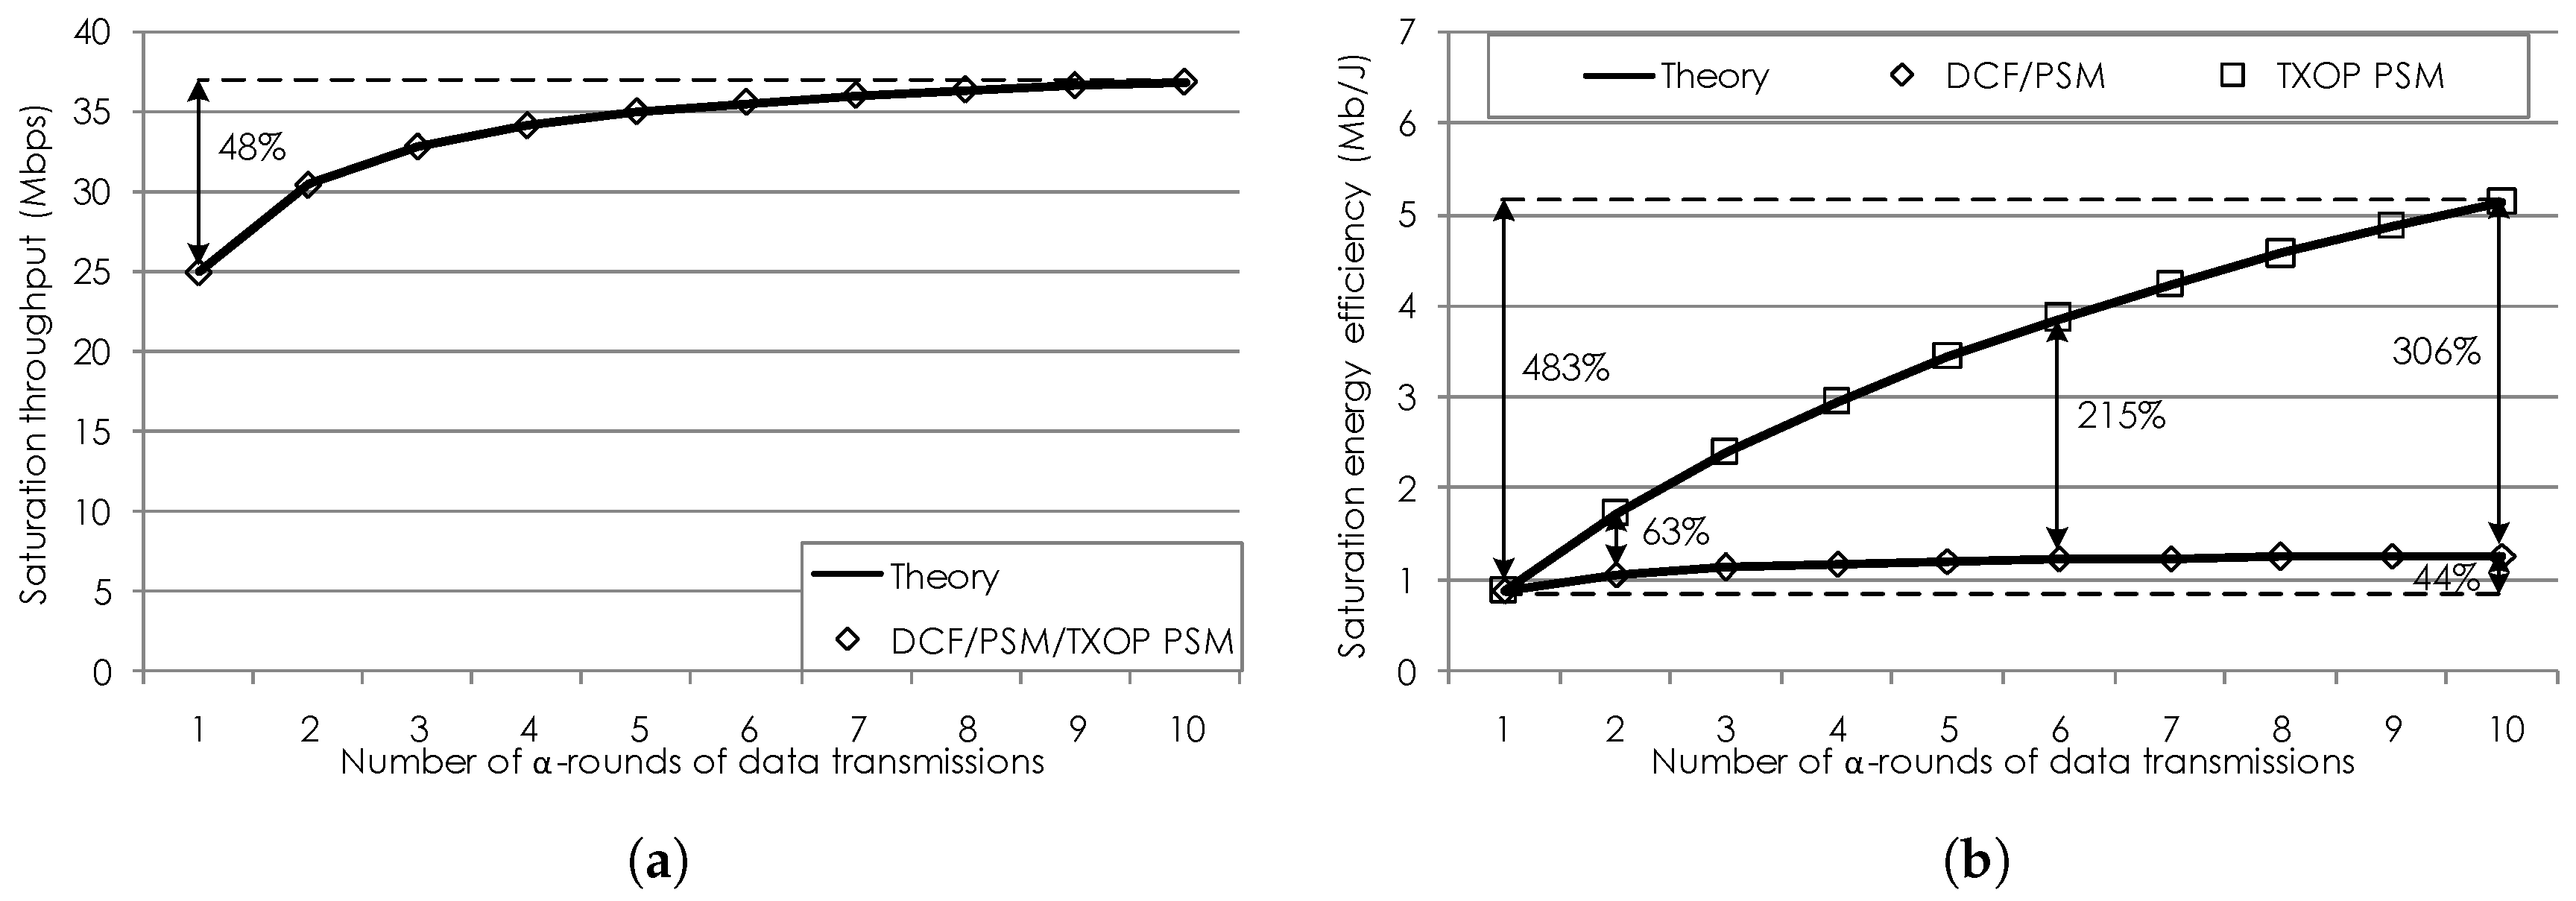
(5) Impact of the Number of -Rounds of Data Transmissions
The saturation throughput and energy efficiency of the evaluated mechanisms as a function of the number of
-rounds of data transmissions from
to
are presented in
Figure 5a and
Figure 5b, respectively. As it can be seen in
Figure 5a, the throughput of the mechanisms increases as the value of
increases, since more data frames can be sent in each channel access attempt. The maximum throughput is achieved for
, although the throughput increases slightly after
. This occurs because the contribution of the reduced channel access overhead to the total transmission time becomes marginal as compared to that of the data transmission time. For this reason, the maximum throughput improvement of DCF, PSM, and TXOP PSM between
and
is up to 48%. In addition, an increase of up to 44% in energy efficiency for DCF and PSM between
and
can be seen in
Figure 5b.
As it can also be seen in
Figure 5b, the energy efficiency of TXOP PSM significantly increases between
and
and as compared to DCF and PSM. The increase of TXOP PSM with
when compared to TXOP PSM using
is up to 483%. The energy efficiency of TXOP PSM can also increase by up to 306% from
to
when compared to DCF and PSM. The reason for these results is that, as more data frames can be sent in a single channel access attempt, the STAs can sleep for a longer period and save more energy.


 ,
, 

