Article

Reduction of Liquid Bridge Force for 3D Microstructure Measurements

1
Department of Mechanical Systems Engineering, Faculty of Environmental Engineering, The University of Kitakyushu, 1-1 Hibikino, Wakamatsu-ku, Kitakyushu, Fukuoka 808-0135, Japan
2
Department of Mechanical Engineering, Faculty of Engineering, Kyushu University, 744, Motooka, Nishi-ku, Fukuoka 819-0395, Japan
*
Author to whom correspondence should be addressed.
Appl. Sci. 2016, 6(5), 153; https://doi.org/10.3390/app6050153
Submission received: 14 April 2016 / Revised: 10 May 2016 / Accepted: 11 May 2016 / Published: 16 May 2016
(This article belongs to the Special Issue Design and Applications of Coordinate Measuring Machines)

Abstract

:
Recent years have witnessed an increased demand for a method for precise measurement of the microstructures of mechanical microparts, microelectromechanical systems, micromolds, optical devices, microholes, etc. This paper presents a measurement system for three-dimensional (3D) microstructures that use an optical fiber probe. This probe consists of a stylus shaft with a diameter of 2.5 µm and a glass ball with a diameter of 5 µm attached to the stylus tip. In this study, the measurement system, placed in a vacuum vessel, is constructed suitably to prevent adhesion of the stylus tip to the measured surface caused by the surface force resulting from the van der Waals force, electrostatic force, and liquid bridge force. First, these surface forces are analyzed with the aim of investigating the causes of adhesion. Subsequently, the effects of pressure inside the vacuum vessel on surface forces are evaluated. As a result, it is found that the surface force is 0.13 µN when the pressure inside the vacuum vessel is 350 Pa. This effect is equivalent to a 60% reduction in the surface force in the atmosphere.

1. Introduction

Recent years have witnessed an increased demand for a method for precise measurement of the microstructures of mechanical microparts, microelectromechanical systems, micromolds, optical devices, microholes, etc. However, precise measurement of the shape of a microstructure with a large length-to-diameter (L/D) ratio is rather difficult because of the difficulty in probe fabrication and sensing methods where the measuring force is very small. Previous works have reported microstructure measurement techniques that employ a variety of probes such as optical probes, vibroscanning probes, vibrating probes, tunneling effect probes, opto-tactile probes, fiber deflection probes, optical trapping probes, and diaphragm probes [1,2,3,4,5,6,7,8,9].
In a previous study, we developed a system for the measurement of three-dimensional (3D) microstructures using an optical fiber probe that functions as a kind of displacement measuring probe with a small contact force and wide measurement range [10]. In this system, the shaft of the stylus does not need to be rigid for the detection of the measuring force, because the deflection of the stylus is measured by a non-contact method. In general, when the particle size is less than several tens of micrometers, the effects of surface force generated from the van der Waals force, electrostatic force, and liquid bridge force are strengthened and this surface force becomes greater than the force of gravity [11]. We used a fiber stylus with a 5-µm-diameter sphere on its tip, and as a result, we found that the measurement surface draws the stylus tip closer when the tip approaches it and the distance between the stylus tip and the measured surface is less than the regular displacement. When the stylus tip comes into contact with the measured surface, it adheres to the surface and cannot be separated from it. When the measured surface is scanned point by point in the touch-trigger mode (Figure 1a), the measurement time increases because the stylus tip is required to be separated from the measured surface to overcome the surface force. When the measured surface is scanned continuously in the scanning mode (Figure 1b), the measurement accuracy reduces because of the bending of the stylus shaft due to the adhesion. The observed adhesion, which is influenced by environmental factors (e.g., humidity) and the roughness of the measurement surface, is not reproducible. Therefore, in another previous work, we developed a measurement system for 3D microstructures that uses a vibrating fiber probe (Figure 1c) to prevent adhesion of the stylus tip to the surface being measured [12]. In this system, the stylus tip is set to vibrate in a circular motion, where it traces a circle of diameter 0.4 µm in the X-Y plane. However, the stylus tip actually traces an elliptical path. The difference between the profile of the perfect circle and that of the actual elliptical path of the stylus tip leads to measurement error. Moreover, the surface roughness cannot be measured in the scanning mode when using the vibrating fiber probe.
In the present study, the stylus characteristics are examined. Then, the effects of the surface force on the adhesion are analyzed. The results confirm that the primary cause of adhesion is the liquid bridge force. Therefore, the measurement system, placed in a vacuum vessel, is constructed suitably to prevent the adhesion caused by the surface force between the stylus tip and the measured surface. The effects of pressure inside the vacuum vessel on the surface force are evaluated experimentally. The surface force is calculated by assuming that the optical fiber probe is equal to the cantilever of the fixed support. In other words, the surface force is calculated by the deflection of the stylus shaft. There are many techniques for measuring surface forces, such as those involving the surface forces apparatus (SFA), atomic force microscopy (AFM), micro cantilever (MC), optical trapping (OT), etc. [13,14,15]. The measuring method that uses the optical fiber probe is, in principle, similar to the SFA and AFM. As a result, the surface force is found to be 0.13 µN when the pressure inside the vacuum vessel is 350 Pa. This effect is equivalent to a 60% reduction in the surface force in the atmosphere.

2. Measurement Principle

Figure 2 shows a diagram of the developed optical measurement system. The stylus consists of a 2.5-µm-diameter optical fiber to which a 5-µm-diameter glass stylus tip is attached. The total length of the stylus is 0.38 mm. The probing system consists of the fiber stylus, two laser diodes with a 650 nm wavelength (LDX and LDY in the X- and Y-directions, respectively), and two dual-element photodiodes (PX and PY in the X- and Y-directions, respectively). The stylus shaft is fixed to a tube-type piezo driver element in order to perform attitude adjustment of the stylus shaft; the stylus shaft is installed between the laser diodes and the dual-element photodiodes, which are oriented orthogonally. The laser diodes are mounted above the stylus tip, and the focused laser beams irradiate along the X- and Y-directions onto the stylus shaft. The two dual-element photodiodes are located opposite the laser diodes beyond the stylus. The laser beams that pass through the stylus shaft are received by these dual-element photodiodes. The beam intensities detected by the photodiodes are converted into voltages; hereafter, these intensities are denoted as IPX1, IPX2, IPY1, and IPY2 (V). The output signal IX in the X-direction obtained using IPY1 and IPY2 and the output signal IY in the Y-direction obtained using IPX1 and IPX2 are defined as given in Equations (1) and (2), respectively. A charge-coupled device is employed to monitor the positions of the stylus and test piece during the setting up of the equipment and the measurement.
IX = IPY1IPY2
IY = IPX1IPX2
To illustrate the measurement principle of the optical fiber probe, Figure 3 shows a cross-sectional diagram of the X-Y plane of the optical system shown in Figure 2. Before the stylus tip comes into contact with the measured surface, the light intensities measured by each element of the dual-element photodiode are equal (i.e., IPX1 = IPX2 and IPY1 = IPY2), as shown in Figure 3a. When the stylus tip comes into contact with the measured surface in the X-direction, the laser-irradiated part of the stylus shaft is displaced, and the light intensities measured by each element of the dual-element photodiode are no longer equal to each other (i.e., IPX1 = IPX2 and IPY1 > IPY2), as shown in Figure 3b. When the stylus shaft is displaced in the +X-direction, the angle of refraction of the laser beam passing through the stylus shaft in the Y-direction changes owing to a shift in the part of the stylus shaft being irradiated. Additionally, when the stylus tip comes into contact with the measured surface in the Y-direction, the light intensities measured by each element of the dual-element photodiode are no longer equal to each other (i.e., IPX1 < IPX2 and IPY1 = IPY2), as shown in Figure 3c. As a result, the contact direction and the magnitude of displacement of the stylus tip can be obtained from the output signals IX and IY. When the stylus tip comes into contact with the measured surface in the Z-direction, the stylus shaft is buckled and deflected. This deflection is also measured using the above-mentioned method.
Because the proposed probe measures the deflection amplitude of the stylus shaft by using a laser-based non-contact method, the stylus shaft does not need to be rigid; this principle also applies to a stylus with a much smaller diameter. This measurement system measures the deflection of the stylus shaft; however, it does not directly measure the displacement of the stylus tip. The noise present in IX and IY is removed via synchronous detection using a lock-in amplifier. The displacement of the stylus is magnified by using it as a rod lens. The surface of the microstructure is measured by recording the displacement of the stylus shaft as well as the coordinates at which the stylus comes into contact with the measured surface.

3. Stylus Characteristics

Figure 4 shows the changes in outputs IX and IY when the stylus tip is displaced in the ±X-direction. Here, the horizontal axis represents the displacement of the stylus tip and the vertical axis represents the changes in IX and IY. It can be seen that when the stylus tip is displaced in the X-direction, barely any change occurs in the output IY in the Y-direction and the fiber probe can function as a displacement sensor because the rate of change in IX can approximate a straight line within a ±3 µm range in the X-direction.

4. Effects of Surface Force

4.1. Analyses of Liquid Bridge Force, Van der Waals force, and Electrostatic Force

In general, when the particle size is less than several tens of micrometers, the effects of the surface force generated from the van der Waals force, electrostatic force, and liquid bridge force are strengthened and this surface force becomes greater than the force of gravity [11]. 
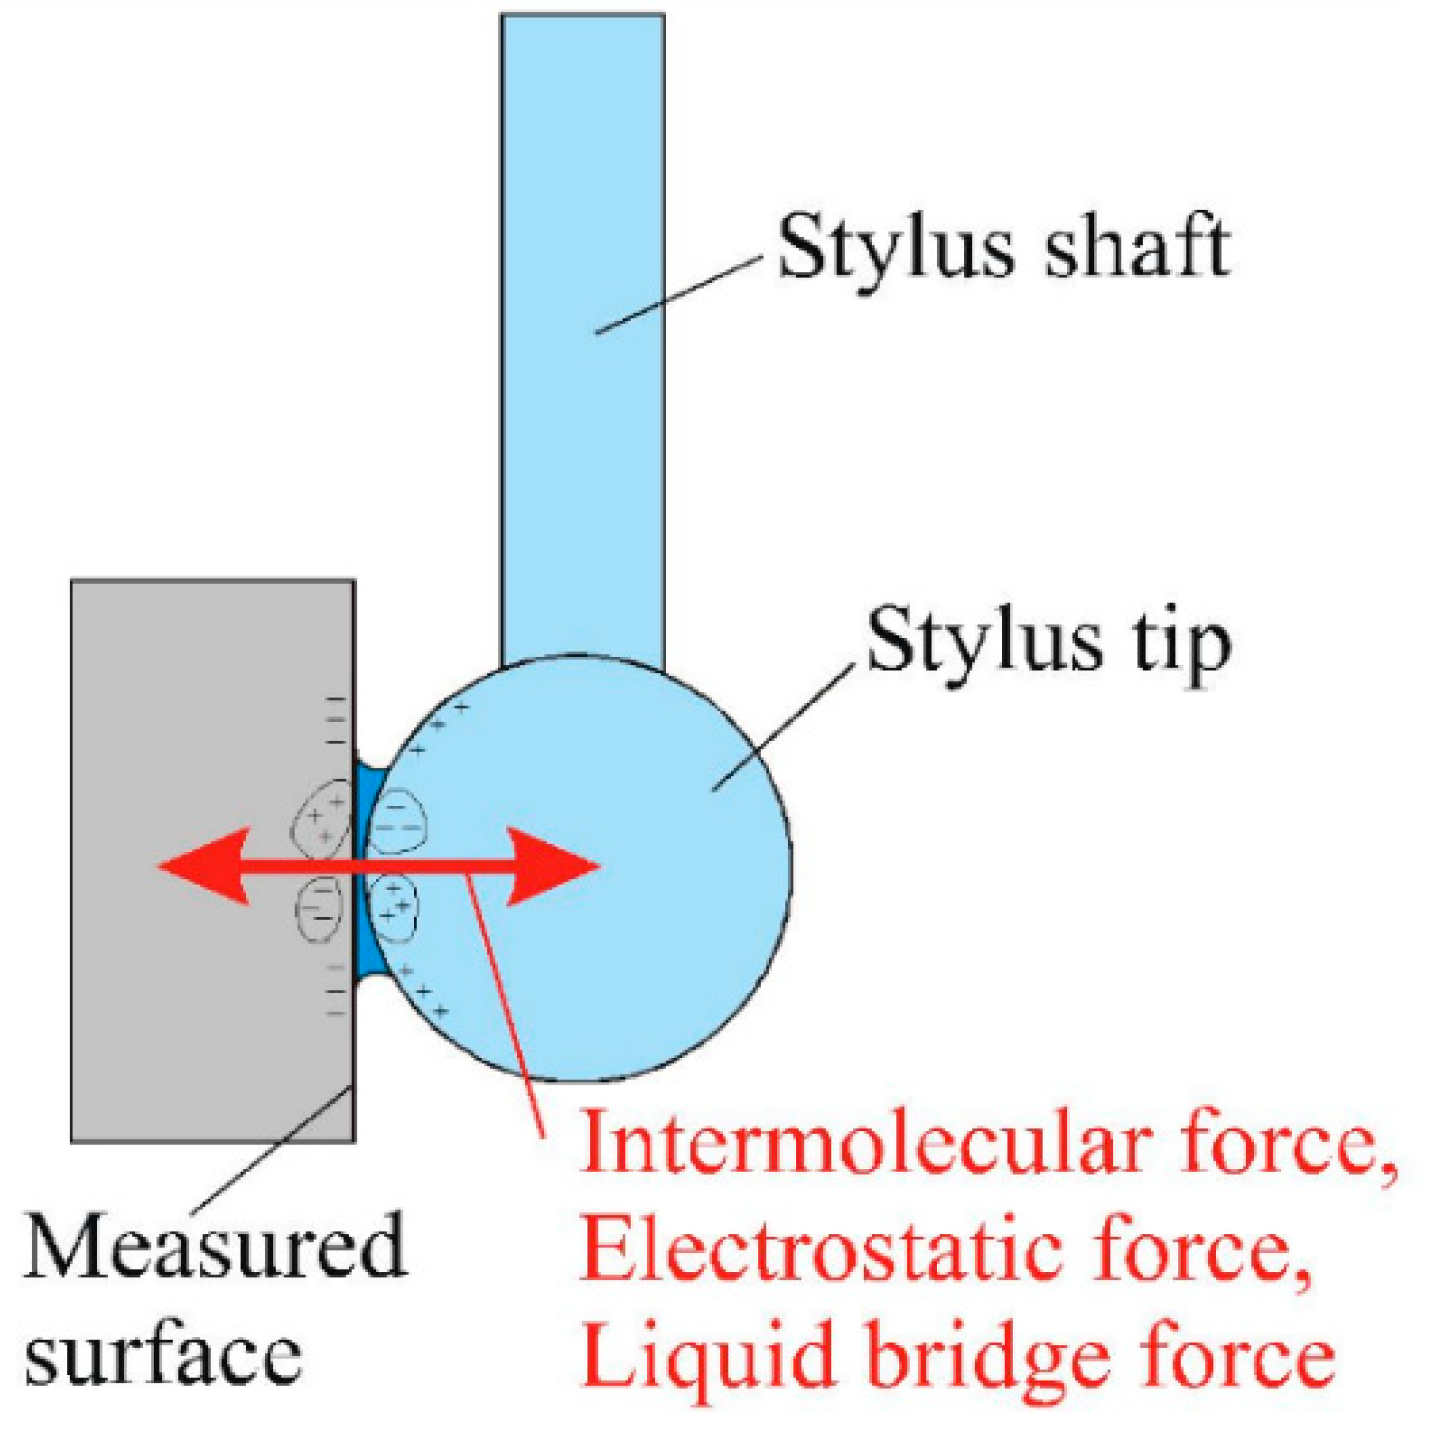
Figure 5 shows a schematic diagram of the surface force between the stylus tip and the measurement surface. Because the fiber stylus has a 5-µm-diameter sphere on its tip, the measurement surface draws the stylus tip closer when the stylus tip approaches it, and the distance between the stylus tip and the measured surface is less than the regular displacement. When the stylus tip comes into contact with the measured surface, it adheres to the surface and cannot be separated from it. When the measured surface is scanned point by point in the touch-trigger mode, the measurement time increases because the stylus tip is required to be separated from the measured surface on account of the surface force. When the measured surface is scanned continuously in the scanning mode, measurement accuracy reduced because of the bending of the stylus shaft due to the adhesion. The observed adhesion, which is influenced by environmental factors (e.g., humidity) and the roughness of the measured surface, is not reproducible.
These surface forces are analyzed with the aim of investigating the causes of adhesion. First, we examine the liquid bridge force. This force has a large effect on adhesion in a humid environment; it is generated by the capillary action of condensed water near the contact zone of the stylus tip and measured surface. This force increases with increasing relative humidity. The liquid bridge force Fl experienced in the case of a stylus tip of diameter d and under a relative humidity of %RH can be calculated using the empirical formula in Equation (3) [11]. This is the empirical formula of the liquid bridge force between a particle and a plate with a hard and clean surface. As indicated by this formula, the liquid bridge force increases with increasing relative humidity.
Fl = 0.15d{0.5 + 0.0045 × (%RH)}
Next, we examine the van der Waals force. This force acts between molecules, and it is a general force of interaction that acts between objects at all times. The van der Waals force FV can be calculated using the Hamaker constant A and the distance z between the stylus tip and the measured surface as given in Equation (4) [11]. The Hamaker constant A is a constant specific to materials, and it is expressed as in Equation (5), where n and Λ are the number of atoms per unit volume and the constant of proportionality of London forces, respectively. When the molecules of the stylus tip and the measured surface come close to each other by the van der Waals force, intermolecular repulsive force is generated between the molecules of the stylus tip and the measured surface. The molecules are stabilized at the most stable position, which corresponds to the position with the smallest potential energy. At this instant, the separation distance z is about 0.4 nm.
FV = Ad/(12z2)
A = n2 π2 Λ
Finally, the electrostatic force generated by an interaction between a charged particle and an uncharged surface is examined. When a charged particle comes into contact with an uncharged surface, the generated electrostatic force Fe can be calculated using Equation (6) in the case that the distance between the stylus tip and the measured surface is negligible because it is remarkably small compared with the diameter of the stylus tip [11].
F e = π 4 ε 0 · ε ε 0 ε + ε 0 · d 2 σ 2
where ε0, ε, and σ are the dielectric constant of the vacuum, the dielectric constant of the measured surface, and the marginal surface density of the charge of the stylus tip, respectively.
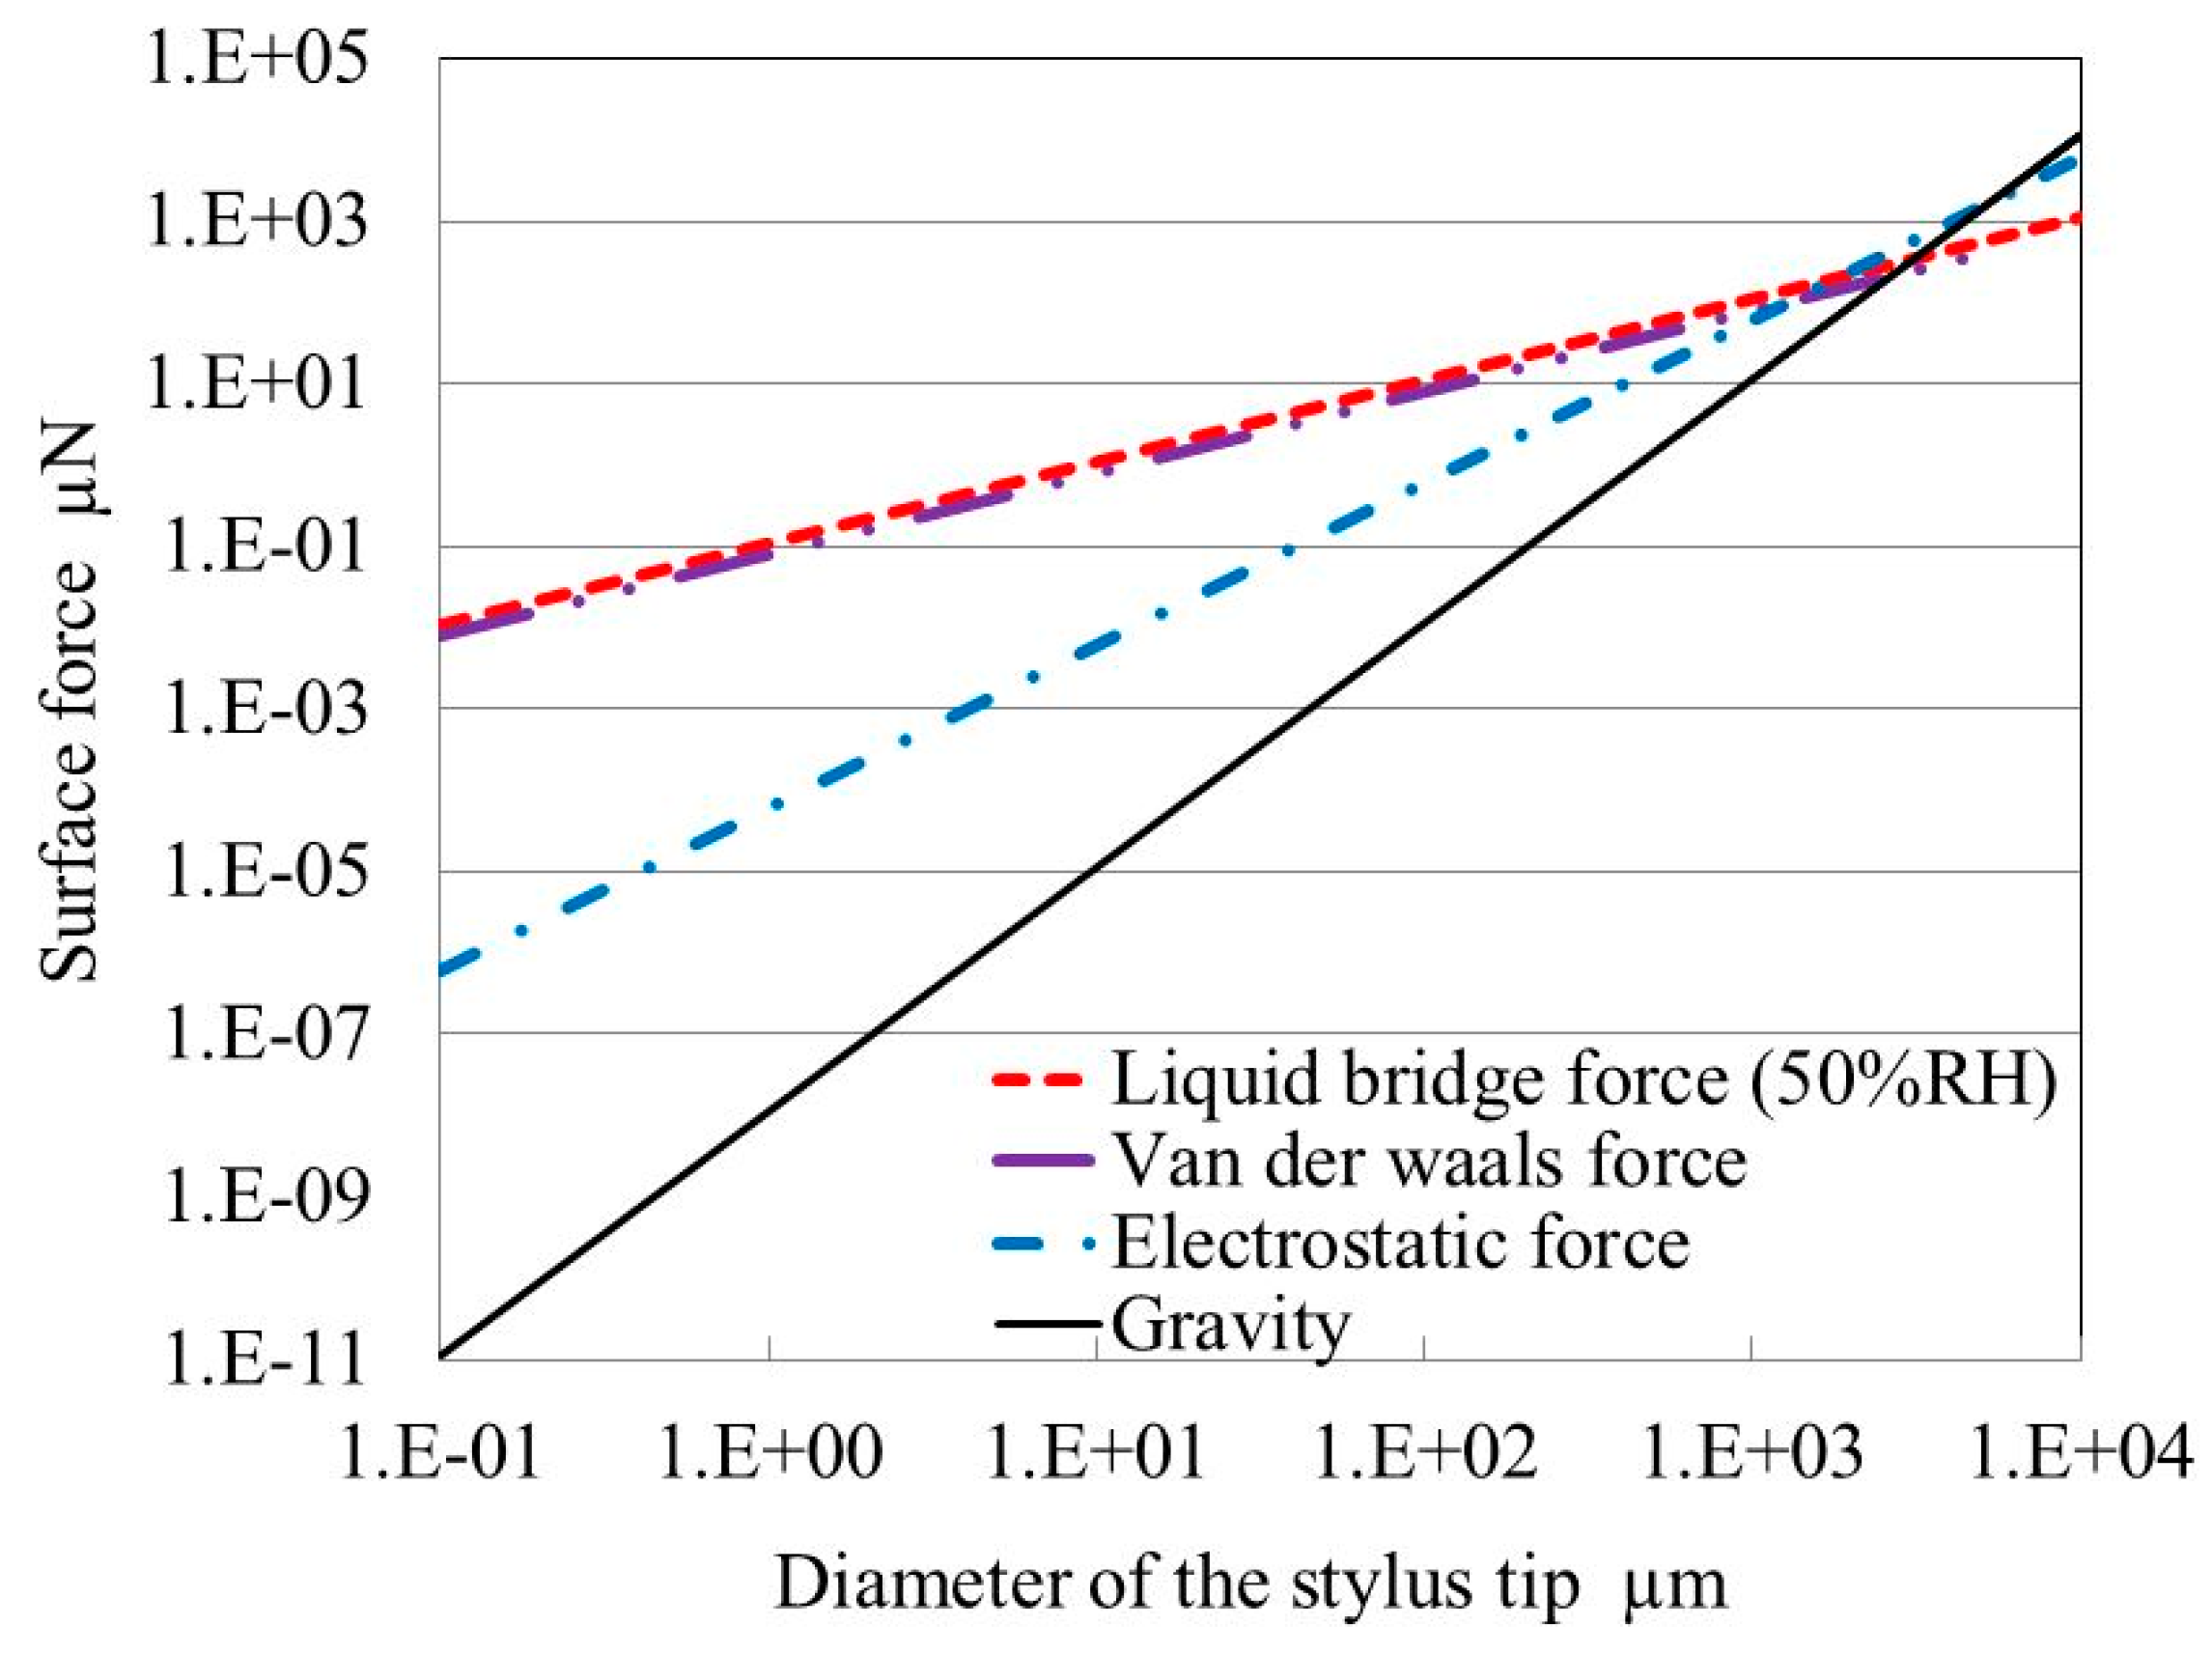
Figure 6 shows the relationship between the stylus tip diameter and the surface forces calculated using Equations (3), (4), and (6). Here, the horizontal axis represents the stylus tip diameter and the vertical axis represents the van der Waals force, electrostatic force, liquid bridge force, and gravity. It can be seen from this figure that when the stylus tip diameter is less than about 1 mm, the effects of surface force generated from the van der Waals force, electrostatic force, and liquid bridge force are strengthened and the surface force becomes greater than the force of gravity.
This confirms that the primary cause of adhesion is the liquid bridge force. The van der Waals force and liquid bridge force are approximately equal. However, the electrostatic force is much smaller than the van der Waals force and liquid bridge force. When the surface forces are calculated using Equations (3), (4), and (6) for a stylus tip 5 µm in diameter, the liquid bridge force (50% RH), van der Waals force, and electrostatic force are 0.54 µN, 0.36 µN, and 0.0016 µN, respectively. In this case, the sum of the surface forces is approximately 0.9 µN. 
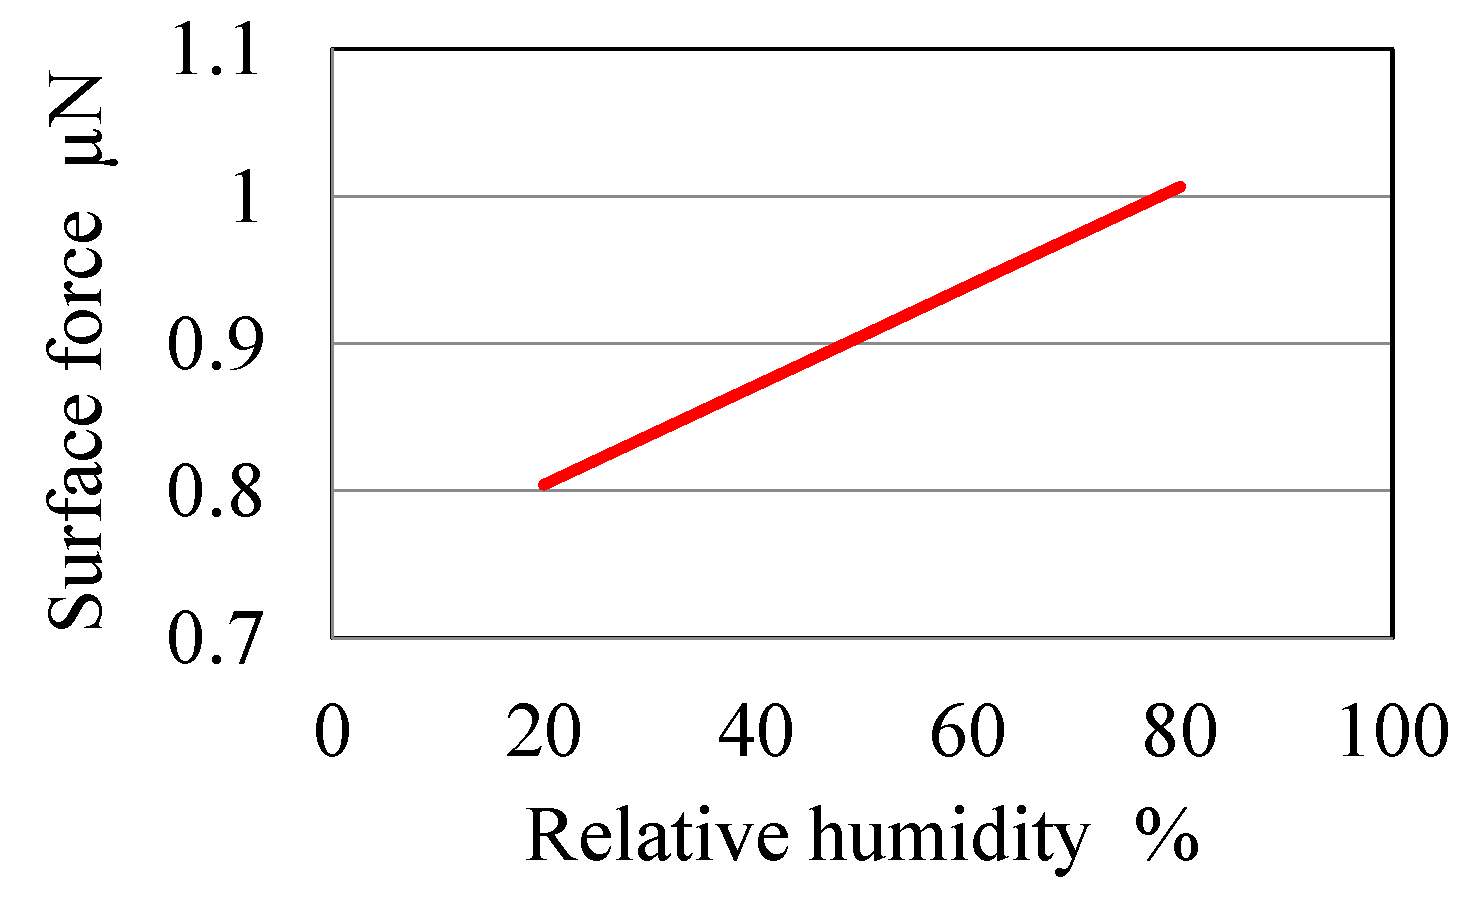
Figure 7 shows the relationship between the relative humidity and the sum of surface forces (Fl + Fv + Fe) calculated using Equations (3), (4), and (6). It can be seen from this figure that the liquid bridge force increases with increasing relative humidity.

4.2. Effect of Relative Humidity on the Liquid Bridge Force

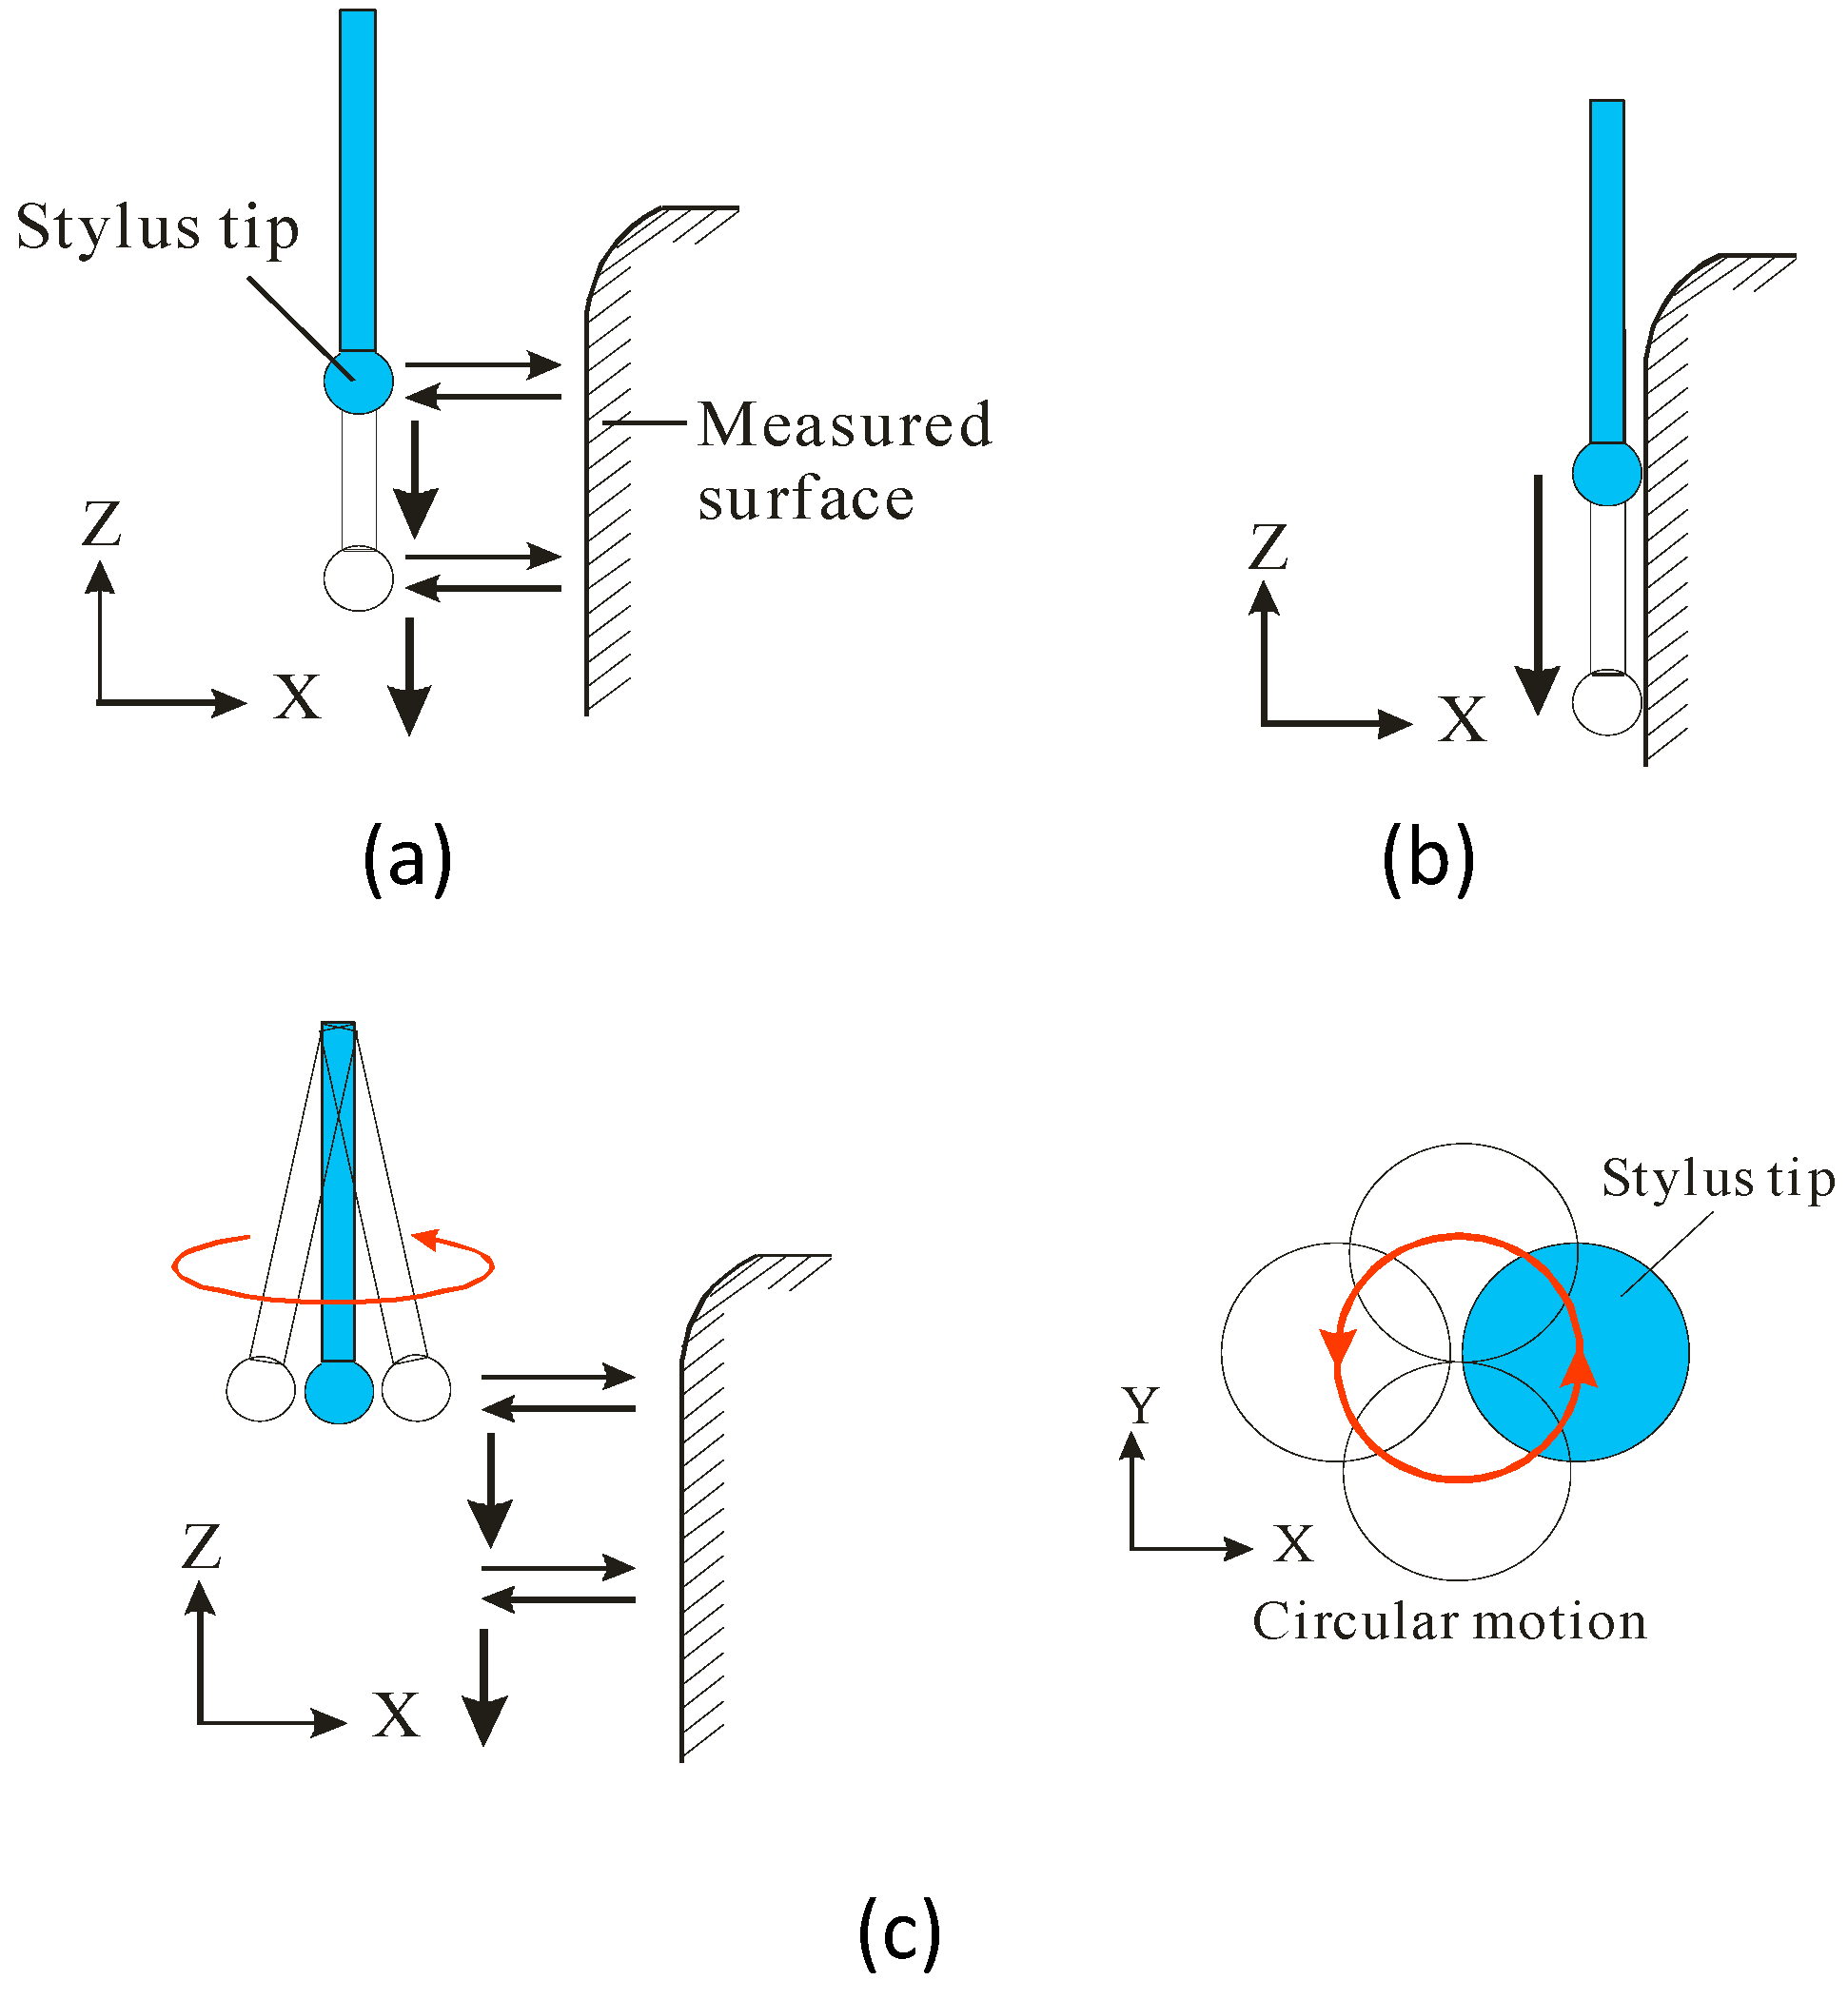
As stated in the discussion above, the primary cause of adhesion is the liquid bridge force, which increases with increasing relative humidity. When the measured surface is scanned point by point in the touch-trigger mode, the measurement time increases because the stylus tip is required to be separated from the measured surface on account of the surface force. When the measured surface is scanned continuously in the scanning mode, the measurement accuracy reduces owing to the bending of the stylus shaft due to the adhesion. Therefore, in our previous work, a vibration mechanism was introduced to prevent the adhesion of the stylus tip to the measurement surface caused by the surface force [12]. By this mechanism, the stylus tip is set to vibrate in a circular motion, where it traces a circle of diameter 0.4 µm in the X-Y plane. However, the stylus shaft actually traces an elliptical path. The difference between the profile of the perfect circle and that of the actual elliptical path of the stylus tip leads to measurement errors. Moreover, the surface roughness cannot be measured in the scanning mode when using the vibrating fiber probe.
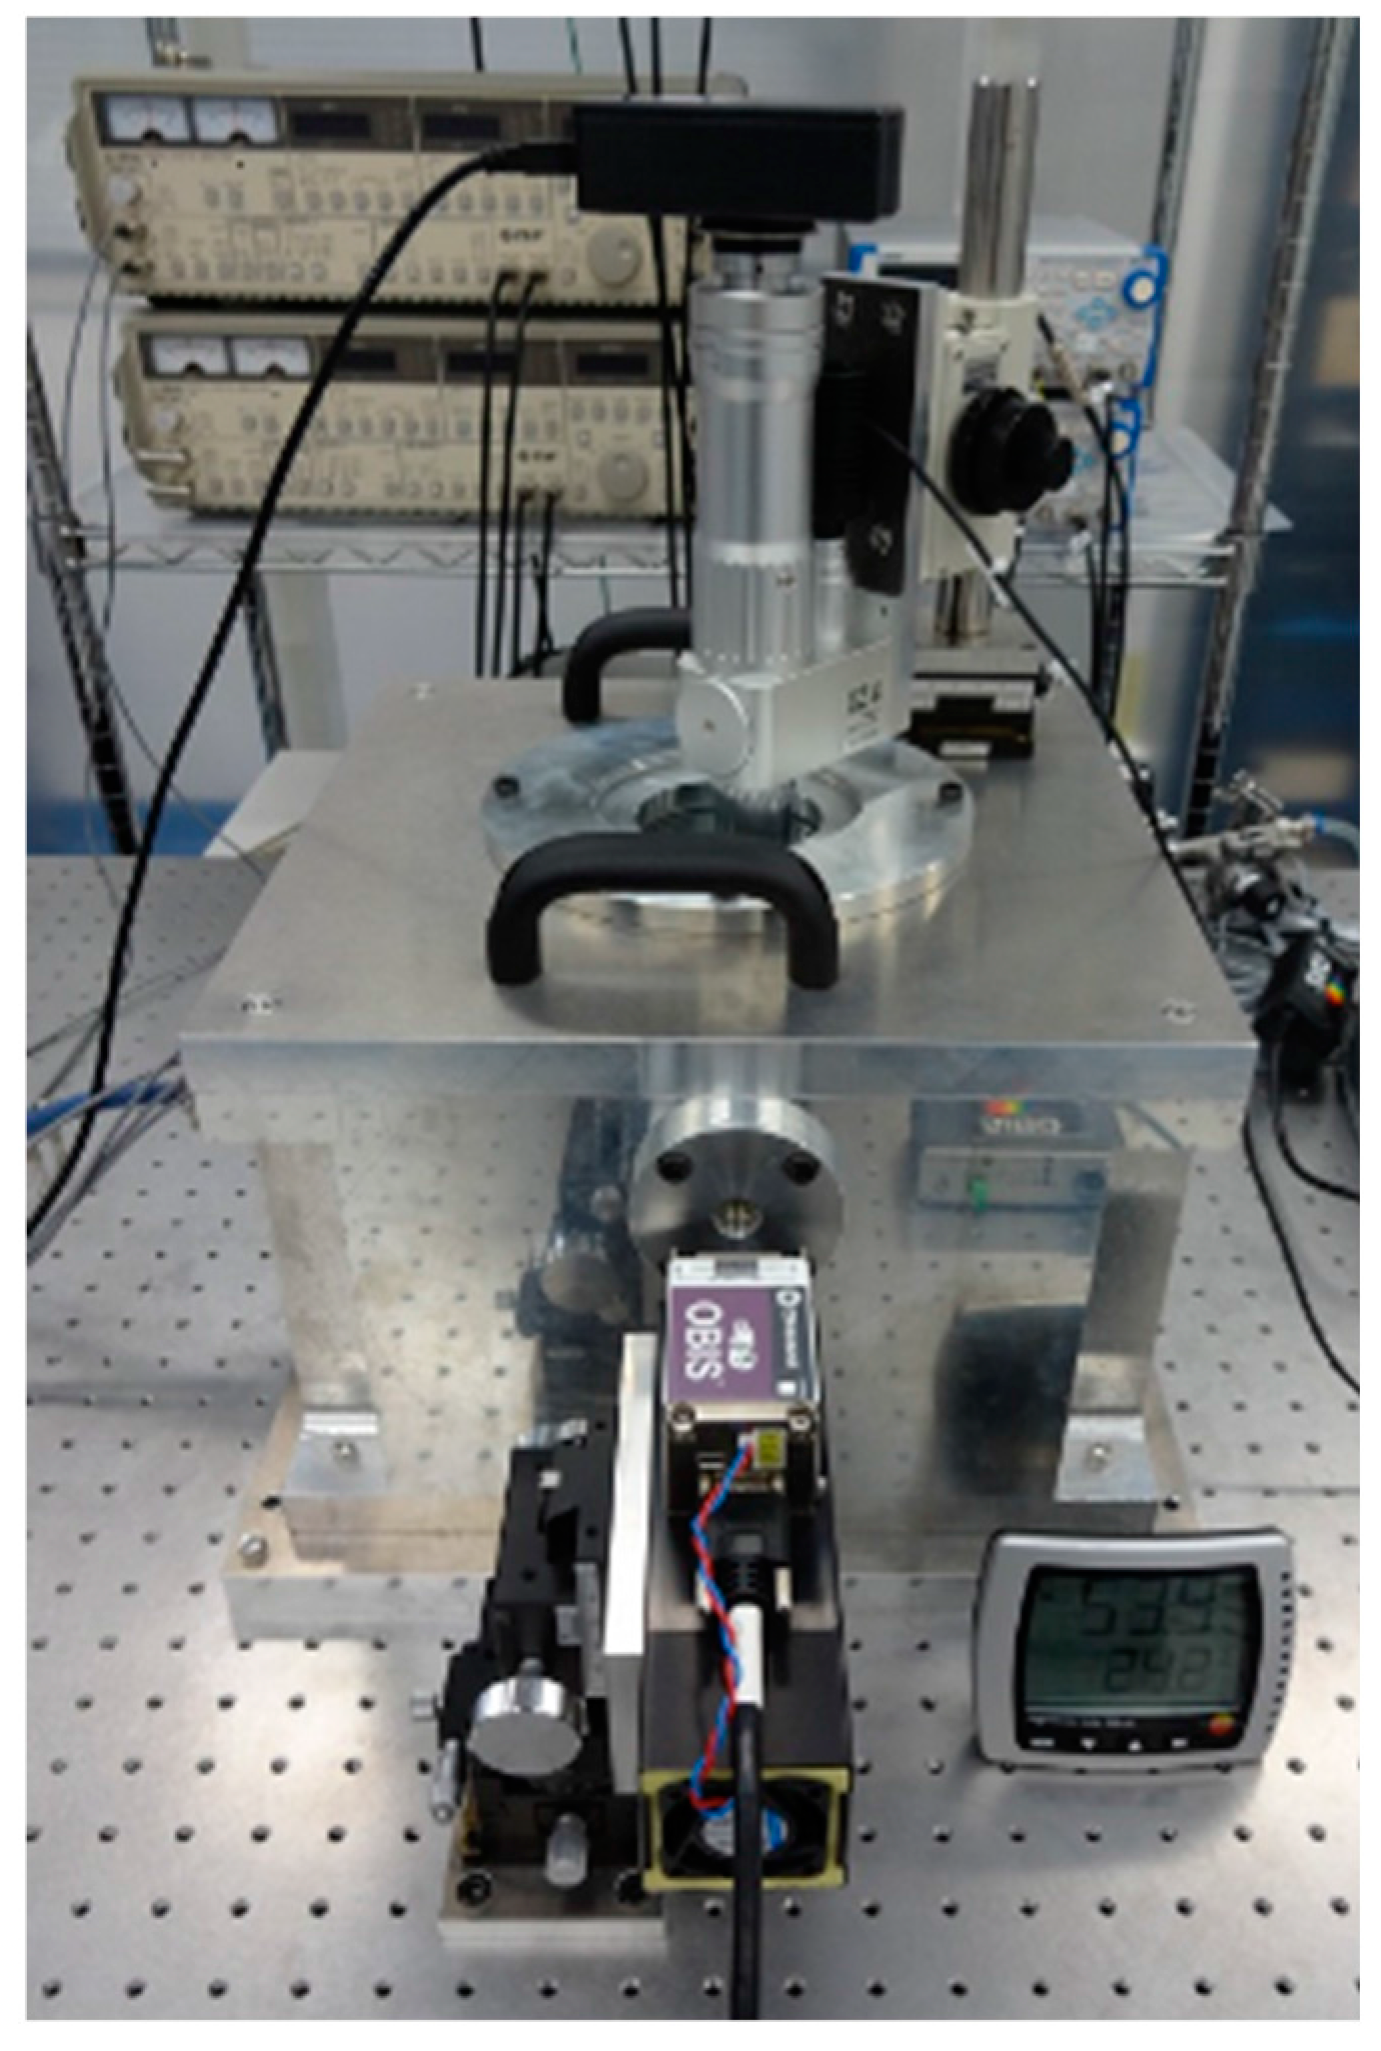
Therefore, the measurement system, placed in a vacuum vessel, is constructed suitably to prevent adhesion of the stylus tip to the measured surface caused by the surface force. Figure 8 shows a photograph of the measurement system in the vacuum vessel. The effects of pressure inside the vacuum vessel on the surface force are evaluated experimentally. In the experiment, the relative humidity is 61% and the temperature is 25.1 °C.
First, the measurement method of the surface force is explained as follows. There are many techniques for measuring surface forces, such as those involving the surface forces apparatus (SFA), atomic force microscopy (AFM), micro cantilever (MC), optical trapping (OT), etc. [13,14,
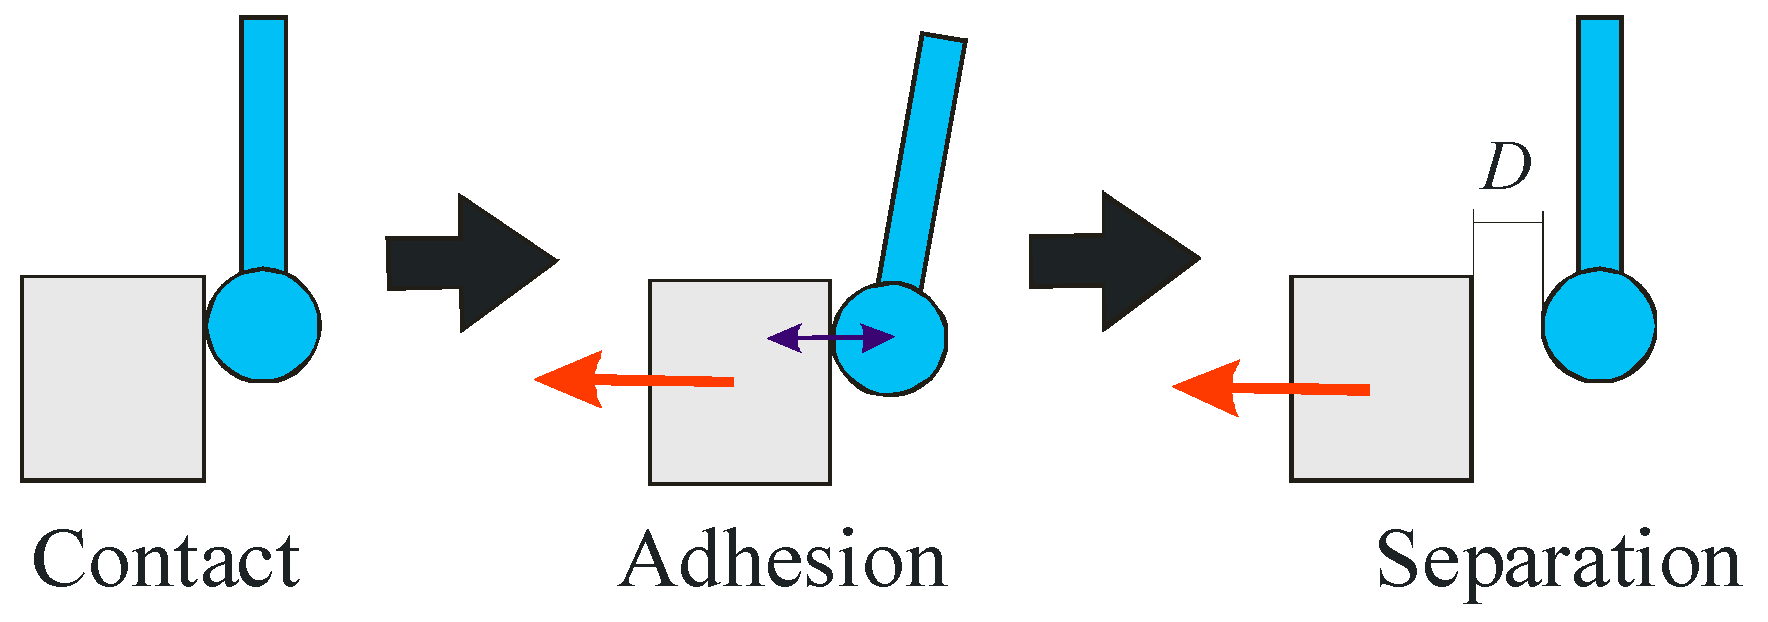
15]. The SFA can directly measure the force between two surfaces in controlled vapors or immersed in liquids. The force sensitivity of the SFA is about 10 nN. The SFA contains two curved molecularly smooth surfaces of mica between which the interaction forces are measured using a variety of force-measuring springs. AFM is, in principle, similar to the SFA except that forces are measured not between two macroscopic surfaces but between a fine tip and a surface. The force sensitivity of AFM is 1–10 pN. The measuring method using the optical fiber probe is, in principle, similar to the SFA and AFM. As shown in Figure 9, after the stylus tip comes into contact with the measured surface, the stylus tip is displaced in the backward direction by using the piezoelectric stage, due to which it separates from the measured surface. Because the stylus tip is displaced while maintaining its contact with the measured surface, the stylus shaft is deflected and the force required to separate the stylus tip from the measured surface is generated by the deflection of the stylus shaft. With an increase in the displacement of the stylus tip, this required force also increases. Therefore, the stylus tip can be separated from the measured surface when the displacement D of the stylus tip exceeds a certain value.
The load acting on the stylus tip, i.e., the surface force, is calculated by assuming that the optical fiber probe, 2.5 µm in diameter and 0.38 mm in length, is equal to the cantilever of the fixed support. In other words, the surface force is calculated by the deflection of the stylus shaft. The surface force F is calculated using Equation (7).
F = 3 E I L 3 · D
where E, I, and L are the Young’s modulus, the geometrical moment of inertia, and the length of the stylus shaft, respectively. 
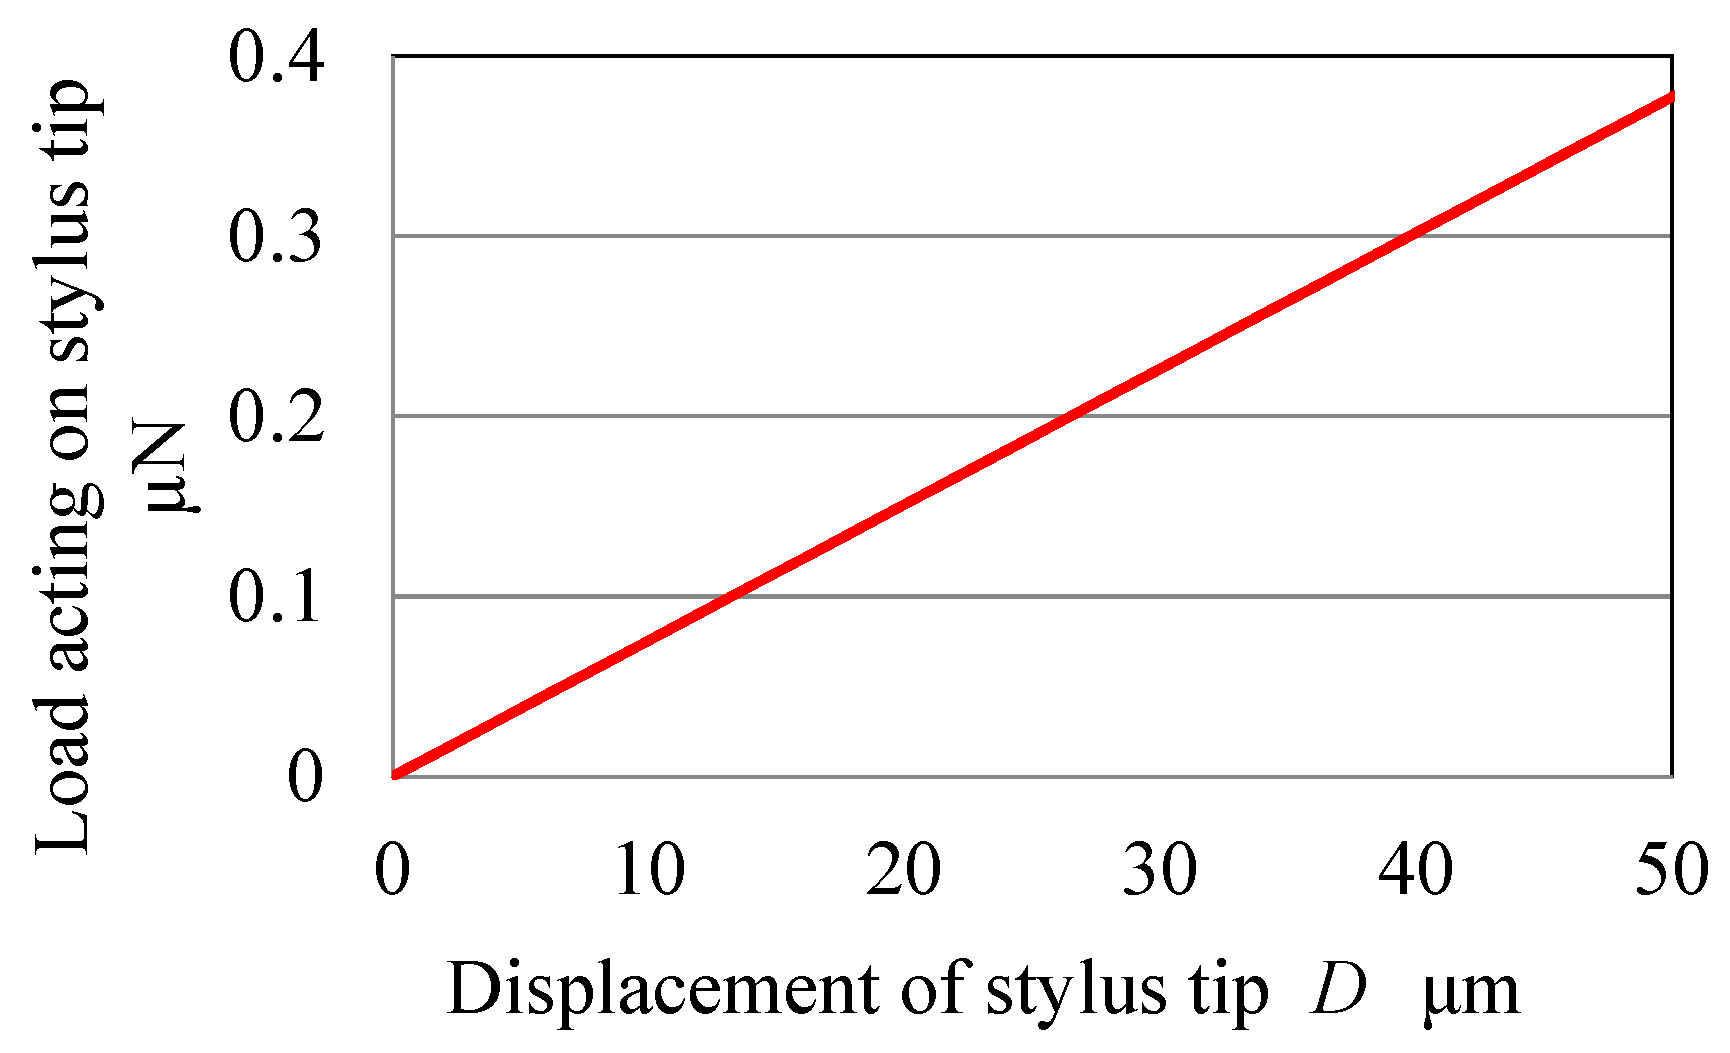
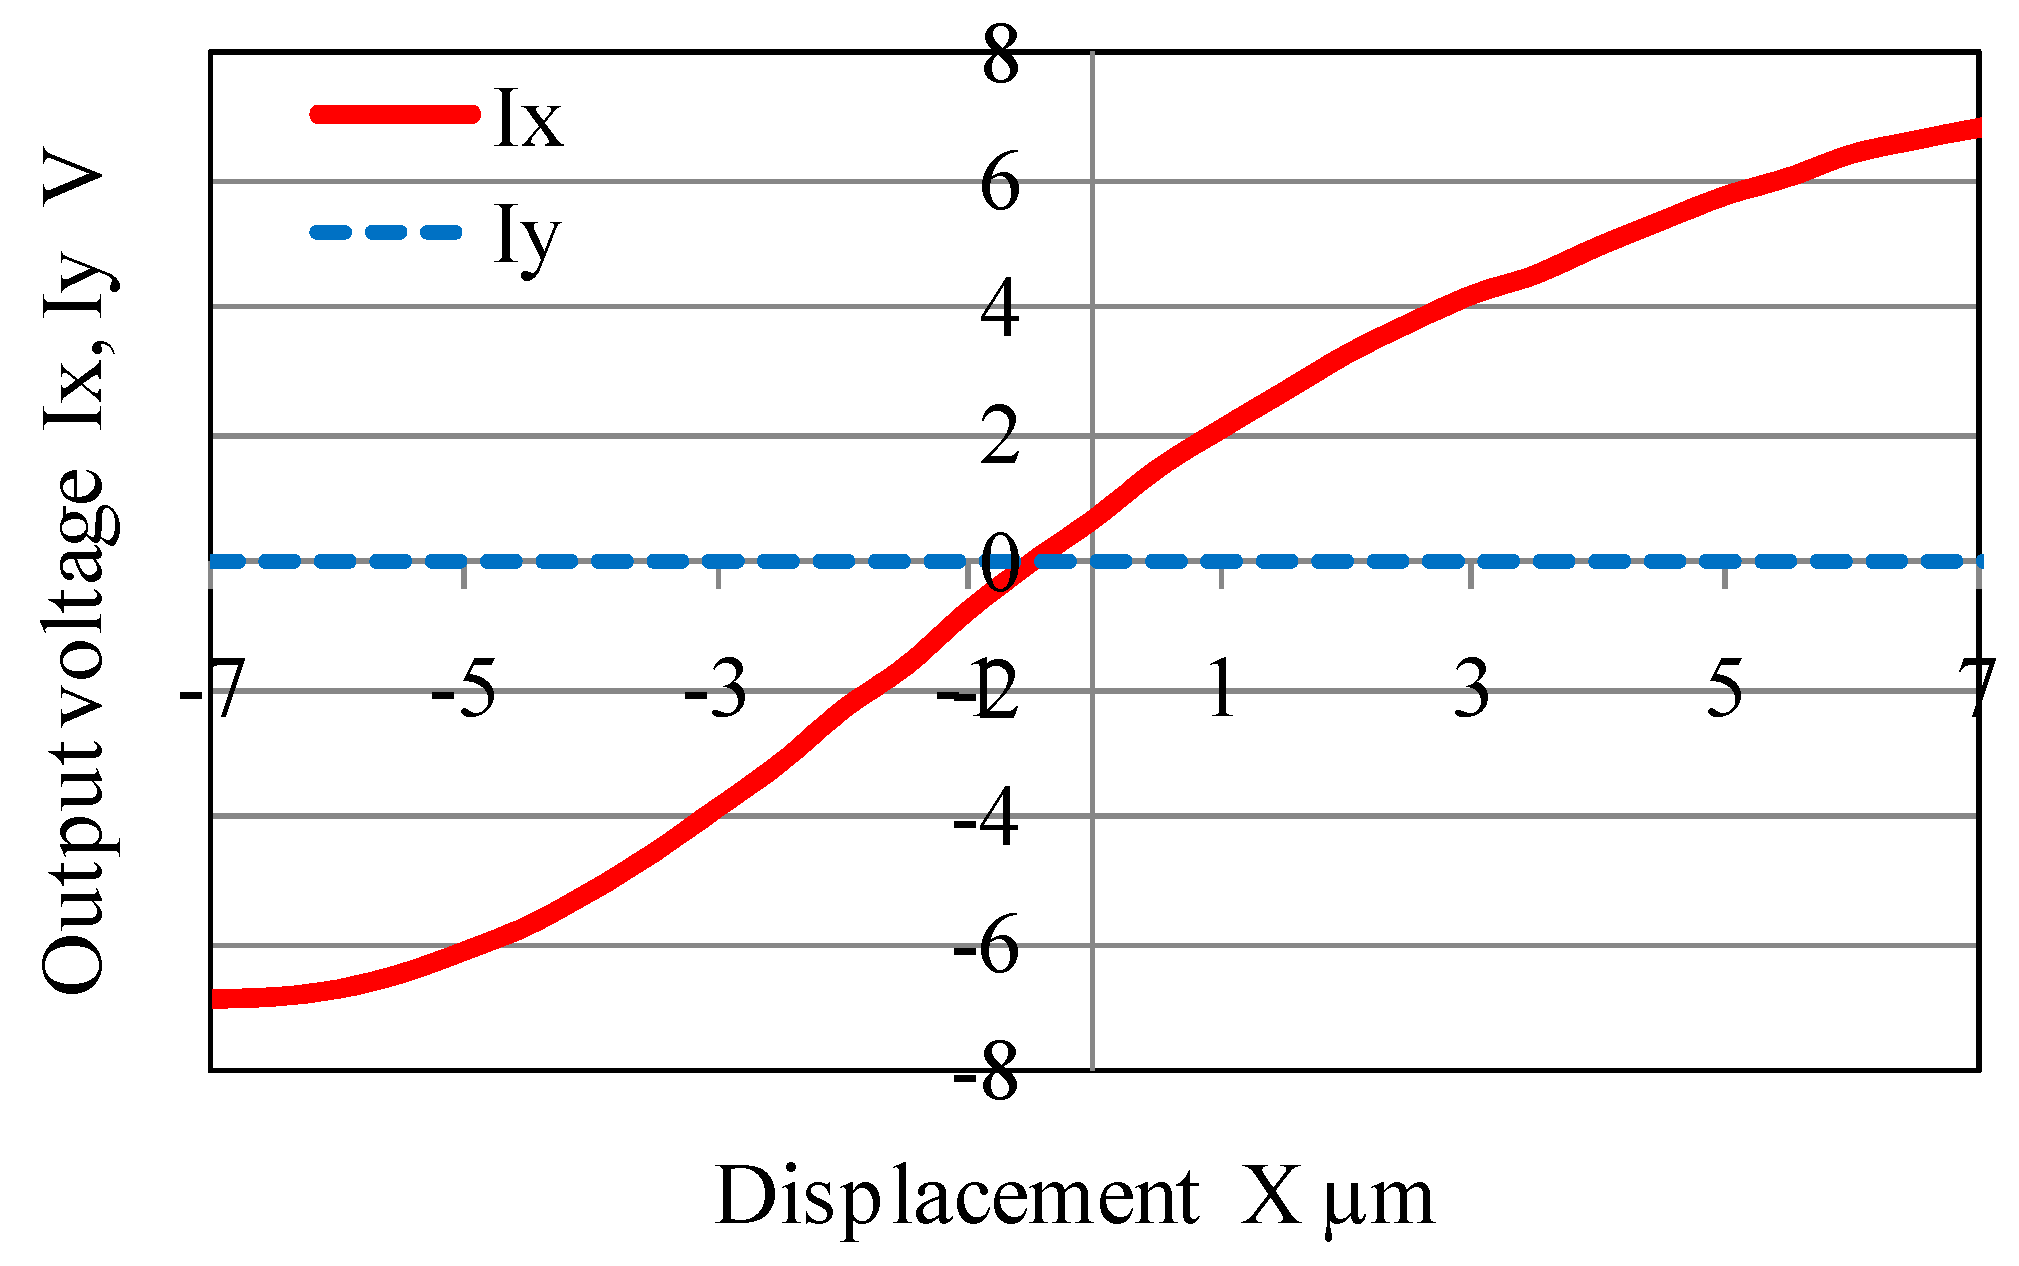
Figure 10 shows the load acting on the stylus tip under the assumption that the stylus shaft (Young’s modulus E = 72 GPa) is equivalent to the cantilever of the fixed support. In this figure, the horizontal axis represents displacement of the stylus tip, and the vertical axis represents the load acting on the stylus tip. For example, when the displacement D required to separate the stylus tip from the measured surface is about 20 µm, the load acting on the stylus tip is about 0.15 µN immediately before the stylus tip is separated from the measured surface as shown in Figure 10. Therefore, this value of 0.15 µN is regarded as the surface force. In this experiment, the spring constant of the stylus shaft is not calibrated. However, to accurately measure the surface force, it is necessary to calibrate it [16,17,18,19].
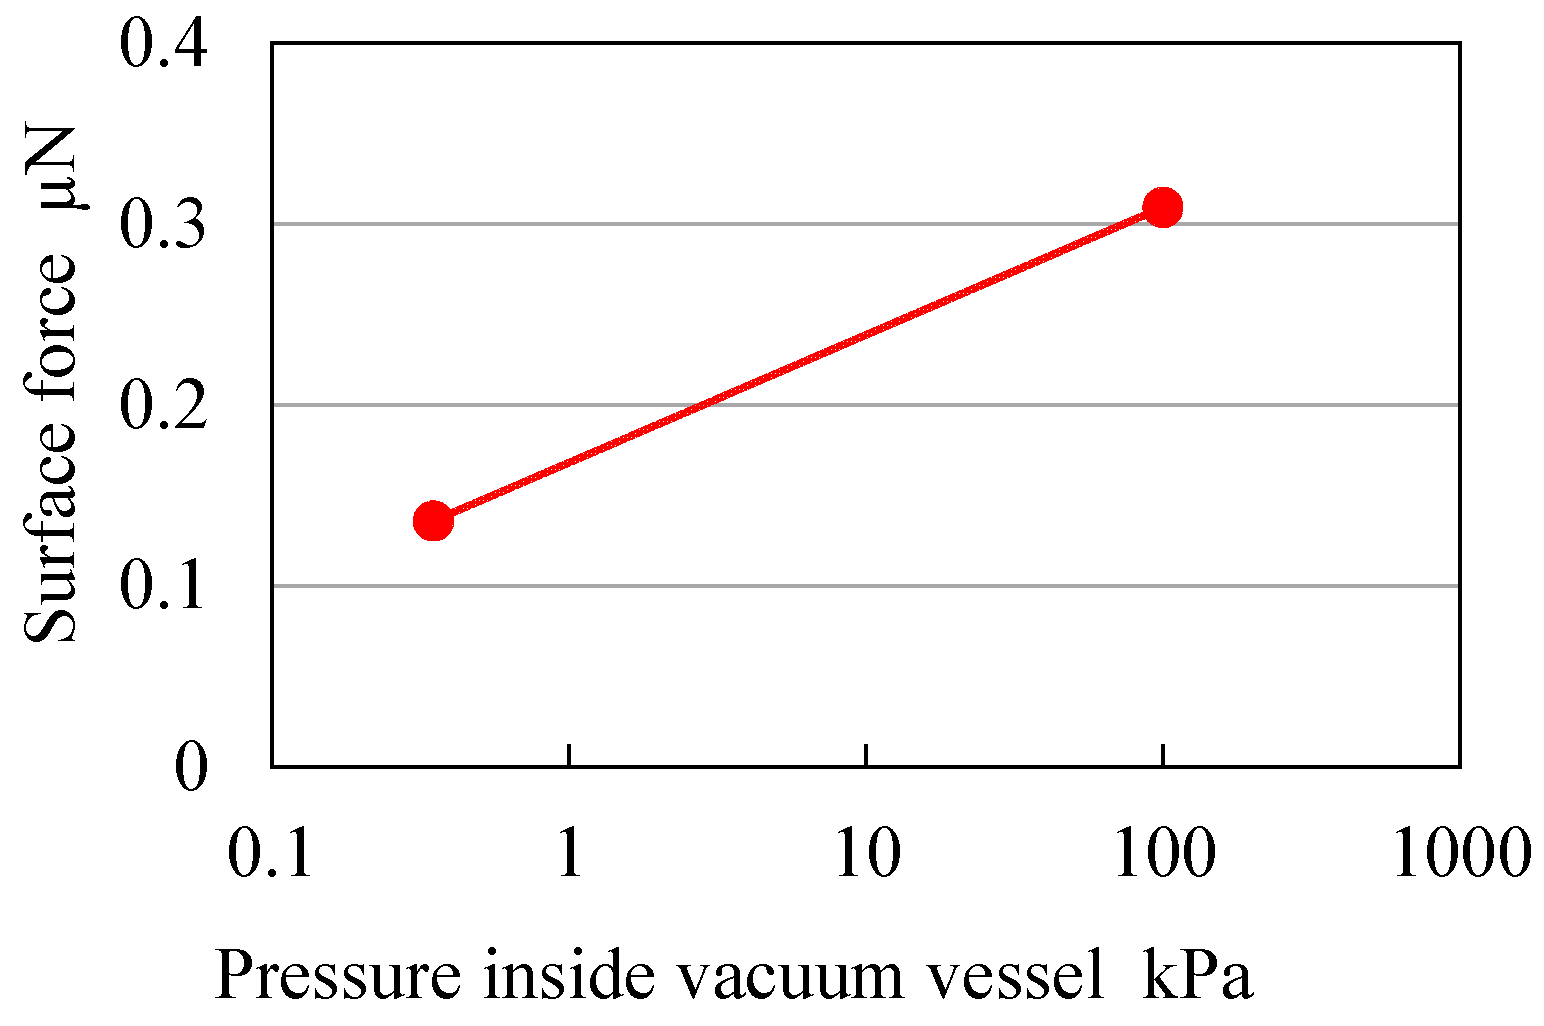
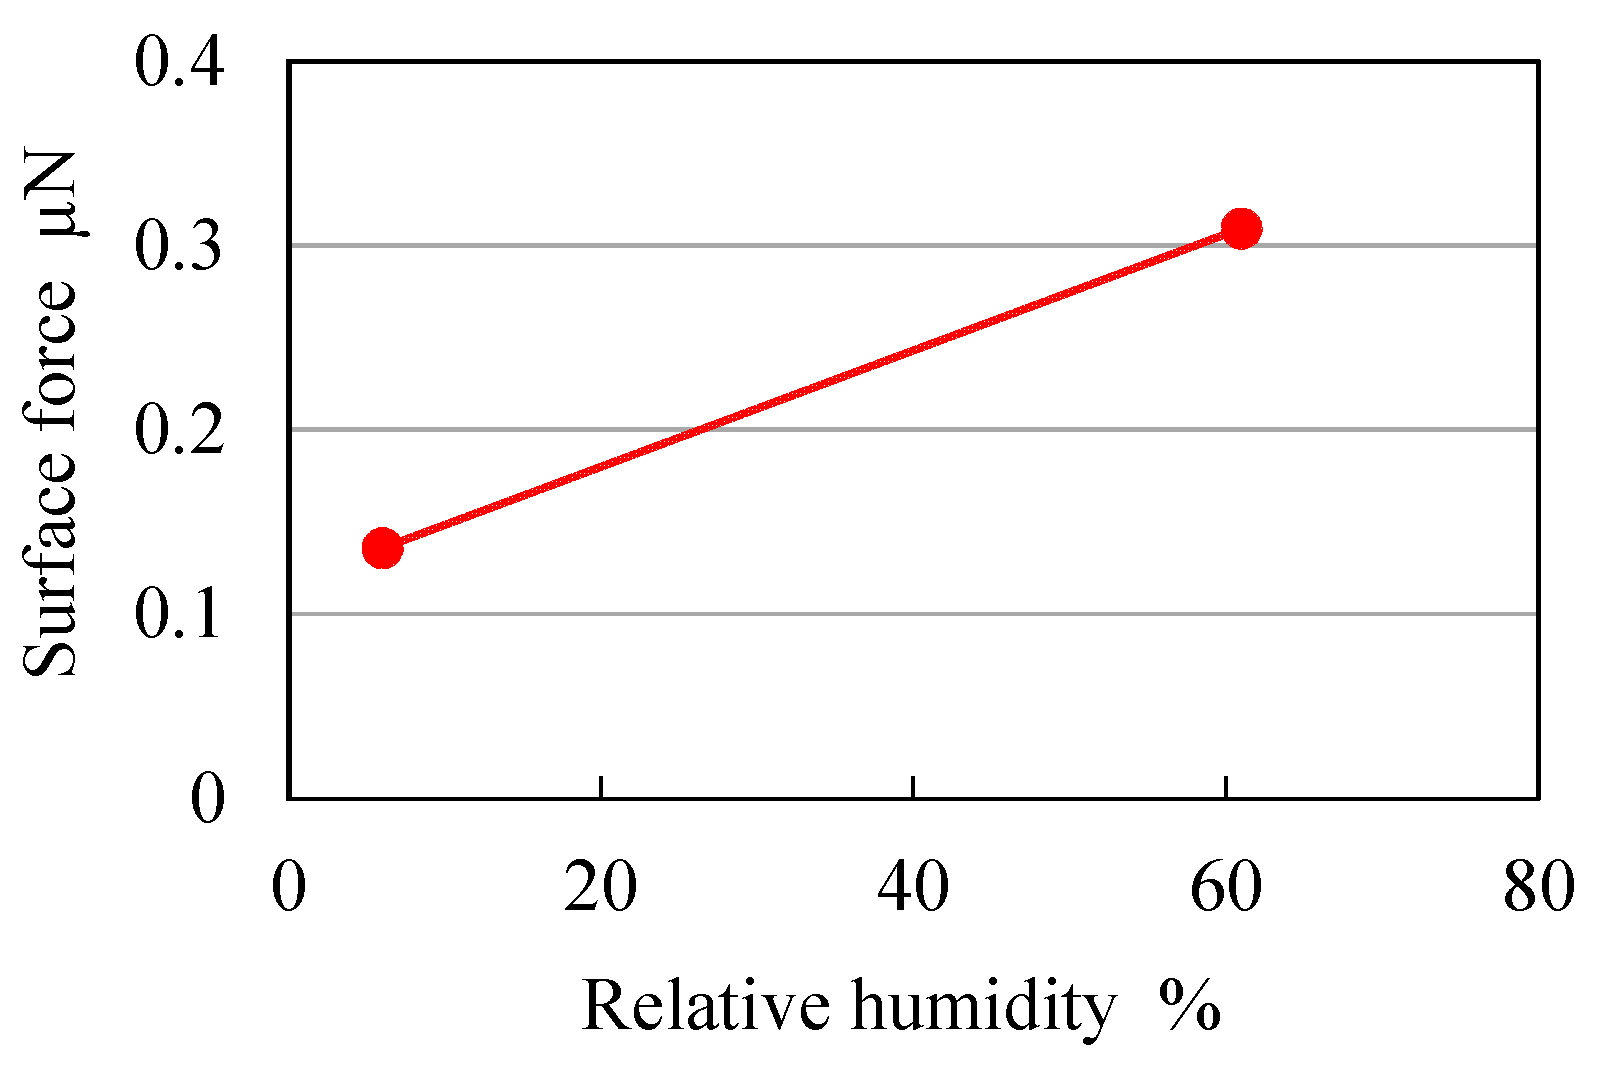
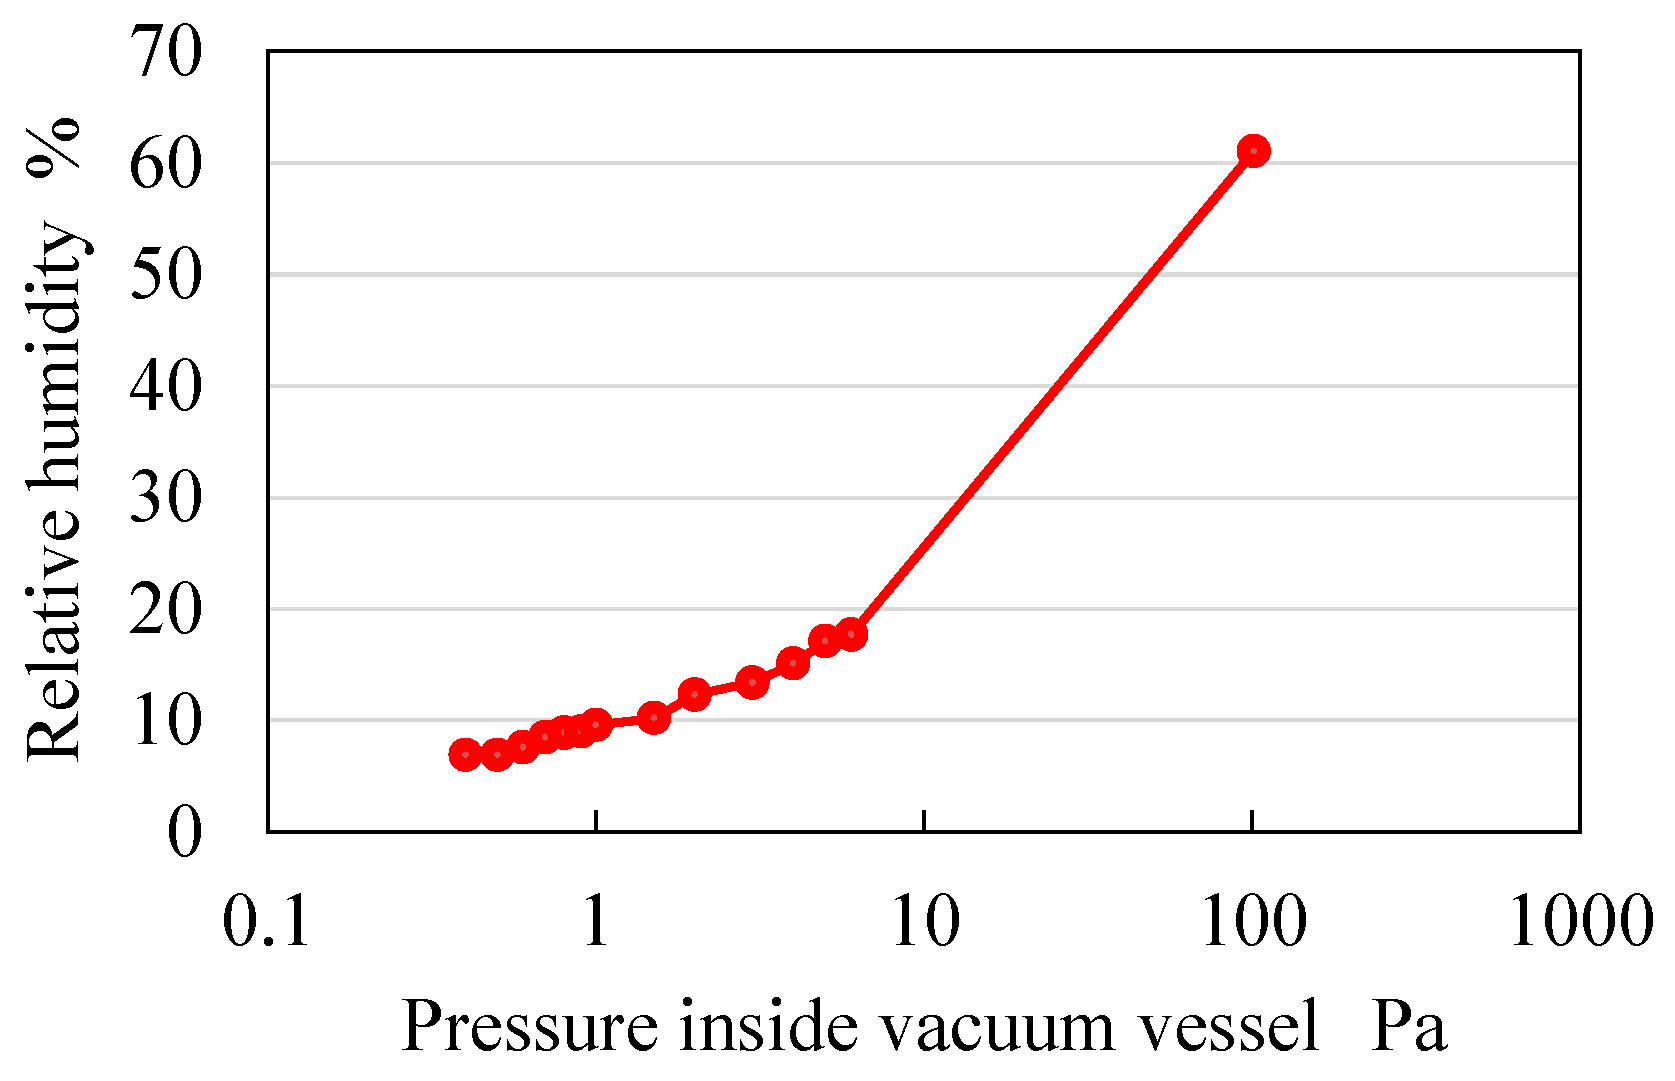
Figure 11 shows the relationship between the pressure inside the vacuum vessel and the relative humidity. Further, Figure 12 shows the relationship between the pressure inside the vacuum vessel and the surface forces. Finally, Figure 13 shows the relationship between the relative humidity and the surface force. From Figure 13, it is confirmed that surface force decreases with decreasing relative humidity. It is found that the surface force is 0.13 µN when pressure inside the vacuum vessel and relative humidity are 350 Pa and 7% RH, respectively. This effect is equivalent to a 60% reduction in the surface force in the atmosphere. However, a large residual surface force still acts between the stylus tip and the measured surface. This is because the amount of van der Waals force is almost the same as that of the liquid bridge force. Therefore, the surface force is thought to reduce by slightly a little more than 60%. When the stylus tip diameter is 5 µm as shown in Figure 6, the theoretical van der Waals force in a vacuum environment is about 0.36 µN. However, according to the obtained experimental results, the van der Waals force in a vacuum environment is about 0.13 µN. Thus, the theoretical and experimental results are different. Because the amount of van der Waals force is affected by the surface roughness of the stylus tip and that of the measurement surface [11], the surface roughness of the stylus tip and that of the measurement surface are, in turn, thought to be affected by the amount of van der Waals force.

4.3. Alternative Reduction Method for Surface Force

According to the above-mentioned experimental results, it is possible to reduce the liquid bridge force considerably by using a vacuum vessel. However, in scenarios where the use of a vacuum vessel is difficult, the stylus tip coated with a water-repellent coating has the potential to reduce the liquid bridge force. In order to reduce the van der Waals force, a stylus tip made of a material with a small Hamarker constant may be used. For example, the Hamaker constants of SiO2, Fe, Si, Cu, and Au are 8.55, 21.2, 25.6, 28.4, and 45.5 × 10⁻²⁰ J, respectively. However, in practice, the use of a material with a small low Hamarker constant can be difficult. In such cases, a stylus tip coated with a material with a small Hamarker constant may be used. The effect of the material of the stylus tip can be made negligible by using a coating that is several nanometers thick. The influence of the electrostatic force on the surface force is small; however, it is believed that various methods of removal of electricity or antistatic agents could be useful in reducing the electrostatic force.

5. Conclusions

In this study, the stylus characteristics are examined, and then, surface forces are analyzed in order to investigate the causes of adhesion, which reduces the measurement accuracy. The analysis results of surface forces reveal the liquid bridge force to be the primary cause of adhesion. Therefore, the measurement system placed in the vacuum vessel is constructed suitably to prevent adhesion of the stylus tip to the measured surface because of the surface forces, mainly by reducing the liquid bridge force. As a result, it is found that the surface force is 0.13 µN when the pressure inside the vacuum vessel is 350 Pa. This effect is equivalent to a 60% reduction in the surface force in the atmosphere.

Acknowledgments

This study was partly supported by a research grant from the Mitutoyo Association for Science and Technology and by JSPS KAKENHI Grant Number 26420392.

Author Contributions

Hiroshi Murakami conceived and wrote the paper; Akio Katsuki and Takao Sajima manufactured the vacuum vessel and analyzed the data; Hiroshi Murakami and Mitsuyoshi Fukuda performed the experiments and analyzed the surface forces.

Conflicts of Interest

The authors declare no conflict of interest.

References

  1. Masuzawa, T.; Hamasaki, Y.; Fujino, M. Vibroscanning method for nondestructive measurement of small holes. CIRP Ann. 1993, 42, 589–592. [Google Scholar] [CrossRef]
  2. Hidaka, K.; Saito, A.; Koga, S. Study of a micro-roughness probe with ultrasonic sensor. CIRP Ann. 2008, 57, 489–492. [Google Scholar] [CrossRef]
  3. Bauza, M.B.; Hocken, R.J.; Smith, S.T.; Woody, S.C. Development of a virtual probe tip with an application to high aspect ratio microscale features. Rev. Sci. Instrum. 2005, 76. [Google Scholar] [CrossRef]
  4. Claverley, J.D.; Leach, R.K. A vibrating micro-scale CMM probe for measuring high aspect ratio structures. Microsyst. Technol. 2010, 16, 1507–1512. [Google Scholar] [CrossRef]
  5. Shiramatsu, T.; Kitano, K.; Kawata, M.; Mitsui, K. Development of a measuring method for shape and dimension of micro-components. Modification to the original measuring system, calibration of the probes and the results of dimensional measurements. JSME Int. J. Ser. C Mech. Syst. 2002, 68, 267–274. [Google Scholar] [CrossRef]
  6. Schwenke, H.; Wӓldele, F.; Weiskrich, C.; Kunzmann, H. Opto-Tactile sensor for 2D and 3D measurement of small structures on coordinate measuring machines. CIRP Ann. 2001, 50, 361–364. [Google Scholar] [CrossRef]
  7. Muralikrishnan, B.; Stone, J.A.; Stoup, J.R. Fiber deflection probe for small hole metrology. Precis. Eng. 2006, 30, 154–164. [Google Scholar] [CrossRef]
  8. Michihata, M.; Takaya, Y.; Hayashi, T. Development of the nano-probe system based on the laser-trapping technique. CIRP Ann. 2008, 57, 493–496. [Google Scholar] [CrossRef]
  9. Liebrich, T.; Knapp, W. New concept of a 3D-probing system for micro-components. CIRP Ann. 2010, 59, 513–516. [Google Scholar] [CrossRef]
  10. Murakami, H.; Katsuki, A.; Onikura, H.; Sajima, T.; Kawagoishi, N.; Kondo, E. Development of a system for measuring micro hole accuracy using an optical fiber probe. J. Adv. Mech. Des. Syst. Manuf. 2010, 5, 995–1004. [Google Scholar] [CrossRef]
  11. Okuyama, K.; Masuda, H.; Morooka, S. Biryushi Kogaku; Ohmsha: Tokyo, Japan, 1992. [Google Scholar]
  12. Murakami, H.; Katsuki, A.; Sajima, T.; Suematsu, T. Study of a vibrating fiber probing system for 3-D micro-structures: Performance improvement. Meas. Sci. Technol. 2014, 25. [Google Scholar] [CrossRef]
  13. Israelachvili, J.N. Intermolecular and Surface Forces: Revised Third Edition; Academic Press: Waltham, MA, USA, 2011; pp. 227–247. [Google Scholar]
  14. Lee, M.; Kim, B.; Kim, J.; Jhe, W. Noncontact friction via capillary shear interaction at nanoscale. Nat. Commun. 2015, 6. [Google Scholar] [CrossRef] [PubMed]
  15. Yongho, S.; Wonho, J. Atomic force microscopy and spectroscopy. Rep. Prog. Phys. 2008, 71. [Google Scholar] [CrossRef]
  16. Guebum, H.; Ahn, H.S. Calibration of effective spring constants of colloidal probes using reference cantilever method. Coll. Surf. A Physicochem. Eng. Asp. 2015, 489, 86–94. [Google Scholar]
  17. Song, Y.P.; Wu, S.; Xu, L.Y.; Zhang, J.M.; Dorantes-Gonzalez, D.J.; Fu, X.; Hu, X.D. Calibration of the effective spring constant of ultra-short cantilevers for a high-speed atomic force microscope. Meas. Sci. Technol. 2015, 26. [Google Scholar] [CrossRef]
  18. Slattery, A.D.; Blanch, A.J.; Ejov, V.; Quinton, J.S.; Gibson, C.T. Spring constant calibration techniques for next-generation fast-scanning atomic force microscope cantilevers. Nanotechnology 2014, 25. [Google Scholar] [CrossRef] [PubMed]
  19. Slattery, A.D.; Blanch, A.J.; Quinton, J.S.; Gibson, C.T. Calibration of atomic force microscope cantilevers using standard and inverted static methods assisted by FIB-milled spatial markers. Nanotechnology 2013, 24. [Google Scholar] [CrossRef] [PubMed]
Figure 1. Various types of probes. (a) Touch-trigger probe; (b) scanning probe; and (c) vibrating probe (touch-trigger mode).
Applsci 06 00153 g001
Figure 2. Measurement system using optical fiber probe.
Applsci 06 00153 g002
Figure 3. Principle of measurement. (a) initial stage; (b) displacement in X-direction; and (c) displacement in Y-direction.
Applsci 06 00153 g003
Figure 4. Changes in output voltages IX and IY induced by displacement in ±X-direction.
Applsci 06 00153 g004
Figure 5. Schematic diagram of surface force between stylus tip and measured surface.
Applsci 06 00153 g005
Figure 6. Relationship between stylus tip diameter and surface forces: A (SiO2) = 1.5 × 10⁻²⁰ J, z = 0.4 nm, ε0 = 8.85 × 10⁻¹² F·m−1, ε = ∞, σ = 26.5 µC·m−2.
Applsci 06 00153 g006
Figure 7. Relationship between relative humidity and surface force (stylus tip diameter: 5 µm).
Applsci 06 00153 g007
Figure 8. Photograph of measurement system in vacuum vessel.
Applsci 06 00153 g008
Figure 9. Experimental apparatus for measurement of surface force.
Applsci 06 00153 g009
Figure 10. Load acting on the stylus tip (stem length: 0.38 mm, stem diameter: 2.5 µm, and ball diameter: 5 µm).
Applsci 06 00153 g010
Figure 11. Relationship between pressure inside vacuum vessel and relative humidity.
Applsci 06 00153 g011
Figure 12. Relationship between pressure inside vacuum vessel and surface forces.
Applsci 06 00153 g012
Figure 13. Relationship between relative humidity and surface forces.
Applsci 06 00153 g013

