
A Review of Physical and Perceptual Feature Extraction Techniques for Speech, Music and Environmental Sounds


Abstract
:
1. Introduction
2. Machine Hearing
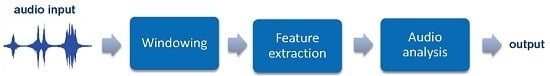
2.1. Architecture of Machine Hearing Systems
2.2. Key Differences among Speech, Music and Environmental Sounds
3. Audio Features Taxonomy and Review of Extraction Techniques
4. Physical Audio Features Extraction Techniques
4.1. Time Domain Physical Features
4.1.1. Zero-Crossing Rate-Based Physical Features
- Zero-crossing rate (ZCR): it is defined as the number of times the audio signal waveform crosses the zero amplitude level during a one second interval, which provides a rough estimator of the dominant frequency component of the signal (Kedem [39]). Features based on this criterion have been applied to speech/music discrimination, music classification (Li et al. [40], Bergstra et al. [41], Morchen et al. [42], Tzanetakis and Cook [28], Wang et al. [9])), singing voice detection in music and environmental sound recognition (see the works by Mitrović et al. [17] and Peltonen et al. [18]), musical instrument classification (Benetos et al. [10]), voice activity detection in noisy conditions (Ghaemmaghami et al. [43]) or for audio-based surveillance systems (as in Rabaoui et al. [24]).
- Linear prediction zero-crossing ratio (LP-ZCR): this feature is defined as the ratio between the ZCR of the original audio and the ZCR of the prediction error obtained from a linear prediction filter (see El-Maleh et al. [44]). Its use is intended for discriminating between signals that show different degree of correlation (e.g., between voiced and unvoiced speech).
4.1.2. Amplitude-Based Features
- Amplitude descriptor (AD): it allows for distinguishing sounds with different signal envelopes, being applied, for instance, for the discrimination of animal sounds (Mitrović et al. [46]). It is based on collecting the energy, duration, and variation of duration of signal segments based on their high and low amplitude by means of an adaptive threshold (a level-crossing computation).
- MPEG-7 audio waveform (AW): this feature is computed from a downsampled waveform envelope, and it is defined as the maximum and minimum values of a function of a non-overlapping analysis time window [45]. AW has been used as a feature in environmental sound recognition, like in the works of Muhammad and Alghathbar [47], or by Valero and Alías [48].
- Shimmer: it computes the cycle-to-cycle variations of the waveform amplitude. This feature has been generally applied to study pathological voices (Klingholz [49], Kreiman and Gerratt [50], Farrús et al. [51]). However, it has also been applied to discriminate vocal and non-vocal regions from audio in songs (as in Murthy and Koolagudi [52]), characterize growl and screaming singing styles (Kato and Ito [53]), prototype, classify and create musical sounds (Jenssen [54]) or to improve speaker recognition and verification (Farrús et al. [51]) to name a few.
4.1.3. Power-Based Features
- Short-time energy: using a frame-based procedure, short-time energy (STE) can be defined as the average energy per signal frame (which is in fact the MPEG-7 audio power descriptor [45]). Nevertheless, there exist also other STE definitions in the literature that compute power in the spectral domain (e.g., see Chu et al. [55]). STE can be used to detect the transition from unvoiced to voices speech and vice versa (Zhang and Kuo [56]). This feature has also been used in applications like musical onset detection (Smith et al. [57]), speech recognition (Liang and Fan [58]), environmental sound recognition (Peltonen et al. [18], Muhammad and Alghathbar [47], Valero and Alías [48]) and audio-based surveillance systems (Rabaoui et al. [24]).
- MPEG-7 temporal centroid: it represents the time instant containing the signal largest average energy, and it is computed as the temporal mean over the signal envelope (and measured in seconds) [45]. The temporal centroid has been used as an audio feature in the field of environmental sound recognition, like in the works by Muhammad and Alghathbar [47], and Valero and Alías [48]).
- MPEG-7 log attack time: it characterizes the attack of a given sound (e.g., for musical sounds, instruments can generate either smooth or sudden transitions) and it is computed as the logarithm of the elapsed time from the beginning of a sound signal to its first local maximum [45]. Besides being applied to musical onset detection (Smith et al. [57]), log attack time (LAT) has been used for environmental sound recognition (see Muhammad and Alghathbar [47], and Valero and Alías [48]).
4.1.4. Rhythm-Based Physical Features
- Pulse metric: this is a measure that uses long-time band-passed autocorrelation to determine how rhythmic a sound is in a 5-second window (as defined by Scheirer and Slaney [61]). Its computation is based on finding the peaks of the output envelopes in six frequency bands and its further comparison, giving a high value when all subbands present a regular pattern. This feature has been used for speech/music discrimination.
- Pulse clarity: it is a high-level musical dimension that conveys how easily in a given musical piece, or a particular moment during that piece, listeners can perceive the underlying rhythmic or metrical pulsation (as defined in the work by Lartillot et al. [62]). In that work, the authors describe several descriptors to compute pulse clarity based on approaches such as the analysis of the periodicity of the onset curve via autocorrelation, resonance functions, or entropy. This feature has been employed to discover correlations with qualitative measures describing overall properties of the music used in psychology studies in the work by Friberg et al. [63].
- Band periodicity: this is a measure of the strength of rhythmic or repetitive structures in audio signals (see Lu et al. [64]). Band periodicity is defined within a frequency band, and it is obtained as the mean value along all the signal frames of the maximum peak of the subband autocorrelation function.
- Beat spectrum/spectrogram: it is a two-dimensional parametrization based on time variations and lag time, thus providing an interpretable representation that reflects temporal changes of tempo (see the work by Foote [22,65]). Beat spectrum shows relevant peaks at rhythm periods that match the rhythmic properties of the signal. Beat spectrum can be used for discriminating between music (or between parts within an entire music signal) with different tempo patterns.
- Cyclic beat spectrum: or CBS for short, this is a representation of the tempo of a music signal that groups multiples of the fundamental period of the signal together in a single tempo class (Kurth et al. [66]). Thus, CBS gives a more compact representation of the fundamental beat period of a song. This feature has been employed in the field of audio retrieval.
- Beat tracker: this a feature is derived following an algorithmic approach based on signal subband decomposition and the application of a comb filter analysis in each subband (see Scheirer [67]). Beat tracker mimics at large extent the human ability to track rhythmic beats in music and allows obtaining not only tempo but also compute beat timing positions.
- Beat histogram: it provides a more general tempo perspective and summarizes the beat tempos present in a music signal (Tzanetakis and Cook [28]). In this case, Wavelet transform (see Section 4.3 for further details) is used to decompose the signal in octaves for performing subsequent accumulation of the most salient periodicities in each subband to generate the so-called beat histogram. This feature has been used for music genre classification [28].
4.2. Frequency Domain Physical Features
- Autoregression-based
- STFT-based
- Brightness-related
- Tonality-related
- Chroma-related
- Spectrum shape-related
4.2.1. Autoregression-Based Frequency Features
- Linear prediction coefficients: or LPC for short, this feature represents an all-pole filter that captures the spectral envelope (SE) of a speech signal (formants or spectral resonances that appear in the vocal tract), and have been extensively used for speech coding and recognition applications. LPC have been applied also in audio segmentation and general purpose audio retrieval, like in the works by Khan et al. [68,69].
- Line spectral frequencies: also referred to as Line Spectral Pairs (LSP) in the literature, Line Spectral Frequencies (LSF) are a robust representation of LPC parameters for quantization and interpolation purposes. They can be computed as the roots phases of the palindromic and the antipalindromic polynomials that constitute the LPC polynomial representation, which in turns represent the vocal tract when the glottis is closed and open, respectively (see Itakura [70]). Due to its intrinsic robustness they have been widely applied in a diverse set of classification problems like speaker segmentation (Sarkar and Sreenivas [71]), instrument recognition and in speech/music discrimination (Fu [13]).
- Code excited linear prediction features: or CELP for short, this feature was introduced by Schroeder and Atal [72] and has become one of the most important influences in nowadays speech coding standards. This feature comprises spectral features like LSP but also two codebook coefficients related to signal’s pitch and prediction residual signal. CELP features have been also applied in the environmental sound recognition framework, like in the work by Tsau et al. [73].
4.2.2. STFT-Based Frequency Features
- Subband energy ratio: it is usually defined as a measure of the normalized signal energy along a predefined set of frequency subbands. In a broad sense, it coarsely describes the signal energy distribution of the spectrum (Mitrović et al. [17]). There are different approximations as regards the number and characteristics of analyzed subbands (e.g., Mel scale, ad-hoc subbands, etc.). It has been used for audio segmentation and music analysis applications (see Jiang et al. [60], or Srinivasan et al. [74]) and environmental sound recognition (Peltonen et al. [18]).
- Spectral flux: or SF for short, this feature is defined as the 2-norm of the frame-to-frame spectral amplitude difference vector (see Scheirer and Slaney [61]), and it describes sudden changes in the frequency energy distribution of sounds, which can be applied for detection of musical note onsets or, more generally speaking, detection of significant changes in the spectral distribution. It measures how quickly the power spectrum changes and it can be used to determine the timbre of an audio signal. This feature has been used for speech/music discrimination (like in Jiang et al. [60], or in Khan et al. [68,69]), musical instrument classification (Benetos et al. [10]), music genre classification (Li et al. [40], Lu et al. [12], Tzanetakis and Cook [28], Wang et al. [9]) and environmental sound recognition (see Peltonen et al. [18]).
- Spectral peaks: this feature was defined by Wang [8] as constellation maps that show the most relevant energy bin components in the time-frequency signal representation. Hence, spectral peaks is an attribute that shows high robustness to possible signal distortions (low signal-to-noise ratio (SNR)–see Klingholz [49], equalization, coders, etc.) being suitable for robust recognition applications. This feature has been used for automatic music retrieval (e.g., the well-known Shazam search engine by Wang [8]), but also for robust speech recognition (see Farahani et al. [75]).
- MPEG-7 spectrum envelope and normalized spectrum envelope: the audio spectrum envelope (ASE) is a log-frequency power spectrum that can be used to generate a reduced spectrogram of the original audio signal, as described by Kim et al. [76]. It is obtained by summing the energy of the original power spectrum within a series of frequency bands. Each decibel-scale spectral vector is normalized with the RMS energy envelope, thus yielding a normalized log-power version of the ASE called normalized audio spectrum envelope (NASE) (Kim et al. [76]). ASE feature has been used in audio event classification [76], music genre classification (Lee et al. [77]) and environmental sound recognition (see Muhammad and Alghathbar [47], or Valero and Alías [48]).
- Stereo panning spectrum feature: or SPSF for short, this feature provides a time-frequency representation that is intended to represent the left/right stereo panning of a stereo audio signal (Tzanetakis et al. [78]). Therefore, this feature is conceived with the aim of capturing relevant information of music signals, and more specifically, information that reflects typical postproduction in professional recordings. The additional information obtained through SPSF can be used for enhancing music classification and retrieval system accuracies (Tzanetakis et al. [79]).
- Group delay function: also known as GDF, it is defined as the negative derivative of the unwrapped phase of the signal Fourier transform (see Yegnanarayana and Murthy [80]) and reveals information about temporal localization of events (i.e., signal peaks). This feature has been used for determining the instants of significant excitation in speech signals (like in Smits and Yegnanarayana [81], or Rao et al. [82]) and in beat identification in music performances (Sethares et al. [83]).
- Modified group delay function: or MGDF for short, it is defined as a smoother version of the GDF, reducing its intrinsic spiky nature by introducing a cepstral smoothing process prior to GDF computation. It has been used in speaker identification (Hegde et al. [84]), but also in speech analysis, speech segmentation, speech recognition and language identification frameworks (Murthy and Yegnanarayana [85]).
4.2.3. Brightness-Related Physical Frequency Features
- Spectral centroid: or SC for short, this feature describes the center of gravity of the spectral energy. It can be defined as the first moment (frequency position of the mean value) of the signal frame magnitude spectrum as in the works by Li et al. [40], or by Tzanetakis and Cook [28], or obtained from the power spectrum of the entire signal in MPEG-7. SC reveals the predominant frequency of the signal. In the MPEG-7 standard definition [45], the audio spectrum centroid (ASC) is defined by computing SC over the power spectrum obtained from an octave-frequency scale analysis and roughly describes the sharpness of a sound. SC has been applied in musical onset detection (Smith et al. [57]), music classification (Bergstra et al. [41], Li et al. [40], Lu et al. [12], Morchen et al. [42], Wang et al. [9]), environmental sound recognition (like in Peltonen et al. [18], Muhammad and Alghathbar [47], Valero and Alías [48]) and, more recently, to music mood classification (Ren et al. [86]).
- Spectral center: this feature is defined as the median frequency of the signal spectrum, where both lower and higher energies are balanced. Therefore, is a measure close to spectral centroid. It has been shown to be useful for automatic rhythm tracking in musical signals (see Sethares et al. [83]).
4.2.4. Tonality-Related Physical Frequency Features
- Fundamental frequency: it is also denoted as F0. The MPEG-7 standard defines audio fundamental frequency feature as the first peak of the local normalized spectro-temporal autocorrelation function [45]. There are several methods in the literature to compute F0, e.g., autocorrelation-based methods, spectral-based methods, cepstral-based methods, and combinations (Hess [87]). This feature has been used in applications like musical onset detection (Smith et al. [57]), musical genre classification (Tzanetakis and Cook [28]), audio retrieval (Wold et al. [88]) and environmental sound recognition (Muhammad and Alghathbar [47], Valero and Alías [48]). In the literature F0 is sometimes denoted as pitch as it may represent a rough estimate of the perceived tonality of the signal (e.g., pitch histogram and pitch profile).
- Pitch histogram: instead of using a very specific and local descriptor like fundamental frequency, the pitch histogram describes more compactly the pitch content of a signal. Pitch histogram has been used for musical genre classification by Tzanetakis and Cook [28], as it gives a general perspective of the aggregated notes (frequencies) present in a musical signal along a certain period.
- Pitch profile: this feature is a more precise representation of musical pitch, as it takes into account both pitch mistuning effects produced in real instruments and also pitch representation of percussive sounds. It has been shown that use of pitch profile feature outperforms conventional chroma-based features in musical key detection, like in Zhu and Kankanhalli [89].
- Harmonicity: this feature is useful for distinguishing between tonal or harmonic (e.g., birds, flute, etc.) and noise-like sounds (e.g., dog bark, snare drum, etc.). Most traditional harmonicity features either use an impulse train (like in Ishizuka et al. [90]) to search for the set of peaks in multiples of F0, or uses the autocorrelation-inspired functions to find the self-repetition of the signal in the time- or frequency-domain (as in Kristjansson et al. [91]). Spectral local harmonicity is proposed in the work by Khao [92], a method that uses only the sub-regions of the spectrum that still retain a sufficient harmonic structure. In the MPEG-7 standard, two harmonicity measures are proposed. Harmonic ratio (HR) is a measure of the proportion of harmonic components in the power spectrum. The Upper limit of harmonicity (ULH) is an estimation of the frequency beyond which the spectrum no longer has any harmonic structure. Harmonicity has been used also in the field of environmental sound recognition (Muhammad and Alghathbar [47], Valero and Alías [48]). Some other harmonicity-based features for music genre and instrument family classification have been defined, like harmonic concentration, harmonic energy entropy or harmonic derivative (see Srinivasan and Kankanhalli [93]).
- Inharmonicity: this feature measures the extent to which the partials of a sound are separated with respect to its ideal position in a harmonic context (whose frequencies are integers of a fundamental frequency). Some approaches take into account only partial frequencies (like Agostini et al. [94,95]), while others also consider partial energies and bandwidths (see Cai et al. [96]).
- Harmonic-to-Noise Ratio: Harmonic-to-noise Ratio (HNR) is computed as the relation between the energy of the harmonic part and the energy of the rest of the signal in decibels (dB) (Boersma [97]). Although HNR has been generally applied to analyze pathological voices (like in Klingholz [49], or in Lee et al. [98]), it has also been applied in some music-related applications such as the characterization of growl and screaming singing styles, as in Kato and Ito [53].
- MPEG-7 spectral timbral descriptors: the MPEG-7 standard defines some features that are closely related to the harmonic structure of sounds, and are appropriate for discrimination of musical sounds: MPEG-7 harmonic spectral centroid (HSC) (the amplitude-weighted average of the harmonic frequencies, closely related to brightness and sharpness), MPEG-7 harmonic spectral deviation (HSD) (amplitude deviation of the harmonic peaks from their neighboring harmonic peaks, being minimum if all the harmonic partials have the same amplitude), MPEG-7 harmonic spectral spread (HSS) (the power-weighted root-mean-square deviation of the harmonic peaks from the HSC, related to harmonic bandwidths), and MPEG-7 harmonic spectral variation (HSV) (correlation of harmonic peak amplitudes in two adjacent frames, representing the harmonic variability over time). MPEG-7 spectral timbral descriptors have been employed for environmental sound recognition (Muhammad and Alghathbar [47],Valero and Alías [48]).
- Jitter: computes the cycle-to-cycle variations of the fundamental frequency (Klingholz [49]), that is, the average absolute difference between consecutive periods of speech (Farrús et al. [51]). Besides typically being applied to analyze pathological voices (like in Klingholz [49], or in Kreiman and Gerratt [50]), it has also been applied to prototyping, classification and creation of musical sounds (Jensen [54]), improve speaker recognition (Farrús et al. [51]), characterize growl and screaming singing styles (Kato and Ito [53]) or discriminate vocal and non-vocal regions from audio songs (Murthy and Koolagudi [52]), among others.
4.2.5. Chroma-Related Physical Frequency Features
- Chromagram: also known as chroma-based feature, chromagram is a spectrum-based energy representation that takes into account the 12 pitch classes within an octave (corresponding to pitch classes in musical theory) (Shepard [99]), and it can be computed from a logarithmic STFT (Bartsch and Wakefield [100]). Then, it constitutes a very compact representation suited for musical and harmonic signals representation following a perceptual approach.
- Chroma energy distribution normalized statistics: or CENS for short, this feature was conceived for music similarity matching and has shown to be robust to tempo and timbre variations (Müller et al. [101]). Therefore, it can be used for identifying similarities between different interpretations of a given music piece.
4.2.6. Spectrum Shape-Related Physical Frequency Features
- Bandwidth: usually defined as the second-order statistic of the signal spectrum, it helps to discriminate tonal sounds (with low bandwidths) from noise-like sounds (with high bandwidths) (see Peeters [34]). However, it is difficult to distinguish between complex tonal sounds (e.g., music, instruments, etc.) from complex noise-like sounds using only this feature. It can be defined over the power spectrum or in its logarithmic version (see Liu et al. [59], or Srinivasan and Kankanhalli [93]) and it can be computed over the whole spectrum or within different subbands (like in Ramalingam and Krishnan [102]). MPEG-7 defines audio spectrum spread (ASS) as the standard deviation of the signal spectrum, which constitutes the second moment while (being the ASC the first one). Spectral bandwidth has been used for music classification (Bergstra et al. [41], Lu et al. [12], Morchen et al. [42], Tzanetakis and Cook [28]), and environmental sound recognition (Peltonen et al. [18], Muhammad and Alghathbar [47], Valero and Alías [48]).
- Spectral dispersion: this is a measure closely related to spectral bandwidth. The only difference is that it takes into account the spectral center (median) instead of the spectral centroid (mean) (see Sethares et al. [83]).
- Spectral rolloff point: defined as the 95th percentile of the power spectral distribution (see Scheirer and Slaney [61]), spectral rolloff point can be regarded as a measure of the skewness of the spectral shape. It can be used, for example, for distinguishing between voiced from unvoiced speech sounds. It has been used in music genre classification (like in Li and Ogihara [103], Bergstra et al. [41], Li et al. [40], Lu et al. [12], Morchen et al. [42], Tzanetakis and Cook [28], Wang et al. [9]), speech/music discrimination (Scheirer and Slaney [61]), musical instrument classification (Benetos et al. [10]), environmental sound recognition (Peltonen et al. [18]), audio-based surveillance systems (Rabaoui et al. [24]) and music mood classification (Ren et al. [86]).
- Spectral flatness: this is a measure of uniformity in the frequency distribution of the power spectrum, and it can be computed as the ratio between the geometric and the arithmetic mean of a subband (see Ramalingam and Krishnan [102]) (equivalent to the MPEG-7 audio spectrum flatness (ASF) descriptor [45]). This feature allows distinguishing between noise-like sounds (high value of spectral flatness) and more tonal sounds (low value). This feature has been used in audio fingerprinting (see Lancini et al. [104]), musical onset detection (Smith et al. [57]), music classification (Allamanche et al. [105], Cheng et al. [106], Tzanetakis and Cook [28]) and environmental sound recognition (Muhammad and Alghathbar [47], Valero and Alías [48]).
- Spectral crest factor: in contrast to spectral flatness measure, spectral crest factor measures how peaked the power spectrum is, and it is also useful for differentiation of noise-like (lower spectral crest factor) and tonal sounds (higher spectral crest factor). It can be computed as the ratio between the maximum and the mean of the power spectrum within a subband, and has been used for audio fingerprinting (see Lancini et al. [104], Li and Ogihara [103]) and music classification (Allamanche et al. [105], Cheng et al. [106]).
- Subband spectral flux: or SSF for short, this feature is inversely proportional to spectral flatness, being more relevant in subbands with non-uniform frequency content. In fact, SSF measures the proportion of dominant partials in different subbands, and it can be measured accumulating the differences between adjacent frequencies in a subband. It has been used for improving the representation and recognition of environmental sounds (Cai et al. [96]) and music mood classification (Ren et al. [86]).
- Entropy: this is another measure that describes spectrum uniformity (or flatness), and it can be computed following different approaches (Shannon entropy, or its generalization named Renyi entropy) and also in different subbands (see Ramalingam and Krishnan [102]). It has been used for automatic speech recognition, computing the Shannon entropy in different equal size subbands, like in Misra et al. [107].
- Octave-based Spectral Contrast: also referred to as OSC, it is defined as the difference between peaks (that generally corresponds to harmonic content in music) and valleys (where non-harmonic or noise components are more dominant) measured in subbands by octave-scale filters and using a neighborhood criteria in its computation (Jiang et al. [108]). To represent the whole music piece, mean and standard deviation of the spectral contrast and spectral peak of all frames are used as the spectral contrast features. OSC features have been used for music classification (Lee et al. [77], Lu et al. [12], Yang et al. [109]) and music mood classification, as in Ren et al. [86].
- Spectral skewness and kurtosis: spectral skewness, which is computed as the 3rd order moment of the spectral distribution, is a measure that characterizes the asymmetry of this distribution around its mean value. On the other hand, spectral kurtosis describes the flatness of the spectral distribution around its mean, and its computed as the 4th order moment (see Peeters et al. [34]). Both parameters have been applied for music genre classification (Baniya et al. [112]) and music mood classification (Ren et al. [86]).
4.3. Wavelet-Based Physical Features
- Wavelet-based direct approaches: different type or families of wavelets have been used and defined in the literature in the field of audio processing. Daubechies wavelets have been used in blind source speech separation (see the work by Missaoui and Lachiri [116]) and Debechies together with Haar wavelets have been used in music classification (Popescu et al. [117]), while Coiflets wavelet have been applied recently to de-noising of audio signals (Vishwakarma et al. [118]). Other approaches like Daubechies Wavelet coefficient histogram (DWCH) features, are defined as the first three statistical moments of the coefficient histograms that represent the subbands obtained from Daubechies Wavelet audio signal decomposition (see Li et al. [40,119]). They have been applied in the field of speech recognition (Kim et al. [120]), music analysis applications such as genre classification, artist style identification and emotion detection (as in Li et al. [40,119,121], Mandel and Ellis [122], Yang et al. [109]) or mood classification (Ren et al. [86]). Also, in the work by Tabinda and Ahire [123], different wavelet families (like Daubechies, symlet, coiflet, biorthogonal, stationary and dmer) are used in audio steganography (an application for hiding data in cover speech which is imperceptible from the original audio).
- Hurst parameter features: or pH for short, is a time-frequency statistical representation of the vocal source composed of a vector of Hurst parameters (defined by Hurst [25]), which was computed by applying a wavelet-based multidimensional transformation of the short-time input speech in the work by Sant’Ana [124]. Thanks to its statistical definition, pH is robust to channel distortions as it models the stochastic behavior of input speech signal (see Zao et al. [125], or Palo et al. [126]). pH was originally applied as a means to improve speech-related problems, such as text-independent speaker recognition [124], speech emotion classification [125,126], or speech enhancement [127]. However, it has also been applied to sound source localization in noisy environments recently, as in the work by Dranka and Coelho [128].
- MP-based Gabor features: Wolfe et al. [130] proposed the construction of multiresolution Gabor dictionaries appropriate for audio signal analysis, which is applied for music and speech signals observed in noise, obtaining a more efficient spectro-temporal representation compared to a full multiresolution decomposition. In this work, Gabor atoms are given by time-frequency shifts of distinct window functions. Ezzat et al. describe in [131] the use of 2D Gabor filterbank and illustrate its response to different speech phenomena such as harmonicity, formants, vertical onsets/offsets, noise, and overlapping simultaneous speakers. Meyer and Kollmeier propose in [132] the use of spectro-temporal Gabor features to enhance automatic speech recognition performance in adverse conditions, and obtain better results when Hanning-shaped Gabor filters are used in contrast to more classical Gaussian approaches. Chu et al. [14] proposed using MP and a dictionary of Gabor functions to represent the time dynamics of environmental sounds, which are typically noise-like with a broad flat spectrum, but may include strong temporal domain signatures. Coupled with Mel Frequency Cepstral Coefficients (see Section 5.6 for more details), the MP-based Gabor features allowed improved environmental sound recognition. In [133], Wang et al. proposed a nonuniform scale-frequency map based on Gabor atoms selected via MP, onto which Principal Component Analysis and Linear Discriminate Analysis are subsequently applied to generate the audio feature. The proposed feature was employed for environmental sound classification in home automation.
- Spectral decomposition: in [134], Zhang et al. proposed an audio feature extraction scheme applied to audio effect classification and based on spectral decomposition by matching-pursuit in the frequency domain. Based on psychoacoustic studies, a set of spectral sinusoid-Gaussian basis vectors are constructed to extract pitch, timbre and residual in-harmonic components from the spectrum, and the audio feature consists of the scales of basis vectors after dimension reduction. Also in [135], Umapathy et al. applied an Adaptive Time Frequency Transform (ATFT for short) algorithm for music genre classification as a Wavelet decomposition but using Gaussian-based kernels with different frequencies, translations and scales. The scale parameter, which characterizes the signal envelope, captures information about rhythmic structures, and it has been used for music genre identification (see Fu [13]).
- Sparse coding tensor representation: this work presents an evolution of Gabor atom MP-based audio feature extraction of Chu et al. [14]. The method proposed in the work by Zhang and He [136] tries to preserve the distinctiveness of the atoms selected by the MP algorithm by using a frequency-time-scale tensor derived from the sparse coding of the audio signal. The three tensor dimensions represent the frequency, time center and scale of transient time-frequency components with different dimensions. This feature was coupled with MFCC and applied to perform sound effects classification.
4.4. Image Domain Physical Features
- Spectrogram image features: or SIF for short, are features that comprise a set of techniques that focus on applying techniques from the image processing field to the time-frequency representations (using Fourier, cepstral, or other types of frequency mapping techniques) of the sound to be analyzed (Chu et al. [14], Dennis et al. [138]). Spectrogram image features like subband power distribution (SPD), a two-dimensional representation of the distribution of normalized spectral power over time against frequency, have been shown to be useful for sound event recognition (Dennis [4]). The advantage of the SPD over the spectrogram is that the sparse, high-power elements of the sound event are transformed to a localized region of the SPD, unlike in the spectrogram where they may be scattered over time and frequency. Also, Local Spectrogram features (LS) are introduced by Dennis [4] with the ability to detect an arbitrary combination of overlapping sounds, including two or more different sounds or the same sound overlapping itself. LS features are used to detect keypoints in the spectrogram and then characterize the sound using the Generalized Hough Transform (GHT), a kind of universal transform that can be used to find arbitrarily complex shapes in grey level images, and that it can model the geometrical distribution of speech information over the wider temporal context (Dennis et al. [139]).
4.5. Cepstral Domain Physical Features
- Complex cepstrum: is defined as the Inverse Fourier transform of the logarithm (with unwrapped phase) of the Fourier transform of the signal (see Oppenheim and Schafer [140]), and has been used for pitch determination of speech signals (Noll [141]) but also for identification of musical instruments (see Brown [142]).
- Linear Prediction Cepstrum Coefficients: or LPCC for short. This feature is defined as the inverse Fourier transform of the logarithmic magnitude of the linear prediction spectral complex envelope (Atal [143]), and provide a more robust and compact representation especially useful for automatic speech recognition and speaker identification (Adami and Couto Barone [144]) but also for singer identification (Shen et al. [145]), music classification (Xu et al. [146], Kim and Whitman [147]) and environmental sound recognition (see Peltonen et al. [18], or Chu et al. [14]).
4.6. Other Domains
- Eigenspace: audio features expressed in the eigenspace are usually obtained from sound segments of several seconds of duration, which are postprocessed by dimensionality reduction algorithms in order to obtain a compact representation of the main signal information. This dimensionality reduction is normally performed by means of Principal Component Analysis (PCA) (or alternatively, via Singular Value Decomposition or SVD), which is equivalent to a projection of the original data onto a subspace defined by its eigenvectors (or eigenspace), or Independent Component Analysis (ICA). Some of the most relevant eigendomain physical features found in the literature are: i) MPEG-7 audio spectrum basis/projection feature, which is a combination of two descriptors (audio spectrum basis or ASB–and audio spectrum projection or ASP) conceived for audio retrieval and classification [45,76]. ASB feature is a compact representation of the signal spectrogram obtained through SVD, while ASP is the spectrogram projection against a given audio spectrum basis. ASB and ASP have been used for environmental sound recognition, as in Muhammad and Alghathbar [47]; and ii) Distortion discriminant analysis (DDA) feature, which is a compact time-invariant and noise-robust representation of an audio signal, that is based on applying hierarchical PCA to a time-frequency representation derived from a modulated complex lapped transform (MCLT) (see Burges et al. [148], or Malvar [149]). Therefore, this feature serves as a robust audio representation against many signal distortions (time-shifts, compression artifacts and frequency and noise distortions).
- Phase space: this type of features emerge as a response to the linear approach that has usually been employed to model speech. However, linear models do not take into account nonlinear effects occurring during speech production, thus constituting a simplification of reality. This is why approaches based on nonlinear dynamics try to bridge this gap. A first example are the nonlinear features for speech recognition presented in the work by Lindgren et al. [150], which are based on the so-called reconstructed phase space generated from time-lagged versions of the original time series. The idea is that reconstructed phase spaces have been proven to recover the full dynamics of the generating system, which implies that features extracted from it can potentially contain more and/or different information than a spectral representation. In the works by Kokkinos and Maragos [151] and by Pitsikalis and Maragos [152], a similar idea is employed to compute for short time series of speech sounds useful features like Lyapunov exponents.
- Acoustic environment features: this type of features try to capture information from the acoustic environment where the sound is measured. As an example, in the work by Hu et al. [153], the authors propose the use of Direct-to-Reverberant Ratio (DRR), the ratio between the Room Impulse response (RIR) energy of the direct path and the reverberant components, to perform speaker diarization. In this approach, they don’t use a direct measure of the RIR, but a Non-intrusive Room Acoustic parameter estimator (NIRA) (see Parada et al. [154]). This estimator is a data-driven approach that uses 106 features derived from pitch period importance weighted signal to noise ratio, zero-crossing rate, Hilbert transformation, power spectrum of long term deviation, MFCCs, line spectrum frequency and modulation representation.
5. Perceptual Audio Features Extraction Techniques
5.1. Time Domain Perceptual Features
5.1.1. Zero-Crossing Rate-Based Perceptual Features
- Zero-crossing peak amplitudes (ZCPA): were designed for automatic speech recognition (ASR) in noisy environments by Kim et al. [155], showing better results that linear prediction coefficients. This feature is computed from time-domain zero crossings of the signal previously decomposed in several psychoacoustic scaled subbands. The final representation of the feature is obtained on a histogram of the inverse zero-crossings lengths over all the subband signals. Subsequently, each histogram bin is scaled with the peak value of the corresponding zero crossing interval. In [156], Wang and Zhao applied ZCPA to noise-robust speech recognition.
- Pitch synchronous zero crossing peak amplitudes (PS-ZCPA): were proposed by Ghulam et al. [157] and they were designed for improving robustness of ASR in noisy conditions. The original method is based on an auditory nervous system, as it uses a mel-frequency spaced filterbank as a front-end stage. PS-ZCPA considers only inverse zero-crossings lengths whose peaks have a height above a threshold obtained as a portion of the highest peak within a signal pitch period. PS-ZCPA are only computed in voiced speech segments, being combined with the preceding ZCPA features obtained from unvoiced speech segments. In [158], the same authors presented a new version of the PS-ZCPA feature, using a pitch-synchronous peak-amplitude approach that ignores zero-crossings.
5.1.2. Perceptual Autocorrelation-Based Features
- Autocorrelation function features: or ACF for short, this feature introduced by Ando in [159], has been subsequently applied by the same author to environmental sound analysis [29] and recently adapted to speech representation [160]. To compute ACF, the autocorrelation function is firstly computed from the audio signal, and then this function is parameterized by means of a set of perceptual-based parameters related to acoustic phenomena (signal loudness, perceived pitch, strength of perceived pitch and signal periodicity).
- Narrow-band autocorrelation function features: also known as NB-ACF, this feature was introduced by Valero and Alías [15], where the ACF concept is reused in the context of a filter bank analysis. Specifically, the features are obtained from the autocorrelation function of audio signals computed after applying a Mel filter bank (which are based on the Mel scale, a perceptual scale of pitches judged by listeners to be equal in distance from one another). These features have been shown to provide good performance for indoor and outdoor environmental sound classification. In [161], the same authors improved this technique by substituting the Mel filter bank employed to obtain the narrow-band signals by a Gammatone filter bank with Equivalent Rectangular Bandwidth bands. In addition, the Autocorrelation Zero Crossing Rate (AZCR) was added, following previous works like the one by Ghaemmaghami et al. [43].
5.1.3. Rhythm Pattern
5.2. Frequency Domain Perceptual Features
- Modulation-based
- Brightness-related
- Tonality-related
- Loudness-related
- Roughness-related
5.2.1. Modulation-Based Perceptual Frequency Features
- 4 Hz modulation energy: is defined with the aim of capturing the most relevant hearing sensation of fluctuation in terms of amplitude- and frequency-modulated sounds (see Fastl [164]). The authors propose a model of fluctuation strength, based on a psychoacoustical magnitude, namely the temporal masking pattern. This feature can be computed filtering each subband of a signal spectral analysis by a 4 Hz band-pass filter along time and it has been used for music/speech discrimination (see Scheirer and Slaney [61]).
- Computer model of amplitude-modulation sensitivity of single units in the inferior culliculus: the work by Hewitt and Meddis [165] introduces a computer model of a neural circuit that replicates amplitude-modulation sensitivity of cells in the central nucleous of the inferior culliculus (ICC) is presented, allowing for the encoding of signal periodicity as a rate-based code.
- Joint acoustic and modulation frequency features: these are time-invariant representations that model the non-stationary behavior of an audio signal (Sukittanon and Atlas [166]). Modulation frequencies for each frequency band are extracted from demodulation of the Bark-scaled spectrogram using the Wavelet transform (see Section 4.3). These features have been used for audio fingerprinting by Sukittanon and Atlas [166], and they are similar to rhythm pattern feature (related to rhythm in music).
- Auditory filter bank temporal envelopes: or AFTE for short, this is another attempt to capture modulation information related to sound [167]. Modulation information is here obtained through bandpass filtering the output bands of a logarithmic-scale filterbank of 4th-order Gammatone bandpass filters. These features have been used for audio classification and musical genre classification by McKinney and Breebaart [167], and by Fu et al. [13].
- Modulation spectrogram: also referred to as MS, this feature displays and encodes the signal in terms of the distribution of slow modulations across time and frequency, as defined by Greenberg and Kingsbury [168]. In particular, it was defined to represent modulation frequencies in the speech signal between 0 and 8 Hz, with a peak sensitivity at 4 Hz, corresponding closely to the long-term modulation spectrum of speech. The MS is computed in critical-band-wide channels and incorporates a simple automatic gain control, and emphasizes spectro-temporal peaks. MS has been used for robust speech recognition (see Kingsbury et al. [169], or Baby et al. [170]), music classification (Lee et al. [77]), or content-based audio identification incorporating a Wavelet transform (Sukittanon et al. [171]). Recently, the MS features have been separated through a tensor factorization model, which represents each component as modulation spectra being activated across different subbands at each time frame, being applied for monaural speech separation purposes in the work by Barker and Virtanen [172] and for the classification of pathological infant cries (Chittora and Patil [173]).
- Long-term modulation analysis of short-term timbre features: in the work by Ren et al. [86] the use of a two-dimensional representation of acoustic frequency and modulation frequency to extract joint acoustic frequency and modulation frequency features is proposed, using an approach similar than in the work by Lee et al. [77]. Long-term joint frequency features, such as acoustic-modulation spectral contrast/valley (AMSC/AMSV), acoustic-modulation spectral flatness measure (AMSFM), and acoustic-modulation spectral crest measure (AMSCM), are then computed from the spectra of each joint frequency subband. By combining the proposed features, together with the modulation spectral analysis of MFCC and statistical descriptors of short-term timbre features, this new feature set outperforms previous approaches with statistical significance in automatic music mood classification.
5.2.2. Brightness-Related Perceptual Frequency Features
5.2.3. Tonality-Related Perceptual Frequency Features
5.2.4. Loudness-Related Perceptual Frequency Features
- Loudness: in the original work by Olson [178] the loudness measurement procedure of a complex sound (e.g., speech, music, noise) is described as the sum of the loudness index (using equal loudness contours) for each of the several subbands in which the audio us previously divided. In the work by Breebaart and McKinney [179] the authors compute loudness by firstly computing the power spectrum of the input frame and then normalizing by subtracting (in dB) an approximation of the absolute threshold of hearing, and then filtering by a bank of gammatone filters and summing across frequency to yield the power in each auditory filter, which corresponds to the internal excitation as a function of frequency. These excitations are then compressed, scaled and summed across filters to arrive at the loudness estimate.
- Specific loudness sensation: this is a measure of loudness (in Sone units, a perceptual scale for loudness measurement (see Peeters et al. [34]) in a specific frequency range. It incorporates both Bark-scale frequency analysis and the spectral masking effect that emulates the human auditory system (Pampalk et al. [162]). This feature has been applied to audio retrieval (Morchen et al. [42]).
- Integral loudness: this feature closely measures the human sensation of loudness by spectral integration of loudness over several frequency groups (Pfeiffer [180]). This feature has been used for discrimination between foreground and background sounds (see Linehart et al. [181], Pfeiffer et al. [182]).
5.2.5. Roughness-Related Perceptual Frequency Features
5.3. Wavelet-Based Perceptual Features
- Kernel Power Flow Orientation Coefficients (KPFOC): in the works by Gerazov and Ivanovski [184,185], a bank of 2D kernels is used to estimate the orientation of the power flow at every point in the auditory spectrogram calculated using a Gammatone filter bank (Valero and Alías [161]), obtaining an ASR front-end with increased robustness to both noise and room reverberation with respect to previous approaches, and specially for small vocabulary tasks.
- Mel Frequency Discrete Wavelet Coefficients: or MFDWC for short, account for the perceptual response of the ear by applying the discrete WT to the Mel-scaled log filter bank energies obtained from the input signal (see Gowdy and Tufekci [186]). MFDWC, which were initially defined to improve speech recongintion problems (Tavenei et al. [187]), have been subsequently applied to other machine hearing realed applications such as speaker verification/identification (see Tufekci and Gurbuz [188], Nghia et al. [189]), and audio-based surveillance systems (Rabaoui et al. [24]).
- Gammatone wavelet features: is a subtype of audio features formulated in the Wavelet domain that accounts for perceptual modelling is the Gammatone Wavelet features (GTW) (see Valero and Alías [190], Venkitaraman et al. [191]). These features are obtained by replacing typical mother functions, such as Morlet (Burrus et al. [192]), Coiflet (Bradie [193]) or Daubechies [194]) by Gammatone functions, which model the auditory system. GTW features show superior classification accuracy both in noiseless and noisy conditions when compared to Daubechies Wavelet features in classification of surveillance-related sounds, as exposed by Valero and Alías [190].
- Perceptual wavelet packets: the Wavelet packet transform is an implementation version of the discrete WT, where the filtering process is iterated on both the low frequency and high frequency components (see Jiang et al. [195]), which has been optimized perceptually by including the representation of the input audio into critical bands described by Greenwood [196] and Ren et al. [197]. Wavelet packet transform has been used in different applications like in the work by Dobson et al. [198] for audio coding purposes, or in audio watermarking (Artameeyanant [199]). Perceptual Wavelet Packets (PWP) have been applied to bio-acoustic signal enhancement (Ren et al. [197]), speech recognition (Rajeswari et al. [200]), and more recently also for baby crying sound events recognition (Ntalampiras [201]).
- Gabor functions: the work by Kleinschmidt models the receptive field of cortical neurons also as two-dimensional complex Gabor function [202]. More recently, Heckman et al. have studied in [203] the use of Gabor functions against learning the features via Independent Component Analysis technique for the computation of local features in a two-layer hierarchical bio-inspired approach. Wu et al. employ two-dimensional Gabor functions with different scales and directions to analyze the localized patches of the power spectrogram [204], improving the speech recognition performance in noisy environments, compared with other previous speech feature extraction methods. In a similar way, Schröder et al. [205] propose an optimization of spectro-temporal Gabor filterbank features for the audio events detection task. In [206,207], Lindeberg and Friberg describe a new way of deriving the Gabor filters as a particular case (using non-causal Gaussian windows) of frequency selective temporal receptive fields, representing the first layer of their scale-space theory for auditory signals.
5.4. Multiscale Spectro-Temporal-Based Perceptual Features
- Multiscale spectro-temporal modulations: it consists of two basic stages, as defined by Mesgarani et al. [208]. An early stage models the transformation of the acoustic signal into an internal neural representation referred to as an auditory spectrogram (using bank of 128 constant-Q bandpass filters with center frequencies equally spaced on a logarithmic frequency axis). Subsequently a central stage analyzes the spectrogram to estimate the content of its spectral and temporal modulations using a bank of modulation-selective filters (equivalent to a two-dimensional affine wavelet transform of the auditory spectrogram, with a spectro-temporal mother wavelet resembling a two-dimensional spectro-temporal Gabor function) mimicking those described in a model of the mammalian primary auditory cortex. In [208], Mesgarani et al. use multiscale spectro-temporal modulations to discriminate speech from nonspeech consisting of animal vocalizations, music, and environmental sounds. Moreover, these features have been applied to music genre classification (Panagakis et al. [209]) and voice activity detection (Ng et al. [210]).
- Computational models for auditory receptive fields: in [206,207], Lindeberg and Friberg describe a theoretical and methodological framework to define computational models for auditory receptive fields. The proposal is also based on a two-stage process: (i) a first layer of frequency selective temporal receptive fields where the input signal is represented as multi-scale spectrograms, which can be specifically configured to simulate the physical resonance system in the cochlea spectrogram; (ii) a second layer of spectro-temporal receptive fields which consist of kernel-based 2D processing units in order to capture relevant auditory changes in both time and frequency dimensions (after logarithmic representation in both amplitude and frequency axes, and ignoring phase information), including from separable to non-separable (introducing an specific glissando parameter) spectro-temporal patterns. The presented model is closely related to biological receptive fields (i.e., those that can be physiologically measured from neurons, in the inferior colliculus and the primary auditory cortex, as reported by Qiu et al. in [211]). This work gives an interesting perspective unifying in one theory a way to axiomatically derive representations like Gammatone (see Patterson and Holdsworth [212]) or Gabor filterbanks (Wolfe et al. [130]), regarding the causality of the filters used in the first audio analysis stage (see Section 5.6). A set of new auditory features are proposed respecting auditory invariances, being the result of the output 2D spectrogram after the kernel-based processing, using different operators like: spectro-temporal smoothings, onset and offset detections, spectral sharpenings, ways for capturing frequency variations over time and glissando estimation.
5.5. Image Domain Perceptual Features
- Spectrogram image features: as introduced in Section 4.4, spectrogram image features have been also derived from front-end parametrizations which make use of psychoacoustical models. In [213], Dennis et al. use GHT to construct a codebook from a Gaussian Mixture Model-Hidden Markov Model based ASR, in order to train an artificial neural network that learns a discriminative weighting for optimizing the classification accuracy in a frame-level phoneme recognition application. In this work MFCC are used as front-end parametrization. The same authors compute in [214] a robust sparse spike coding of the 40-dimension Mel-filtered spectrogram (detection of high energy peaks that correlate with a codebook dictionary) to learn a neural network for sound event classification. The results show a superior reliability when the proposed parameterization is used against the conventional raw spectrogram.
- Auditory image model: or AIM for short, this feature extraction technique includes functional and physiological modules to simulate auditory spectral analysis, neural encoding and temporal integration, including new forms of periodicity-sensitive temporal integration that generate stabilized auditory images (Patterson et al. [215,216]). The encoding process is based on a three stage system. Briefly, the spectral analysis stage converts the sound wave into the model’s representation of basilar membrane motion (BMM). The neural encoding stage stabilizes the BMM in level and sharpens features like vowel formants, to produce a simulation of the neural activity pattern produced by the sound in the auditory nerve. The temporal integration stage stabilizes the repeating structure in the NAP and produces a simulation of our perception, referred to as the auditory image.
- Stabilized auditory image: based on the AIM features, the stabilized auditory image (SAI) is defined as a two-dimensional representation of the sound signal (see Walters [137]): the first dimension of a SAI frame is simply the spectral dimension added by a previous filterbank analysis, while the second comes from the strobed temporal integration process by which an SAI is generated. SAI has been applied to speech recognition and audio search [137] and more recently, a low-resolution overlapped SIF has been introduced together with Deep Neural Networks (DNN) to perform robust sound event classification in noisy conditions (McLoughlin et al. [217]).
- Time-chroma images: this feature is a two dimensional representation for audio signals that plots the chroma distribution of an audio signal over time, as described in the work by Malekesmaeili and Ward [218]. This feature employs a modified definition of the chroma concept called chroma, which is defined as the set of all pitches that are apart by n octaves. Coupled with a fingerprinting algorithm that extracts local fingerprints from the time-chroma image, the proposed feature allows improved accuracy in audio copy detection and song identification.
5.6. Cepstral Domain Perceptual Features
5.6.1. Perceptual Filter Banks-Based Cepstral Features
- Mel Frequency Cepstral Coefficients: also denoted as MFCC, have been largely employed in the speech recognition field but also in the field of audio content classification (see the work by Liang and Fan [58]), due to the fact that their computation is based on perceptual-based frequency scale in the first stage (the human auditory model in which is inspired the frequency Mel-scale). After obtaining the frame-based Fourier transform, outputs of a Mel-scale filter bank are logarithmized and finally they are decorrelated by means of the Discrete Cosine Transform (DCT). Only first DCT coefficients (usually from 8 to 13) are used to gather information that represents the low frequency component of the signal’s spectral envelope (mainly related to timbre). MFCCs have been used also for music classification (see the works by Benetos et al. [10], Bergstra et al. [41], Tzanetakis and Cook [28], or Wang et al. [9]), singer identification (as in Shen et al. [145]), environmental sound classification (see Beritelli and Grasso [222], or Peltonen et al. [18]), audio-based surveillance systems (Rabaoui et al. [24]), being also embedded in hearing aids (see Zeng and Liu [223]) and even employed detect breath sound as an indicator of respiratory health and disease (Lei et al. [224]). Also, some particular extensions of MFCC have been introduced in the context of speech recognition and speaker verification in the aim of obtaining more robust spectral representation in the presence of noise (e.g., in the works by Shannon and Paliwal [225], Yuo et al. [27], or Choi [226]).
- Greenwood Function cepstral coefficients: building on the seminal work by Greenwood [196], where it was stated that many mammals have a logarithmic cochlear-frequency response, Clemins et al. [32] introduced Greenwood function Cepstral Coefficients (GFCC), extracting the equal loudness curve from species-specific audiogram measurements as an audio feature extraction for the analysis of environmental sound coming from the vocalization of those species. Later, this features were applied also to multichannel speech recognition by Trawicki et al. [227].
- Noise-robust audio features: or NRAF for short, these features incorporate a specific human auditory model based on a three stage process (a first stage of filtering in the cochlea, transduction of mechanical displacement in electrical activity–log compression in the hair cell stage–, and a reduction stage using decorrelation that mimics the lateral inhibitory network in the cochlear nucleus) (see Ravindran et al. [228]).
- Gammatone cepstral coefficients: also known as GTCC, Patterson et al. in [229,230] proposed a filterbank based on Gammatone function that predicts human masking data accurately, while Hohman proposed in [231] an efficient implementation of a Gammatone filterbank (using the 4th-order linear Gammatone filter) for the frequency analysis and resynthesis of audio signals. Valero and Alías derived the Gammatone cepstral coefficients feature by maintaining the effective computation scheme from MFCC but changing the Mel filter bank by a Gammatone filter bank [232]. Gammatone filters were originally designed to model the human auditory spectral response, given their good approximation in terms of impulse response, magnitude response and filter bandwidth, as described by Patterson and Holdsworth [212]. Gammatone-like features have been used also in audio processing (see the work of Johannesma in [233]), in speech recognition applications (see Shao et al. [234], or Schlüter et al. [235]), water sound event detection for tele-monitoring applications (Guyot et al. [236]), for road noise sources classification (Socoró et al. [237]) and computational auditory scene analysis (Shao et al. [238]). In [206,207] Lindeberg and Friberg describe an axiomatic way of obtaining Gammatone filters as a particular case of a multi-scale spectrogram when the analysis filters are constrained to be causal. They also define a new family of generalized Gammatone filters that allow for additional degrees of freedom in the trade-off between the temporal dynamics and the spectral selectivity of time-causal spectrograms. This approach represents a part of a unified theory for constructing computational models for auditory receptive fields (see a brief description in Section 5.4).
- GammaChirp filterbanks: Irino and Patterson proposed in [239] an extension of the Gammatone filter which was called Gammachirp filter, with the aim of obtaining a more accurate model of the auditory sensitivity, providing an excellent fit to human masking data. Specifically, this approach is able to represent the natural asymmetry of the auditory filter and its dependence on the signal strength. Abdallah and Hajaiej [240] defined GammaChirp Cepstral coefficients (GC-Cept) substituting the typical Mel filterbank in MFCC by a Gammachirp filterbank of 32 filters over speech signals (within the speech frequency band up to 8 KHz). They showed a better performance of the new Gammachirp filterbanks compared with the MFCC in a text independent speaker recognition system for noisy environments.
5.6.2. Autoregression-Based Cepstral Features
- Perceptual Linear Prediction: or PLP for short, this feature represents a more accurate representation of spectral contour by means of a linear prediction-based approach that incorporates also some specific human hearing inspired properties like use of a frequency Bark-scale and asymmetrical critical-band masking curves, as described by Hermansky [241]. These features, were later revised and improved by Hönig et al. [242] for speech recognition purposes and recently applied to baby crying sound events recognition by Ntalampiras [201].
- Relative Spectral-Perceptual Linear Prediction: also referred to as RASTA-PLP, this is a noise-robust version of the PLP feature introduced by Hermansky and Morgan [243]. The objective is to incorporate human-like abilities to disregard noise when listening in speech communication by means of filtering each frequency channel with a bandpass filter that mitigate slow time variations due to communication channel disturbances (e.g., steady background noise, convolutional noise) and fast variations due to analysis artifacts. Also, the RASTA-PLP process uses static nonlinear compression and expansion blocks before and after the bandpass processing. There is a close relation between RASTA processing and delta cepstral coefficients (i.e., first derivatives of MFCC), which are broadly used in the contexts of speech recognition and statistical speech synthesis. This features have also been applied for audio-based surveillance systems by Rabaoui et al. [24].
- Generalized Perceptual Linear Prediction: also denoted as gPLP, is defined as an adaptation of PLP originally developed for human speech processing to represent their vocal production mechanisms of mammals by substituting a species-specific frequency warping and equal loudness curve from humans by those from the analyzed species (see the work by Clemins et al. [32,33]).
5.7. Other Domains
- Eigenspace-based features: in this category, we find Rate-scale-frequency (RSF) features, which describe modulation components present in certain frequency bands of the auditory spectrum, and they are based in the same human auditory model that incorporates the noise-robust audio features (NRAF), as described in the work by Ravindran et al. [228] (see Section 5.6.1). RFS represent a compact and decorrelated representation (they are derived performing a Principal Component Analysis stage) of the two-dimensional Wavelet transform applied to the audio spectrum;
- Electroencephalogram-based features: or EEG-based features for short, these find application in human-centered favorite music estimation, as introduced by Sawata et al. [244]. In that work, the authors compute features from the EEG signals of a user that is listening to his/her favorite music, while simultaneously computing several features from the audio signal (root mean square, brightness, ZCR or tempo, among others). Subsequently, both types of features are correlated by means of kernel canonical correlation analysis (KCCA), which allows deriving a projection between the audio features space and the EEG-based feature space. By using the obtained projection, the new EEG-based audio features can be derived from audio features, since this projection provides the best correlation between both feature spaces. As a result, it becomes possible to transform original audio features into EEG-based audio features with no need of further EEG signals acquisition.
- Auditory saliency map: is a bottom-up auditory attention model which computes an auditory saliency map from the input sound derived by Kalinli et al. [245,246], and it has been applied to environmental sounds in the work by De Coensel and Botteldooren [247] (perception of transportation noise). The saliency map holds non-negative values and its maximum defines the most salient location in 2D auditory spectrum. First, auditory spectrum of sound is estimated using an early auditory (EA) system model, consisting of cochlear filtering, inner hair cell (IHC), and lateral inhibitory stages mimicking the process from basilar membrane to the cochlear nucleus in the auditory system (using a set of constant-Q asymmetric band-pass filters uniformly distributed along a logarithmic frequency axis). Next, the auditory spectrum is analyzed by extracting a set of multi-scale features (2D spectro-temporal receptive filters) which consist of intensity, frequency contrast, temporal contrast and orientation feature channels. Subsequently, center-surround differences (point wise differences across different center-based and surrounding-based scales) are calculated from the previous feature channels, resulting in feature maps. From the computed 30 features maps (six for each intensity, frequency contrast, temporal contrast and twelve for orientation) an iterative and nonlinear normalization algorithm (simulating competition between the neighboring salient locations using a large 2D difference of Gaussians filter) is applied to the possible noisy feature maps, obtaining reduced sparse representations of only those locations which strongly stand-out from their surroundings. All normalized maps are then summed to provide bottom-up input to the saliency map.
6. Conclusions
Acknowledgments
Author Contributions
Conflicts of Interest
Abbreviations
| ACF | Autocorrelation Function features |
| AD | Amplitude Descriptor |
| AFTE | Auditory Filter bank Temporal Envelopes |
| AMSC/AMSV | Acoustic-Modulation Spectral Contrast/Valley |
| AMSFM | Acoustic-Modulation Spectral Flatness Measure (AMSFM) |
| AMSCM | Acoustic-Modulation Spectral Crest Measure (AMSCM) |
| ASB | Audio Spectrum Basis |
| ASC | Audio Spectrum Centroid |
| ASE | audio Spectrum Envelope |
| ASF | Audio Spectrum Flatness |
| ASP | Audio Spectrum Projection |
| ASR | Automatic Speech Recognition |
| ASS | Audio Spectrum Spread |
| ATFT | Adaptive Time Frequency Transform |
| AW | Audio Waveform |
| AZCR | Autocorrelation Zero Crossing Rate |
| BMM | Basilar Membrane Motion |
| CASA | Computational Auditory Scene Analysis |
| CBS | Cyclic Beat Spectrum |
| CELP | Code Excited Linear Prediction |
| CENS | Chroma Energy distribution Normalized Statistics |
| dB | Decibels |
| DCT | Discrete Cosine Transform |
| DDA | Distortion Discriminant Analysis |
| DNN | Deep Neural Networks |
| DWCH | Daubechies Wavelet Coefficient Histogram |
| DRR | Direct-to-Reverberant Ratio |
| ERB | Equivalent Rectangular Bandwidth |
| EA | Early Auditory model |
| F0 | Fundamental frequency |
| GC-Cept | GammaChirp Cepstral coefficients |
| GDF | Group Delay Functions |
| GFCC | Greenwood Function Cepstral Coefficients |
| GHT | Generalised Hough Transform |
| gPLP | Generalized Perceptual Linear Prediction |
| GTCC | Gammatone Cepstral Coefficients |
| GTW | Gammatone Wavelet features |
| HNR | Harmonic-to-Noise Ratio |
| HR | Harmonic Ratio |
| HSC | Harmonic Spectral Centroid |
| HSD | Harmonic Spectral Deviation |
| HSS | Harmonic Spectral Spread |
| HSV | Harmonic Spectral Variation |
| ICA | Independent Component Analysis |
| IHC | Inner Hair Cell |
| KCCA | Kernel Canonical Correlation Analysis |
| KPFOCs | Kernel Power Flow Orientation Coefficients |
| LAT | Log Attack Time |
| LPC | Linear Prediction Coefficient |
| LPCC | Linear Prediction Cepstrum Coefficients |
| LP-ZCR | Linear Prediction Zero Crossing Ratio |
| LS | Local Spectrogram features |
| LSF | Line Spectral Frequencies |
| LSP | Line Spectral Pairs |
| MCLT | Modulated Complex Lapped Transform |
| MFCC | Mel-Frequency Cepstrum Coefficient |
| MFDWC | Mel Frequency Discrete Wavelet Coefficients |
| MGDF | Modified Group Delay Functions |
| MP | Matching Pursuit |
| MPEG | Moving Picture Experts Group |
| MS | Modulation spectrogram |
| NASE | Normalized Spectral Envelope |
| NB-ACF | Narrow-Band Autocorrelation Function features |
| NIRA | Non-intrusive Room Acoustic parameter |
| NRAF | Noise-Robust Audio Features |
| OSC | Octave-based Spectral Contrast |
| PCA | Principal Component Analysis |
| pH | Hurst parameter features |
| PLP | Perceptual Linear Prediction |
| PS-ZCPA | Pitch Synchronous Zero Crossing Peak Amplitudes |
| PWP | Perceptual Wavelet Packets |
| RASTA-PLP | Relative Spectral-perceptual Linear Prediction |
| RIR | Room Impulse Response |
| RMS | Root Mean Square |
| RSF | Rate-Scale-Frequency |
| SAI | Stabilised Auditory Image |
| SC | Spectral Centroid |
| SE | Spectral Envelope |
| SF | Spectral Flux |
| SIF | Spectrogram Image Features |
| SNR | Signal-to-Noise Ratio |
| SPD | Subband Power Distribution |
| SPSF | Stereo Panning Spectrum Feature |
| STE | Short-time Energy |
| STFT | Short Time Fourier Transform |
| ULH | Upper Limit of Harmonicity |
| WT | Wavelet Transform |
| ZCPA | Zero Crossing Peak Amplitudes |
| ZCR | Zero Crossing Rate |
References
- Lyon, R.F. Machine Hearing: An Emerging Field. IEEE Signal Process. Mag. 2010, 27, 131–139. [Google Scholar] [CrossRef]
- Gerhard, D. Audio Signal Classification: History and Current Techniques; Technical Report TR-CS 2003-07; Department of Computer Science, University of Regina: Regina, SK, Canada, 2003. [Google Scholar]
- Temko, A. Acoustic Event Detection and Classification. Ph.D. Thesis, Universitat Politècnica de Catalunya, Barcelona, Spain, 23 January 2007. [Google Scholar]
- Dennis, J. Sound Event Recognition in Unstructured Environments Using Spectrogram Image Processing. Ph.D. Thesis, School of Computer Engineering, Nanyang Technological University, Singapore, 2014. [Google Scholar]
- Bach, J.H.; Anemüller, J.; Kollmeier, B. Robust speech detection in real acoustic backgrounds with perceptually motivated features. Speech Commun. 2011, 53, 690–706. [Google Scholar] [CrossRef]
- Kinnunen, T.; Li, H. An overview of text-independent speaker recognition: From features to supervectors. Speech Commun. 2011, 52, 12–40. [Google Scholar] [CrossRef]
- Pieraccini, R. The Voice in the Machine. Building Computers That Understand Speech; MIT Press: Cambridge, MA, USA, 2012. [Google Scholar]
- Wang, A.L.C. An industrial-strength audio search algorithm. In Proceedings of the 4th International Conference on Music Information Retrieval (ISMIR), Baltimore, MD, USA, 26–30 October 2003; pp. 7–13.
- Wang, F.; Wang, X.; Shao, B.; Li, T.; Ogihara, M. Tag Integrated Multi-Label Music Style Classification with Hypergraph. In Proceedings of the 10th International Society for Music Information Retrieval Conference (ISMIR), Kobe, Japan, 26–30 October 2009; pp. 363–368.
- Benetos, E.; Kotti, M.; Kotropoulos, C. Musical Instrument Classification using Non-Negative Matrix Factorization Algorithms and Subset Feature Selection. In Proceedings of the 2006 IEEE International Conference on Acoustics, Speech, and Signal Processing (ICASSP), Toulouse, France, 14–19 May 2006; Volume 5, pp. V:221–V:225.
- Liu, M.; Wan, C. Feature selection for automatic classification of musical instrument sounds. In Proceedings of the ACM/IEEE Joint Conference on Digital Libraries (JCDL), Roanoke, VA, USA, 24–28 June 2001; pp. 247–248.
- Lu, L.; Liu, D.; Zhang, H.J. Automatic Mood Detection and Tracking of Music Audio Signals. IEEE Trans. Audio Speech Lang. Process. 2006, 14, 5–18. [Google Scholar] [CrossRef]
- Lyon, R.F. A Survey of Audio-Based Music Classification and Annotation. IEEE Trans. Multimedia 2011, 13, 303–319. [Google Scholar]
- Chu, S.; Narayanan, S.S.; Kuo, C.J. Environmental Sound Recognition With Time-Frequency Audio Features. IEEE Trans. Audio Speech Lang. Process. 2009, 17, 1142–1158. [Google Scholar] [CrossRef]
- Valero, X.; Alías, F. Classification of audio scenes using Narrow-Band Autocorrelation features. In Proceedings of the 20th European Signal Processing Conference (EUSIPCO), Bucharest, Romania, 27–31 August 2012; pp. 2012–2019.
- Schafer, R.M. The Soundscape: Our Sonic Environment and the Tuning of the World; Inner Traditions/Bear & Co: Rochester, VT, USA, 1993. [Google Scholar]
- Mitrović, D.; Zeppelzauer, M.; Breiteneder, C. Features for content-based audio retrieval. Adv. Comput. 2010, 78, 71–150. [Google Scholar]
- Peltonen, V.; Tuomi, J.; Klapuri, A.; Huopaniemi, J.; Sorsa, T. Computational Auditory Scene Recognition. In Proceedings of the 2002 IEEE International Conference on Acoustics, Speech, and Signal Processing (ICASSP), Orlando, FL, USA, 13–17 May 2002; Volume 2, pp. II:1941–II:1944.
- Geiger, J.; Schuller, B.; Rigoll, G. Large-scale audio feature extraction and SVM for acoustic scene classification. In Proceedings of the 2013 IEEE Workshop on Applications of Signal Processing to Audio and Acoustics (WASPAA), New Paltz, NY, USA, 20–23 October 2013; pp. 1–4.
- Oppenheim, A.V.; Schafer, R.W. Discrete-Time Signal Processing; Prentice Hall: Upper Saddle River, NJ, USA, 1989. [Google Scholar]
- Gygi, B. Factors in the Identification of Environmental Sounds. Ph.D. Thesis, Indiana University, Bloomington, IN, USA, 12 July 2001. [Google Scholar]
- Foote, J.; Uchihashi, S. The Beat Spectrum: A New Approach To Rhythm Analysis. In Proceedings of the 2001 IEEE International Conference on Multimedia and Expo (ICME), Tokyo, Japan, 22–25 August 2001; pp. 881–884.
- Bellman, R. Dynamic Programming; Dover Publications: Mineola, NY, USA, 2003. [Google Scholar]
- Rabaoui, A.; Davy, M.; Rossignaol, S.; Ellouze, N. Using One-Class SVMs and Wavelets for Audio Surveillance. IEEE Trans. Inf. Forensics Secur. 2008, 3, 763–775. [Google Scholar] [CrossRef]
- Hurst, H.E. Long-term storage capacity of reservoirs. Trans. Amer. Soc. Civ. Eng. 1951, 116, 770–808. [Google Scholar]
- Eronen, A.J.; Peltonen, V.T.; Tuomi, J.T.; Klapuri, A.P.; Fagerlund, S.; Sorsa, T.; Lorho, G.; Huopaniemi, J. Audio-based context recognition. IEEE Trans. Audio Speech Lang. Process. 2006, 14, 321–329. [Google Scholar] [CrossRef]
- Yuo, K.; Hwang, T.; Wang, H. Combination of autocorrelation-based features and projection measure technique for speaker identification. IEEE Trans. Speech Audio Process. 2005, 13, 565–574. [Google Scholar]
- Tzanetakis, G.; Cook, P.R. Musical genre classification of audio signals. IEEE Trans. Speech Audio Process. 2002, 10, 293–302. [Google Scholar] [CrossRef]
- Ando, Y. A theory of primary sensations and spatial sensations measuring environmental noise. J. Sound Vib. 2001, 241, 3–18. [Google Scholar] [CrossRef]
- Valero, X.; Alías, F. Hierarchical Classification of Environmental Noise Sources by Considering the Acoustic Signature of Vehicle Pass-bys. Arch. Acoustics 2012, 37, 423–434. [Google Scholar] [CrossRef]
- Richard, G.; Sundaram, S.; Narayanan, S. An Overview on Perceptually Motivated Audio Indexing and Classification. Proc. IEEE 2013, 101, 1939–1954. [Google Scholar] [CrossRef]
- Clemins, P.J.; Trawicki, M.B.; Adi, K.; Tao, J.; Johnson, M.T. Generalized Perceptual Features for Vocalization Analysis Across Multiple Species. In Proceedings of the IEEE International Conference on Acoustics, Speech and Signal Processing (ICASSP), Toulouse, France, 14–19 May 2006; Volume 1.
- Clemins, P.J.; Johnson, M.T. Generalized perceptual linear prediction features for animal vocalization analysis. J. Acoust. Soc. Am. 2006, 120, 527–534. [Google Scholar] [CrossRef] [PubMed]
- Peeters, G. A Large Set of Audio Features for Sound Description (Similarity And Classification) in the CUIDADO Project; Technical Report; IRCAM: Paris, France, 2004. [Google Scholar]
- Sharan, R.; Moir, T. An overview of applications and advancements in automatic sound recognition. Neurocomputing 2016. [Google Scholar] [CrossRef]
- Gubka, R.; Kuba, M. A comparison of audio features for elementary sound based audio classification. In Proceedings of the 2013 International Conference on Digital Technologies (DT), Zilina, Slovak Republic, 29–31 May 2013; pp. 14–17.
- Boonmatham, P.; Pongpinigpinyo, S.; Soonklang, T. A comparison of audio features of Thai Classical Music Instrument. In Proceedings of the 7th International Conference on Computing and Convergence Technology (ICCCT), Seoul, South Korea, 3–5 December 2012; pp. 213–218.
- Van Hengel, P.W.J.; Krijnders, J.D. A Comparison of Spectro-Temporal Representations of Audio Signals. IEEE/ACM Trans. Audio Speech Lang. Process. 2014, 22, 303–313. [Google Scholar] [CrossRef]
- Kedem, B. Spectral Analysis and Discrimination by Zero-crossings. Proc. IEEE 1986, 74, 1477–1393. [Google Scholar] [CrossRef]
- Li, T.; Ogihara, M.; Li, Q. A Comparative Study on Content-based Music Genre Classification. In Proceedings of the 26th Annual International ACM SIGIR Conference on Research and Development in Information Retrieval, Toronto, ON, Canada, 28 July–1 August 2003; pp. 282–289.
- Bergstra, J.; Casagrande, N.; Erhan, D.; Eck, D.; Kégl, B. Aggregate features and ADABOOST for music classification. Mach. Learn. 2006, 65, 473–484. [Google Scholar] [CrossRef]
- Mörchen, F.; Ultsch, A.; Thies, M.; Lohken, I. Modeling timbre distance with temporal statistics from polyphonic music. IEEE Trans. Audio Speech Lang. Process. 2006, 14, 81–90. [Google Scholar] [CrossRef]
- Ghaemmaghami, H.; Baker, B.; Vogt, R.; Sridharan, S. Noise robust voice activity detection using features extracted from the time-domain autocorrelation function. In Proceedings of the 11th Annual Conference of the International Speech (InterSpeech), Makuhari, Japan, 26–30 September 2010; Kobayashi, T., Hirose, K., Nakamura, S., Eds.; pp. 3118–3121.
- El-Maleh, K.; Klein, M.; Petrucci, G.; Kabal, P. Speech/music discrimination for multimedia applications. In Proceedings of the 2000 IEEE International Conference on Acoustics, Speech, and Signal Processing (ICASSP), Istanbul, Turkey, 5–9 June 2000; Volume 4, pp. 2445–2448.
- International Organization for Standardization (ISO)/International Organization for Standardization (IEC). Information technology—Multimedia content description interface. Part 4 Audio. 2002. Available online: http://mpeg.chiariglione.org/standards/mpeg-7/audio (accessed on 4 May 2016).
- Mitrović, D.; Zeppelzauer, M.; Breiteneder, C. Discrimination and retrieval of animal sounds. In Proceedings of the 12th International Multi-Media Modelling Conference, Beijing, China, 4–6 January 2006; pp. 339–343.
- Muhammad, G.; Alghathbar, K. Environment Recognition from Audio Using MPEG-7 Features. In Proceedings of the 4th International Conference on Embedded and Multimedia Computing, Jeju, Korea, 10–12 December 2009; pp. 1–6.
- Valero, X.; Alías, F. Applicability of MPEG-7 low level descriptors to environmental sound source recognition. In Proceedings of the EAA EUROREGIO 2010, Ljubljana, Slovenia, 15–18 September 2010.
- Klingholz, F. The measurement of the signal-to-noise ratio (SNR) in continuous speech. Speech Commun. 1987, 6, 15–26. [Google Scholar] [CrossRef]
- Kreiman, J.; Gerratt, B.R. Perception of aperiodicity in pathological voice. J. Acoust. Soc. Am. 2005, 117, 2201–2211. [Google Scholar] [CrossRef] [PubMed]
- Farrús, M.; Hernando, J.; Ejarque, P. Jitter and shimmer measurements for speaker recognition. In Proceedings of the 8th Annual Conference of the International Speech Communication Association (InterSpeech), Antwerp, Belgium, 27–31 August 2007; pp. 778–781.
- Murthy, Y.V.S.; Koolagudi, S.G. Classification of vocal and non-vocal regions from audio songs using spectral features and pitch variations. In Proceedings of the 28th Canadian Conference on Electrical and Computer Engineering (CCECE), Halifax, NS, Canada, 3–6 May 2015; pp. 1271–1276.
- Kato, K.; Ito, A. Acoustic Features and Auditory Impressions of Death Growl and Screaming Voice. In Proceedings of the Ninth International Conference on Intelligent Information Hiding and Multimedia Signal Processing (IIH-MSP), Beijing, China, 16–18 October 2013; Jia, K., Pan, J.S., Zhao, Y., Jain, L.C., Eds.; pp. 460–463.
- Jensen, K. Pitch independent prototyping of musical sounds. In Proceedings of the IEEE 3rd Workshop on Multimedia Signal Processing, Copenhagen, Denmark, 13–15 September 1999; pp. 215–220.
- Chu, W.; Cheng, W.; Hsu, J.Y.; Wu, J. Toward semantic indexing and retrieval using hierarchical audio models. J. Multimedia Syst. 2005, 10, 570–583. [Google Scholar] [CrossRef]
- Zhang, T.; Kuo, C.C. Audio content analysis for online audiovisual data segmentation and classification. IEEE Trans. Speech Audio Process. 2001, 9, 441–457. [Google Scholar] [CrossRef]
- Smith, D.; Cheng, E.; Burnett, I.S. Musical Onset Detection using MPEG-7 Audio Descriptors. In Proceedings of the 20th International Congress on Acoustics (ICA), Sydney, Australia, 23–27 August 2010; pp. 10–14.
- Liang, S.; Fan, X. Audio Content Classification Method Research Based on Two-step Strategy. Int. J. Adv. Comput. Sci. Appl. (IJACSA) 2014, 5, 57–62. [Google Scholar] [CrossRef]
- Liu, Z.; Wang, Y.; Chen, T. Audio Feature Extraction and Analysis for Scene Segmentation and Classification. J. VLSI Signal Process. Syst. Signal Image Video Technol. 1998, 20, 61–79. [Google Scholar] [CrossRef]
- Jiang, H.; Bai, J.; Zhang, S.; Xu, B. SVM-based audio scene classification. In Proceedings of the 2005 IEEE International Conference on Natural Language Processing and Knowledge Engineering, Wuhan, China, 30 October–1 November 2005; pp. 131–136.
- Scheirer, E.D.; Slaney, M. Construction and evaluation of a robust multifeature speech/music discriminator. In Proceedings of the IEEE International Conference on Acoustics, Speech, and Signal Processing (ICASSP), Munich, Germany, 21–24 April 1997; pp. 1331–1334.
- Lartillot, O.; Eerola, T.; Toiviainen, P.; Fornari, J. Multi-feature modeling of pulse clarity: Design, validation and optimization. In Proceedings of the Ninth International Conference on Music Information Retrieval (ISMIR), Philadelphia, PA, USA, 14–18 September 2008; pp. 521–526.
- Friberg, A.; Schoonderwaldt, E.; Hedblad, A.; Fabiani, M.; Elowsson, A. Using listener-based perceptual features as intermediate representations in music information retrieval. J. Acoust. Soc. Am. 2014, 136, 1951–1963. [Google Scholar] [CrossRef] [PubMed]
- Lu, L.; Jiang, H.; Zhang, H. A robust audio classification and segmentation method. In Proceedings of the 9th ACM International Conference on Multimedia, Ottawa, ON, Canada, 30 September–5 October 2001; Georganas, N.D., Popescu-Zeletin, R., Eds.; pp. 203–211.
- Foote, J. Automatic Audio Segmentation using a Measure of Audio Novelty. In Proceedings of the IEEE International Conference on Multimedia and Expo (ICME), New York, NY, USA, 30 July–2 August 2000; p. 452.
- Kurth, F.; Gehrmann, T.; Müller, M. The Cyclic Beat Spectrum: Tempo-Related Audio Features for Time-Scale Invariant Audio Identification. In Proceedings of the 7th International Conference on Music Information Retrieval (ISMIR), Victoria, BC, Canada, 8–12 October 2006; pp. 35–40.
- Scheirer, E.D. Tempo and beat analysis of acoustic musical signals. J. Acoust. Soc. Am. 1998, 103, 588–601. [Google Scholar] [CrossRef] [PubMed]
- Khan, M.K.S.; Al-Khatib, W.G.; Moinuddin, M. Automatic Classification of Speech and Music Using Neural Networks. In Proceedings of the 2nd ACM International Workshop on Multimedia Databases, Washington, DC, USA, 8–13 November 2004; pp. 94–99.
- Khan, M.K.S.; Al-Khatib, W.G. Machine-learning Based Classification of Speech and Music. Multimedia Syst. 2006, 12, 55–67. [Google Scholar] [CrossRef]
- Itakura, F. Line spectrum representation of linear predictor coefficients of speech signals. In Proceedings of the 89th Meeting of the Acoustical Society of America, Austin, TX, USA, 8–11 April 1975.
- Sarkar, A.; Sreenivas, T.V. Dynamic programming based segmentation approach to LSF matrix reconstruction. In Proceedings of the 9th European Conference on Speech Communication and Technology (EuroSpeech), Lisbon, Portugal, 4–8 September 2005; pp. 649–652.
- Schroeder, M.; Atal, B. Code-excited linear prediction (CELP): High-quality speech at very low bit rates. In Proceedings of the IEEE International Conference on Acoustics, Speech, and Signal Processing (ICASSP), Tampa, FL, USA, 26–29 April 1985; Volume 10, pp. 937–940.
- Tsau, E.; Kim, S.H.; Kuo, C.C.J. Environmental sound recognition with CELP-based features. In Proceedings of the 10th International Symposium on Signals, Circuits and Systems, Iasi, Romania, 30 June–1 July 2011; pp. 1–4.
- Srinivasan, S.; Petkovic, D.; Ponceleon, D. Towards Robust Features for Classifying Audio in the CueVideo System. In Proceedings of the Seventh ACM International Conference on Multimedia (Part 1), Orlando, FL, USA, 30 October–5 November 1999; pp. 393–400.
- Farahani, G.; Ahadi, S.M.; Homayounpoor, M.M. Use of Spectral Peaks in Autocorrelation and Group Delay Domains for Robust Speech Recognition. In Proceedings of the 2006 IEEE International Conference on Acoustics Speech and Signal Processing, (ICASSP), Toulouse, France, 14–19 May 2006; pp. 517–520.
- Kim, H.; Moreau, N.; Sikora, T. Audio classification based on MPEG-7 spectral basis representations. IEEE Trans. Circuits Syst. Video Technol. 2004, 14, 716–725. [Google Scholar] [CrossRef]
- Lee, C.; Shih, J.; Yu, K.; Lin, H. Automatic Music Genre Classification Based on Modulation Spectral Analysis of Spectral and Cepstral Features. IEEE Trans. Multimedia 2009, 11, 670–682. [Google Scholar]
- Tzanetakis, G.; Jones, R.; McNally, K. Stereo Panning Features for Classifying Recording Production Style. In Proceedings of the 8th International Conference on Music Information Retrieval (ISMIR), Vienna, Austria, 23–27 September 2007; Dixon, S., Bainbridge, D., Typke, R., Eds.; pp. 441–444.
- Tzanetakis, G.; Martins, L.G.; McNally, K.; Jones, R. Stereo Panning Information for Music Information Retrieval Tasks. J. Audio Eng. Soc. 2010, 58, 409–417. [Google Scholar]
- Yegnanarayana, B.; Murthy, H.A. Significance of group delay functions in spectrum estimation. IEEE Trans. Signal Process. 1992, 40, 2281–2289. [Google Scholar] [CrossRef]
- Smits, R.; Yegnanarayana, B. Determination of instants of significant excitation in speech using group delay function. IEEE Trans. Speech Audio Process. 1995, 3, 325–333. [Google Scholar] [CrossRef]
- Rao, K.S.; Prasanna, S.R.M.; Yegnanarayana, B. Determination of Instants of Significant Excitation in Speech Using Hilbert Envelope and Group Delay Function. IEEE Signal Process. Lett. 2007, 14, 762–765. [Google Scholar] [CrossRef]
- Sethares, W.A.; Morris, R.D.; Sethares, J.C. Beat tracking of musical performances using low-level audio features. IEEE Trans. Speech Audio Process. 2005, 13, 275–285. [Google Scholar] [CrossRef]
- Hegde, R.M.; Murthy, H.A.; Rao, G.V.R. Application of the modified group delay function to speaker identification and discrimination. In Proceedings of the 2004 IEEE International Conference on Acoustics, Speech, and Signal Processing, (ICASSP), Montreal, QC, Canada, 17–21 May 2004; pp. 517–520.
- Murthy, H.A.; Yegnanarayana, B. Group delay functions and its applications in speech technology. Sadhana 2011, 36, 745–782. [Google Scholar] [CrossRef]
- Ren, J.M.; Wu, M.J.; Jang, J.S.R. Automatic Music Mood Classification Based on Timbre and Modulation Features. IEEE Trans. Affect. Comput. 2015, 6, 236–246. [Google Scholar] [CrossRef]
- Hess, W. Pitch Determination of Speech Signals: Algorithms and Devices; Springer Series in Information Sciences; Springer-Verlag: Berlin, Germany, 1983; Volume 3. [Google Scholar]
- Wold, E.; Blum, T.; Keislar, D.; Wheaton, J. Content-Based Classification, Search, and Retrieval of Audio. IEEE MultiMedia 1996, 3, 27–36. [Google Scholar] [CrossRef]
- Zhu, Y.; Kankanhalli, M.S. Precise pitch profile feature extraction from musical audio for key detection. IEEE Trans. Multimedia 2006, 8, 575–584. [Google Scholar]
- Ishizuka, K.; Nakatani, T.; Fujimoto, M.; Miyazaki, N. Noise robust voice activity detection based on periodic to aperiodic component ratio. Speech Commun. 2010, 52, 41–60. [Google Scholar] [CrossRef]
- Kristjansson, T.T.; Deligne, S.; Olsen, P.A. Voicing features for robust speech detection. In Proceedings of the 9th European Conference on Speech Communication and Technology (EuroSpeech), Lisbon, Portugal, 4–8 September 2005; 2005; pp. 369–372. [Google Scholar]
- Khao, P.C. Noise Robust Voice Activity Detection; Technical Report; Nanyang Technological University: Singapore, 2012. [Google Scholar]
- Srinivasan, S.H.; Kankanhalli, M.S. Harmonicity and dynamics-based features for audio. In Proceedings of the 2004 IEEE International Conference on Acoustics, Speech, and Signal Processing (ICASSP), Montreal, QC, Canada, 17–21 May 2004; pp. 321–324.
- Agostini, G.; Longari, M.; Pollastri, E. Musical instrument timbres classification with spectral features. In Proceedings of the Fourth IEEE Workshop on Multimedia Signal Processing (MMSP), Cannes, France, 3–5 October 2001; Dugelay, J., Rose, K., Eds.; pp. 97–102.
- Agostini, G.; Longari, M.; Pollastri, E. Musical Instrument Timbres Classification with Spectral Features. EURASIP J. Appl. Signal Process. 2003, 2003, 5–14. [Google Scholar] [CrossRef]
- Cai, R.; Lu, L.; Hanjalic, A.; Zhang, H.; Cai, L. A flexible framework for key audio effects detection and auditory context inference. IEEE Trans. Audio Speech Lang. Process. 2006, 14, 1026–1039. [Google Scholar] [CrossRef]
- Boersma, P. Accurate short-term analysis of the fundamental frequency and the harmonics-to-noise ratio of a sampled sound. Proc. Instit. Phonet. Sci. 1993, 17, 97–110. [Google Scholar]
- Lee, J.W.; Kim, S.; Kang, H.G. Detecting pathological speech using contour modeling of harmonic-to-noise ratio. In Proceedings of the 2014 IEEE International Conference on Acoustics, Speech and Signal Processing (ICASSP), Florence, Italy, 4–9 May 2014; pp. 5969–5973.
- Shepard, R.N. Circularity in Judgments of Relative Pitch. J. Acoust. Soc. Am. 1964, 36, 2346–2353. [Google Scholar] [CrossRef]
- Bartsch, M.A.; Wakefield, G.H. Audio thumbnailing of popular music using chroma-based representations. IEEE Trans. Multimedia 2005, 7, 96–104. [Google Scholar] [CrossRef]
- Müller, M.; Kurth, F.; Clausen, M. Audio Matching via Chroma-Based Statistical Features. In Proceedings of the International Conference on Music Information Retrieval (ISMIR), London, UK, 11–15 September 2005; pp. 288–295.
- Ramalingam, A.; Krishnan, S. Gaussian Mixture Modeling of Short-Time Fourier Transform Features for Audio Fingerprinting. IEEE Trans. Inf. Forensics Secur. 2006, 1, 457–463. [Google Scholar] [CrossRef]
- Li, T.; Ogihara, M. Music genre classification with taxonomy. In Proceedings of the 2005 IEEE International Conference on Acoustics, Speech, and Signal Processing (ICASSP), Philadelphia, PA, USA, 18–23 March 2005; pp. 197–200.
- Lancini, R.; Mapelli, F.; Pezzano, R. Audio content identification by using perceptual hashing. In Proceedings of the 2004 IEEE International Conference on Multimedia and Expo (ICME), Taipei, Taiwan, 27–30 June 2004; pp. 739–742.
- Allamanche, E.; Herre, J.; Hellmuth, O.; Fröba, B.; Kastner, T.; Cremer, M. Content-based Identification of Audio Material Using MPEG-7 Low Level Description. In Proceedings of the 2nd International Symposium on Music Information Retrieval (ISMIR), Bloomington, IN, USA, 15–17 October 2001.
- Cheng, H.T.; Yang, Y.; Lin, Y.; Liao, I.; Chen, H.H. Automatic chord recognition for music classification and retrieval. In Proceedings of the 2008 IEEE International Conference on Multimedia and Expo (ICME), Hannover, Germany, 23–26 June 2008; pp. 1505–1508.
- Misra, H.; Ikbal, S.; Bourlard, H.; Hermansky, H. Spectral entropy based feature for robust ASR. In Proceedings of the 2004 IEEE International Conference on Acoustics, Speech, and Signal Processing (ICASSP), Montreal, QC, Canada, 17–21 May 2004; pp. 193–196.
- Jiang, D.; Lu, L.; Zhang, H.; Tao, J.; Cai, L. Music type classification by spectral contrast feature. In Proceedings of the 2002 IEEE International Conference on Multimedia and Expo (ICME), Lausanne, Switzerland, 26–29 August 2002; Volume I, pp. 113–116.
- Yang, Y.; Lin, Y.; Su, Y.; Chen, H.H. A Regression Approach to Music Emotion Recognition. IEEE Trans. Audio Speech Lang. Process. 2008, 16, 448–457. [Google Scholar] [CrossRef]
- Shukla, S.; Dandapat, S.; Prasanna, S.R.M. Spectral slope based analysis and classification of stressed speech. Int. J. Speech Technol. 2011, 14, 245–258. [Google Scholar] [CrossRef]
- Murthy, H.A.; Beaufays, F.; Heck, L.P.; Weintraub, M. Robust text-independent speaker identification over telephone channels. IEEE Trans. Speech Audio Process. 1999, 7, 554–568. [Google Scholar] [CrossRef]
- Baniya, B.K.; Lee, J.; Li, Z.N. Audio feature reduction and analysis for automatic music genre classification. In Proceedings of the 2014 IEEE International Conference on Systems, Man and Cybernetics (SMC), San Diego, CA, USA, 5–8 October 2014; pp. 457–462.
- Mallat, S.G. A theory for multiresolution signal decomposition: The wavelet representation. IEEE Trans. Patt. Anal. Mach. Intell. 1989, 11, 674–693. [Google Scholar] [CrossRef]
- Benedetto, J.; Teolis, A. An auditory motivated time-scale signal representation. In Proceedings of the IEEE-SP International Symposium Time-Frequency and Time-Scale Analysis, Victoria, BC, Canada, 4–6 October 1992; pp. 49–52.
- Yang, X.; Wang, K.; Shamma, S.A. Auditory representations of acoustic signals. IEEE Trans. Inf. Theory 1992, 38, 824–839. [Google Scholar] [CrossRef]
- Missaoui, I.; Lachiri, Z. Blind speech separation based on undecimated wavelet packet-perceptual filterbanks and independent component analysis. ICSI Int. J. Comput. Sci. Issues 2011, 8, 265–272. [Google Scholar]
- Popescu, A.; Gavat, I.; Datcu, M. Wavelet analysis for audio signals with music classification applications. In Proceedings of the 5th Conference on Speech Technology and Human-Computer Dialogue (SpeD), Bucharest, Romaina, 18–21 June 2009; pp. 1–6.
- Vishwakarma, D.K.; Kapoor, R.; Dhiman, A.; Goyal, A.; Jamil, D. De-noising of Audio Signal using Heavy Tailed Distribution and comparison of wavelets and thresholding techniques. In Proceedings of the 2nd International Conference on Computing for Sustainable Global Development (INDIACom), New Delhi, India, 11–13 March 2015; pp. 755–760.
- Li, T.; Ogihara, M. Music artist style identification by semisupervised learning from both lyrics and content. In Proceedings of the 12th Annual ACM Interantional Conference on Multimeda, New York, NY, USA, 10–16 October 2004; pp. 364–367.
- Kim, K.; Youn, D.H.; Lee, C. Evaluation of wavelet filters for speech recognition. In Proceedings of the 2000 IEEE International Conference on Systems, Man, and Cybernetics, Nashville, TN, USA, 8–11 October 2000; Volume 4, pp. 2891–2894.
- Li, T.; Ogihara, M. Toward intelligent music information retrieval. IEEE Trans. Multimedia 2006, 8, 564–574. [Google Scholar]
- Mandel, M.; Ellis, D. Song-level features and SVMs for music classification. In Proceedings of International Conference on Music Information Retrieval (ISMIR)–MIREX, London, UK, 11–15 September 2005.
- Mirza Tabinda, V.A. Analysis of wavelet families on Audio steganography using AES. In International Journal of Advances in Computer Science and Technology (IJACST); Research India Publications: Hyderbad, India, 2014; pp. 26–31. [Google Scholar]
- Sant’Ana, R.; Coelho, R.; Alcaim, A. Text-independent speaker recognition based on the Hurst parameter and the multidimensional fractional Brownian motion model. IEEE Trans. Audio Speech Lang. Process. 2006, 14, 931–940. [Google Scholar] [CrossRef]
- Zão, L.; Cavalcante, D.; Coelho, R. Time-Frequency Feature and AMS-GMM Mask for Acoustic Emotion Classification. IEEE Signal Process. Lett. 2014, 21, 620–624. [Google Scholar] [CrossRef]
- Palo, H.K.; Mohanty, M.N.; Chandra, M. Novel feature extraction technique for child emotion recognition. In Proceedings of the 2015 International Conference on Electrical, Electronics, Signals, Communication and Optimization (EESCO), Visakhapatnam, India, 24–25 January 2015; pp. 1–5.
- Zão, L.; Coelho, R.; Flandrin, P. Speech Enhancement with EMD and Hurst-Based Mode Selection. IEEE/ACM Trans. Audio Speech Lang. Process. 2014, 22, 899–911. [Google Scholar]
- Dranka, E.; Coelho, R.F. Robust Maximum Likelihood Acoustic Energy Based Source Localization in Correlated Noisy Sensing Environments. J. Sel. Top. Signal Process. 2015, 9, 259–267. [Google Scholar] [CrossRef]
- Mallat, S.G.; Zhang, Z. Matching pursuits with time-frequency dictionaries. IEEE Trans. Signal Process. 1993, 41, 3397–3415. [Google Scholar] [CrossRef]
- Wolfe, P.J.; Godsill, S.J.; Dorfler, M. Multi-Gabor dictionaries for audio time-frequency analysis. In Proceedings of the IEEE Workshop on the Applications of Signal Processing to Audio and Acoustics (WASPAA), New Paltz, NY, USA, 21–24 October 2001; pp. 43–46.
- Ezzat, T.; Bouvrie, J.V.; Poggio, T.A. Spectro-temporal analysis of speech using 2-d Gabor filters. In Proceedings of the 8th Annual Conference of the International Speech Communication Association (InterSpeech), Antwerp, Belgium, 27–31 August 2007; pp. 506–509.
- Meyer, B.T.; Kollmeier, B. Optimization and evaluation of Gabor feature sets for ASR. In Proceedings of the 9th Annual Conference of the International Speech Communication Association (InterSpeech), Brisbane, Australia, 22–26 September 2008; pp. 906–909.
- Wang, J.C.; Lin, C.H.; Chen, B.W.; Tsai, M.K. Gabor-based nonuniform scale-frequency map for environmental sound classification in home automation. IEEE Trans. Autom. Sci. Eng. 2014, 11, 607–613. [Google Scholar] [CrossRef]
- Zhang, X.; Su, Z.; Lin, P.; He, Q.; Yang, J. An audio feature extraction scheme based on spectral decomposition. In Proceedings of the 2014 International Conference on Audio, Language and Image Processing (ICALIP), Shanghai, China, 7–9 July 2014; pp. 730–733.
- Umapathy, K.; Krishnan, S.; Jimaa, S. Multigroup classification of audio signals using time-frequency parameters. IEEE Trans. Multimedia 2005, 7, 308–315. [Google Scholar]
- Zhang, X.Y.; He, Q.H. Time-frequency audio feature extraction based on tensor representation of sparse coding. Electron. Lett. 2015, 51, 131–132. [Google Scholar] [CrossRef]
- Walters, T.C. Auditory-Based Processing of Communication Sounds. Ph.D. Thesis, Clare College, University of Cambridge, Cambridge, UK, June 2011. [Google Scholar]
- Dennis, J.W.; Dat, T.H.; Li, H. Spectrogram Image Feature for Sound Event Classification in Mismatched Conditions. IEEE Signal Process. Lett. 2011, 18, 130–133. [Google Scholar] [CrossRef]
- Dennis, J.; Tran, H.D.; Li, H. Generalized Hough Transform for Speech Pattern Classification. IEEE/ACM Trans. Audio Speech Lang. Process. 2015, 23, 1963–1972. [Google Scholar]
- Oppenheim, A.; Schafer, R. Homomorphic analysis of speech. IEEE Trans. Audio Electroacoust. 1968, 16, 221–226. [Google Scholar] [CrossRef]
- Noll, A.M. Cepstrum Pitch Determination. J. Acoust. Soc. Am. 1967, 41, 293–309. [Google Scholar] [CrossRef] [PubMed]
- Brown, J.C. Computer identification of musical instruments using pattern recognition with cepstral coefficients as features. J. Acoust. Soc. Am. 1999, 105, 1933–1941. [Google Scholar] [CrossRef] [PubMed]
- Atal, B.S. Effectiveness of linear prediction characteristics of the speech wave for automatic speaker identification and verification. J. Acoust. Soc. Am. 1974, 55, 1304–1312. [Google Scholar] [CrossRef] [PubMed]
- Adami, A.G.; Couto Barone, D.A. A Speaker Identification System Using a Model of Artificial Neural Networks for an Elevator Application. Inf. Sci. Inf. Comput. Sci. 2001, 138, 1–5. [Google Scholar] [CrossRef]
- Shen, J.; Shepherd, J.; Cui, B.; Tan, K. A novel framework for efficient automated singer identification in large music databases. ACM Trans. Inf. Syst. 2009, 27, 18:1–18:31. [Google Scholar] [CrossRef]
- Xu, C.; Maddage, N.C.; Shao, X. Automatic music classification and summarization. IEEE Trans. Speech Audio Process. 2005, 13, 441–450. [Google Scholar]
- Kim, Y.E.; Whitman, B. Singer Identification in Popular Music Recordings Using Voice Coding Features. In Proceedings of the 3rd International Conference on Music Information Retrieval (ISMIR), Paris, France, 13–17 October 2002; pp. 164–169.
- Burges, C.J.C.; Platt, J.C.; Jana, S. Extracting noise-robust features from audio data. In Proceedings of the IEEE International Conference on Acoustics, Speech, and Signal Processing (ICASSP), Orlando, FL, USA, 13–17 May 2002; pp. 1021–1024.
- Malvar, H.S. A modulated complex lapped transform and its applications to audio processing. In Proceedings of the 1999 IEEE International Conference on Acoustics, Speech, and Signal Processing (ICASSP), Phoenix, AZ, USA, 15–19 March 1999; pp. 1421–1424.
- Lindgren, A.C.; Johnson, M.T.; Povinelli, R.J. Speech recognition using reconstructed phase space features. In Proceedings of the IEEE International Conference on Acoustics, Speech, and Signal Processing (ICASSP), Hong Kong, China, 5–10 April 2003; pp. 60–63.
- Kokkinos, I.; Maragos, P. Nonlinear speech analysis using models for chaotic systems. IEEE Trans. Speech Audio Process. 2005, 13, 1098–1109. [Google Scholar] [CrossRef]
- Pitsikalis, V.; Maragos, P. Speech analysis and feature extraction using chaotic models. In Proceedings of the IEEE International Conference on Acoustics, Speech, and Signal Processing (ICASSP), Orlando, FL, USA, 13–17 May 2002; pp. 533–536.
- Hu, M.; Parada, P.; Sharma, D.; Doclo, S.; van Waterschoot, T.; Brookes, M.; Naylor, P. Single-channel speaker diarization based on spatial features. In Proceedings of the IEEE Workshop on Applications of Signal Processing to Audio and Acoustics (WASPAA), New Paltz, NY, USA, 18–21 October 2015; pp. 1–5.
- Parada, P.P.; Sharma, D.; Lainez, J.; Barreda, D.; van Waterschoot, T.; Naylor, P. A single-channel non-intrusive C50 estimator correlated with speech recognition performance. IEEE/ACM Trans. Audio Speech Lang. Process. 2016, 24, 719–732. [Google Scholar] [CrossRef]
- Kim, D.S.; Jeong, J.H.; Kim, J.W.; Lee, S.Y. Feature extraction based on zero-crossings with peak amplitudes for robust speech recognition in noisy environments. In Proceedings of the 1996 IEEE International Conference on Acoustics, Speech, and Signal Processing (ICASSP), Atlanta, GA, USA, 7–10 May 1996; Volume 1, pp. 61–64.
- Wang, Y.; Zhao, Z. A Noise-robust Speech Recognition System Based on Wavelet Neural Network. In Proceedings of the Third International Conference on Artificial Intelligence and Computational Intelligence (AICI)–Volume Part III, Taiyuan, China, 24–25 September 2011; pp. 392–397.
- Ghulam, M.; Fukuda, T.; Horikawa, J.; Nitta, T. A noise-robust feature extraction method based on pitch-synchronous ZCPA for ASR. In Proceedings of the 8th International Conference on Spoken Language Processing (ICSLP), Jeju Island, Korea, 4–8 September 2004; pp. 133–136.
- Ghulam, M.; Fukuda, T.; Horikawa, J.; Nitta, T. A Pitch-Synchronous Peak-Amplitude Based Feature Extraction Method for Noise Robust ASR. In Proceedings of the 2006 International Conference on Acoustics, Speech and Signal Processing (ICASSP), Toulouse, France, 14–19 May 2006; Volume 1, pp. I-505–I-508.
- Ando, Y. Architectural Acoustics: Blending Sound Sources, Sound, Fields, and Listeners; Springer: New York, NY, USA, 1998; pp. 7–19. [Google Scholar]
- Ando, Y. Autocorrelation-based features for speech representation. Acta Acustica Unit. Acustica 2015, 101, 145–154. [Google Scholar] [CrossRef]
- Valero, X.; Alías, F. Narrow-band autocorrelation function features for the automatic recognition of acoustic environments. J. Acoust. Soc. Am. 2013, 134, 880–890. [Google Scholar] [CrossRef] [PubMed]
- Pampalk, E.; Rauber, A.; Merkl, D. Content-based organization and visualization of music archives. In Proceedings of the 10th ACM International Conference on Multimedia (ACM-MM), Juan-les-Pins, France, 1–6 December 2002; Rowe, L.A., Mérialdo, B., Mühlhäuser, M., Ross, K.W., Dimitrova, N., Eds.; pp. 570–579.
- Rauber, A.; Pampalk, E.; Merkl, D. Using Psycho-Acoustic Models and Self-Organizing Maps to Create a Hierarchical Structuring of Music by Musical Styles. In Proceedings of the 3rd International Conference on Music Information Retrieval (ISMIR), Paris, France, 13–17 October 2002.
- Fastl, H. Fluctuation strength and temporal masking patterns of amplitude-modulated broadband noise. Hear. Res. 1982, 8, 441–450. [Google Scholar] [CrossRef]
- Hewitt, M.J.; Meddis, R. A computer model of amplitude-modulation sensitivity of single units in the inferior colliculus. J. Acoust. Soc. Am. 1994, 95, 2145–2159. [Google Scholar] [CrossRef] [PubMed]
- Sukittanon, S.; Atlas, L.E. Modulation frequency features for audio fingerprinting. In Proceedings of the IEEE International Conference on Acoustics, Speech, and Signal Processing (ICASSP), Orlando, FL, USA, 13–17 May 2002; pp. 1773–1776.
- McKinney, M.F.; Breebaart, J. Features for audio and music classification. In Proceedings of the 4th International Conference on Music Information Retrieval (ISMIR), Baltimore, MD, USA, 26–30 October 2003.
- Greenberg, S.; Kingsbury, B. The modulation spectrogram: In pursuit of an invariant representation of speech. In Proceedings of the 1997 IEEE International Conference on Acoustics, Speech, and Signal Processing (ICASSP), Munich, Germany, 21–24 April 1997; Volume 3, pp. 1647–1650.
- Kingsbury, B.; Morgan, N.; Greenberg, S. Robust speech recognition using the modulation spectrogram. Speech Commun. 1998, 25, 117–132. [Google Scholar] [CrossRef]
- Baby, D.; Virtanen, T.; Gemmeke, J.F.; Barker, T.; van hamme, H. Exemplar-based noise robust automatic speech recognition using modulation spectrogram features. In Proceedings of the 2014 Spoken Language Technology Workshop (SLT), South Lake Tahoe, NV, USA, 7–10 December 2014; pp. 519–524.
- Sukittanon, S.; Atlas, L.E.; Pitton, J.W. Modulation-scale analysis for content identification. IEEE Trans. Signal Process. 2004, 52, 3023–3035. [Google Scholar] [CrossRef]
- Barker, T.; Virtanen, T. Semi-supervised non-negative tensor factorisation of modulation spectrograms for monaural speech separation. In Proceedings of the 2014 International Joint Conference on Neural Networks (IJCNN), Beijing, China, 6–11 July 2014; pp. 3556–3561.
- Chittora, A.; Patil, H.A. Classification of pathological infant cries using modulation spectrogram features. In Proceedings of the 9th International Symposium on Chinese Spoken Language Processing (ISCSLP), Singapore, 12–14 September 2014; pp. 541–545.
- Herre, J.; Allamanche, E.; Ertel, C. How Similar Do Songs Sound? Towards Modeling Human Perception of Musical Similarity. In Proceedings of the IEEE ASSP Workshop on Applications of Signal Processing to Audio and Acoustics (WASPAA), New Paltz, NY, USA, 19–22 October 2003; pp. 83–86.
- Zwicker, E.; Fastl, H.H. Psychoacoustics: Facts and Models; Springer Verlag: New York, NY, USA, 1998. [Google Scholar]
- Meddis, R.; O’Mard, L. A unitary model of pitch perception. J. Acoust. Soc. Am. 1997, 102, 1811–1820. [Google Scholar] [CrossRef] [PubMed]
- Slaney, M.; Lyon, R.F. A perceptual pitch detector. In Proceedings of the 1990 International Conference on Acoustics, Speech, and Signal Processing (ICASSP), Albuquerque, NM, USA, 3–6 April 1990; Volume 1, pp. 357–360.
- Olson, H.F. The Measurement of Loudness. Audio 1972, 56, 18–22. [Google Scholar]
- Breebaart, J.; McKinney, M.F. Features for Audio Classification. In Algorithms in Ambient Intelligence; Verhaegh, W.F.J., Aarts, E., Korst, J., Eds.; Springer: Dordrecht, The Netherlands, 2004; Volume 2, Phillips Research, Chapter 6; pp. 113–129. [Google Scholar]
- Pfeiffer, S. italic. In The Importance of Perceptive Adaptation of Sound Features in Audio Content Processing; Technical Report 18/98; University of Mannheim: Mannheim, Germany, 1998. [Google Scholar]
- Lienhart, R.; Pfeiffer, S.; Effelsberg, W. Scene Determination Based on Video and Audio Features. In Proceedings of the IEEE International Conference on Multimedia Computing and Systems (ICMCS), Florence, Italy, 7–9 June 1999; Volume I, pp. 685–690.
- Pfeiffer, S.; Lienhart, R.; Effelsberg, W. Scene Determination Based on Video and Audio Features. Multimedia Tools Appl. 2001, 15, 59–81. [Google Scholar] [CrossRef]
- Daniel, P.; Weber, R. Psychoacoustical roughness: Implementation of an optimized model. Acustica 1997, 83, 113–123. [Google Scholar]
- Gerazov, B.; Ivanovski, Z. Kernel Power Flow Orientation Coefficients for Noise-Robust Speech Recognition. IEEE/ACM Trans. Audio Speech Lang. Process. 2015, 23, 407–419. [Google Scholar] [CrossRef]
- Gerazov, B.; Ivanovski, Z. Gaussian Power flow Orientation Coefficients for noise-robust speech recognition. In Proceedings of the 22nd European Signal Processing Conference (EUSIPCO), Lisbon, Portugal, 1–5 September 2014; pp. 1467–1471.
- Gowdy, J.N.; Tufekci, Z. Mel-scaled discrete wavelet coefficients for speech recognition. In Proceedings of the IEEE International Conference on Acoustics, Speech, and Signal Processing (ICASSP), Istanbul, Turkey, 5–9 June 2000; Volume 3, pp. 1351–1354.
- Tavanaei, A.; Manzuri, M.T.; Sameti, H. Mel-scaled Discrete Wavelet Transform and dynamic features for the Persian phoneme recognition. In Proceedings of the 2011 International Symposium on Artificial Intelligence and Signal Processing (AISP), Tehran, Israel, 15–16 June 2011; pp. 138–140.
- Tufekci, Z.; Gurbuz, S. Noise Robust Speaker Verification Using Mel-Frequency Discrete Wavelet Coefficients and Parallel Model Compensation. In Proceedings of the IEEE International Conference on Acoustics, Speech, and Signal Processing (ICASSP), Philadelphia, PA, USA, 18–23 March 2005; Volume 1, pp. 657–660.
- Nghia, P.T.; Binh, P.V.; Thai, N.H.; Ha, N.T.; Kumsawat, P. A Robust Wavelet-Based Text-Independent Speaker Identification. In Proceedings of the International Conference on Conference on Computational Intelligence and Multimedia Applications (ICCIMA), Sivakasi, Tamil Nadu, 13–15 December 2007; Volume 2, pp. 219–223.
- Valero, X.; Alías, F. Gammatone Wavelet features for sound classification in surveillance applications. In Proceedings of the 20th European Signal Processing Conference (EUSIPCO), Bucharest, Romania, 27–31 August 2012; pp. 1658–1662.
- Venkitaraman, A.; Adiga, A.; Seelamantula, C.S. Auditory-motivated Gammatone wavelet transform. Signal Process. 2014, 94, 608–619. [Google Scholar] [CrossRef]
- Burrus, C.S.; Gopinath., R.A.; Guo, H. Introduction to Wavelets and Wavelet Transforms: A Primer; Prentice Hall: Upper Saddle River, NJ, USA, 1998. [Google Scholar]
- Bradie, B. Wavelet packet-based compression of single lead ECG. IEEE Trans. Biomed. Eng. 1996, 43, 493–501. [Google Scholar] [CrossRef] [PubMed]
- Daubechies, I. The wavelet transform, time-frequency localization and signal analysis. IEEE Trans. Inf. Theory 1990, 36, 961–1005. [Google Scholar] [CrossRef]
- Jiang, H.; Er, M.J.; Gao, Y. Feature extraction using wavelet packets strategy. In Proceedings of the 42nd IEEE Conference on Decision and Control, Maui, HI, USA, 9–12 December 2003; Volume 5, pp. 4517–4520.
- Greenwood, D.D. Critical Bandwidth and the Frequency Coordinates of the Basilar Membrane. J. Acoust. Soc. Am. 1961, 33, 1344–1356. [Google Scholar] [CrossRef]
- Ren, Y.; Johnson, M.T.; Tao, J. Perceptually motivated wavelet packet transform for bioacoustic signal enhancement. J. Acoust. Soc. Am. 2008, 124, 316–327. [Google Scholar] [CrossRef] [PubMed]
- Dobson, W.K.; Yang, J.J.; Smart, K.J.; Guo, F.K. High quality low complexity scalable wavelet audio coding. In Proceedings of the 1997 IEEE International Conference on Acoustics, Speech, and Signal Processing (ICASSP), Munich, Germany, 21–24 April 1997; Volume 1, pp. 327–330.
- Artameeyanant, P. Wavelet audio watermark robust against MPEG compression. In Proceedings of the 2010 International Conference on Control Automation and Systems (ICCAS), Gyeonggi-do, South Korea, 27–30 October 2010; pp. 1375–1378.
- Rajeswari; Prasad, N.; Satyanarayana, V. A Noise Robust Speech Recognition System Using Wavelet Front End and Support Vector Machines. In Proceedings of International Conference on Emerging research in Computing, Information, Communication and Applications (ERCICA), Bangalore, India, 2–3 August 2013; pp. 307–312.
- Ntalampiras, S. Audio Pattern Recognition of Baby Crying Sound Events. J. Audio Eng. Soc 2015, 63, 358–369. [Google Scholar] [CrossRef]
- Kleinschmidt, M. Methods for Capturing Spectro-Temporal Modulations in Automatic Speech Recognition. Acta Acustica Unit. Acustica 2002, 88, 416–422. [Google Scholar]
- Heckmann, M.; Domont, X.; Joublin, F.; Goerick, C. A hierarchical framework for spectro-temporal feature extraction. Speech Commun. 2011, 53, 736–752. [Google Scholar] [CrossRef]
- Wu, Q.; Zhang, L.; Shi, G. Robust Multifactor Speech Feature Extraction Based on Gabor Analysis. IEEE Trans. Audio Speech Lang. Process. 2011, 19, 927–936. [Google Scholar] [CrossRef]
- Schröder, J.; Goetze, S.; Anemüller, J. Spectro-Temporal Gabor Filterbank Features for Acoustic Event Detection. IEEE/ACM Trans. Audio Speech Lang. Process. 2015, 23, 2198–2208. [Google Scholar] [CrossRef]
- Lindeberg, T.; Friberg, A. Idealized Computational Models for Auditory Receptive Fields. PLoS ONE 2015, 10, 1–58. [Google Scholar]
- Lindeberg, T.; Friberg, A. Scale-Space Theory for Auditory Signals. In Proceedings of the 5th International Conference on Scale Space and Variational Methods in Computer Vision (SSVM), Lège Cap Ferret, France, 31 May–4 June 2015; pp. 3–15.
- Mesgarani, N.; Slaney, M.; Shamma, S.A. Discrimination of speech from nonspeech based on multiscale spectro-temporal Modulations. IEEE Trans. Audio Speech Lang. Process. 2006, 14, 920–930. [Google Scholar] [CrossRef]
- Panagakis, I.; Benetos, E.; Kotropoulos, C. Music Genre Classification: A Multilinear Approach. In Proceedings of the 9th International Conference on Music Information Retrieval (ISMIR), Philadelphia, PA, USA, 14–18 September 2008; pp. 583–588.
- Ng, T.; Zhang, B.; Nguyen, L.; Matsoukas, S.; Zhou, X.; Mesgarani, N.; Veselý, K.; Matejka, P. Developing a Speech Activity Detection System for the DARPA RATS Program. In Proceedings of the 13th Annual Conference of the International Speech (InterSpeech), Portland, OR, USA, 9–13 September 2012; pp. 1969–1972.
- Qiu, A.; Schreiner, C.; Escabi, M. Gabor analysis of auditory midbrain receptive fields: spectro-temporal and binaural composition. Neurophysiology 2003, 90, 456–476. [Google Scholar] [CrossRef] [PubMed]
- Patterson, R.D.; Holdsworth, J. A functional model of neural activity patterns and auditory images. Adv. Speech Hear. Lang. Process. 1996, 3, 547–563. [Google Scholar]
- Dennis, J.; Tran, H.D.; Li, H.; Chng, E.S. A discriminatively trained Hough Transform for frame-level phoneme recognition. In Proceedings of the 2014 IEEE Acoustics, Speech and Signal Processing (ICASSP), Florence, Italy, 4–9 May 2014; pp. 2514–2518.
- Dennis, J.; Tran, H.D.; Li, H. Combining robust spike coding with spiking neural networks for sound event classification. In Proceedings of the 2015 IEEE International Conference on Acoustics, Speech and Signal Processing (ICASSP), Brisbane, Australia, 19–24 April 2015; pp. 176–180.
- Patterson, R.D.; Allerhand, M.H.; Giguère, C. Time-domain modeling of peripheral auditory processing: A modular architecture and a software platform. J. Acoust. Soc. Am. 1995, 98, 1890–1894. [Google Scholar] [CrossRef] [PubMed]
- Patterson, R.D.; Robinson, K.; Holdsworth, J.; Mckeown, D.; Zhang, C.; Allerhand, M. Complex sounds and auditory images. Audit. Physiol. Percept. 1992, 83, 429–446. [Google Scholar]
- McLoughlin, I.; Zhang, H.; Xie, Z.; Song, Y.; Xiao, W. Robust Sound Event Classification Using Deep Neural Networks. IEEE/ACM Trans. Audio Speech Lang. Process. 2015, 23, 540–552. [Google Scholar] [CrossRef]
- Malekesmaeili, M.; Ward, R.K. A local fingerprinting approach for audio copy detection. Signal Process. 2014, 98, 308–321. [Google Scholar] [CrossRef]
- Moore, B.C.J.; Peters, R.W.; Glasberg, B.R. Auditory filter shapes at low center frequencies. J. Acoust. Soc. Am. 1990, 88, 132–140. [Google Scholar] [CrossRef] [PubMed]
- Zwicker., E. Subdivision of the Audible Frequency Range into Critical Bands (Frequenzgruppen). J. Acoust. Soc. Am. 1961, 33, 248. [Google Scholar] [CrossRef]
- Maddage, N.C.; Xu, C.; Kankanhalli, M.S.; Shao, X. Content-based music structure analysis with applications to music semantics understanding. In Proceedings of the 12th ACM International Conference on Multimedia, New York, NY, USA, 10–16 October 2004; Schulzrinne, H., Dimitrova, N., Sasse, M.A., Moon, S.B., Lienhart, R., Eds.; pp. 112–119.
- Beritelli, F.; Grasso, R. A pattern recognition system for environmental sound classification based on MFCCs and neural networks. In Proceedings of the International Conference on Signal Processing and Communication Systems (ICSPCS), Gold Coast, Australia, 15–17 December 2008.
- Zeng, W.; Liu, M. Hearing environment recognition in hearing aids. In Proceedings of the 12th International Conference on Fuzzy Systems and Knowledge Discovery (FSKD), Zhangjiajie, China, 15–17 August 2015; pp. 1556–1560.
- Lei, B.; Rahman, S.A.; Song, I. Content-based classification of breath sound with enhanced features. Neurocomputing 2014, 141, 139–147. [Google Scholar] [CrossRef]
- Shannon, B.J.; Paliwal, K.K. MFCC computation from magnitude spectrum of higher lag autocorrelation coefficients for robust speech recognition. In Proceedings of the 8th International Conference on Spoken Language Processing (ICSLP), Jeju Island, Korea, 4–8 October 2004.
- Choi, E.H.C. On compensating the Mel-frequency cepstral coefficients for noisy speech recognition. In Proceedings of the 29th Australasian Computer Science Conference (ACSC2006), Hobart, Tasmania, Australia, 16–19 January 2006; Estivill-Castro, V., Dobbie, G., Eds.; Volume 48, pp. 49–54.
- Trawicki, M.B.; Johnson, M.T.; Ji, A.; Osiejuk, T.S. Multichannel speech recognition using distributed microphone signal fusion strategies. In Proceedings of the 2012 International Conference on Audio, Language and Image Processing (ICALIP), Shanghai, China, 16–18 July 2012; pp. 1146–1150.
- Ravindran, S.; Schlemmer, K.; Anderson, D.V. A Physiologically Inspired Method for Audio Classification. EURASIP J. Appl. Signal Process. 2005, 2005, 1374–1381. [Google Scholar] [CrossRef]
- Patterson, R.D.; Moore, B.C.J. Auditory filters and excitation patterns as representations of frequency resolution. Freq. Sel. Hear. 1986, 123–177. [Google Scholar]
- Patterson, R.D.; Nimmo-Smith, I.; Holdsworth, J.; Rice, P. An Efficient Auditory Filterbank Based on the Gammatone Function. In Proceedings of the IOC Speech Group on Auditory Modelling at RSRE, Malvern, UK, 14–15 December 1987; pp. 1–34.
- Hohmann, V. Frequency analysis and synthesis using a Gammatone filterbank. Acta Acustica Unit. Acustica 2002, 88, 433–442. [Google Scholar]
- Valero, X.; Alías, F. Gammatone Cepstral Coefficients: Biologically Inspired Features for Non-Speech Audio Classification. IEEE Trans. Multimedia 2012, 14, 1684–1689. [Google Scholar] [CrossRef]
- Johannesma, P.I.M. The pre-response stimulus ensemble of neurons in the cochlear nucleus. In Proceedings of the Symposium on Hearing Theory, Eindhoven, The Netherlands, 22–23 June 1972; pp. 58–69.
- Shao, Y.; Srinivasan, S.; Wang, D. Incorporating Auditory Feature Uncertainties in Robust Speaker Identification. In Proceedings of the 2007 IEEE International Conference on Acoustics, Speech and Signal Processing (ICASSP), Honolulu, HI, USA, 15–20 April 2007; Volume 4, pp. IV-227–IV-280.
- Schlüter, R.; Bezrukov, I.; Wagner, H.; Ney, H. Gammatone Features and Feature Combination for Large Vocabulary Speech Recognition. In Proceedings of the IEEE International Conference on Acoustics, Speech, and Signal Processing (ICASSP), Honolulu, HI, USA, 15–20 April 2007; pp. 649–652.
- Guyot, P.; Pinquier, J.; Valero, X.; Alías, F. Two-step detection of water sound events for the diagnostic and monitoring of dementia. In Proceedings of the 2013 IEEE International Conference on Multimedia and Expo (ICME), San Jose, CA, USA, 15–19 July 2013; pp. 1–6.
- Socoró, J.C.; Ribera, G.; Sevillano, X.; Alías, F. Development of an Anomalous Noise Event Detection Algorithm for dynamic road traffic noise mapping. In Proceedings of the 22nd International Congress on Sound and Vibration (ICSV22), Florence, Italy, 12–16 July 2015.
- Shao, Y.; Srinivasan, S.; Jin, Z.; Wang, D. A computational auditory scene analysis system for speech segregation and robust speech recognition. Comput. Speech Lang. 2010, 24, 77–93. [Google Scholar] [CrossRef]
- Irino, T.; Patterson, R.D. A time-domain, level-dependent auditory filter: The gammachirp. J. Acoust. Soc. Am. 1997, 101, 412–419. [Google Scholar] [CrossRef]
- Abdallah, A.B.; Hajaiej, Z. Improved closed set text independent speaker identification system using Gammachirp Filterbank in noisy environments. In Proceedings of the 11th International MultiConference on Systems, Signals Devices (SSD), Castelldefels-Barcelona, Spain, 11–14 February 2014; pp. 1–5.
- Hermansky, H. Perceptual linear predictive (PLP) analysis of speech. J. Acoust. Soc. Am. 1990, 87, 1738–1752. [Google Scholar] [CrossRef] [PubMed]
- Hönig, F.; Stemmer, G.; Hacker, C.; Brugnara, F. Revising Perceptual Linear Prediction (PLP). In Proceedings of the 9th European Conference on Speech Communication and Technology (EuroSpech), Lisbon, Portugal, 4–8 September 2005; pp. 2997–3000.
- Hermansky, H.; Morgan, N. RASTA processing of speech. IEEE Trans. Speech Audio Process. 1994, 2, 578–589. [Google Scholar] [CrossRef]
- Sawata, R.; Ogawa, T.; Haseyama, M. Human-centered favorite music estimation: EEG-based extraction of audio features reflecting individual preference. In Proceedings of the 2015 IEEE International Conference on Digital Signal Processing (DSP), Signapore, 21–24 July 2015; pp. 818–822.
- Kalinli, O.; Narayanan, S.S. A saliency-based auditory attention model with applications to unsupervised prominent syllable detection in speech. In Proceedings of the 8th Annual Conference of the International Speech Communication Association (InterSpeech), Antwerp, Belgium, 27–31 August 2007; pp. 1941–1944.
- Kalinli, O.; Sundaram, S.; Narayanan, S. Saliency-driven unstructured acoustic scene classification using latent perceptual indexing. In Proceedings of the IEEE International Workshop on Multimedia Signal Processing (MMSP), Rio De Janeiro, Brazil, 5–7 October 2009; pp. 1–6.
- De Coensel, B.; Botteldooren, D. A model of saliency-based auditory attention to environmental sound. In Proceedings of the 20th International Congress on Acoustics (ICA), Sydney, Australia, 23–27 August 2010; pp. 1–8.
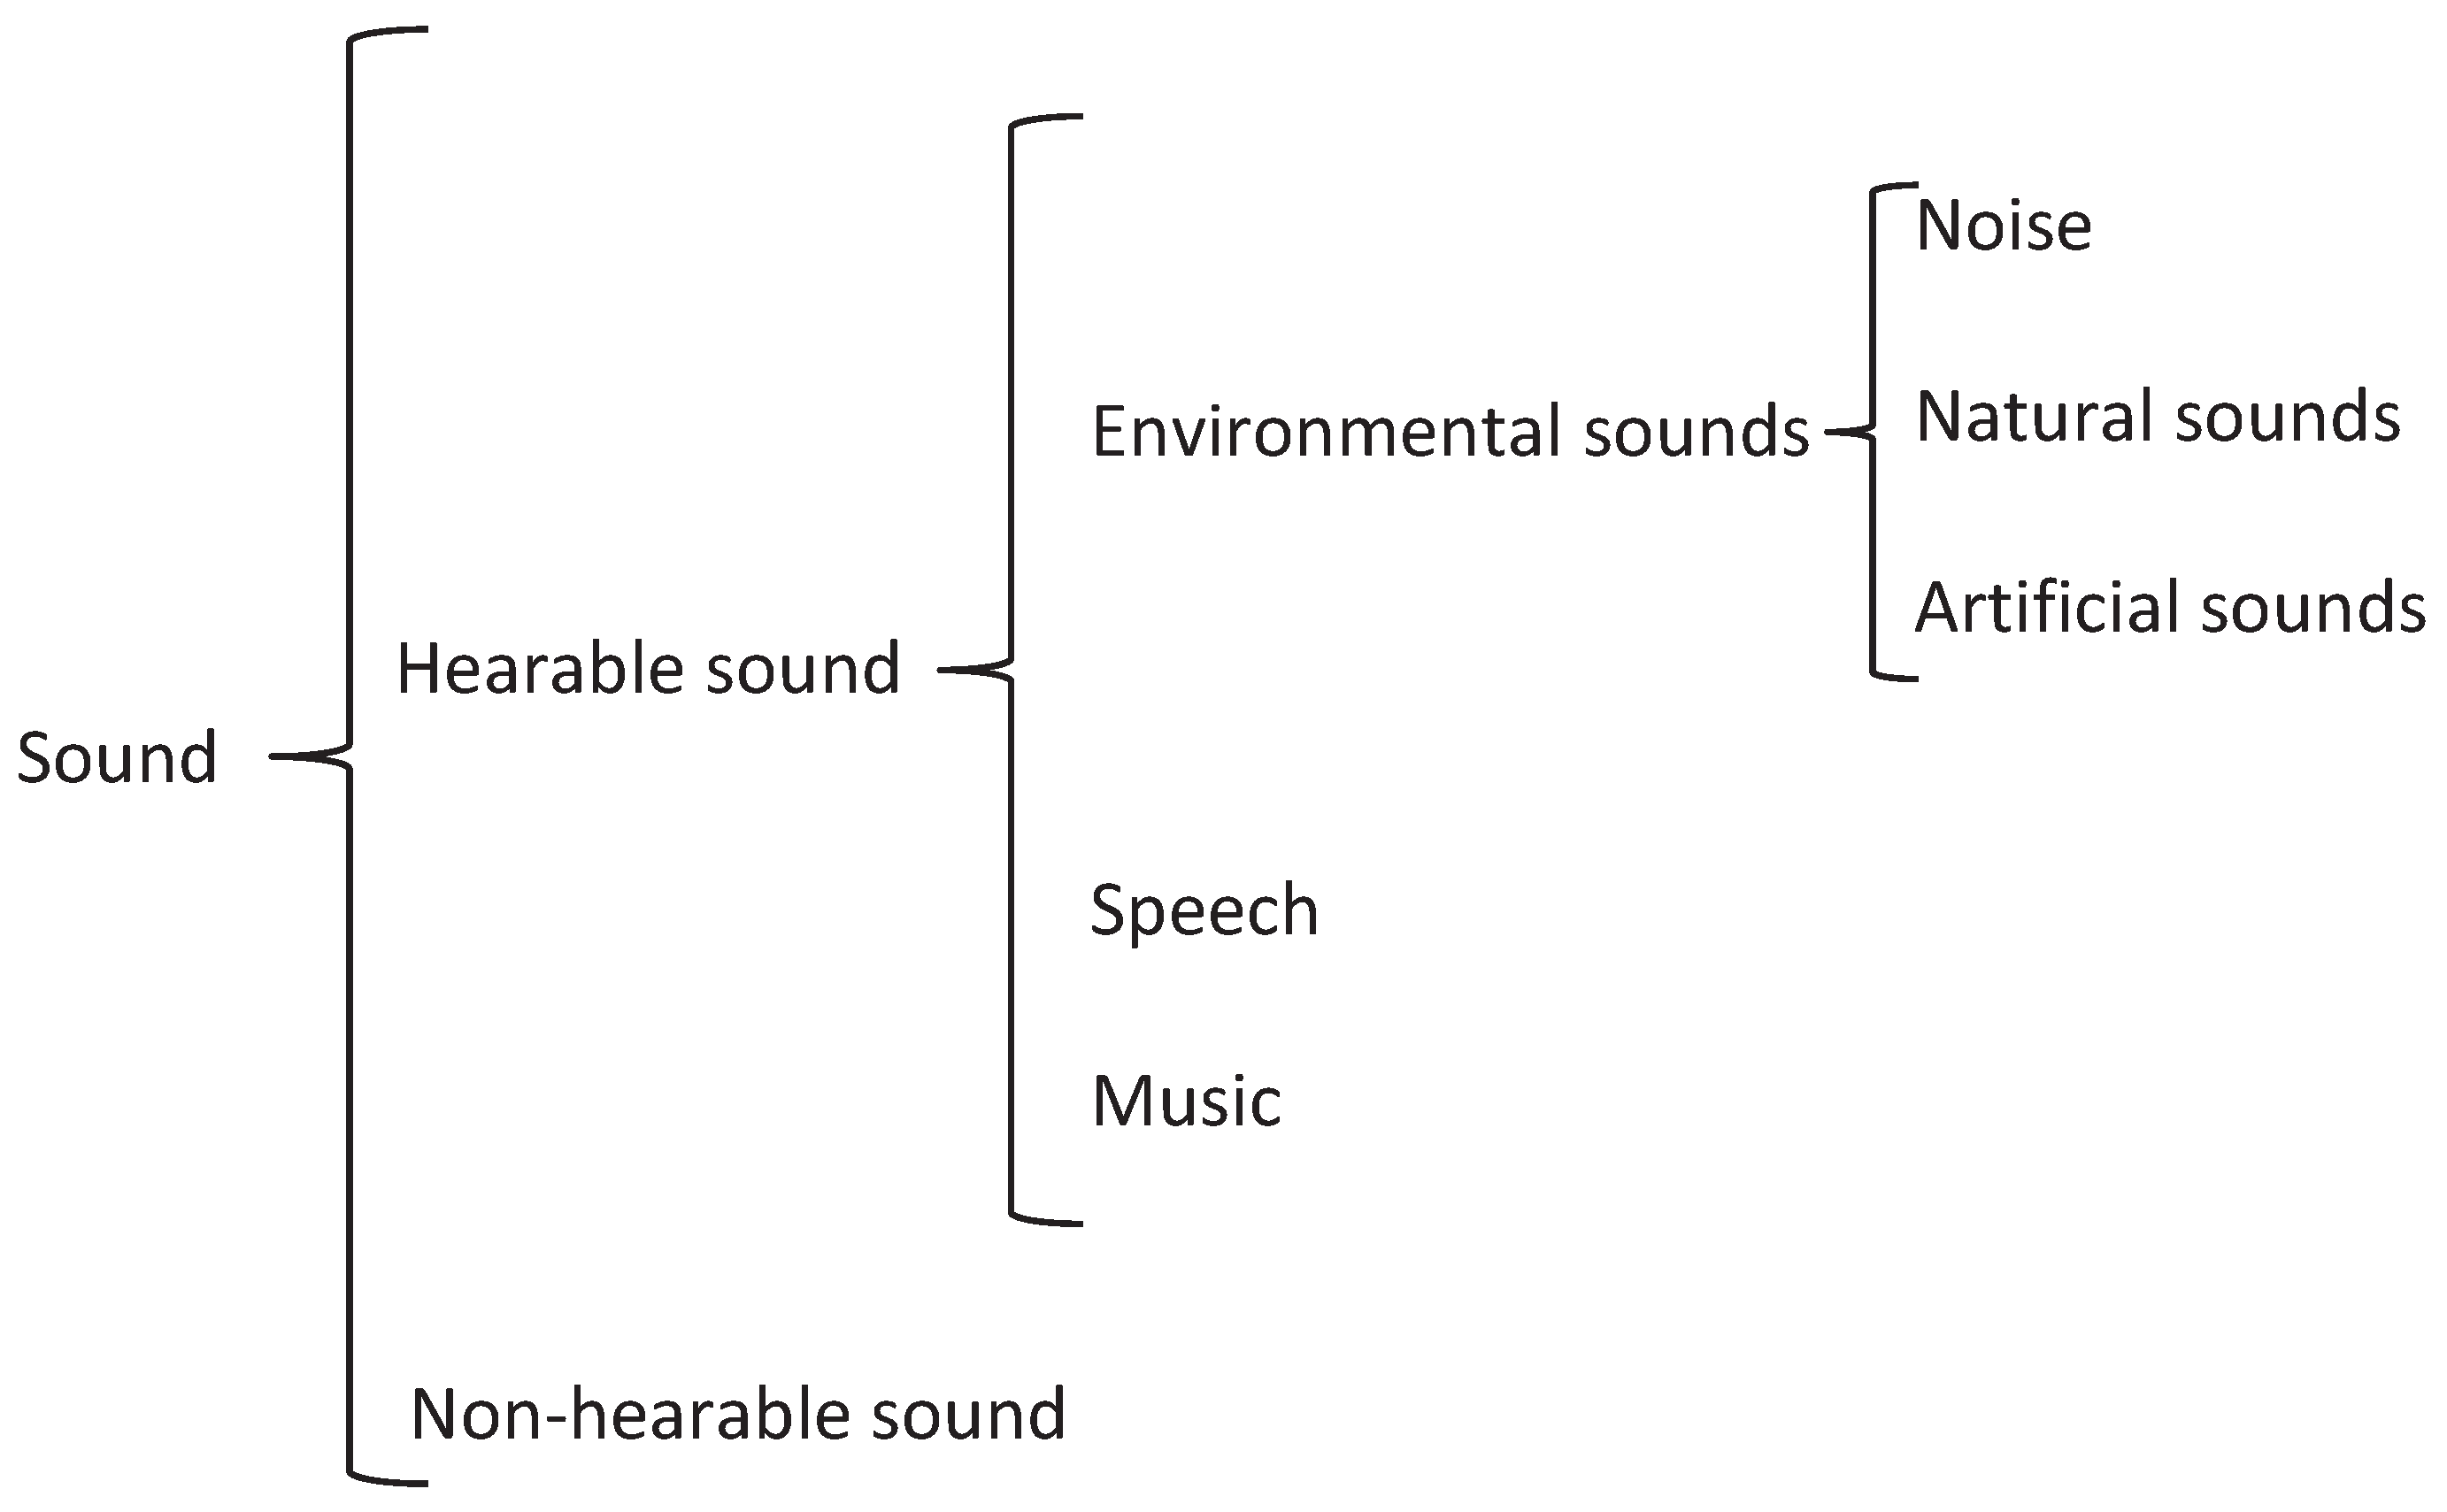
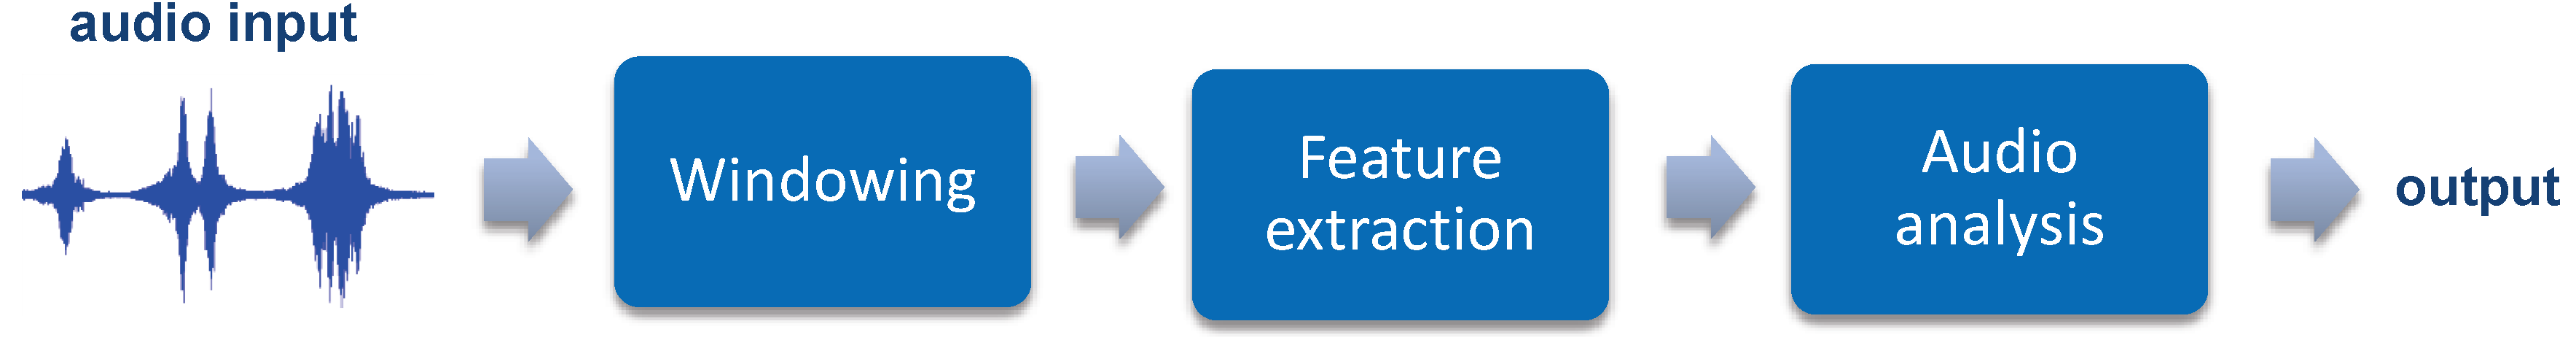
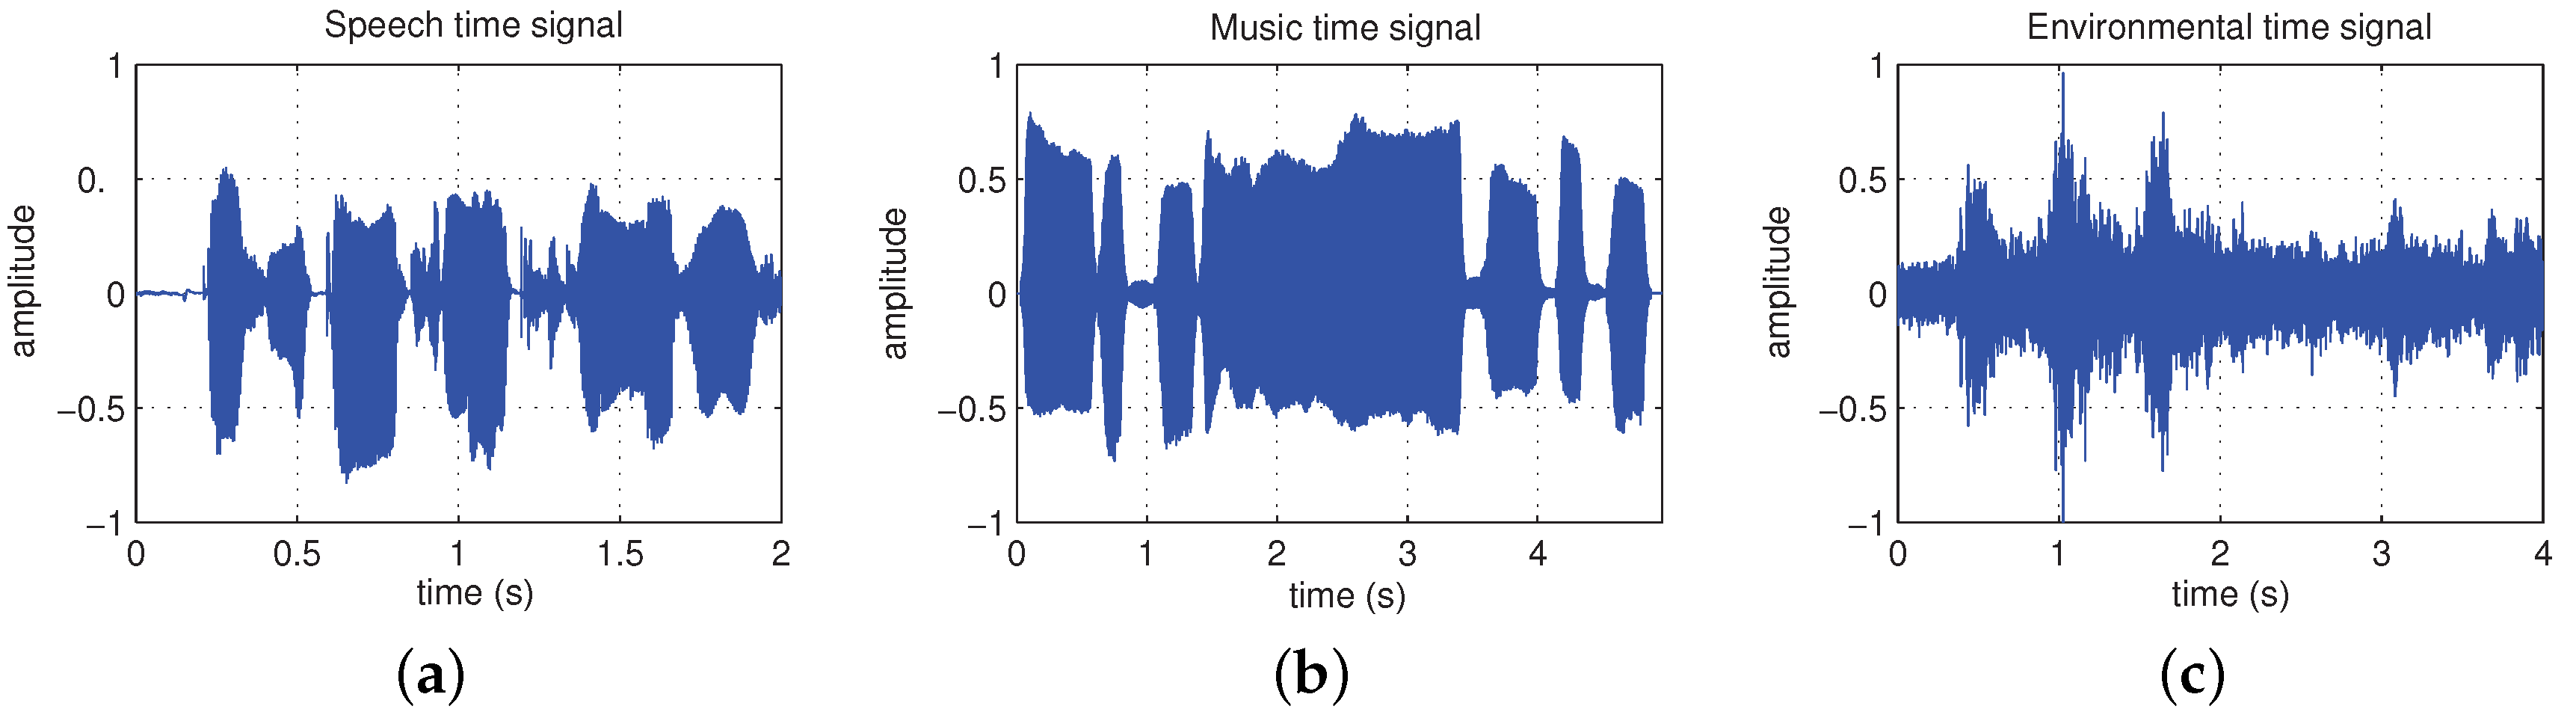


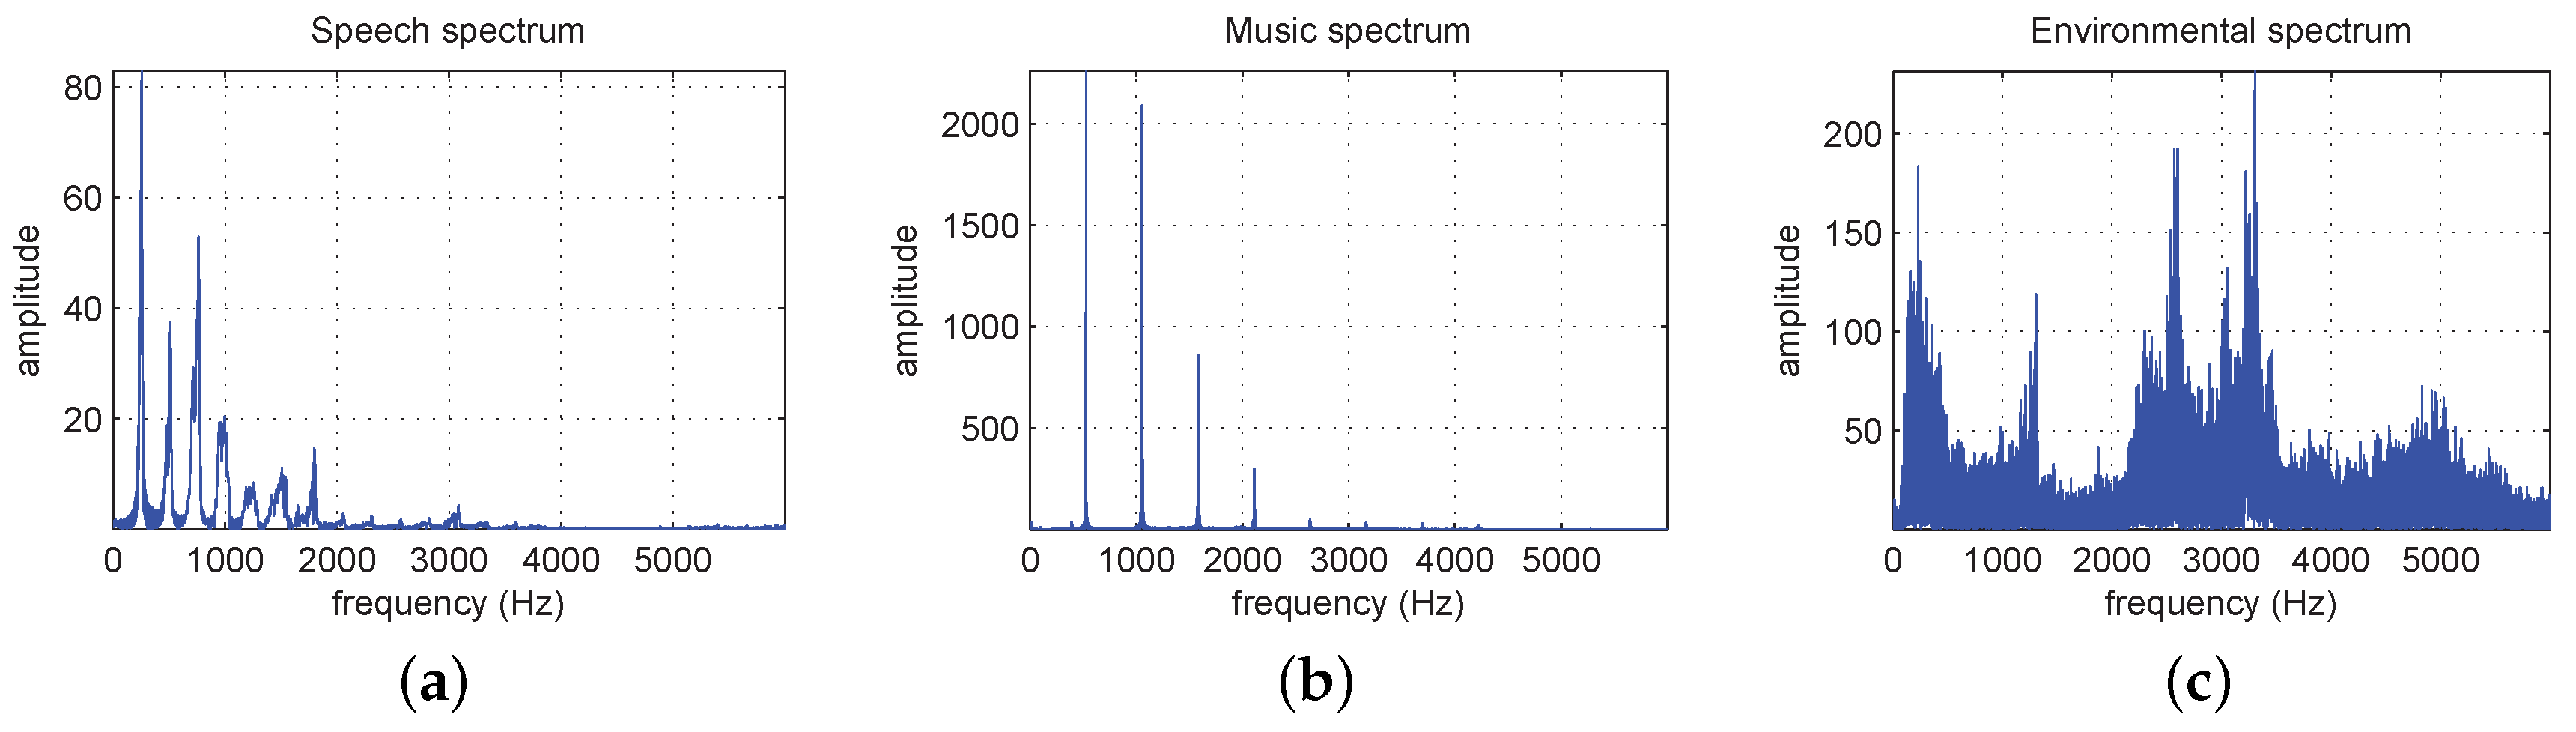
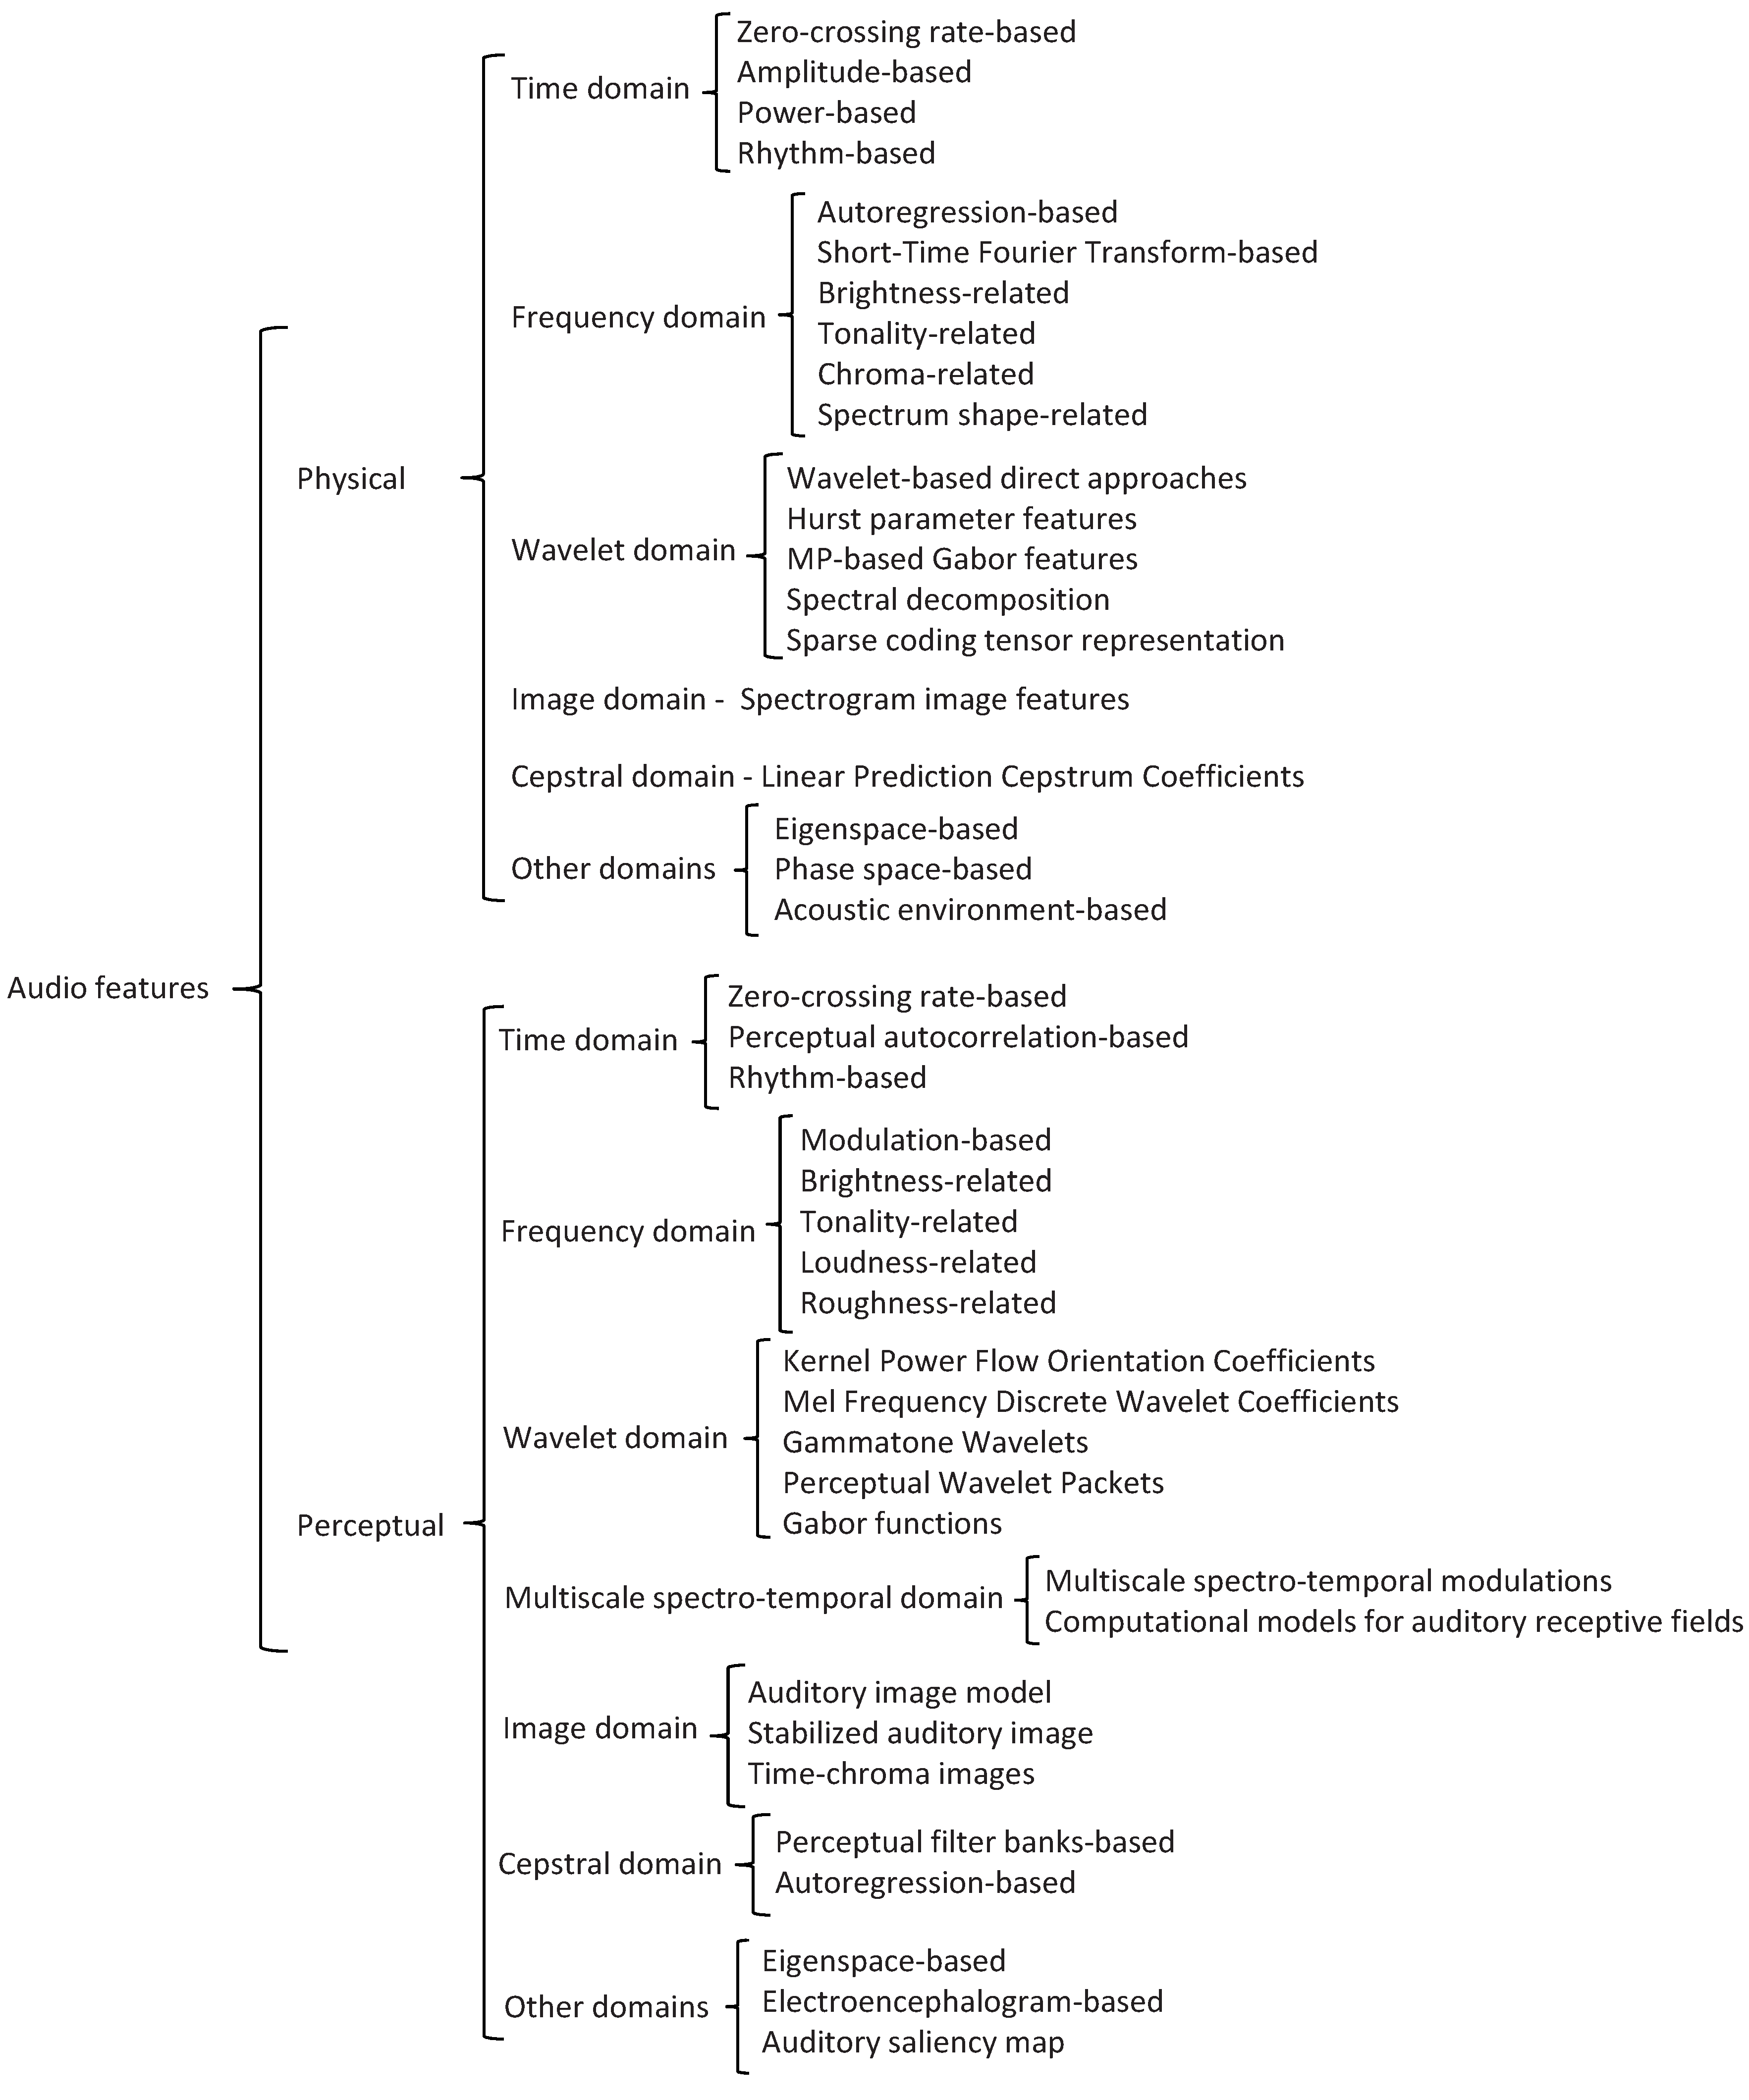
| Features | Speech | Music | Environmental Sounds |
|---|---|---|---|
| Type of audio units | Phones | Notes | Any other type of audio event |
| Source | Human speech production system | Instruments or Human speech production system | Any other source producing an audio event |
| Temporal and spectral characteristics | Short durations (40–200ms), constrained and steady timming and variability, largely harmonic content around 500 Hz to 2 KHz with some noise-like sounds. | From short to long durations (40–1200ms), with a mix of steady and transient sounds organized in periodic structures, largely harmonic content in the full 20 Hz to 20 KHz audio band, with some inharmonic components. | From short to very long durations (40–3000ms), with wide range of steady and transient type of sounds, ans also a wide range of harmonic to inharmonic balances. |
© 2016 by the authors; licensee MDPI, Basel, Switzerland. This article is an open access article distributed under the terms and conditions of the Creative Commons Attribution (CC-BY) license (http://creativecommons.org/licenses/by/4.0/).
Share and Cite
Alías, F.; Socoró, J.C.; Sevillano, X. A Review of Physical and Perceptual Feature Extraction Techniques for Speech, Music and Environmental Sounds. Appl. Sci. 2016, 6, 143. https://doi.org/10.3390/app6050143
Alías F, Socoró JC, Sevillano X. A Review of Physical and Perceptual Feature Extraction Techniques for Speech, Music and Environmental Sounds. Applied Sciences. 2016; 6(5):143. https://doi.org/10.3390/app6050143
Chicago/Turabian StyleAlías, Francesc, Joan Claudi Socoró, and Xavier Sevillano. 2016. "A Review of Physical and Perceptual Feature Extraction Techniques for Speech, Music and Environmental Sounds" Applied Sciences 6, no. 5: 143. https://doi.org/10.3390/app6050143
APA StyleAlías, F., Socoró, J. C., & Sevillano, X. (2016). A Review of Physical and Perceptual Feature Extraction Techniques for Speech, Music and Environmental Sounds. Applied Sciences, 6(5), 143. https://doi.org/10.3390/app6050143