1. Introduction
Energy-harvesting technology has attracted an enormous number of researchers to come up with promising solutions to develop real-time and endless energy supply for low-power electronics, such as wireless sensors and micro-electro-mechanical systems [
1,
2,
3,
4]. For their compact size and high-energy density, piezoelectric materials have been widely used in the research of feasible designs of devices [
5,
6,
7,
8]. These devices will convert any available micro source energy into electric power, which can replace batteries in electronic devices. Common sources of ambient energy are available for conversion into electric energy, such as pressure energy and vibration energy [
9,
10,
11]. Fluidic energy is a kind of clean energy, such as compressed air and waves. Compressed air energy has attracted great attention due to its kinetic energy induced by piezoelectric materials [
12,
13,
14,
15]. Bryant et al. demonstrated a sealed spaced array of aeroelastic flutter energy harvesters, and the experimental result showed that the harvesters can extract additional energy from the wake of upstream harvesters, causing larger oscillation amplitudes and higher power output in the trailing devices [
16]. Abdelkefi et al. investigated the level of harvested power from aeroelastic vibrations, and these designed piezoaeroelastic energy-harvesters can perform better at specific wind speeds [
17].
Many researchers have explored the characteristic of electricity generation in different special air environments [
18,
19,
20,
21,
22,
23]. Sealed space is one such special environment. In previous works, the pressure source and pressure fluctuation-based energy-harvesting methods have already been researched in depth. Kim et al. analyzed and tested the effects of geometric factors and electrode patterns on the performance of a piezoelectric plate under a pressure source condition [
24,
25]. Mo et al. presented a method for analyzing the energy generation performance of a pressure-loaded system using piezoelectric transducer technology [
26]. Wang et al. have researched the performance of a sealed energy harvester driven by hyperbaric air load [
27,
28]. In the pneumatic system, the sealed space is a common environment where a complex air environment can be easily made. The buffer action is an important function in the air cylinder which can prevent the impact between the piston and the end cap of the cylinder.
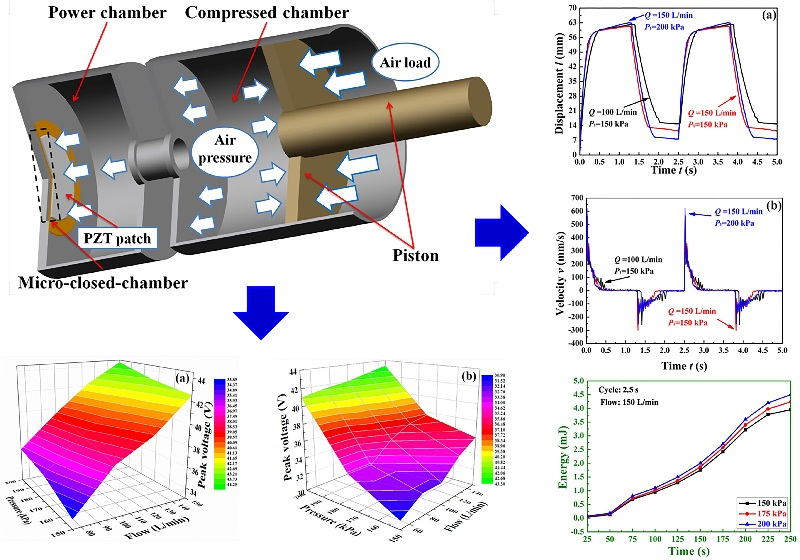
In this paper, a nonlinear piezoelectric energy harvester is presented which captures energy by changing the pressure in a pneumatic system. The purpose of this research was to study an energy harvester excited by the alternating air load. A prototype of the harvester was fabricated and it consists of a power chamber and a compressed chamber. A flexible piezoceramic patch (PZT patch) is fixed to the bottom of power chamber, which was designed with an orifice. The orifice can quarantine the complex, changing air; the piezoceramic patch only can be excited by the alternating air load. The energy from the alternating air load can be harvested through the deformation of the lead piezoceramic patch. The driving force is the changing of air parameters in the pneumatic system. The test system was built and the experiments were designed to explore the relationships between the generated power and the compressed air parameters. The test results show that the energy generation performance of the harvester can be obviously influenced by changing air parameters, such as pressure and air flow. The energy can be stored in the capacitance, and the electric energy is enough to supply a self-powered wireless sensor system.
2. The Structure and Working Principle
To gain a better understanding of the motivation for developing a nonlinear piezoelectric energy harvester, let us first consider the excitation that can be provided in the pneumatic system. The cylinder is the most important component in the pneumatic system, and the piston can be moved by to the driving force of the compressed air. In this study, the cylinder is used to cause alternating air load through the moving piston. The stable compressed air, which is adjusted by pneumatic system, can provide the driving force that moves the piston. The structure and working principle of the presented harvester is shown in
Figure 1.
The presented harvester consists of a power chamber, a compressed chamber, a piston, and a PZT patch that can transform the compressed energy under the direct piezoelectric effect. An airtight space is formed by the power chamber and compressed chamber. The power chamber is designed to have an orifice, which can quarantine the complex changing air, and the piezoceramic patch only can be excited by the alternating air load. When the stable compressed air load acts on the piston, the volume of compressed chamber is condensed. The alternating air loads act on the PZT patch and electricity can be produced through the deformation of the PZT patch. The pressure difference between the power chamber and the micro-closed chamber causes the maximum deformation of the PZT patch.
3. The Model of the Volume Compression
The model of volume compression in
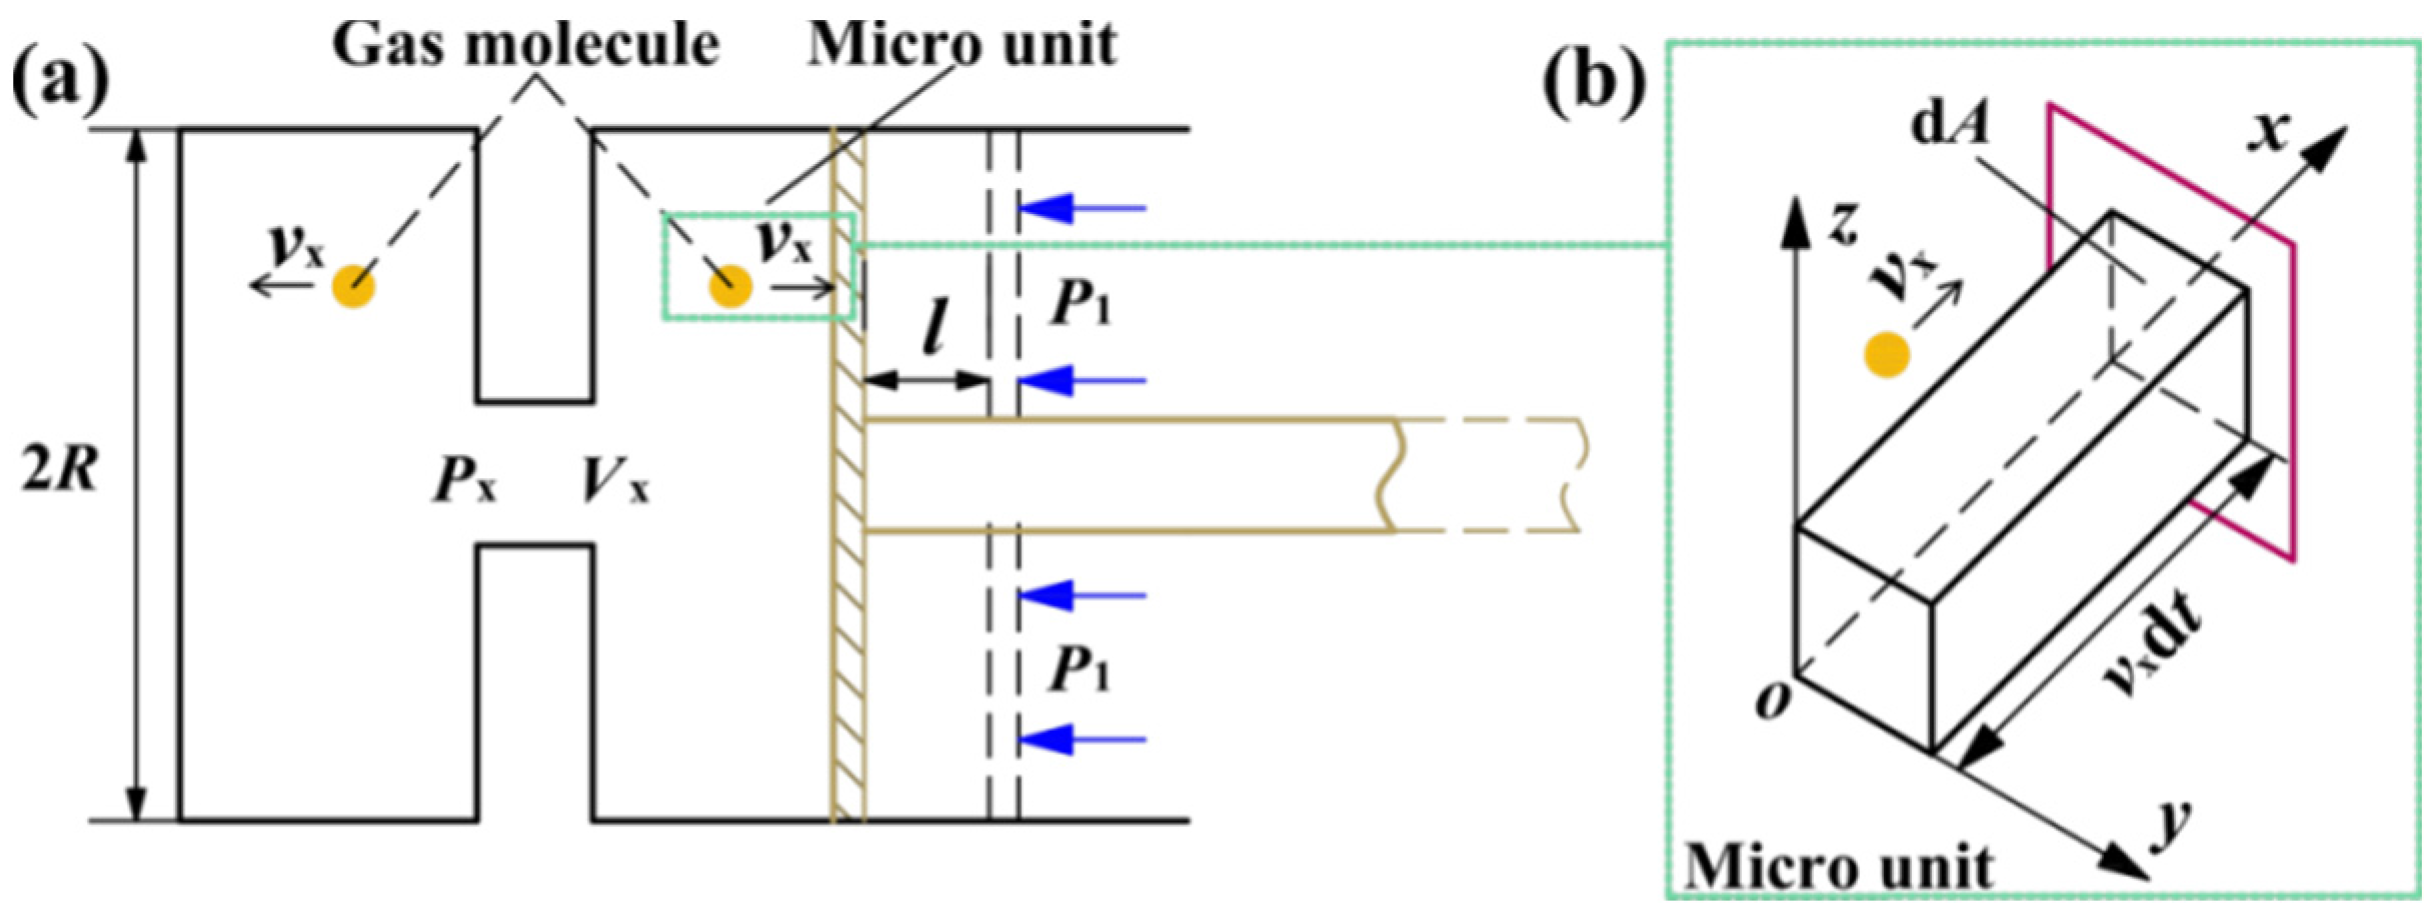
Figure 2 presents the relationship between volume compression parameters and air pressure.
Figure 2a shows the model of structure and compressed air. A certain quality atmosphere is in the sealed piezoelectric energy harvester. The pressure is produced by the impact of gas molecules, and the pressure in the sealed volume can be changed by moving the piston.
Figure 2b shows the micro unit of volume compression. The theory of compressed air can be represented by the micro unit.
The radius of the power chamber and compressed chamber are defined as R. The moving distance of the piston is l. Px and P1 are the changing pressure in the power chamber and compressed air load, respectively. Vx is the instantaneous volume. In order to analyze the changing pressure, the internal air environment is defined based on the theory of compressible gas and the type of the ideal gas. It is assumed that there is no heat exchange in the system.
In
Figure 2, the quality of a single gas molecule is
m0. In the sealed chamber, the pressure is produced by the impact of gas molecule.
N is the number of the gas molecules in the sealed chamber,
V0 is the initial volume of sealed chamber, and
v is the velocity of gas molecule. The vector equation of velocity can be defined as follow:
where
vx is the velocity component in
x direction and the wall of the chamber is struck by the gas molecule. From the kinetic energy only in the
x direction acting on the PZT patch, deformation is produced. Thus, the velocity in
x direction has been analyzed. The impulse of a single gas molecule in
x direction is 2
m0vx. The model of a micro unit is shown in
Figure 2b.
According to the theory of gas dynamics, the speed of the piston is much less than the speed of gas molecule. So, it can be assumed that gas distribution could not be influenced by the speed of piston and the gas is equally distributed in two chambers due to the rapid motion speed of gas. The changing function of unit volume molecules
fn(
t) can be expressed as:
Where
S0 is the area of piston.
According to the theory of Maxwell velocity distribution law, the speed distribution function in the
x direction
f(
vx) can be expressed as:
According to the Equations (2) and (3), the differential of gas molecule number d
N can be obtained as follow:
According to the Equation (4), the differential of impulse d
I can be obtained
According to the theory of gas-molecular dynamics, the velocity of the molecule is between zero and infinity. The impulse equation is
According to the Equation (6), the changing pressure
Px can be obtained as follows:
where
is the average kinetic energy of a gas molecule.
4. The Model of Piezoelectric Patch
The model of piezoelectric patch presents the relationship between air pressure and output voltage, as shown in
Figure 2. The solution used in this article follows the restrictions that there is no shear strain or stress along the thickness direction (
z-direction) and that the deflection is much smaller than the thickness of the patch. In this article, the energy method is used to describe the total energy in a pressure-loaded piezoelectric patch and to ultimately calculate the electrical charge generated from the pressure source.
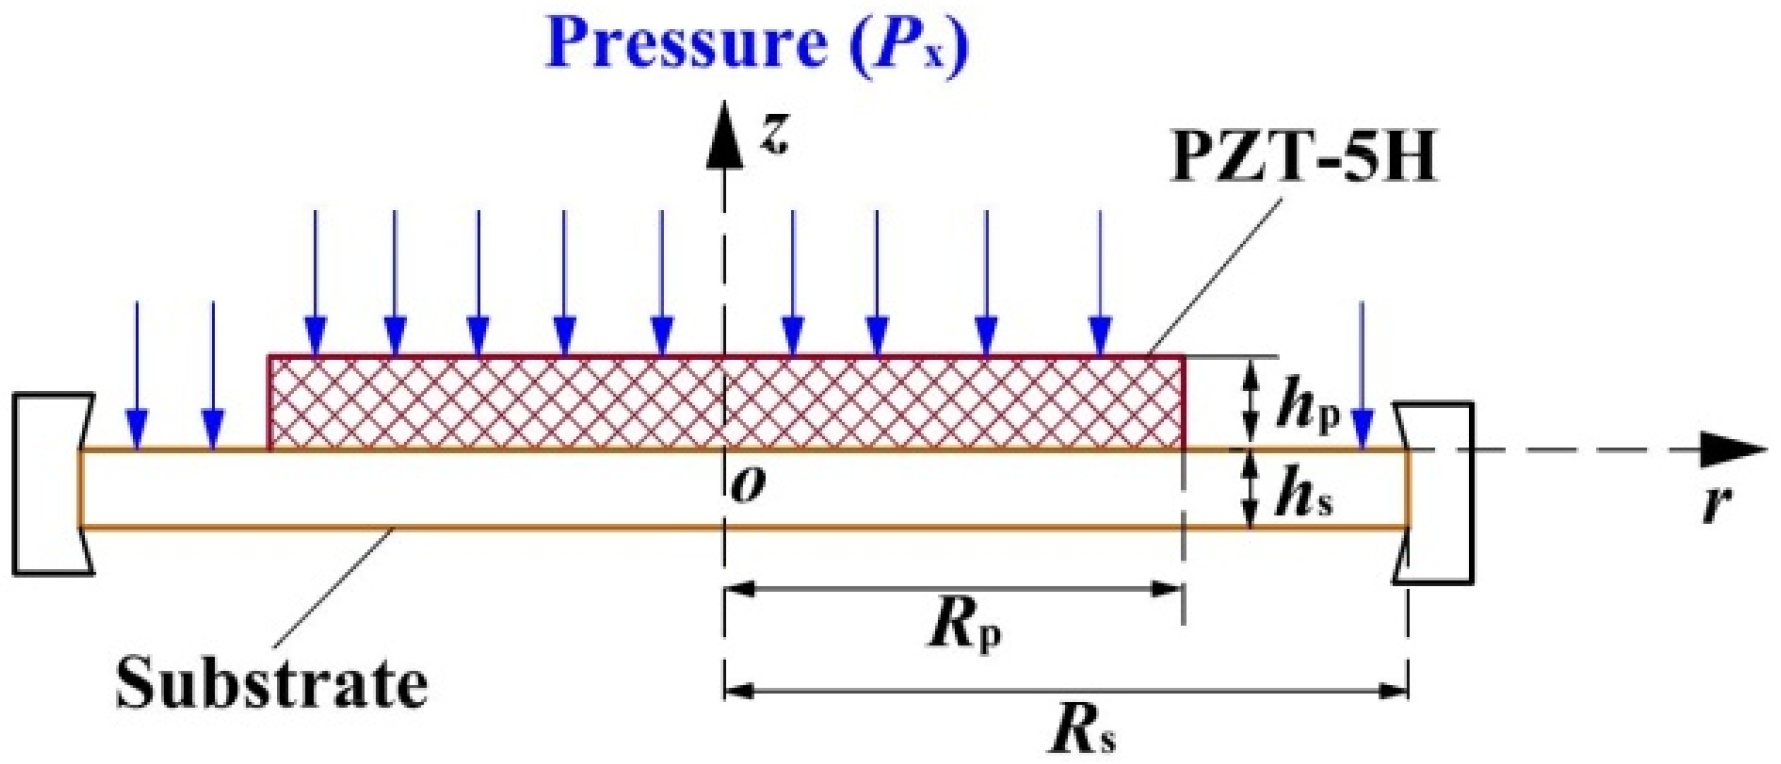
As shown in
Figure 3, the established model consists of piezoelectric materials and copper substrate, which are marked. The thicknesses of PZT-5H and copper substrate is represented by
hp and
hs, respectively. The equations governing the transverse deflection, bending, and shearing action of the piezoelectric patch subjected to the uniformly distributed constant pressure load
Px are given by [
29]:
where
Wr is the deflection of the patch in the z-direction,
r is the distance from the center of the patch to the point of deflection,
Mr and
Mθ are moments in the
r and θ directions, respectively, ν is Poisson’s ratio,
Px is pressure,
Qr is shear force and
D is flexural rigidity of the patch.
Vout is the output voltage. The relationship among
Wr,
Px,
Vout and electric energy
U has been researched in earlier studies [
26].
According to Equations (2), (7) and (14),
U can be expressed as follow:
where
M and
K are calculated by the dielectric and piezoelectric parameters.
Equations (13) and (15) can be used to explore the influence of the relative parameters on energy generation of a piezoelectric harvester. It can be seen that the pressure is proportional to the output voltage. In the pneumatic system, the air condition can be influenced by the piston moving. The compressed air shows a nonlinear characteristic, and as the result, the output voltage of the piezoelectric patch is influenced by the nonlinear compressed air load.
In the equations, a rough influence trend of the relative parameters on energy generation appears. Although it is difficult or impossible to build an accurate analytical model for accurate calculation the important parameters are shown to guide the simulation and experiments. In this study, the feasibility was validated for the presented harvester to harvest alternating air energy. In the following sections, the influence of relative parameters of the harvester is investigated.
5. Simulation Analysis of Piezoelectric Patch
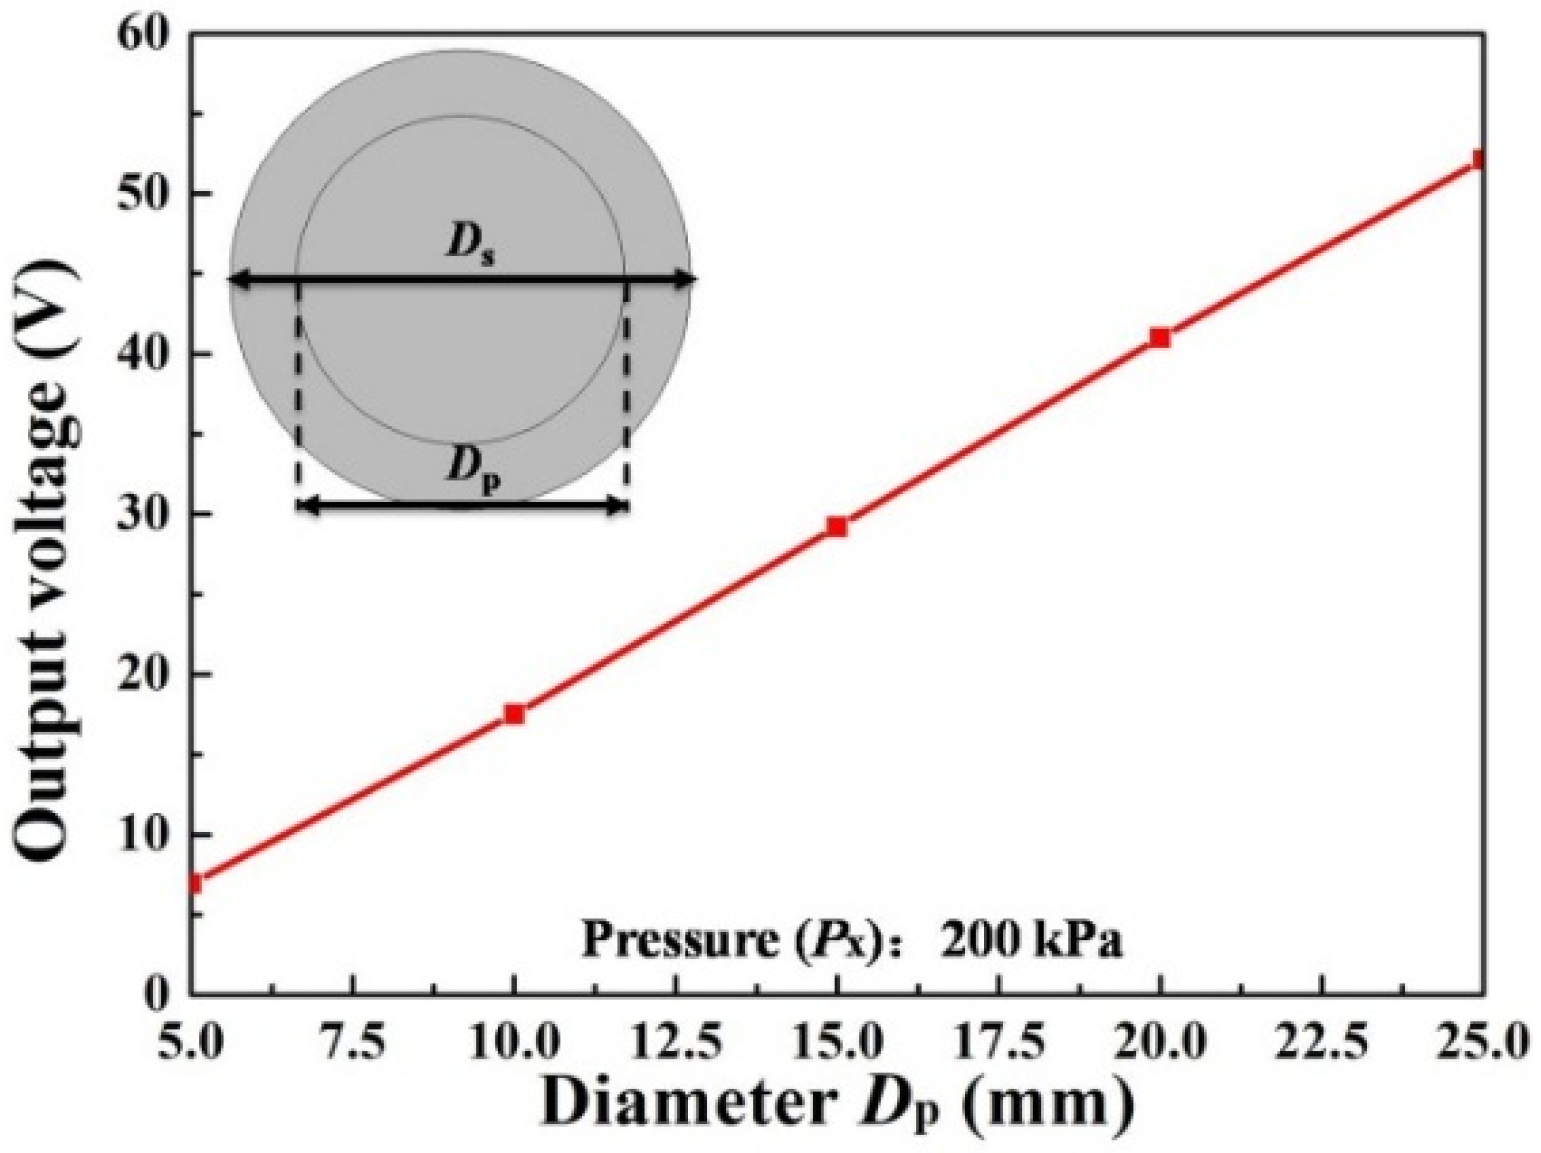
The output voltage can be influenced by the size of piezoelectric patch. In order to research the relationship between the diameter of piezoelectric patch and output voltage, a simulation analysis was performed using COMSOL software (No. 5.2, COMSOL Inc., Stockholm, Sweden). The model was built and the sweep gridding was used to analyze the characteristics of power generation.
Figure 4 shows the output voltage in different diameters of piezoelectric patch.
Dp is the diameter of PZT-5H and
Ds is the diameter of the substrate. The pressure of the compressed air load is fixed at 200 kPa. As the diameter of
Dp increases, the output voltage is also increases.
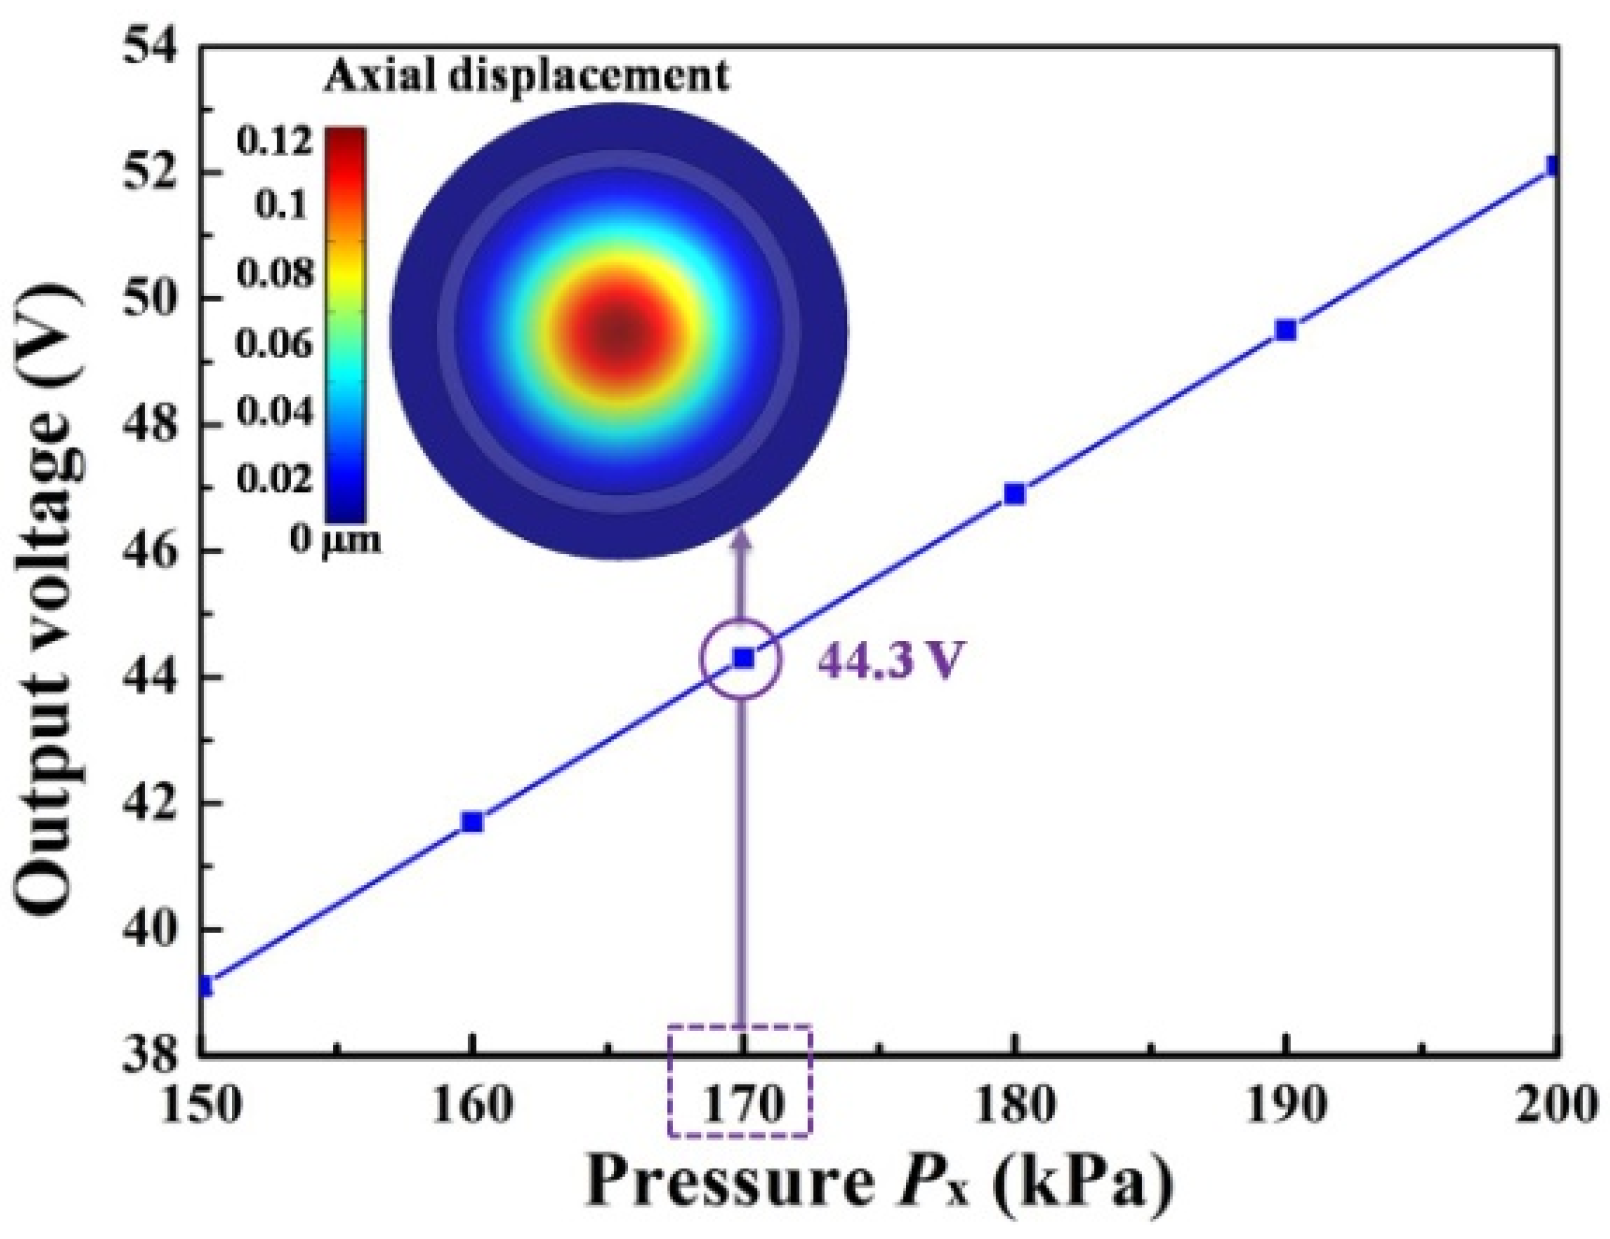
Figure 5 shows the output voltage under different pressures. When the pressure of
Px increases, the output voltage also increases. When the pressure is 200 kPa the output voltage is 52.1 V. There is an axial displacement picture for which the pressure is defined as 170 kPa, as shown in
Figure 5. As the common rule of different pressures, the pressure 170 kPa has been selected. The maximum displacement appears at the center of the PZT patch, which can bear the compressed air easily.
In this section, the structure and working principle have been designed and analyzed. The theoretical analysis and simulation results show that the output voltage is proportional to the compressed air load. When the size of piezoelectric patch increases, clearly the output voltage also increases.
6. Experimental Setup
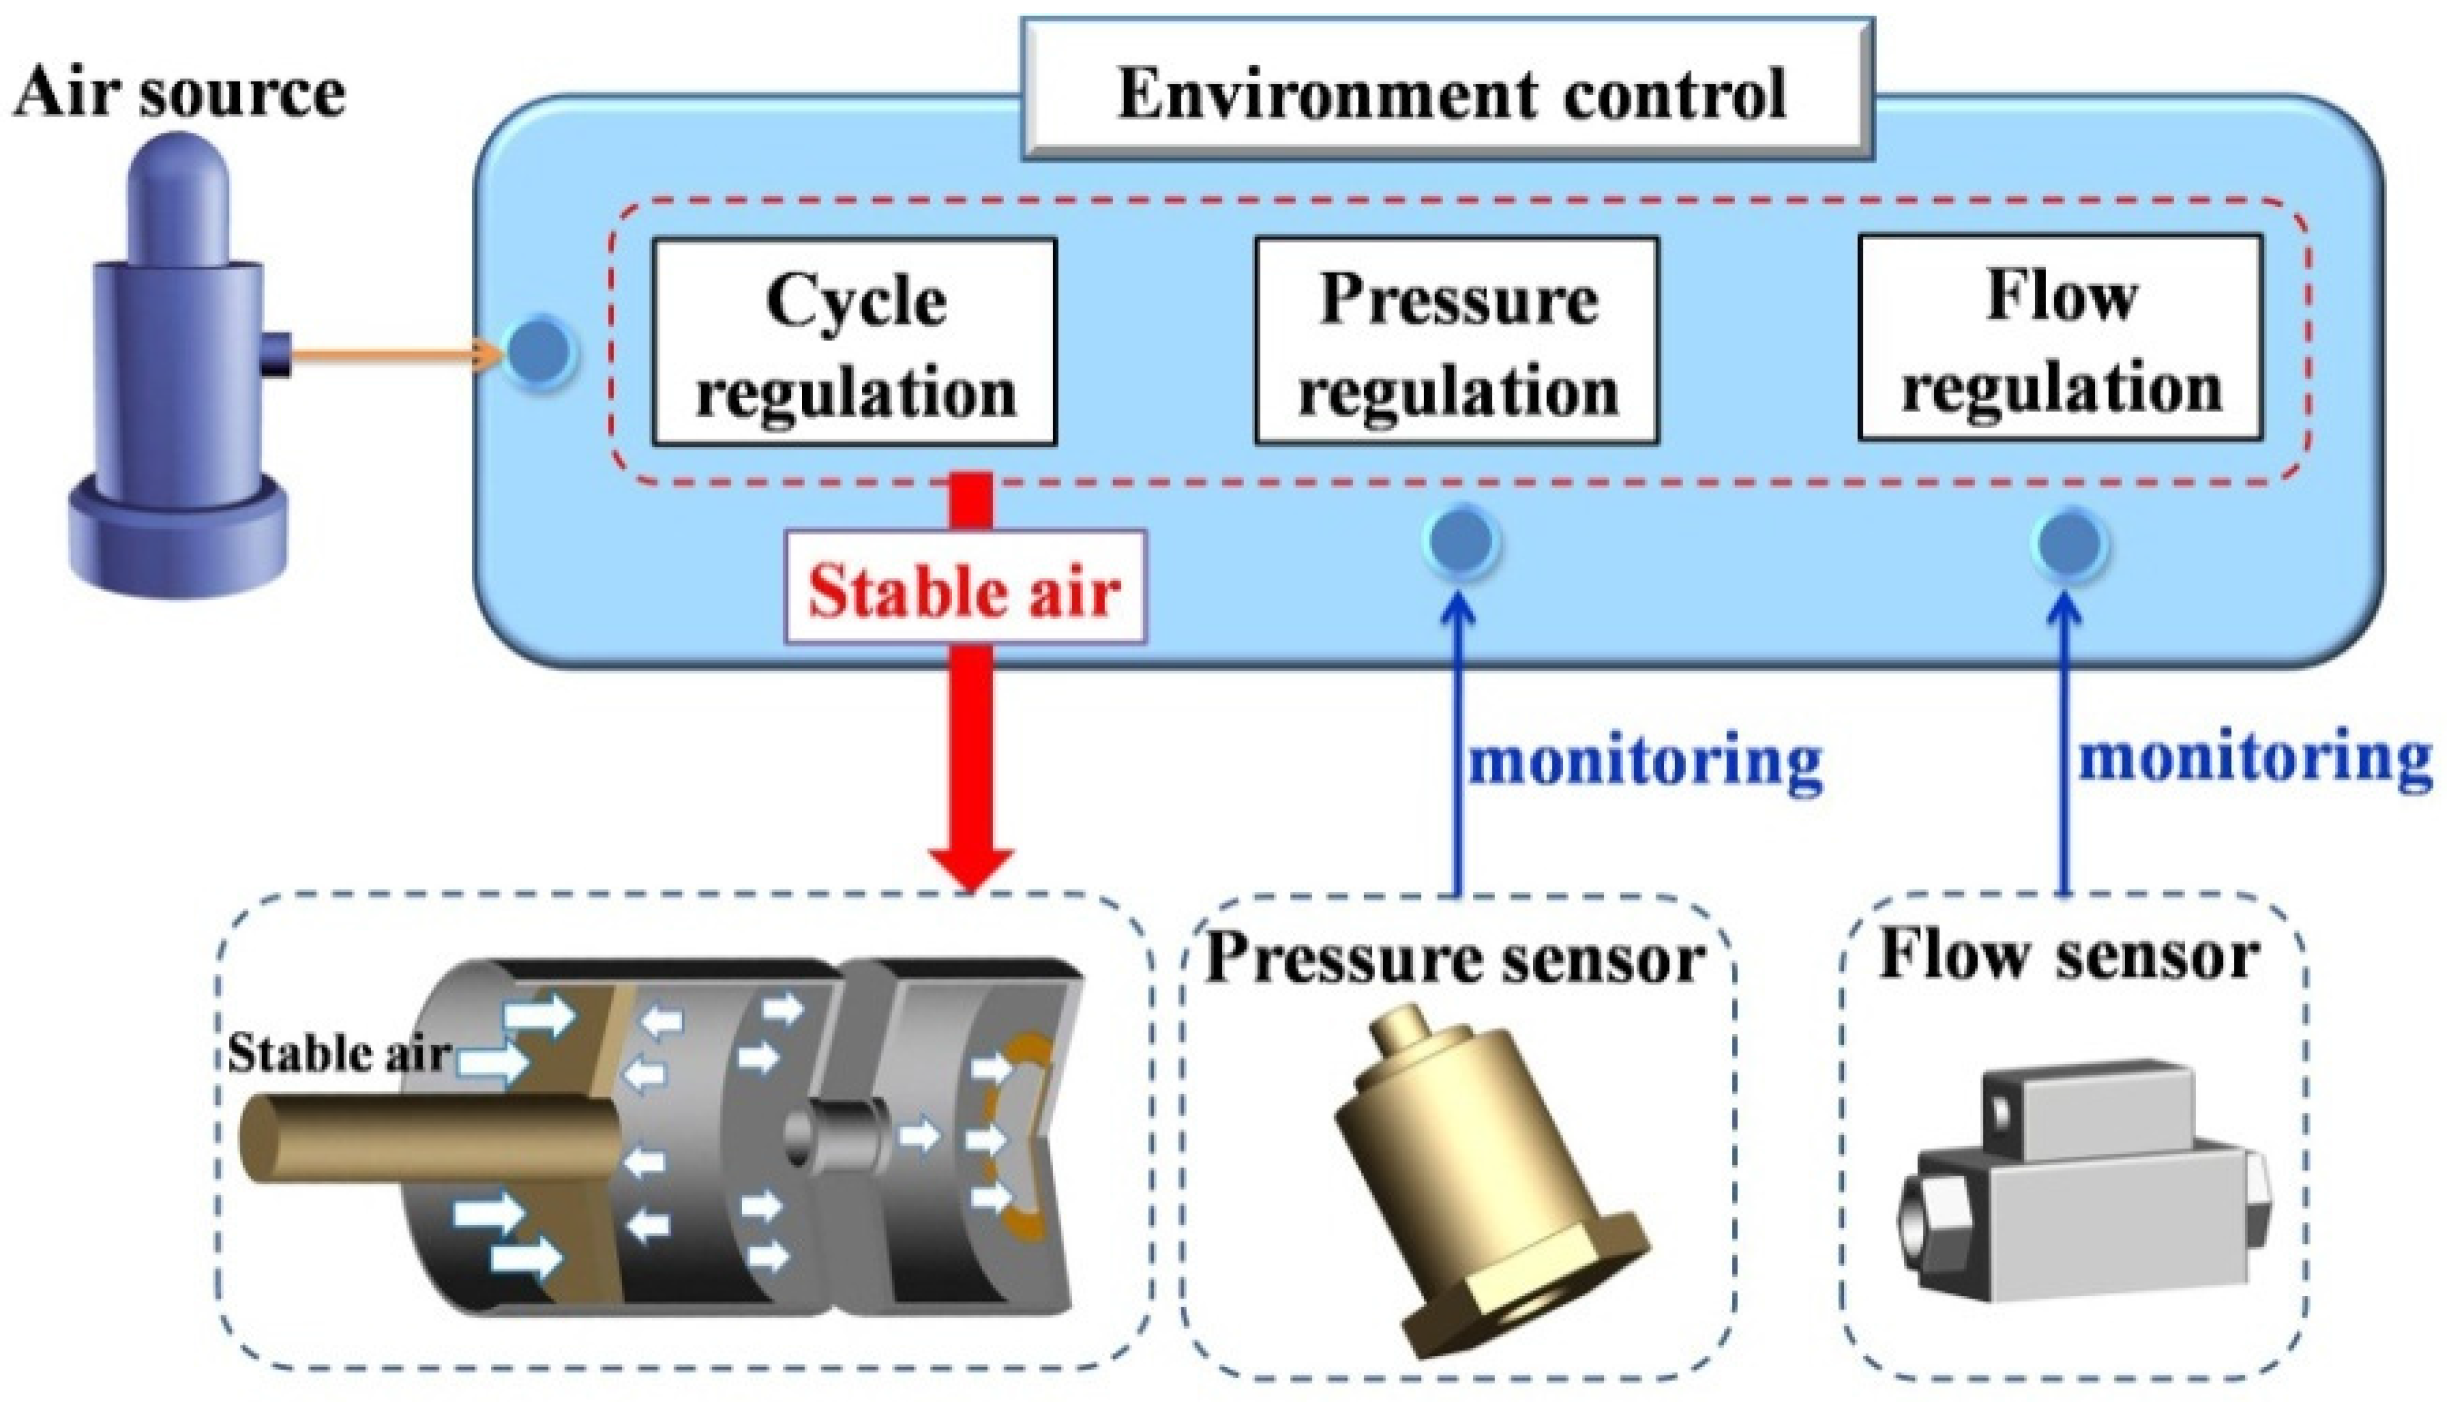
The control flow chart for the experimental system that was designed is shown in
Figure 6. The compressed air is transferred from the pressure-regulating to the reversing valve through the tube. As the compressed air flows through the throttle valve (AS2052F, SMC Inc., Tokyo, Japan), the throttle valve can ensure that the output flow is stable at a value which is used during the test. At last, the stable compressed air fills the energy harvester. In order to explore the relationship between air parameters and output voltage, different parameters are selected to study the generation performance. The frequency, pressure, flow and output voltage are recorded in the test system. With different parameters being regulated, the relationship between stable air parameters and voltage can be observed.
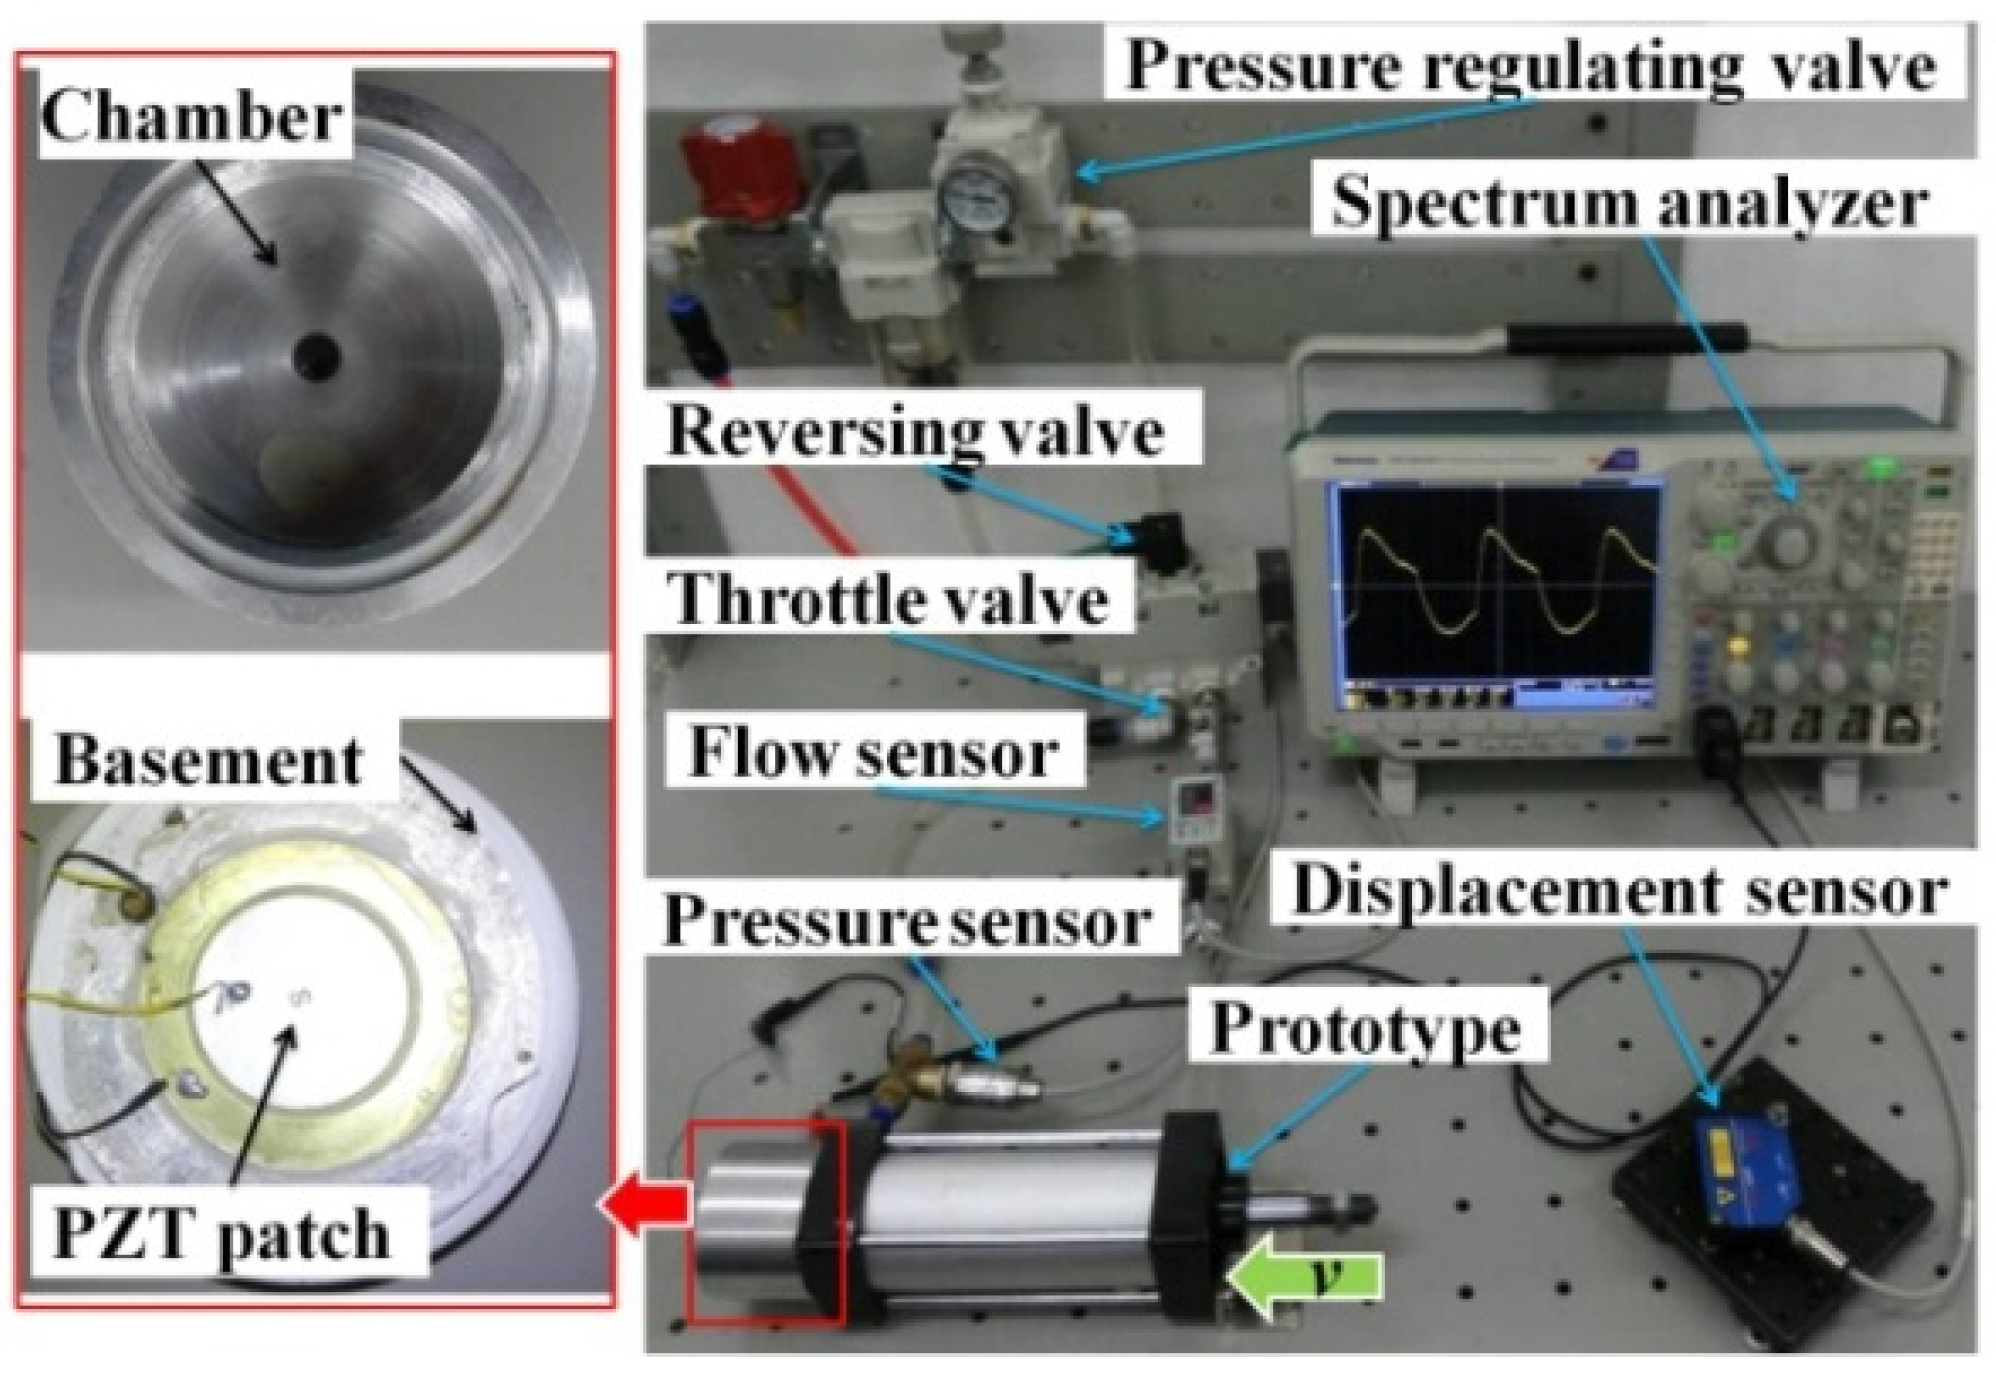
In order to validate the analytical results, the presented energy harvester was fabricated and the test system was built as shown in
Figure 7. The harvester consists of a power chamber and a compressed chamber. A flexible PZT patch (St DiBao Inc., Shenzhen, China), 35 mm in diameter, is fixed at the bottom of power chamber. The total thickness of PZT-5H and copper substrate is 0.4 mm. The PZT patch is affixed to the basement. The diameter and depth of the power chamber are 60 mm and 30 mm, respectively. A cylinder (AirTAC, Taipei, China) was chosen as the compressed chamber, whose diameter and work distance are 63 mm and 100 mm, respectively. The volume of the compressed chamber can be changed by external force. The test system consists of a pressure-regulating valve (IR3020-04, SMC Inc., Tokyo, Japan), reversing valve (VQ7-8-FG, SMC Inc., Tokyo, Japan), throttle valve (AS2052F, SMC Inc., Tokyo, Japan), flow sensor (PFA751-04, SMC Inc., Tokyo, Japan), pressure sensor (PSE560-01, SMC Inc. Tokyo, Japan) and prototype. The output voltage is displayed on a four-channel spectrum analyzer (MDO4054B-3, Tektronix Inc., Beaverton, OR, USA) using a probe (TPP0500, Tektronix Inc., Beaverton, OR, USA). The displacement of the piston is tested by the displacement sensor (ILD 1402-200, Micro-Epsilon Messtechnik GmbH, Ortenburg, Germany), whose precision is 200 μm.
7. Results and Discussion
In this section, we present the voltage outputs of the piezoelectric energy harvester under the alternating load in the pneumatic system. The stable air parameters, such as different flow and pressure, are selected to move the piston so that the volume can be compressed.
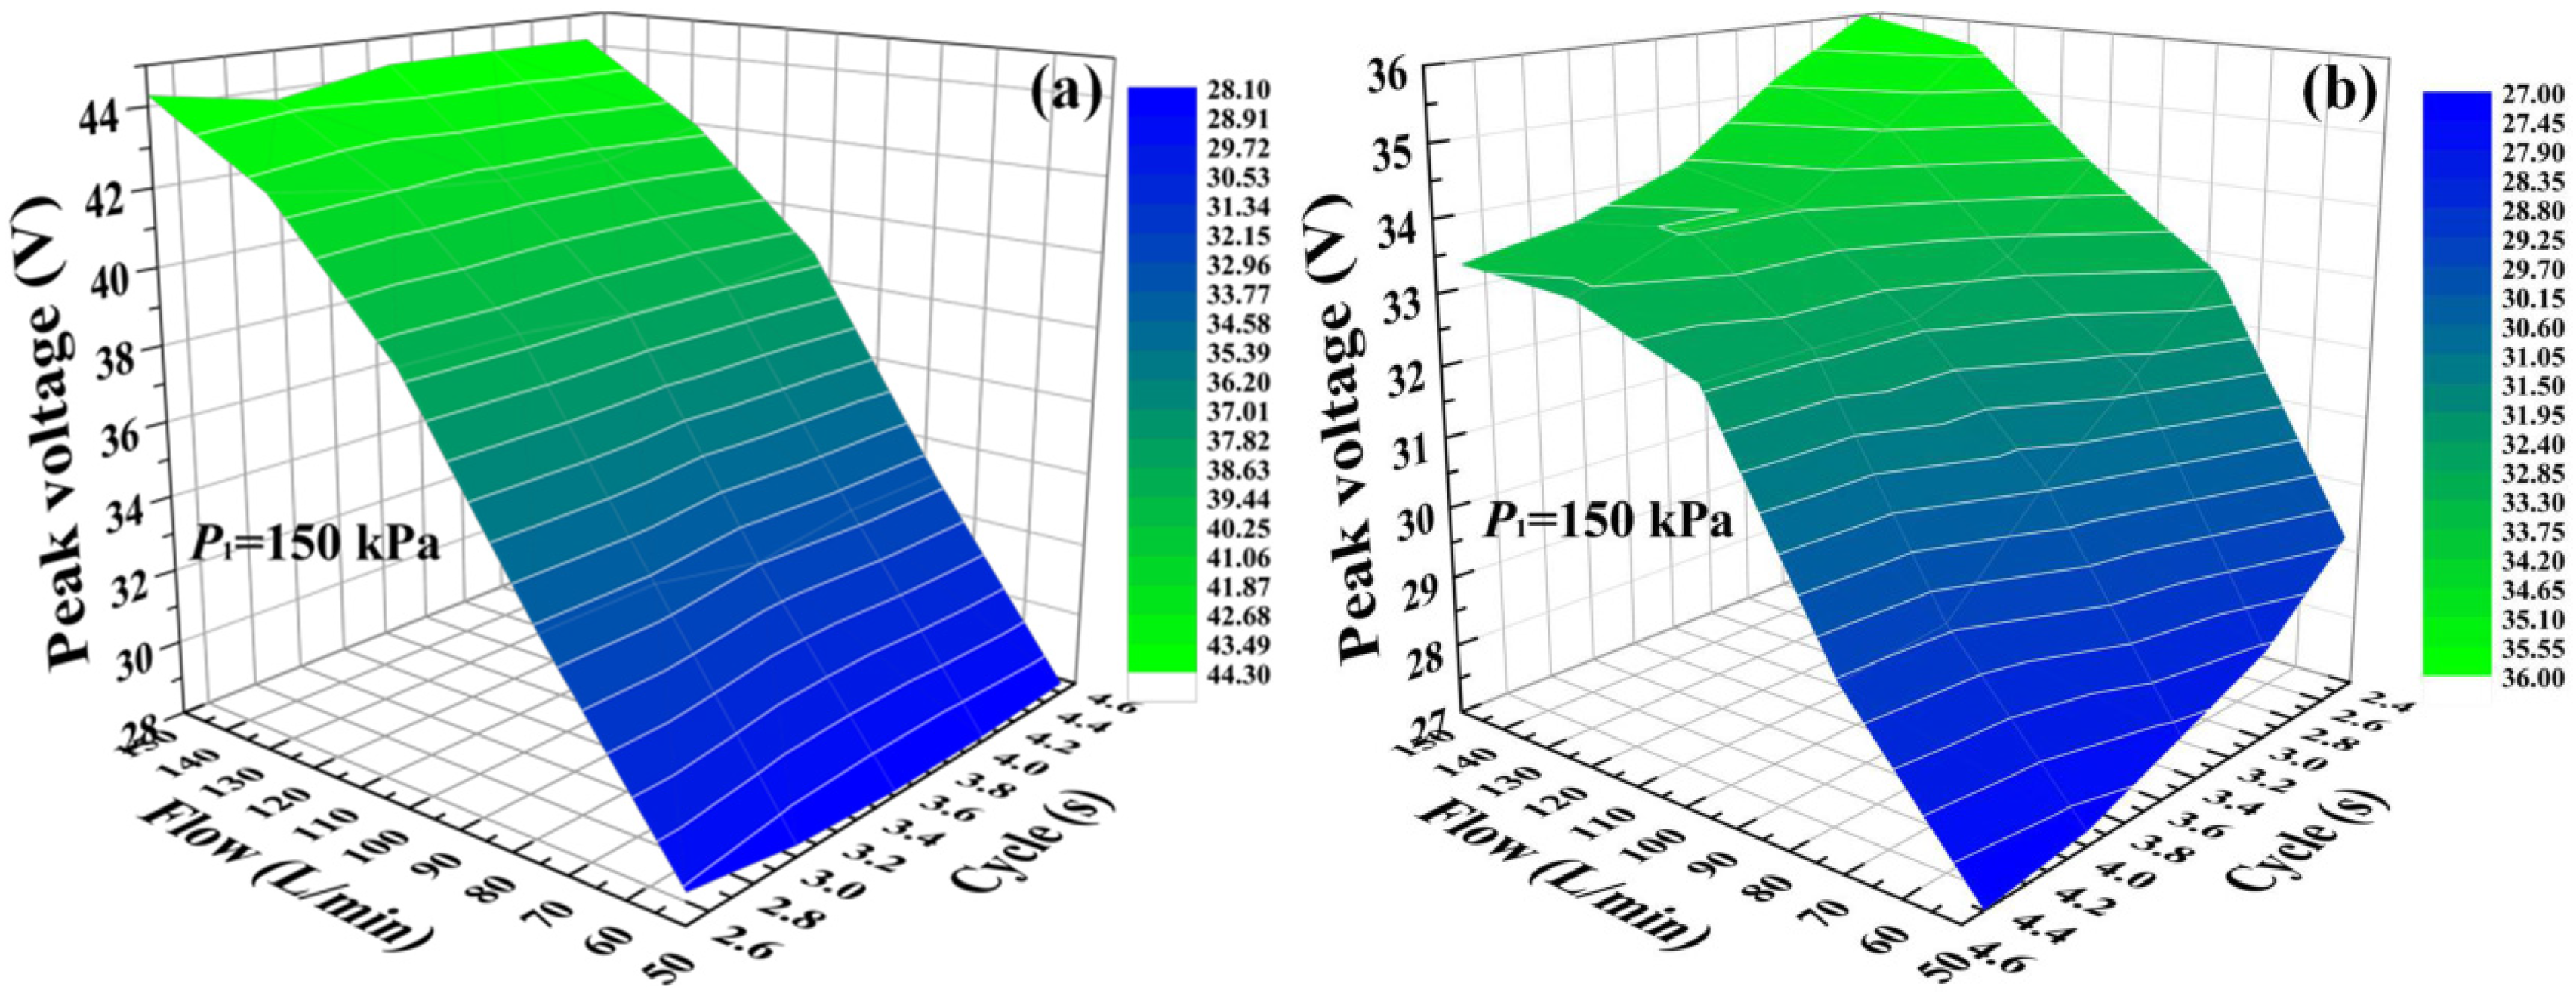
Figure 8 shows the output voltage versus different cycle times and flows.
Figure 8a shows the down-warping voltage of the PZT patch at 150 kPa. The peak output voltage continued to show a stable trend when the input cycle times increased. With the flow increased, the peak voltage increased, too. The maximum output voltage is 44.27 V at 4.5 s and 150 L/min.
Figure 8b is the spring-back voltage of the PZT patch. It is different from the down-warping state that the peak voltage is decreased with the increasing cycle times. The maximum voltage is 36.00 V at 2.5 s and 150 L/min.
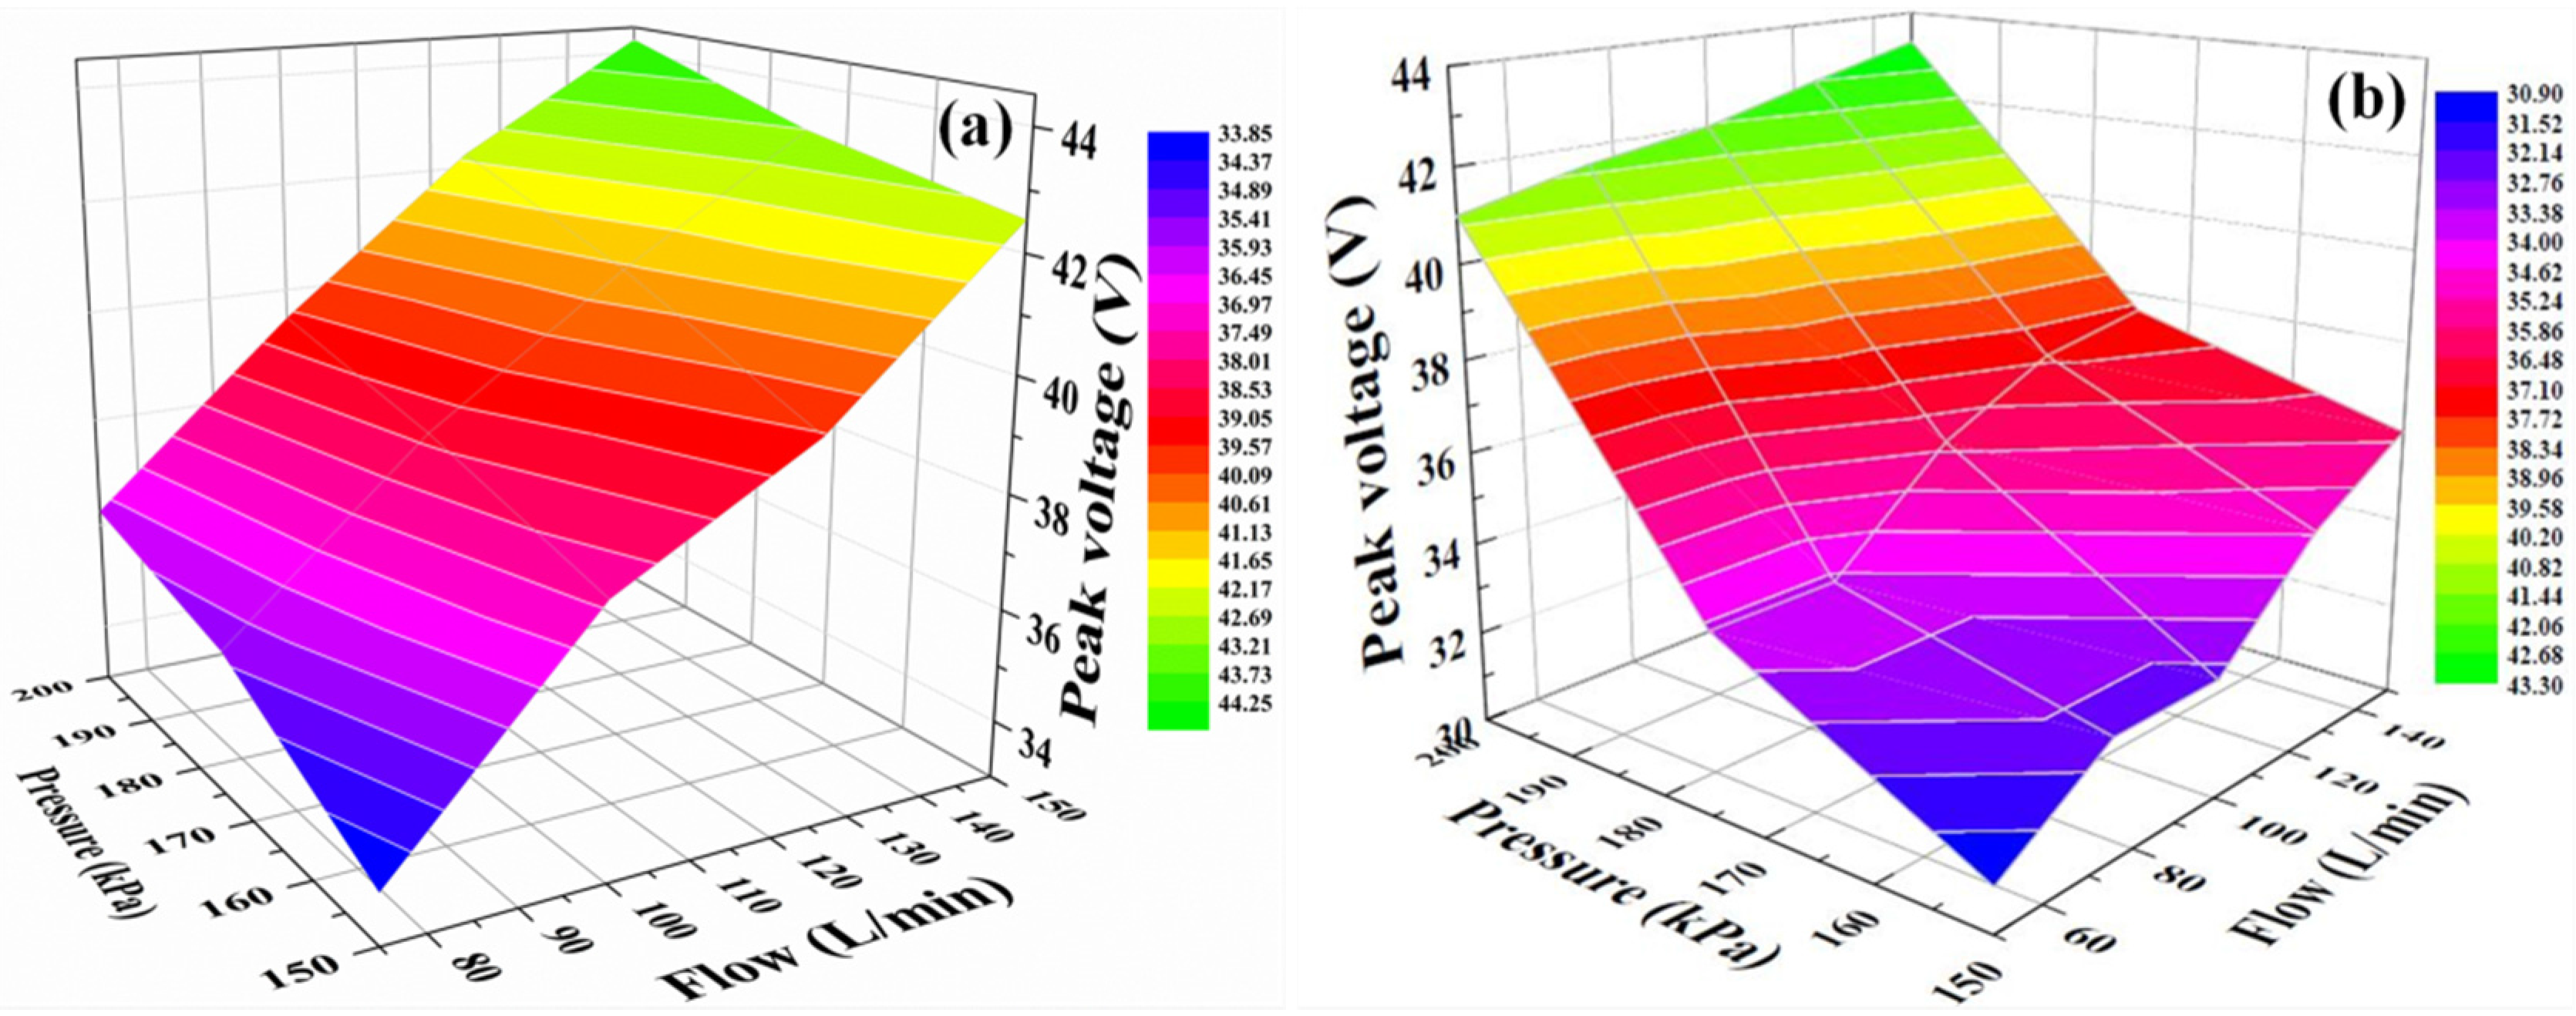
Figure 9 shows the output voltage versus flows and pressures when the cycle time is 2.5 s.
Figure 9a shows the down-warping voltage of PZT patch. The peak voltage becomes larger when the flow increases. The maximum peak voltage is 44.2 V at a flow of 150 L/min and the pressure is 200 kPa.
Figure 9b shows the spring-back voltage of the PZT patch at 2.5 s. The peak voltage becomes larger with increasing flow. Different pressures have the same rules, attributed to the pressure variation rate becoming larger when the flow becomes larger. The peak voltage also increases when the pressure increases. The theoretical analysis shows that the pressure is proportional to the output voltage (Equation (13)). The simulation results show that the output voltage increases linearly as the pressure increases. We can compare this with the experimental results, such as
Figure 9a. The down-warping voltage increases with the pressure increase and there is nearly a linear relation between the output voltage and the pressure. The simulation result shows that the output voltage is 52.10 V at 200 kPa. Under the same condition, the experimental result is 44.20 V. The deviation is related to the parameters of the sealant. The elasticity of the sealant can absorb part of the pressure and the output voltage can be diluted by the elasticity of the sealant. Thus, the test result is less than the simulation result.
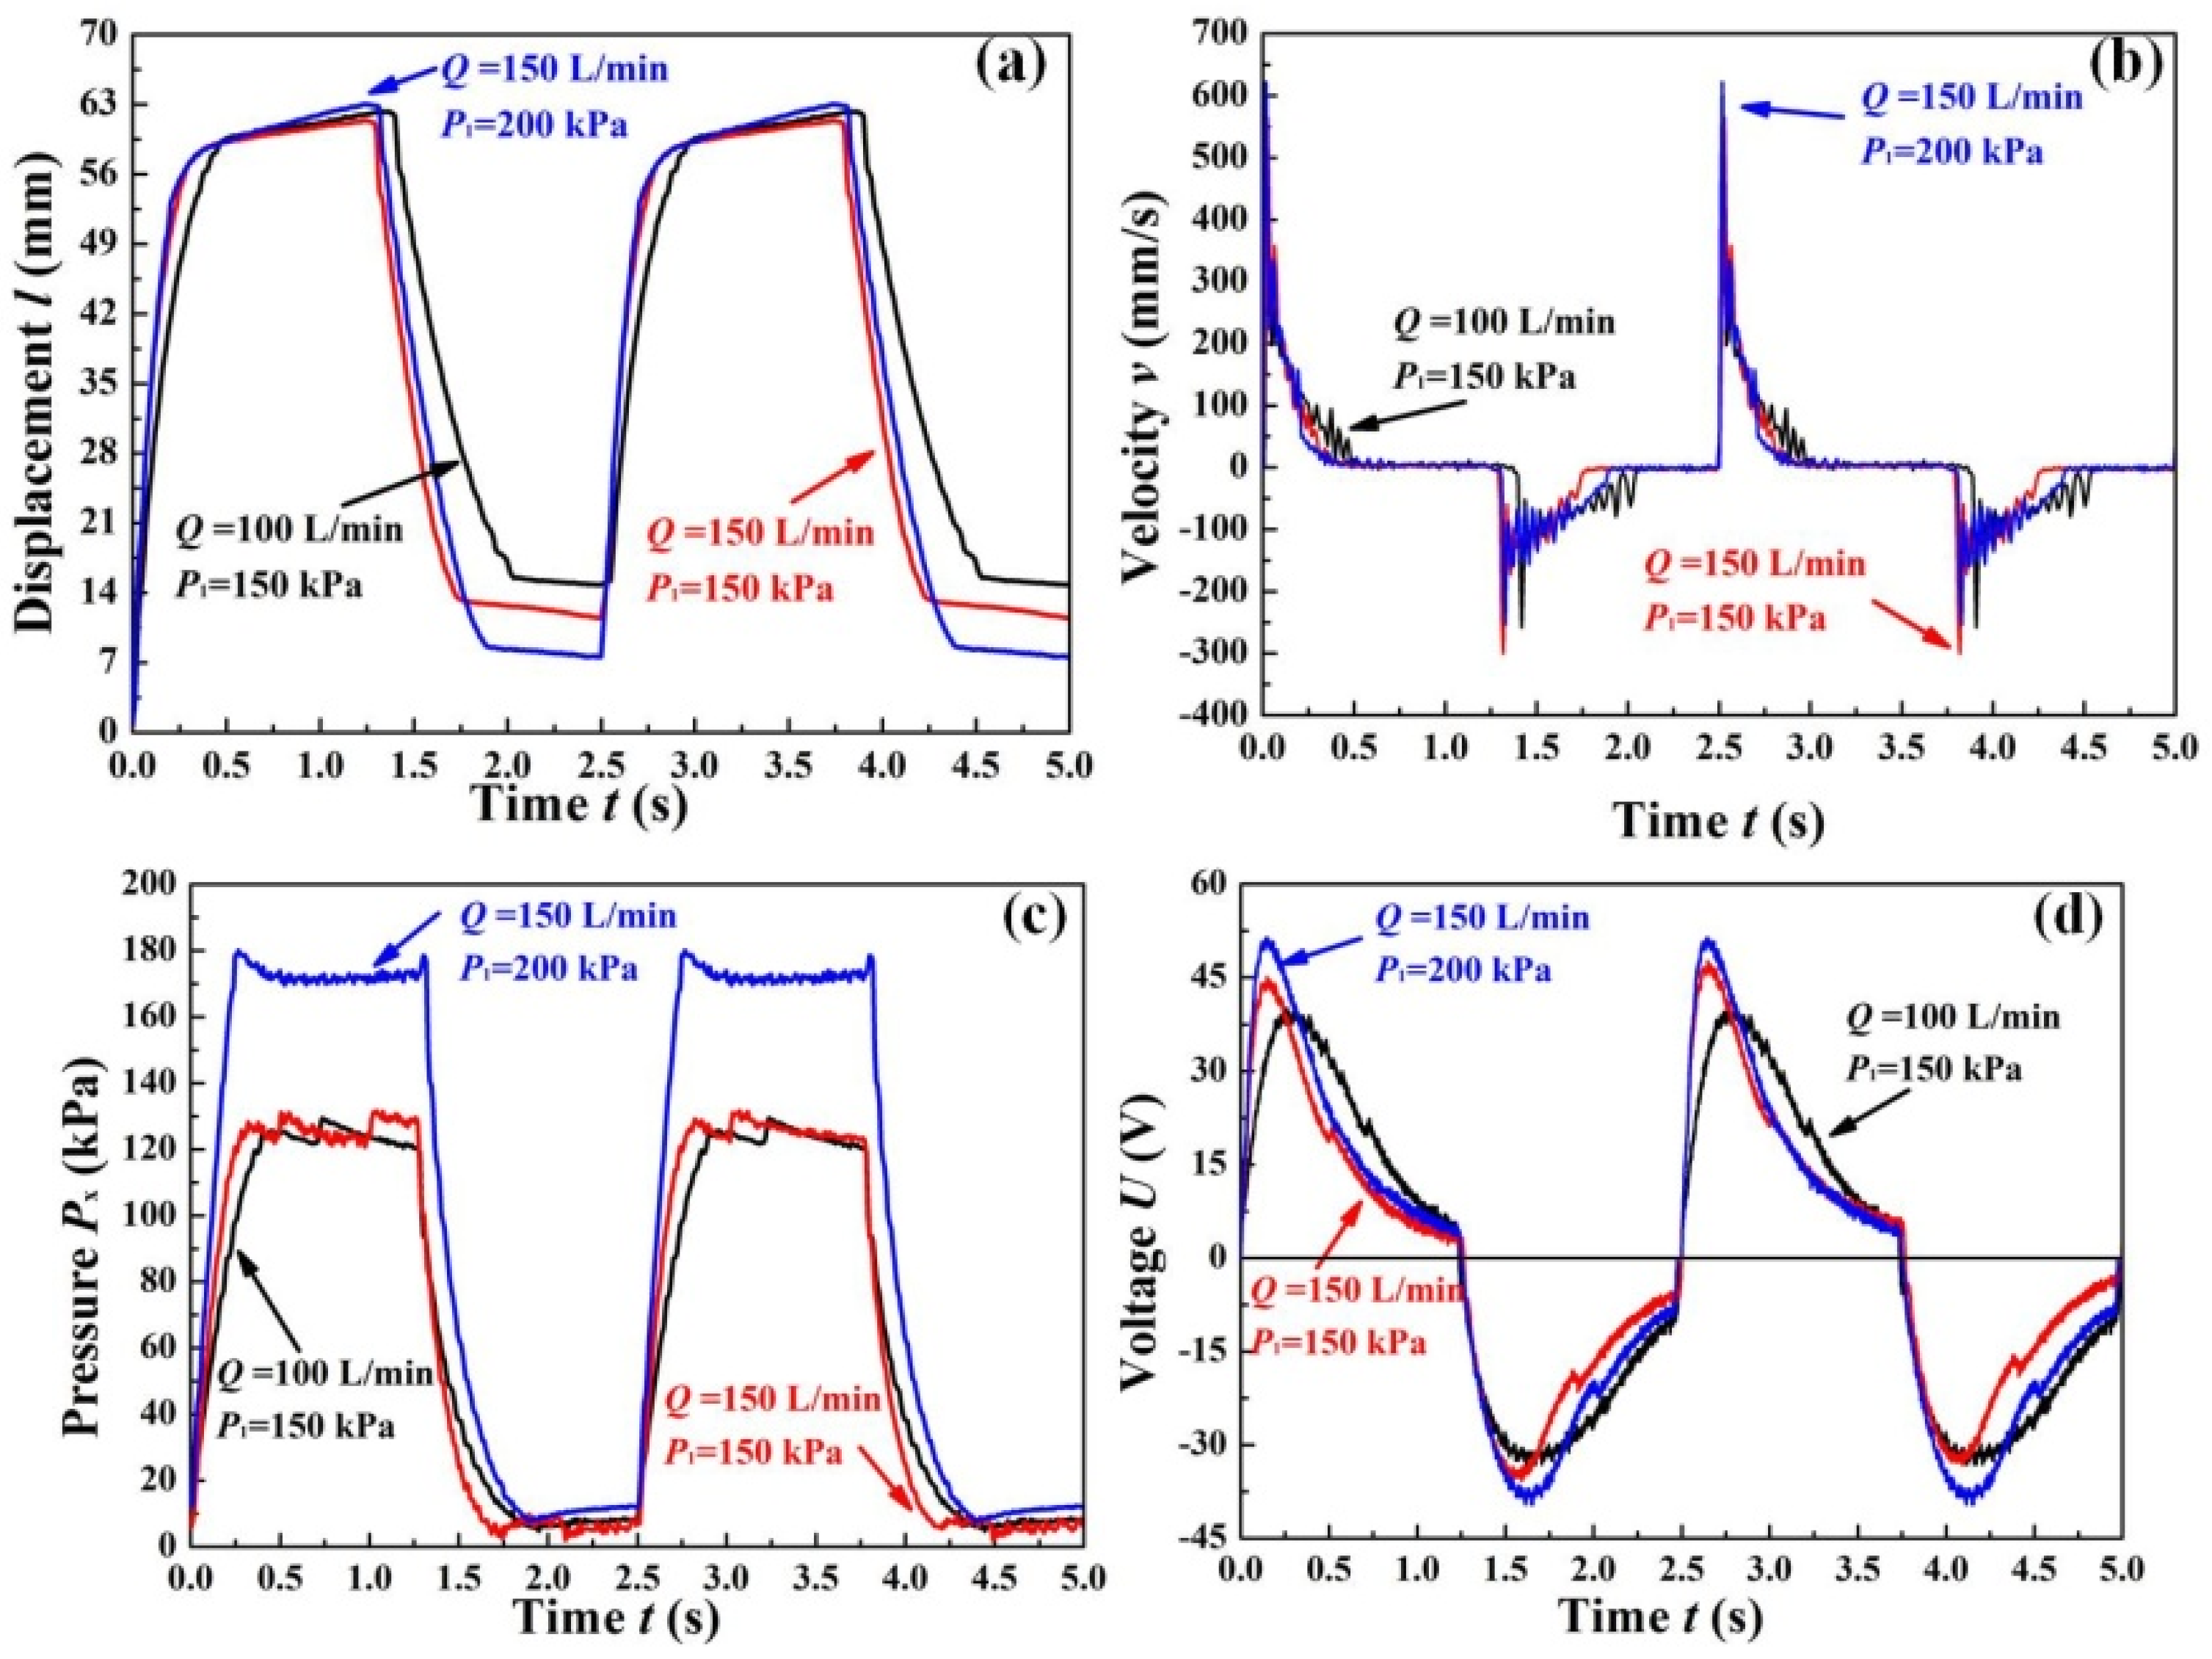
Figure 10 shows different instantaneous curves versus time under various pressure and flow conditions. In
Figure 10, the test cycle time is defined as 2.5 s.
Figure 10a is the relationship between displacement and time. At the beginning, the piston is moved to compress the atmosphere and the pressure in the chamber increases. After the 0.5 s, the piston is moving slowly. After 1.25 s, the piston is changing direction and the air pressure in the chamber is reduced. The piston rapidly returns to an equilibrium position; the piston cannot return to the original position due to the friction between the piston and interface of the compressed chamber.
Figure 10b is the speed–time curve. The curve has obvious fluctuations on account of the influence of pressure fluctuation and friction. The highest velocity is reached when the air pressure achieves the maximum value in a cycle time. The relationship between pressure and time is shown in
Figure 10c. The pressure has a maximum value based on the inertia of the piston. The residual pressure is equal to the static friction force.
Figure 10d is the voltage–time curve. We can obviously find that the output voltage is nonlinear. The voltage is decreased when the time is increased. It is inferred that the voltage almost reaches zero with a long enough period of time, as shown in
Figure 10d. Thus, the root mean square (RMS) voltage can be decreased as the cycle time increases. Therefore, the cycle time of 2.5 s is used to research the performance of the RMS voltage and effective power.
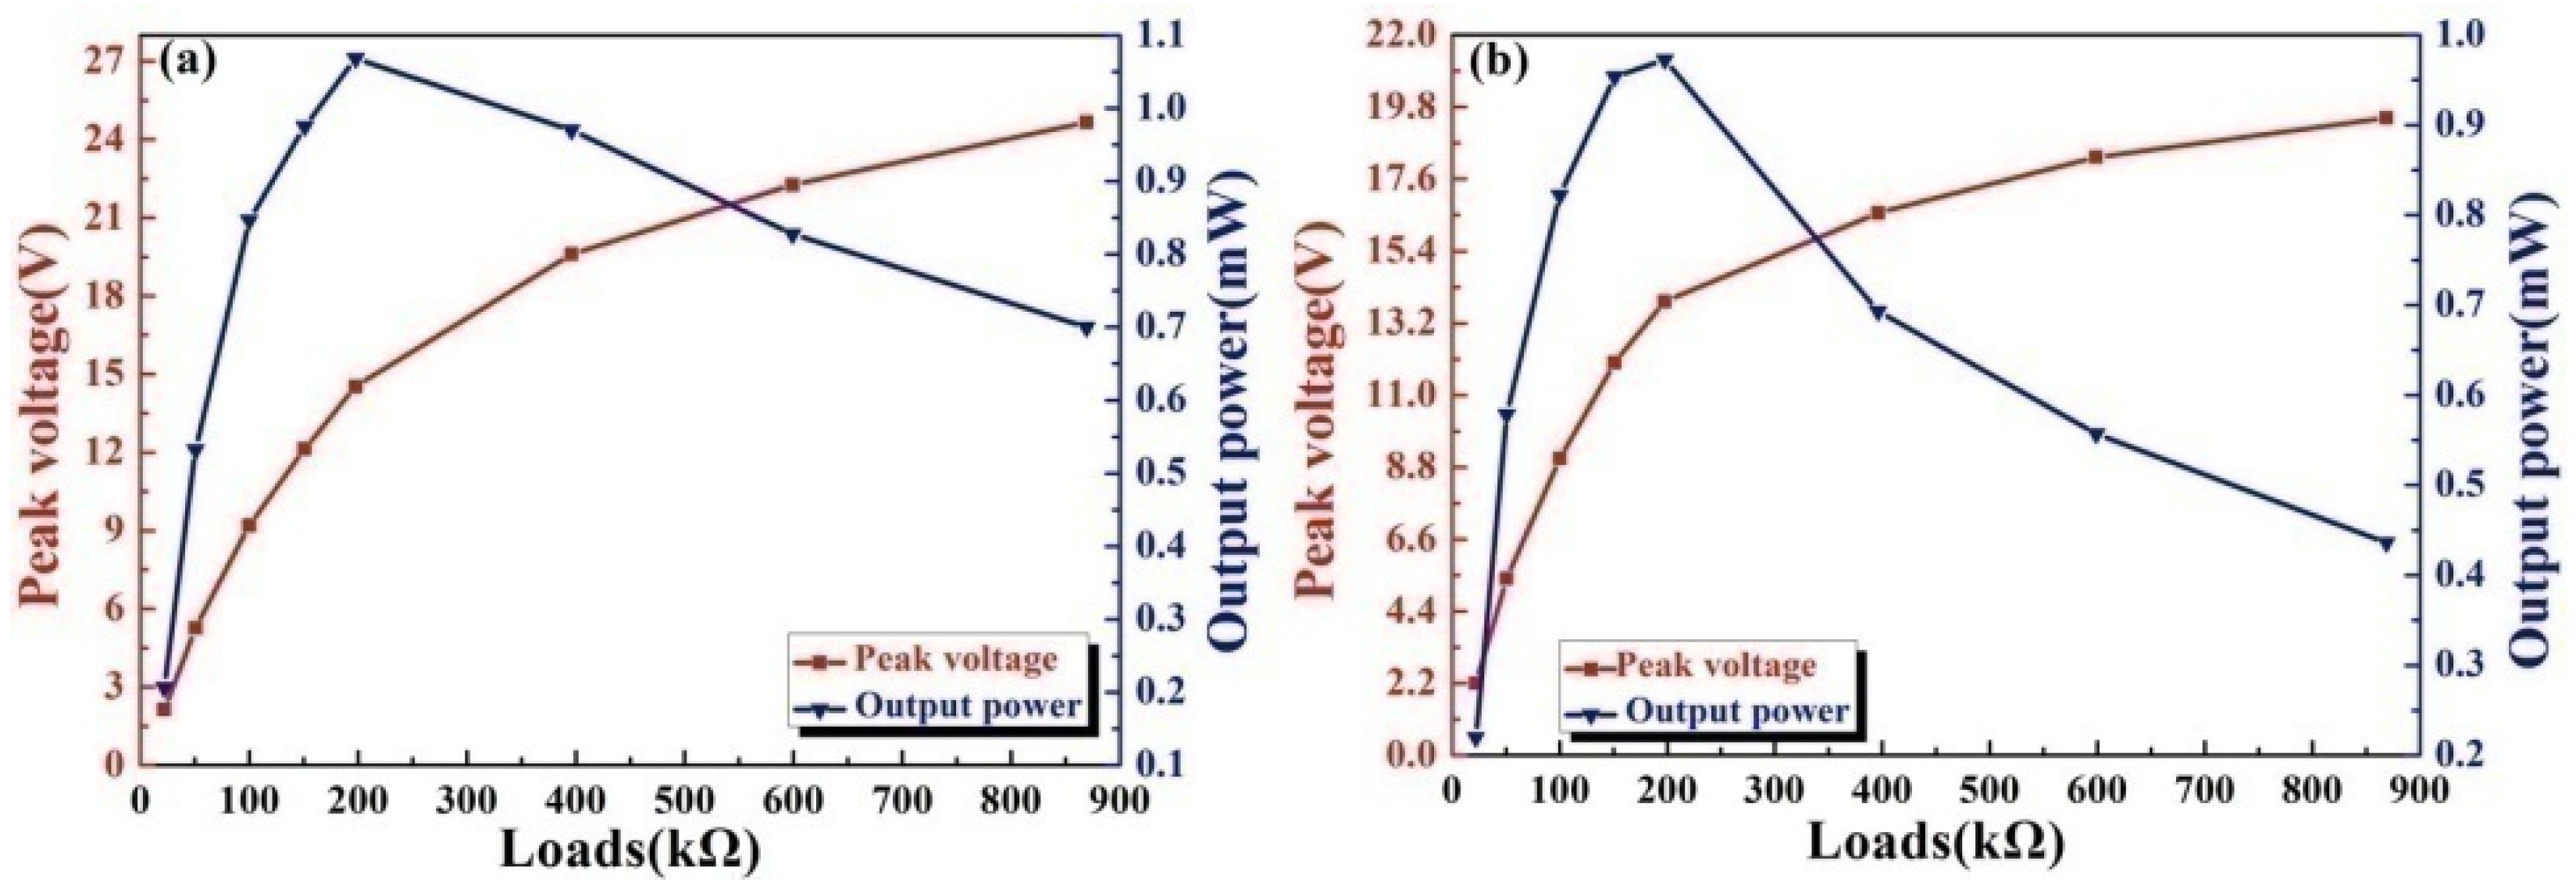
Figure 11 shows that the peak voltage and output power are tested at different load resistances. The conditions of these curves are tested using the above excitation process pressure of 200 kPa, at a cycle time of 2.5 s and a flow of 150 L/min. At the down-warping stage of the PZT patch, the output voltage and the power against the external load resistance are measured, and it is found that the peak voltage increases monotonically with increasing load resistance. The maximal peak voltage is 24.7 V, and the optimal output power is 1.06 mW, as shown in
Figure 11a. At the spring-back stage of the PZT patch, the maximal peak voltage is 19.5 V, and the optimal output power is 0.97 mW, as shown in
Figure 11b.
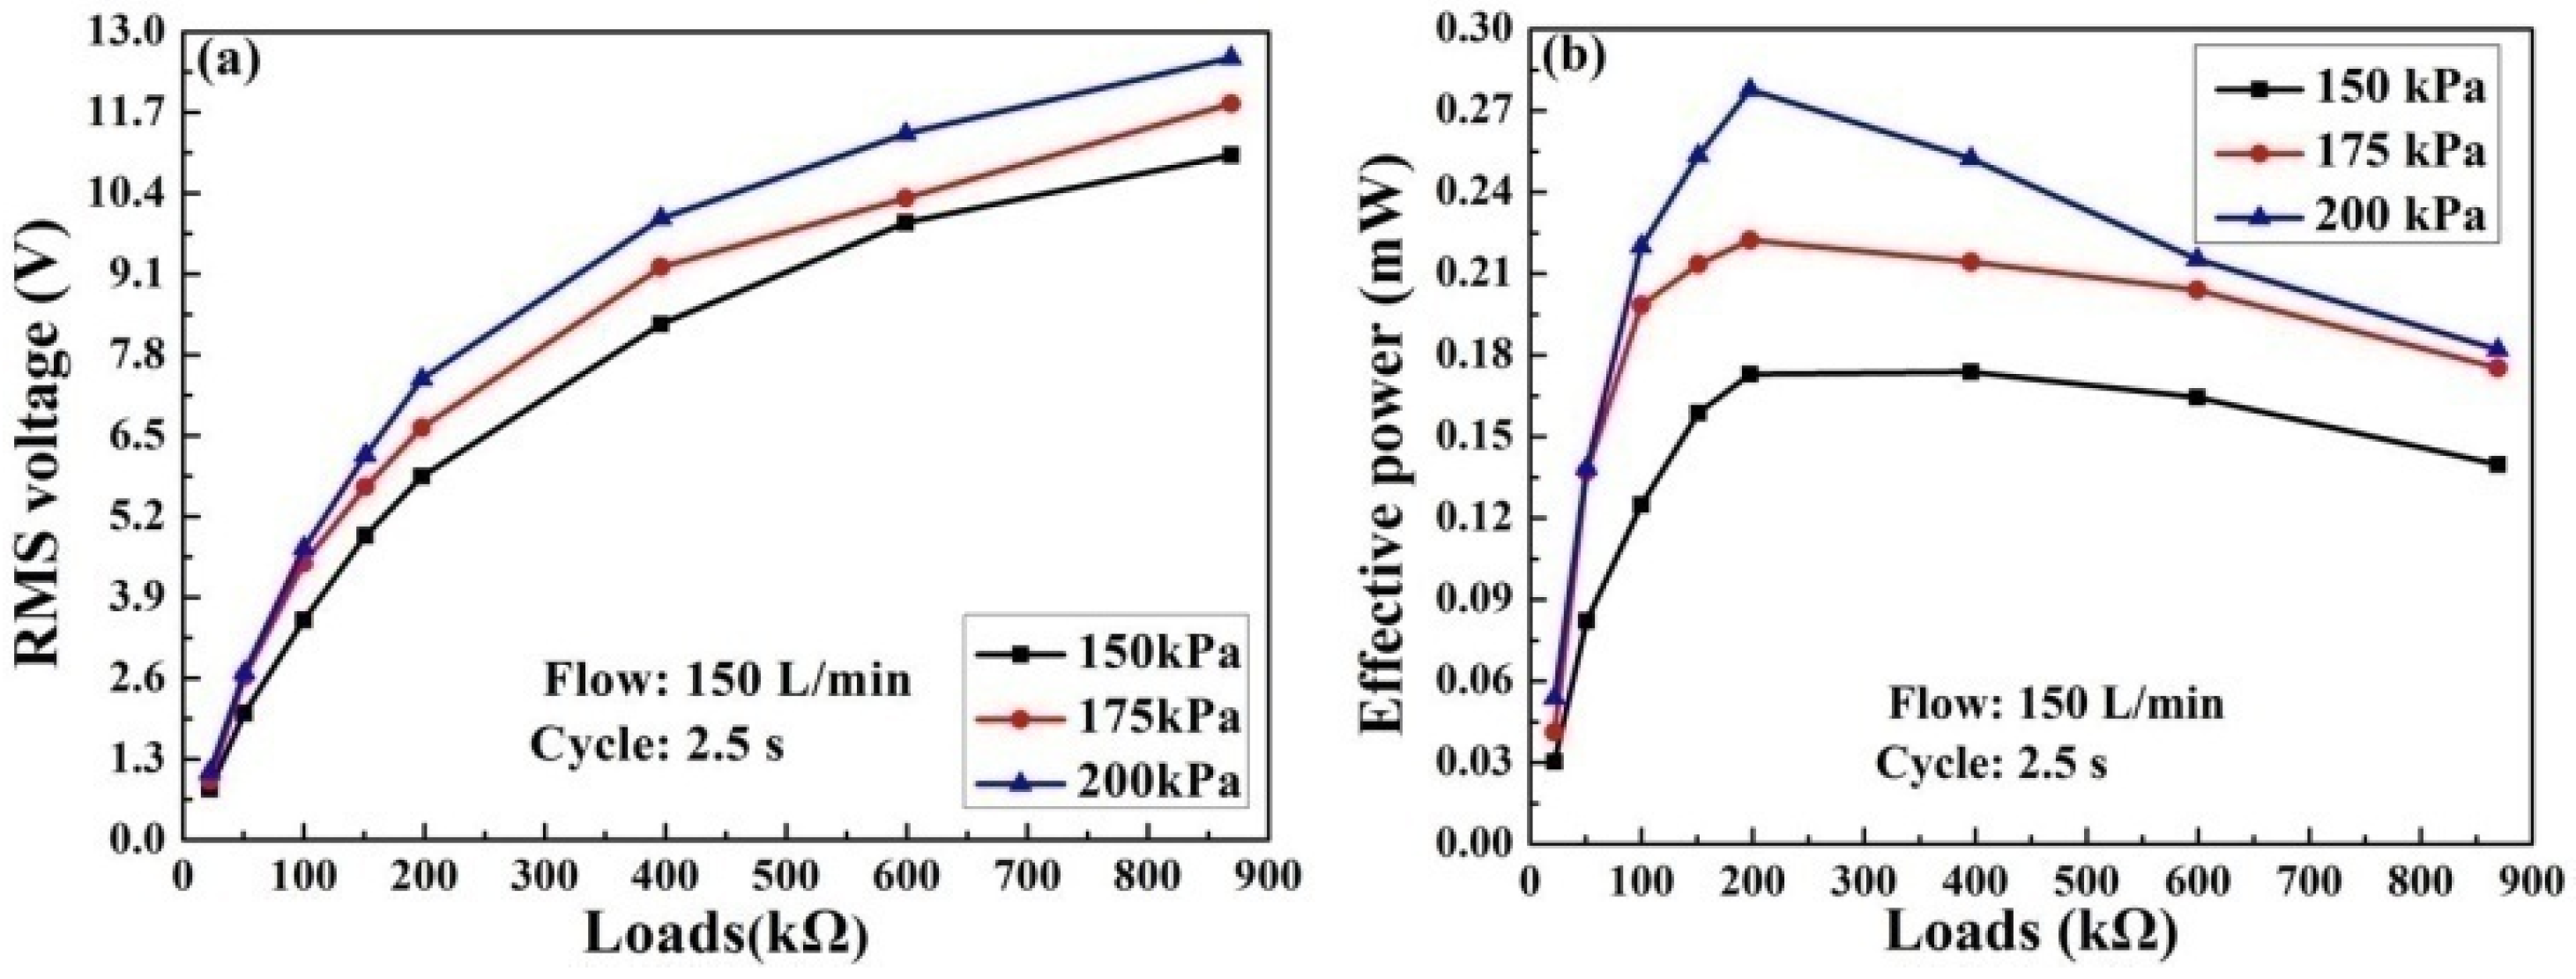
The RMS voltage and the effective power are measured through the resistor load.
Figure 12a shows the RMS voltage that is generated by the harvester, which can be changed with different pressures and resistive loads. As a result, effective power can be influenced by the compressed air pressure. In different pressure conditions, the effective powers are also different.
Figure 12b shows that the optimal effective power is 0.28 mW through the 200 kΩ resistor at a pressure of 200 kPa and cycle time of 2.5 s.
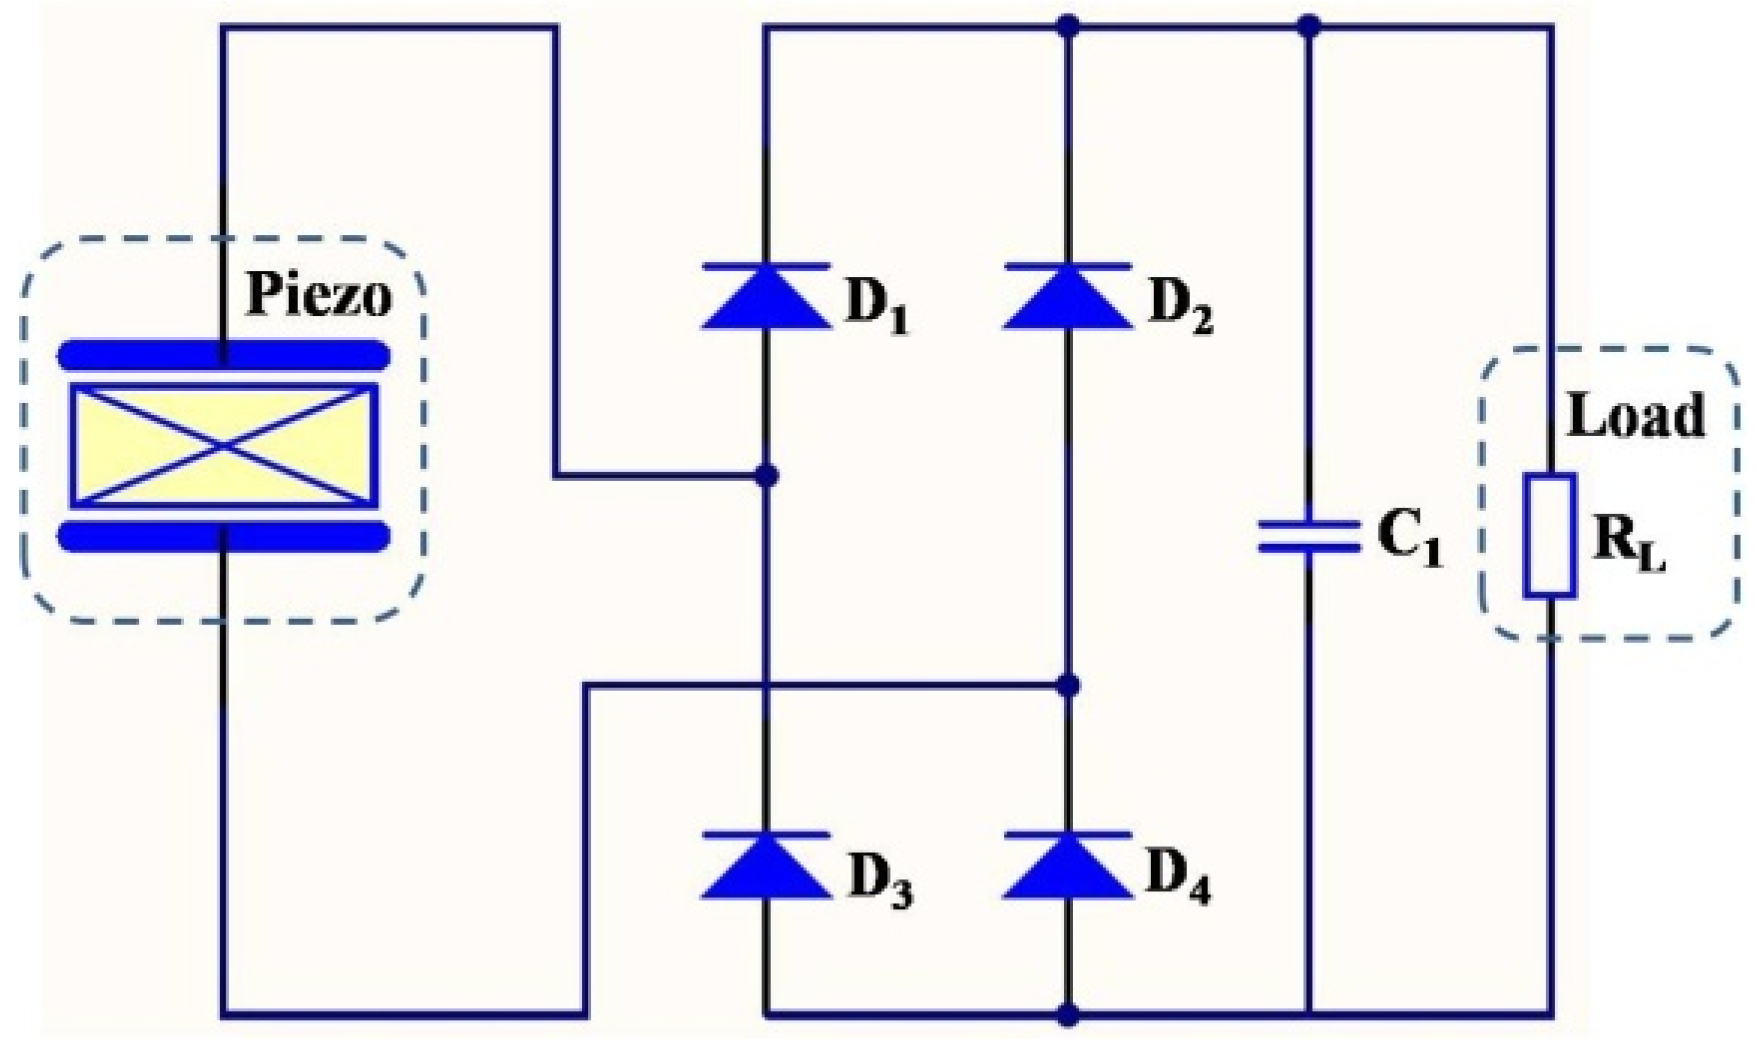
The most classical energy collection technology is to only use the bridge rectifier and filter capacitor, and the nonlinear power can be adjusted and filtered by the classical energy collection circuit.
Figure 13 shows the schematic of the standard rectifier circuit. The alternating electric energy can be adjusted by the bridge rectifier (
D1,
D2,
D3 and
D4). The electric power can be stored in the capacitor
C1. At last, the load
RL can consume the electric power.
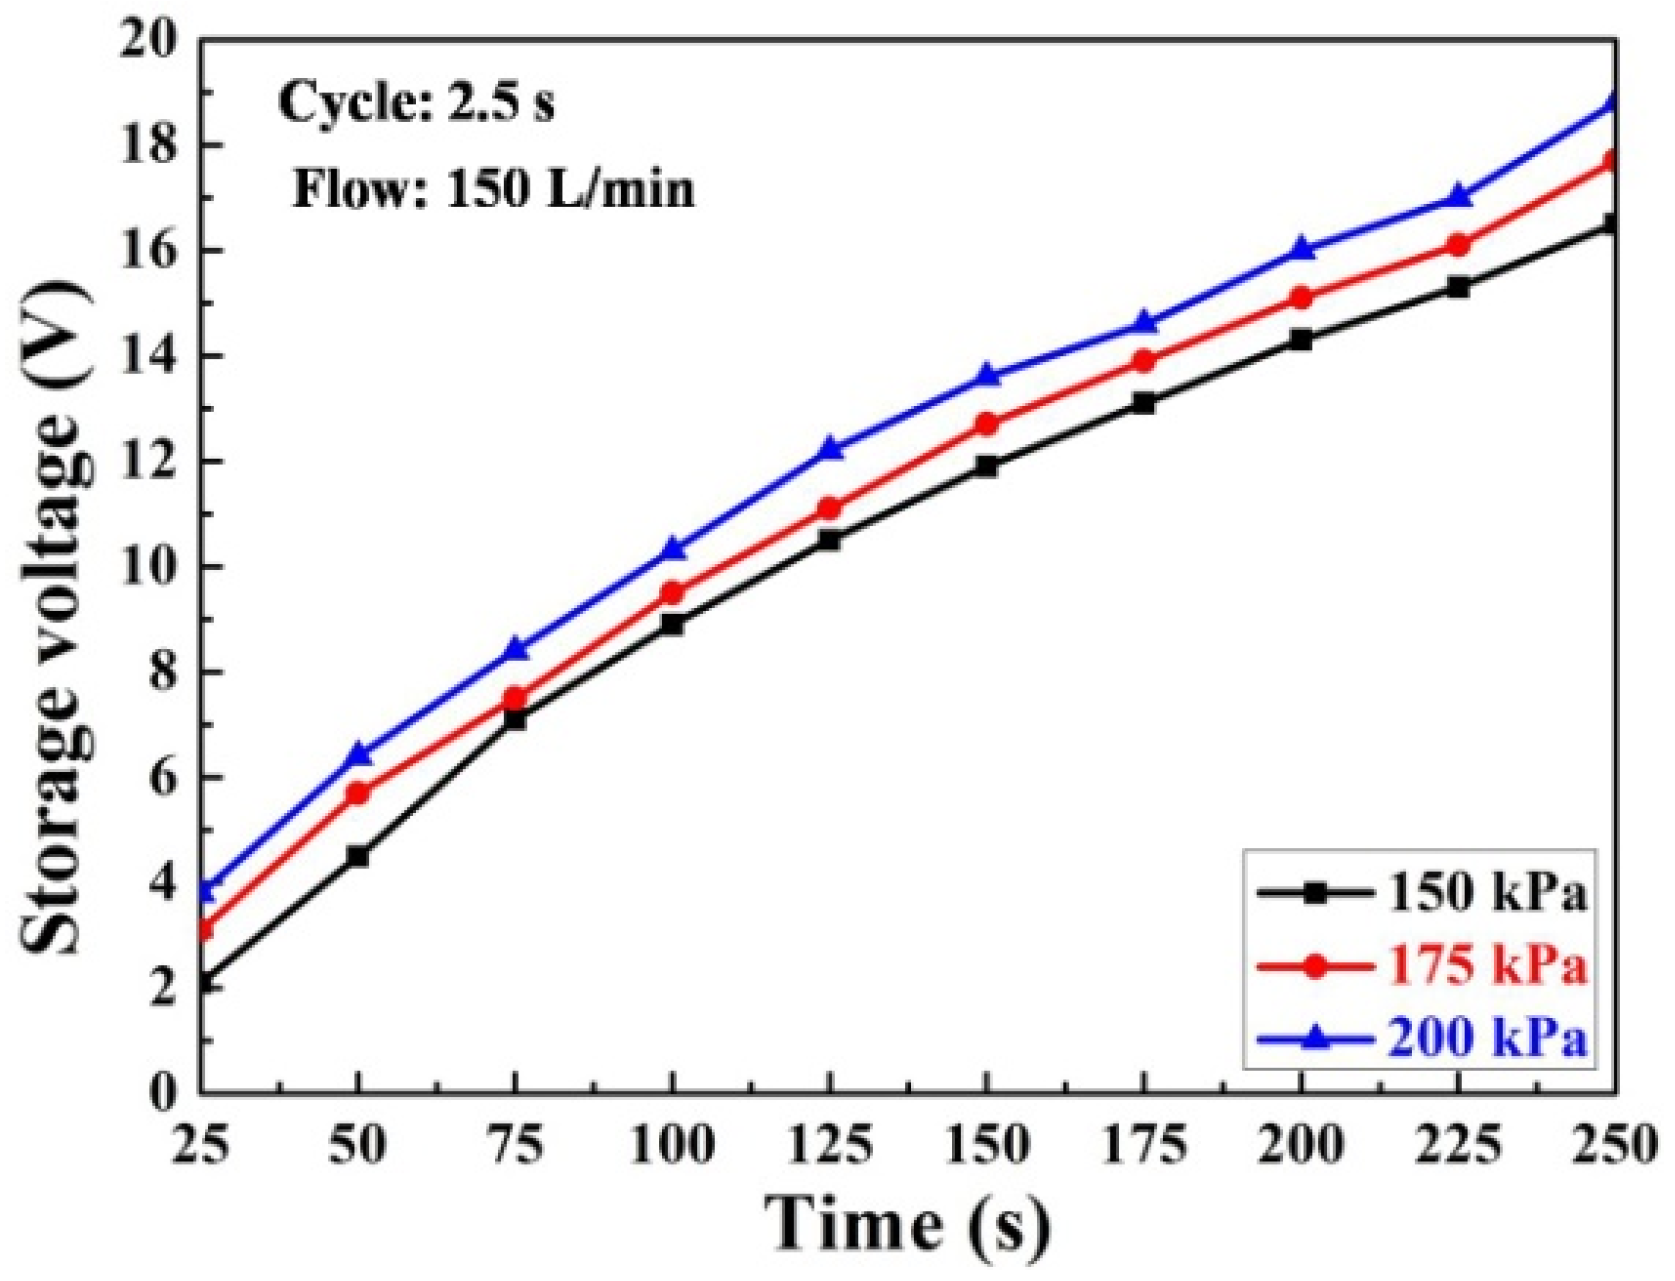
Figure 14 shows the relationship between the storage voltage and time. The power has been stored in the capacitance. As the time increases, the storage voltage also increases.
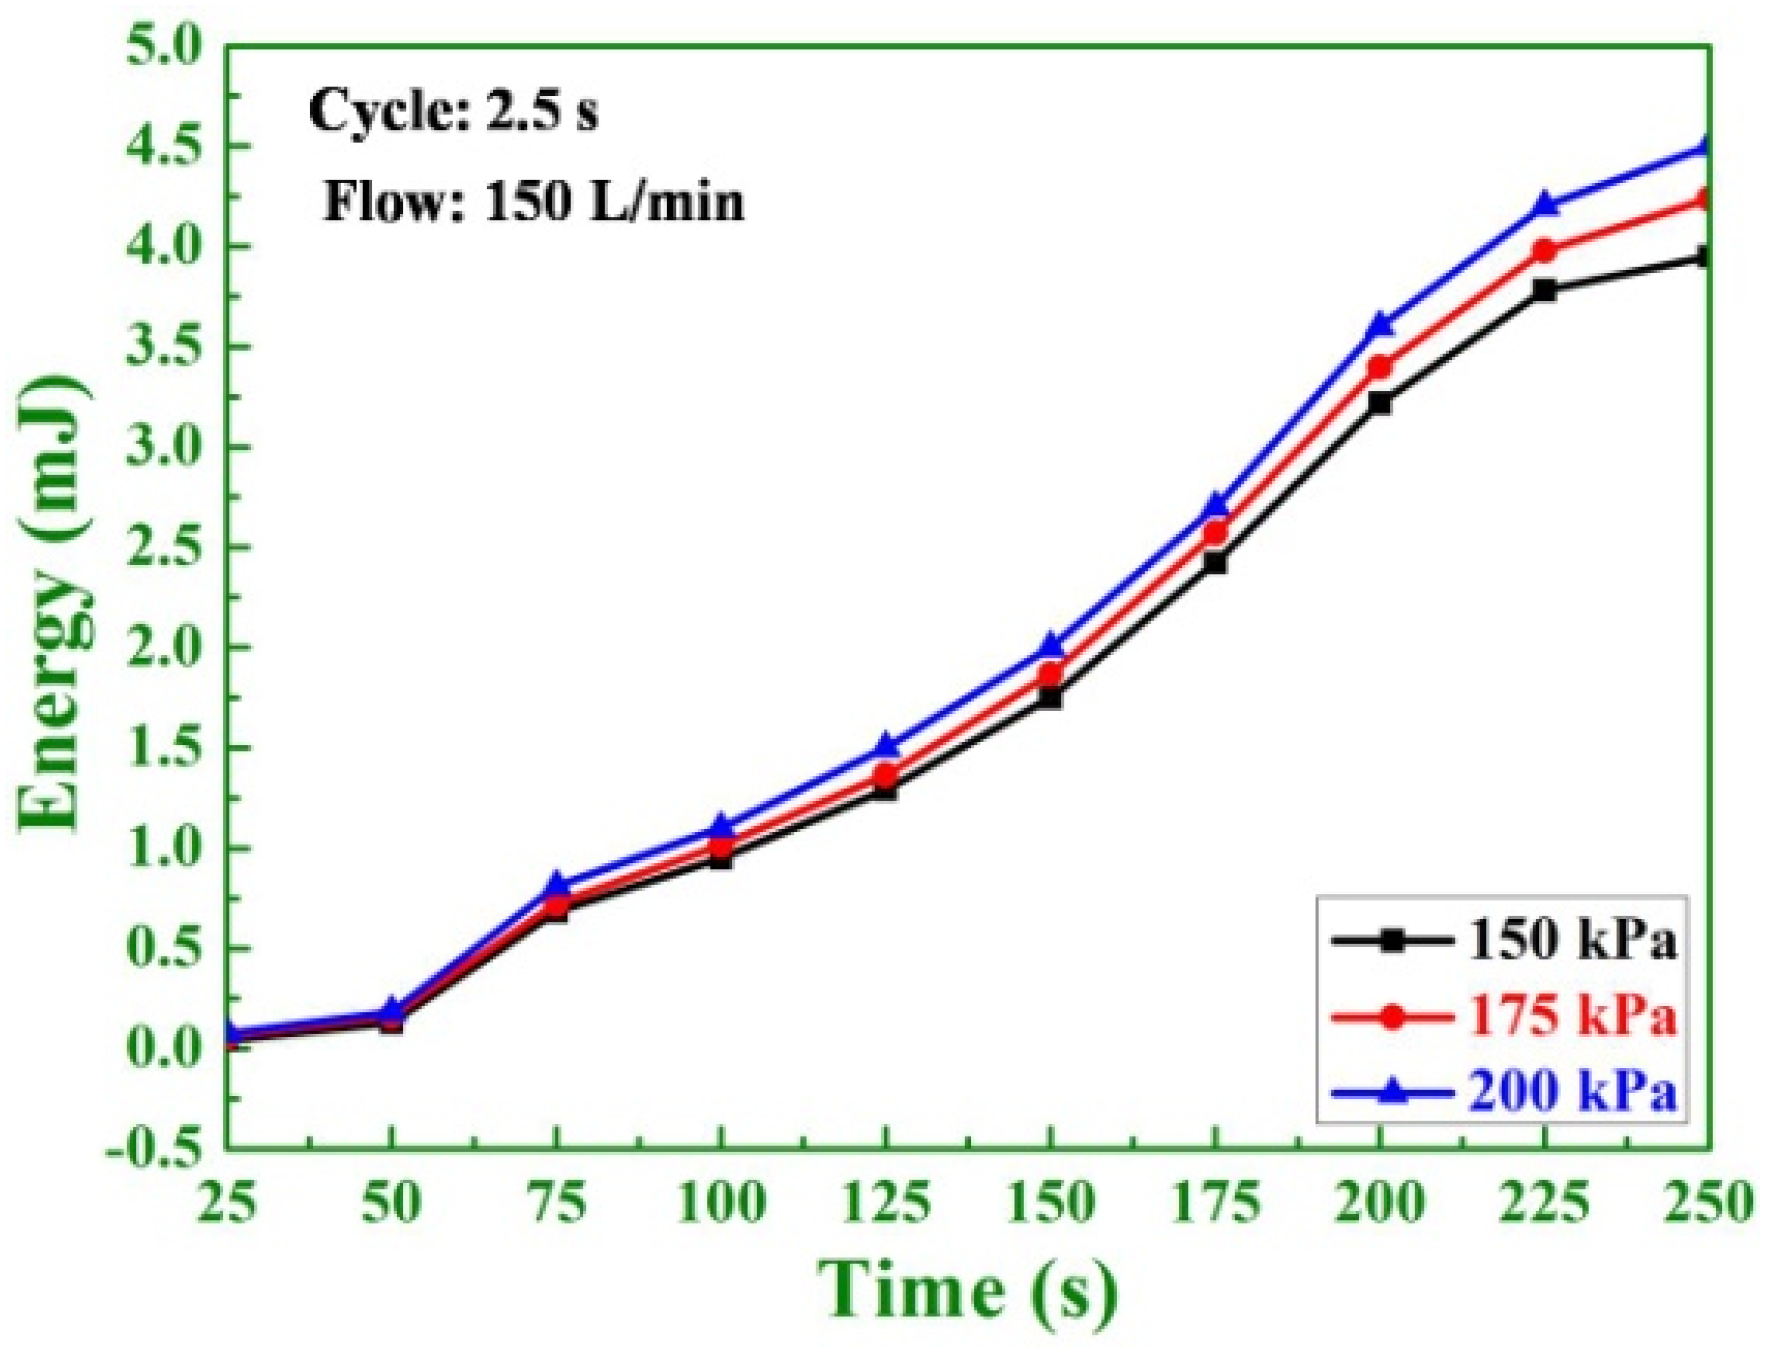
Figure 15 is the relationship between the energy and time. As the time increases, the energy is increasing, too. At the beginning, the energy is nearly the same in the differently compressed air. As the time increases, the energy is stabilizing. It is clear that the energy increases with the increase of the compressed air after 100 s.
This phenomenon depends on the optimal output voltage on the capacitor. The capacitor has a starting voltage. Energy can be consumed due to the internal resistance in the capacitor when the energy is less than the starting voltage. After 100 s, the voltage is larger than the starting voltage. As a result, energy increases rapidly after 100 s.


 ,
, 