Article

Bolt Looseness Detection Based on Piezoelectric Impedance Frequency Shift

Key Laboratory of Metallurgical Equipment and Control of Ministry of Education, Wuhan University of Science and Technology, Wuhan 430081, China
*
Author to whom correspondence should be addressed.
Appl. Sci. 2016, 6(10), 298; https://doi.org/10.3390/app6100298
Submission received: 8 September 2016 / Revised: 8 October 2016 / Accepted: 11 October 2016 / Published: 15 October 2016
(This article belongs to the Special Issue Structural Health Monitoring (SHM) of Civil Structures)

Abstract

:
In this paper, a piezoelectric impedance frequency shift method is developed to estimate the bolt preload for the detection of bolt looseness in engineering structures. An experimental device that allows the precision control of the axial preload force on a bolt is designed and fabricated. A universal testing machine is used to preload accurately on the bolt in the experiments. Under different bolt preload conditions, the impedance analyzer measures the admittance (inverse of the impedance) signal of the PZT (Lead ZirconateTitanate) patches which are bonded on the bolt head. Firstly, a wide frequency band is swept to find a sensitive frequency band of the piezoelectric admittance with the imaginary part. Then in the sensitive frequency band, a specified peak frequency of the admittance signature is chosen to investigate the frequency shift with different bolt preloads. The relationship between the specified frequency shift and the bolt preload is established. The experimental results show that the specified peak frequency decreases as the bolt preload increases for both M16 and M12 bolts, and the frequency shift has a linear relationship with the preload on the bolt. The frequencies of the real and imaginary parts of the admittance signature have the same results. Therefore, the bolt preload can be determined by measuring the specified frequency shift and this method has a good application prospect.

Graphical Abstract

1. Introduction

There are many types of connection for engineering structures, and bolt connection is one of the most widely used. Currently, there are a few methods to monitor the condition of bolt joints by measuring the bolt axial load [1]. A common method is to employ a strain gauge to measure the bolt strain and determine the bolt preload. This method offers accurate bolt-strain monitoring, but integration of the strain gauge often requires significant hardware modification. Another technique uses a torque wrench to determine the torque applied on the bolt. Due to the effect of the friction between the bolt and the clamped parts and the screw thread, the torque wrench cannot accurately control the pre-tightening force. Acousto-elastic effect based ultrasonic methods are alternatives to estimate the bolt axial load by measuring the time-of-flight (TOF) [2,3], the velocity ratio of longitudinal waves and transverse waves [4,5], and the resonant frequency shift of the bolt [6]. The velocity change of waves in the bolt resulted from the bolt stress is very small, so specialized precision instruments are required to measure the variations of the TOF, velocity and frequency shift, which hinders the application of the method. To avoid the catastrophic consequences caused by bolt looseness, real-time monitoring of bolt connections is of great importance.
Vibration-based damage assessment is a commonly used real time method for structural health monitoring and fault diagnosis. By comparing the transmittance function [7], power spectral density (PSD) of the recorded signal [8] and other modal parameters before and after structural damage [9], the structure’s health state can be extracted. However, this method can only detect structural damage when the damage is developed to a certain degree. For the bolt-connected structures, the looseness of a bolt only affects the local dynamic characteristics of the structure, and the vibration based method is not so sensitive to the initial bolt looseness detection.
Piezoceramics, with attractive features such as low cost, small size, wide bandwidth, and sensing and actuating functions, have been widely researched in real-time structural monitoring [10,11,12,13]. Using the piezoelectric active sensing method and the ultrasonic attenuation-based method, Yang and Chang predicted the torque levels and identified the locations of loosened bolts [14,15]. Wang et al. [16,17] analyzed the ultrasonic energy which is received through the interface of a bolted joint, and the status of bolt connection and bolt loosening are monitored using the response signal energy method and the time reversal method. Song [18] applied the active sensing technique incorporated with a wireless sensor network in health monitoring of wind turbine blades [19].
Another attractive feature of a piezoceramic transducer is the coupling between its electric impedance and the host structure’s mechanical impedance, based on which Liang et al. proposed the piezoelectric impedance-based structure health monitoring method [20]. Since then, research on structure health monitoring based on piezoelectric impedance technique has been widely carried out [21,22] in many fields, such as in wind turbine blades [23] and composite material [24,25]. Bhalla et al. [26,27] performed the experiments on aircraft components and reinforced concrete bridges with the piezoelectric impedance technique, and demonstrated the effectiveness of the piezoelectric impedance technology for structure health monitoring. Peairs et al. [28] apply piezoelectric impedance technique in monitoring the gas pipeline damage and finds that it can detect the crack damage of underground pipeline. Lu et al. [29] applied the piezoelectric impedance technique in monitoring weld cracks, and the results showed that the piezoelectric patches can be sensitive to detect small changes in cracks. Lim et al. [30] evaluate the feasibility of fatigue crack monitoring with the electromechanical impedance (EMI) technique with a PZT transducer and find that the EMI technique is very sensitive to fatigue crack propagation. Liang et al. employ the impedance technique to monitor the bond-slip between concrete and steel for concrete-encased composite structure [31].
Recently, the piezoelectric impedance method has been extended to bolt loosening detection (Martowicz et al. [32], Ritdumrongkul et al. [33] and Park et al. [34]). Utilizing the technical merits of piezoelectric impedance method and the Lamb wave propagation method, Wait et al. [35] integrated these two techniques to investigate the structural integrity of a bolted system. A combined approach of the piezoelectric impedance technique and the guided wave-based damage detection method was developed by An and Sohn [36] to detect the bolt looseness by employing the signals of these two method simultaneously from piezoelectric transducers.
In this paper, the piezoelectric impedance method is applied to estimate the bolt preload by analyzing a specified peak frequency shift with a piezoelectric patch bonded on the bolt head. In contrast with the previous studies which used a damage index to estimate bolted status, in this approach, the relationship between a specified peak frequency shift of the piezoelectric admittance signature and the bolt preload is established. The peak frequency change of the admittance is used as a feature parameter of the bolt preload. Additionally, a higher sweep frequency band up to several megahertz is chosen for the measurement of the bolt head local dynamics and the piezoelectric impedance method based bolt preload measurement. Using a type CMT5105 universal mechanical testing machine to apply the precise axial load on bolts, and the piezoelectric admittance signatures of the piezoelectric patch on the bolt head are acquired under different bolt preloads. A new bolt looseness detection method based on piezoelectric impedance frequency shift is developed in this paper.

2. The Proposed Method and Principle

According to the piezoelectric effect, piezoelectric patches can be used as sensors and actuators. In the piezoelectric impedance method, a piezoelectric patch is bonded on the monitored structure surface or integrated into the structure, and the piezoelectric patch can be excited by a sine sweep voltage signal generated by an impedance analyzer. According to the inverse piezoelectric effect, the sinusoidal voltage input causes the vibration of the piezoelectric patch, and the vibration is transferred to the host structure. Then, the vibration of the structure reacts to the piezoelectric patch simultaneously, which causes electrical signal changes in the circuit due to the direct piezoelectric effect. The coupled admittance, the reciprocal of the impedance, which is closely related to the substrate structural impedance, can be captured by the impedance analyzer. Based on the 1-D coupling model of piezoelectric patch and the host structure, and considering the force equilibrium and the piezoelectric constitutive equations, Liang [20] derived the following electro-mechanical admittance expression:
Y ¯ = 2 ω w a l a h a [ ε 33 T ¯ + ( Z a Z + Z a ) d 31 2 Y 11 E ¯ ( tan   κ l a κ l a ) d 31 2 Y 11 E ¯ ]
where ω is the angular frequency of the excitation voltage, and i is the imaginary unit. wa, la and ha are respectively width, length and thickness of the PZT patch. ε 33 T ¯ represents the complex electric permittivity at zero mechanical stress, Y 11 E ¯ is the complex Young’s modulus at zero electric field. Za is the mechanical impedance of the PZT patch and Z is the mechanical impedance of the host structure. d31 and κ are the piezoelectric strain coefficient and the wave number, respectively.
Equation (1) shows that the output admittance signature is affected by both the structural and sensor dynamics, since the admittance is the response of the structure to the harmonic actuation of the piezoelectric transducer and the applied load will influence the response of the structure in the presence of mechanical impedance. The stress changes at a specific location on the structure will cause resonant frequency shift, and vibration mode change of the structure, which will be reflected in changes in the admittance signature [37,38].
For the bolted joints, the bolted connection status affects only the local dynamic characteristics of the structure and the bolt itself. When the bolt preload is changed, the stress distribution on the bolt and the bolt joint will change. Since the piezoceramic patch is bonded on the bolt head, the sensing region will be concentrated in a small range of the bolt head and the bolt head stress status change will be reflected in the admittance signature as the resonance frequency shift. By analyzing the interrelation of a bolt head stress-caused frequency shift and the bolt preload, a new bolt joint health monitoring method may be formed based on the piezoelectric impedance frequency shift. The local structure has high frequency dynamic characteristics, and the piezoelectric impedance method is appropriate to study the local dynamics of the bolt joint with appropriate sensing frequency.

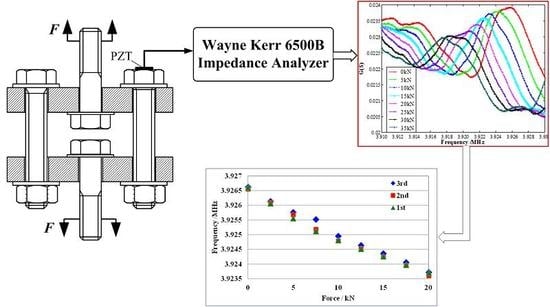
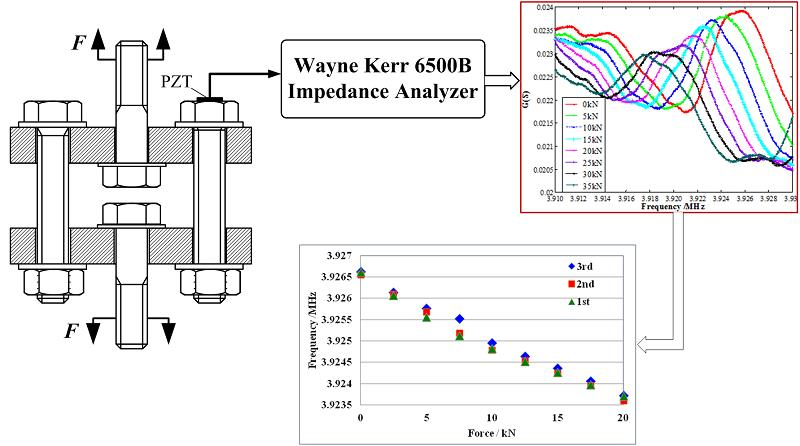
3. The Experimental Setup and Process

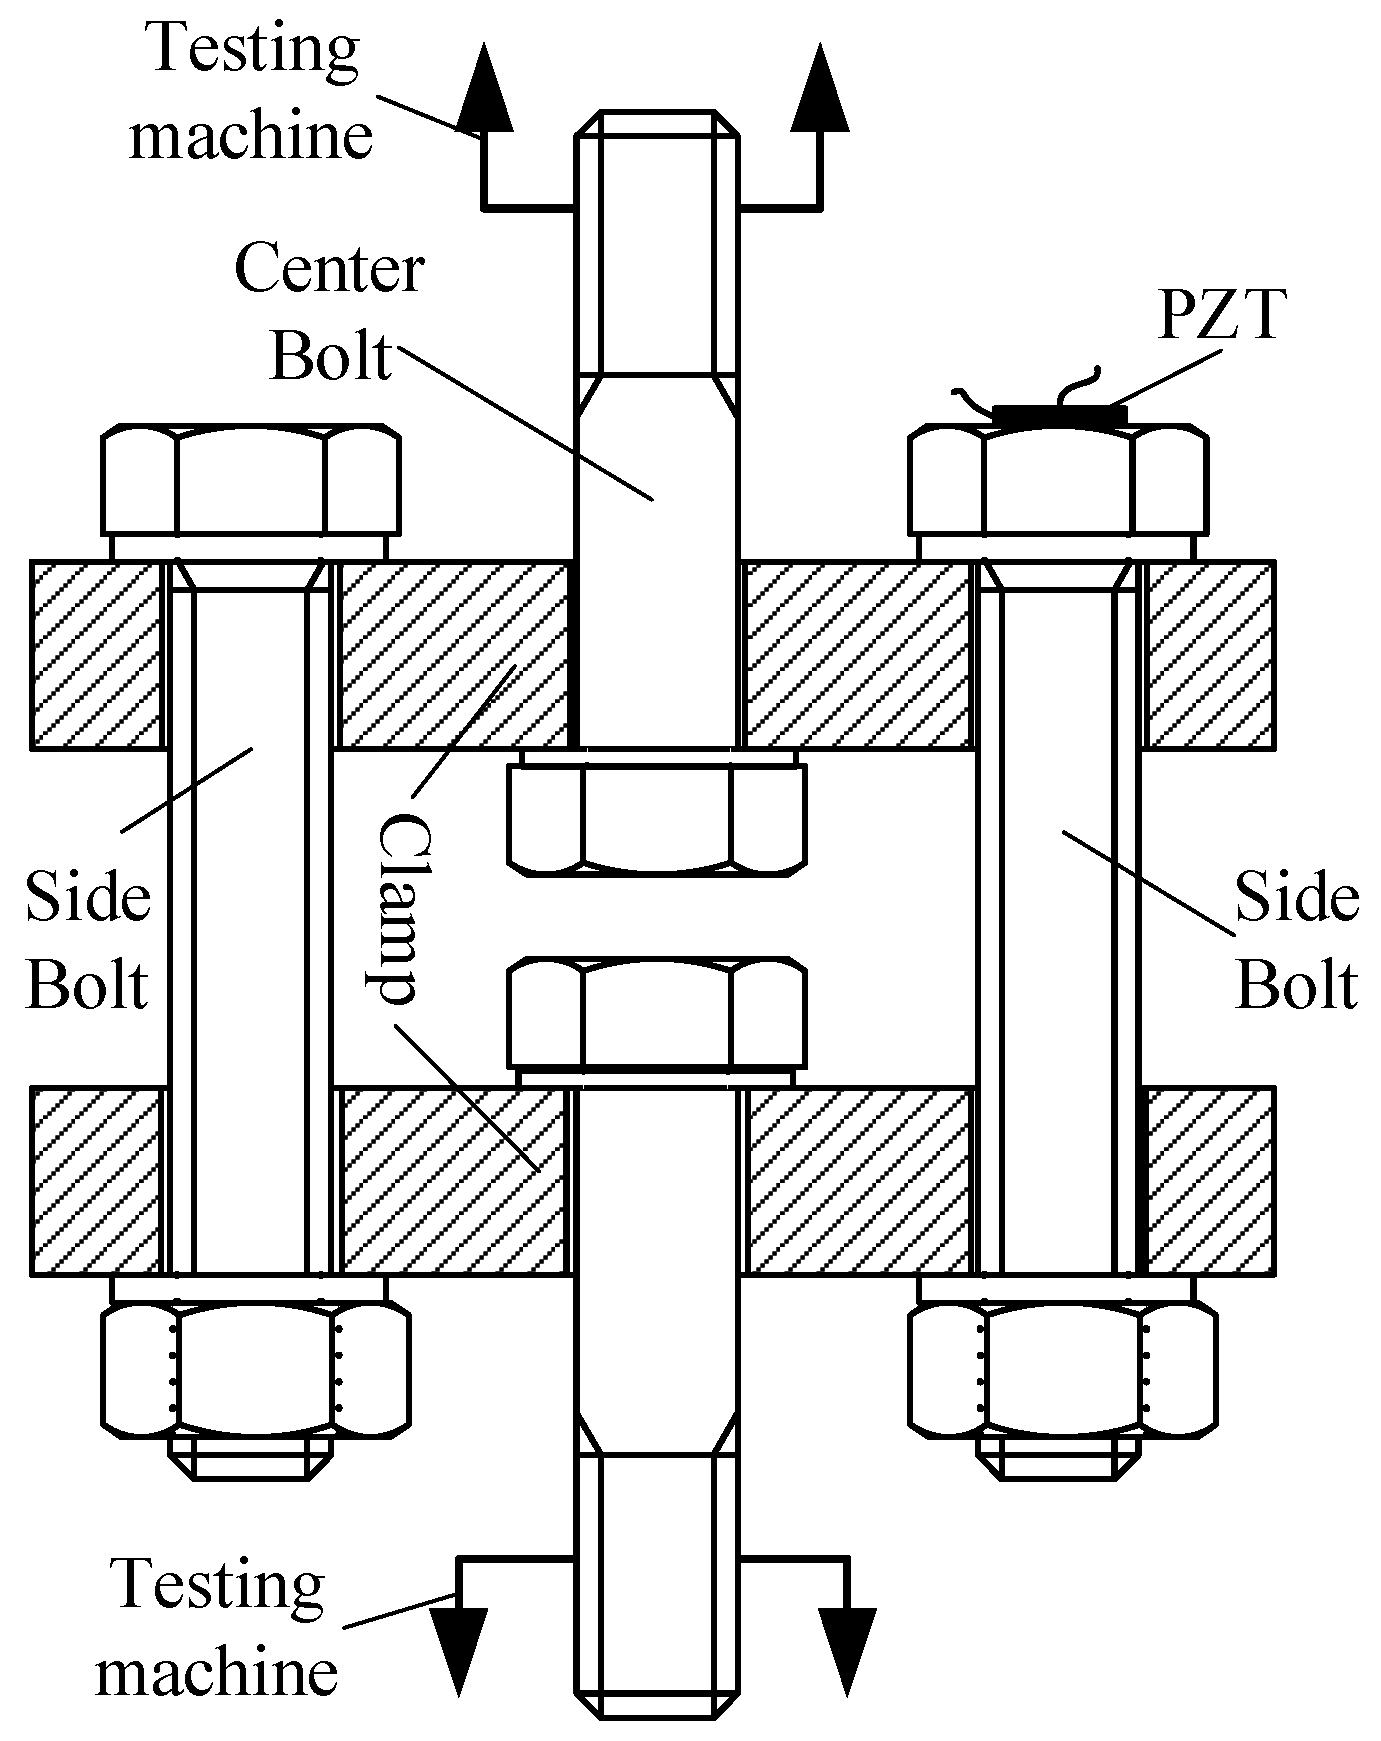
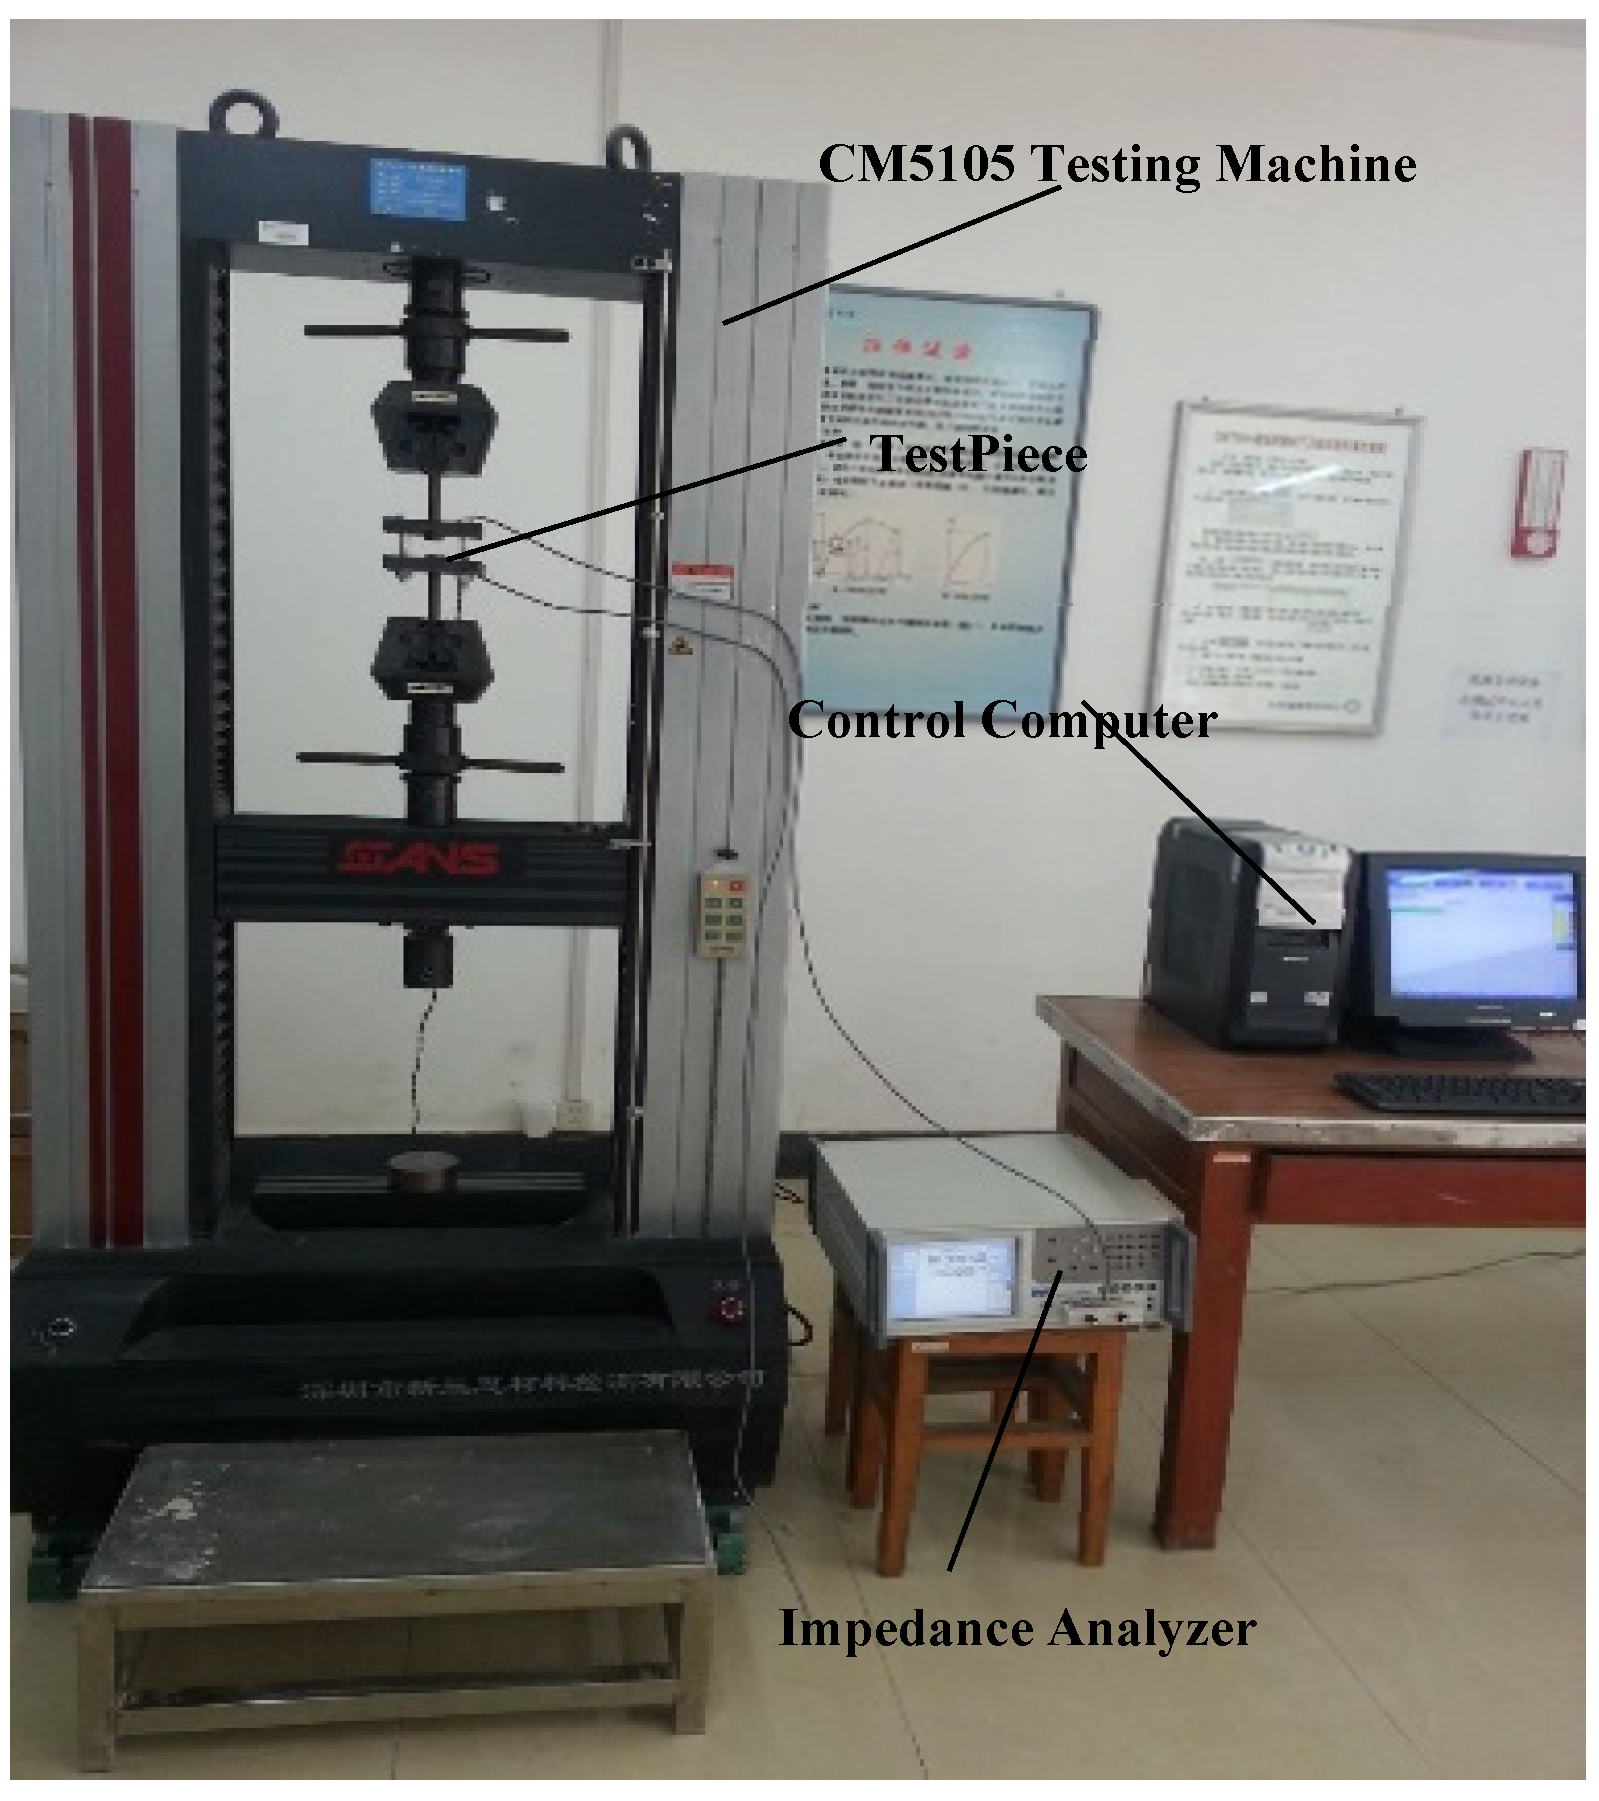
3.1. Experimental Devices

Base on the above principle, an experimental device (shown in Figure 1) with a directly controlled axial force is designed and fabricated. Figure 2 shows the device under testing using a universal testing machine. The piezoelectric patch PZT was bonded on the bolt head by the epoxy resin, as shown in Figure 1. Then the piezoelectric patch was connected to an impedance analyzer and the piezoelectric impedance signatures were stored and analyzed in the computer.
As shown in Figure 2, the testing machine (type CMT5105, SUNS, Shenzhen, China) pulls the two center bolts of the clamp, and then the pulling force is transferred to two side bolts through the clamp. The bolts on both sides share the same pulling force, and the pulling axial force is used to simulate the preload on both bolts. Two M16 bolts and two M12 bolts are used respectively in the experiments. The nominal preload for the chosen M16 bolt is 35 kN and 20 kN for M12 bolt. The tensile force set by the test machine is two times the maximum preload of the two side bolts.
In this research, the PZT (Lead ZirconateTitanate) type of piezoelectric patch with the size of 10 × 6 × 0.5 mm was used, and its parameters are shown in Table 1.

3.2. Experimental Processes

In the experiment, the tensile force is set from zero to the maximum nominal preload. In each step of steady-state load, the piezoelectric impedance of the PZT patch is captured by the WK6500B impedance analyzer (Wayne Kerr, West Sussex, UK).
Before the experiments, a proper sweep frequency band should be chosen to identify the frequency of interest. In this paper, the preliminary sweep frequency range is set from 2 KHz to 5MHz, and the piezoelectric admittance signature was acquired by the impedance analyzer. It is found that the susceptance (the imaginary part of admittance) [37] changes more regularly with frequency, as shown in Figure 3. In Figure 3, there exists a peak in the susceptance plot for both M16 and M12 bolts. The peak frequencies for M16 and M12 are about 3.92 MHz and 4.12 MHz, respectively. In the subsequent refining sweep frequency analysis, these peak frequencies are chosen as the specified frequencies, and the sweep frequency bandwidths are around these frequencies. For a tested bolt, the specified peak frequencies were measured under no-preload and rated preload, respectively. Then the sweep frequency band is started at a point before the non-preload peak frequency and ended at a point behind the rated-preload peak frequency for the experiments.
Figure 4a shows the conductance (the real part of admittance) plot with sweep frequency from 3.91 MHz to 3.932 MHz of the M16 bolt under different bolt preload. The peak frequency (resonance frequency of a certain order) is about 3.93 MHz without a preload and it is selected as the specified frequency for tracking its shift. As the bolt preload increases, the specified peak frequencies shift to the left side, which means it decrease. Based on this discovery, the specified frequency is chosen as an indicator to characterize the bolt preload. For the susceptance of admittance signature, it also has such a trend, as shown in Figure 4b, and the amplitude of the susceptance is larger than that of the conductance [37]. This is different from the previous studies that most of them used the conductance to establish the damage index, and in this approach the imaginary part of admittance can also be used as a feature parameter of bolt preload. For the decrease of the frequency as the increase of the bolt preload, it is mainly due to the sensing region of the piezoelectric transducer is focused on the bolt head in such high scanning frequency band. The stress status of the bolt head (a state of compressive stress) changed with the increase of the bolt preload, and that cause the piezoelectric transducer also in a compressive state. Since the resonance of the piezoelectric transducer is mainly affected by its mechanical and physical properties, but not the electrical properties, the compressive stress state causes the mechanical and physical properties of the PZT transducer to change and thus leads to the decrease of the frequency [39,40].

4. The Experimental Results and Analysis

The experiments of different types of bolts under different axial load were performed with the above proposed method. In each step, the testing machine applied a given load to the bolt. When the forces reached the set value, it was kept stable and the admittance signature was acquired by the impedance analyzer. After the impedance analyzer finished the sweep and the data were stored, the applied force was increased and the process was repeated until the maximum pre-selected load was reached. The specified peak frequencies of both the real part and imaginary part of admittance were extracted as the feature parameter for the bolt preload. In order to obtain a more accurate specified peak frequency, a polynomial fit was performed and the peak value of the fitting curve was used as the relevant feature frequency [41,42].

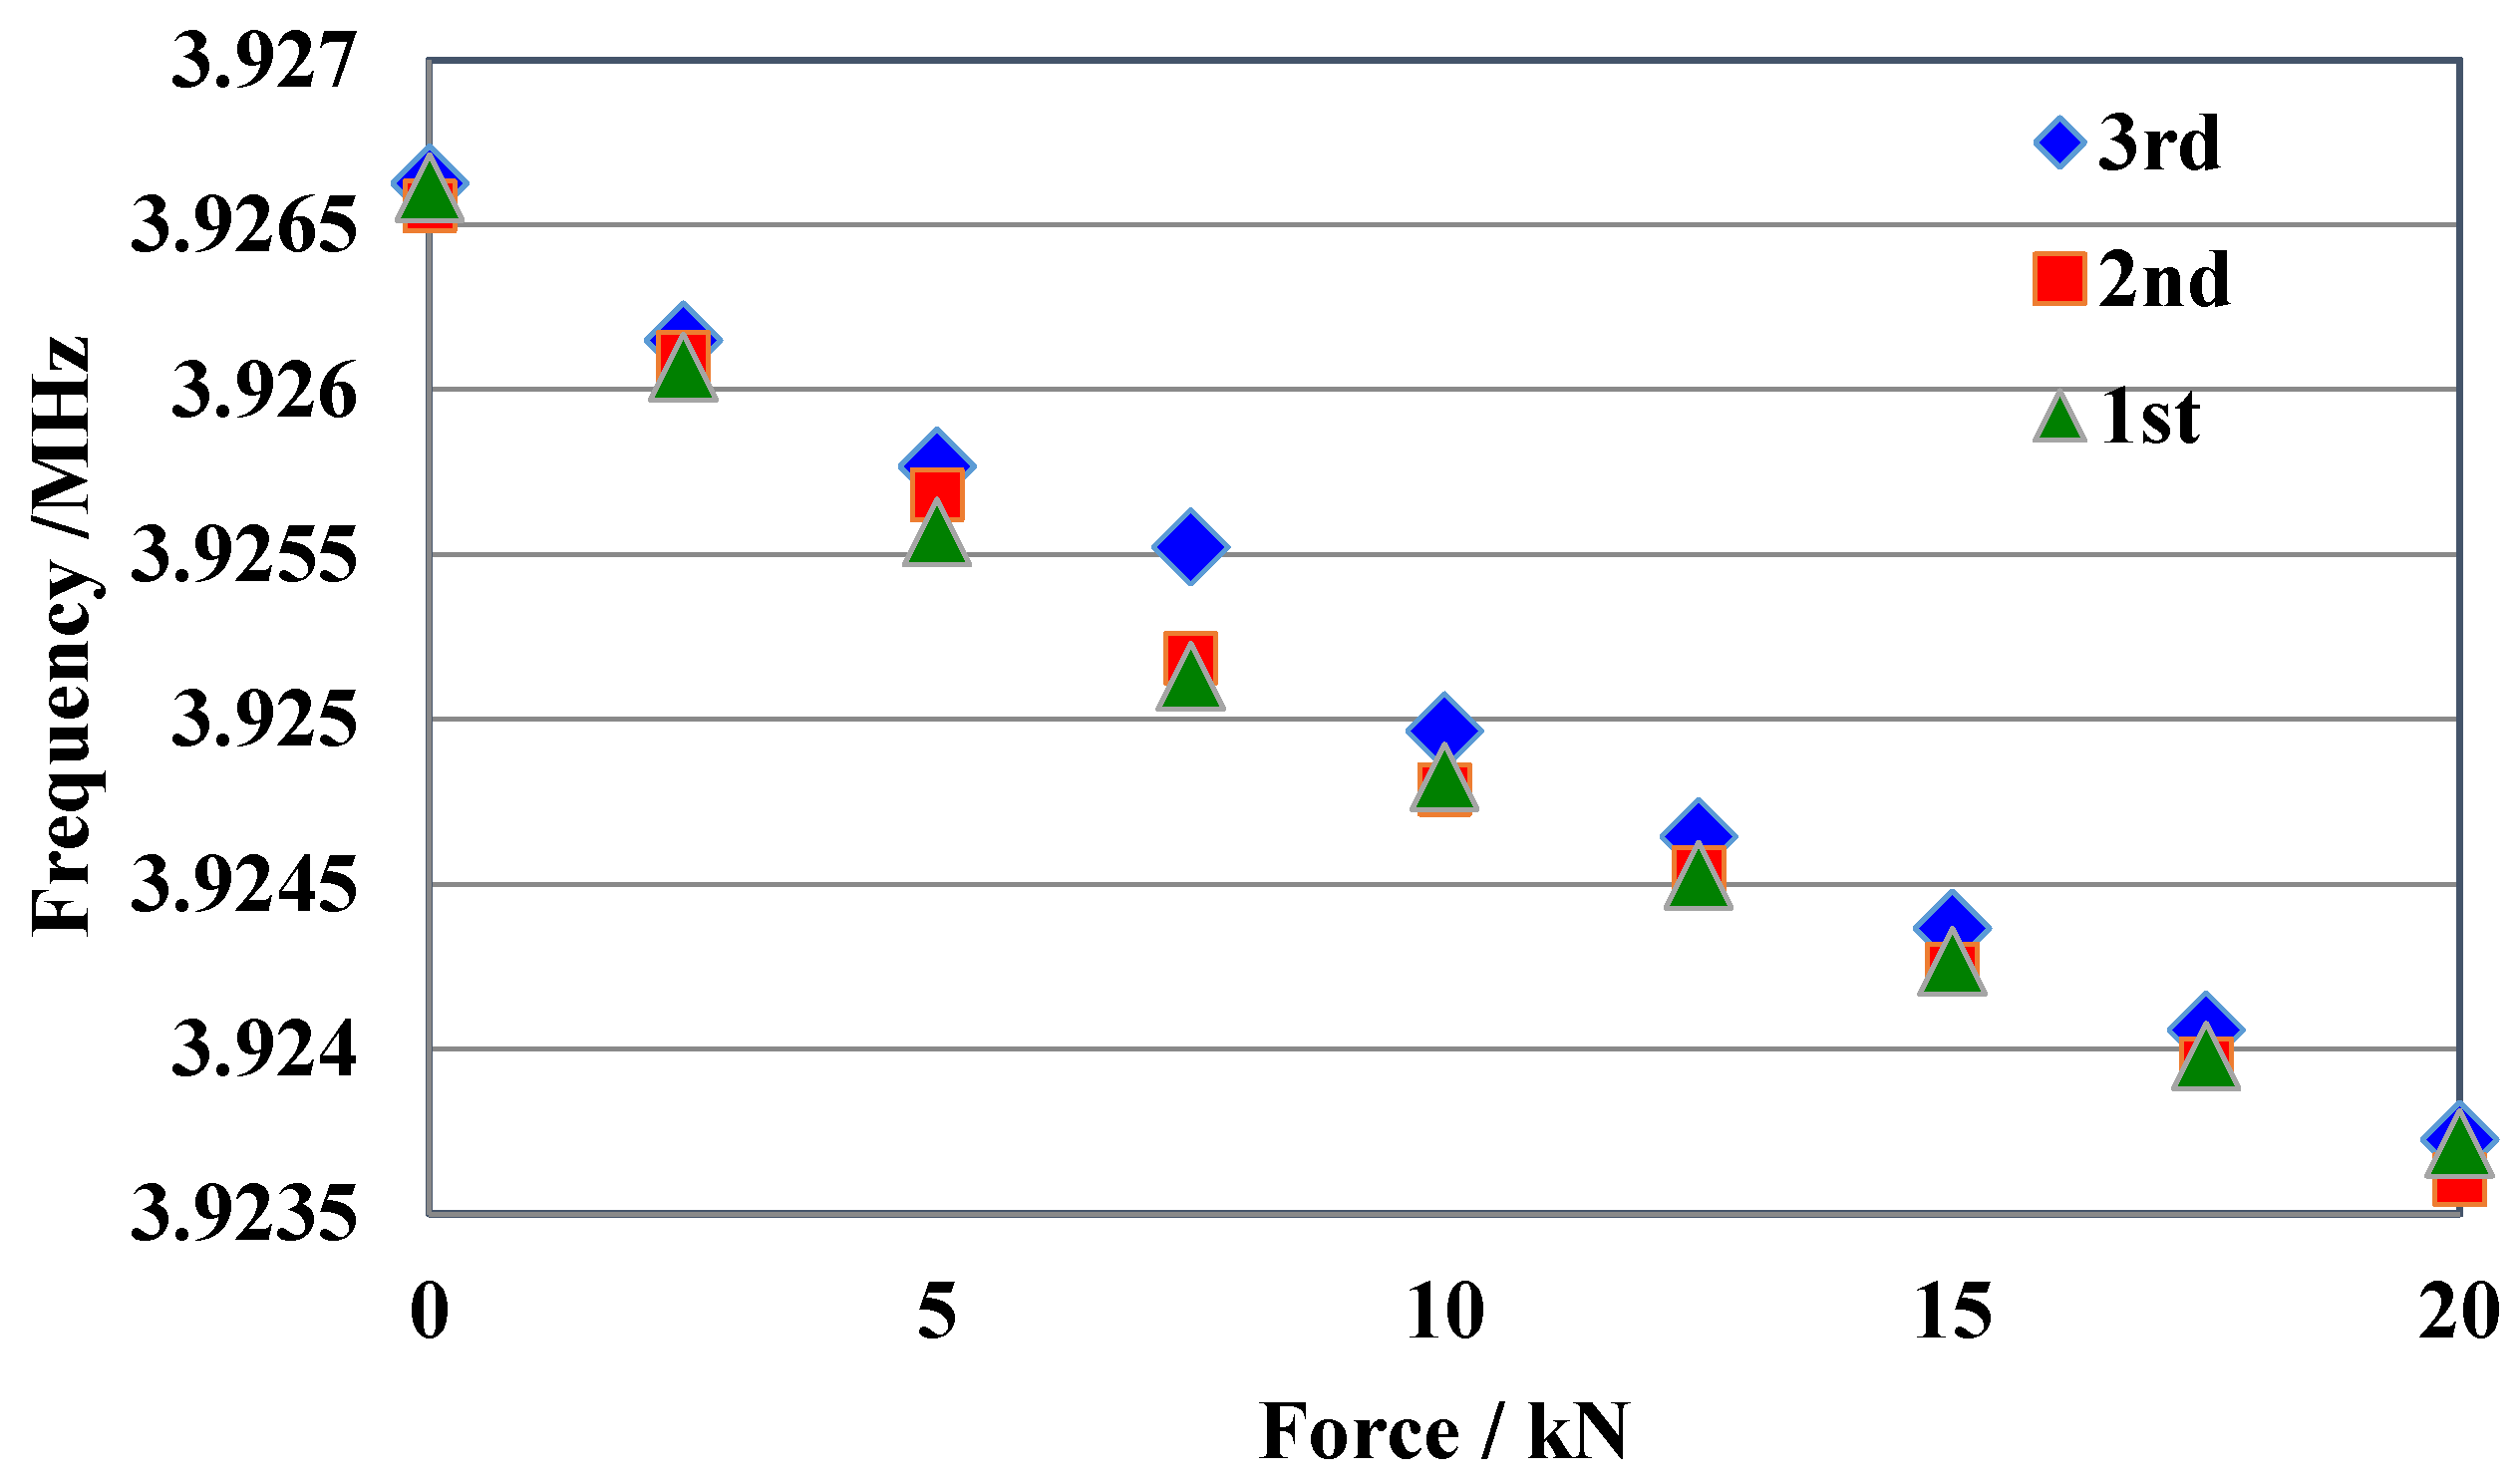
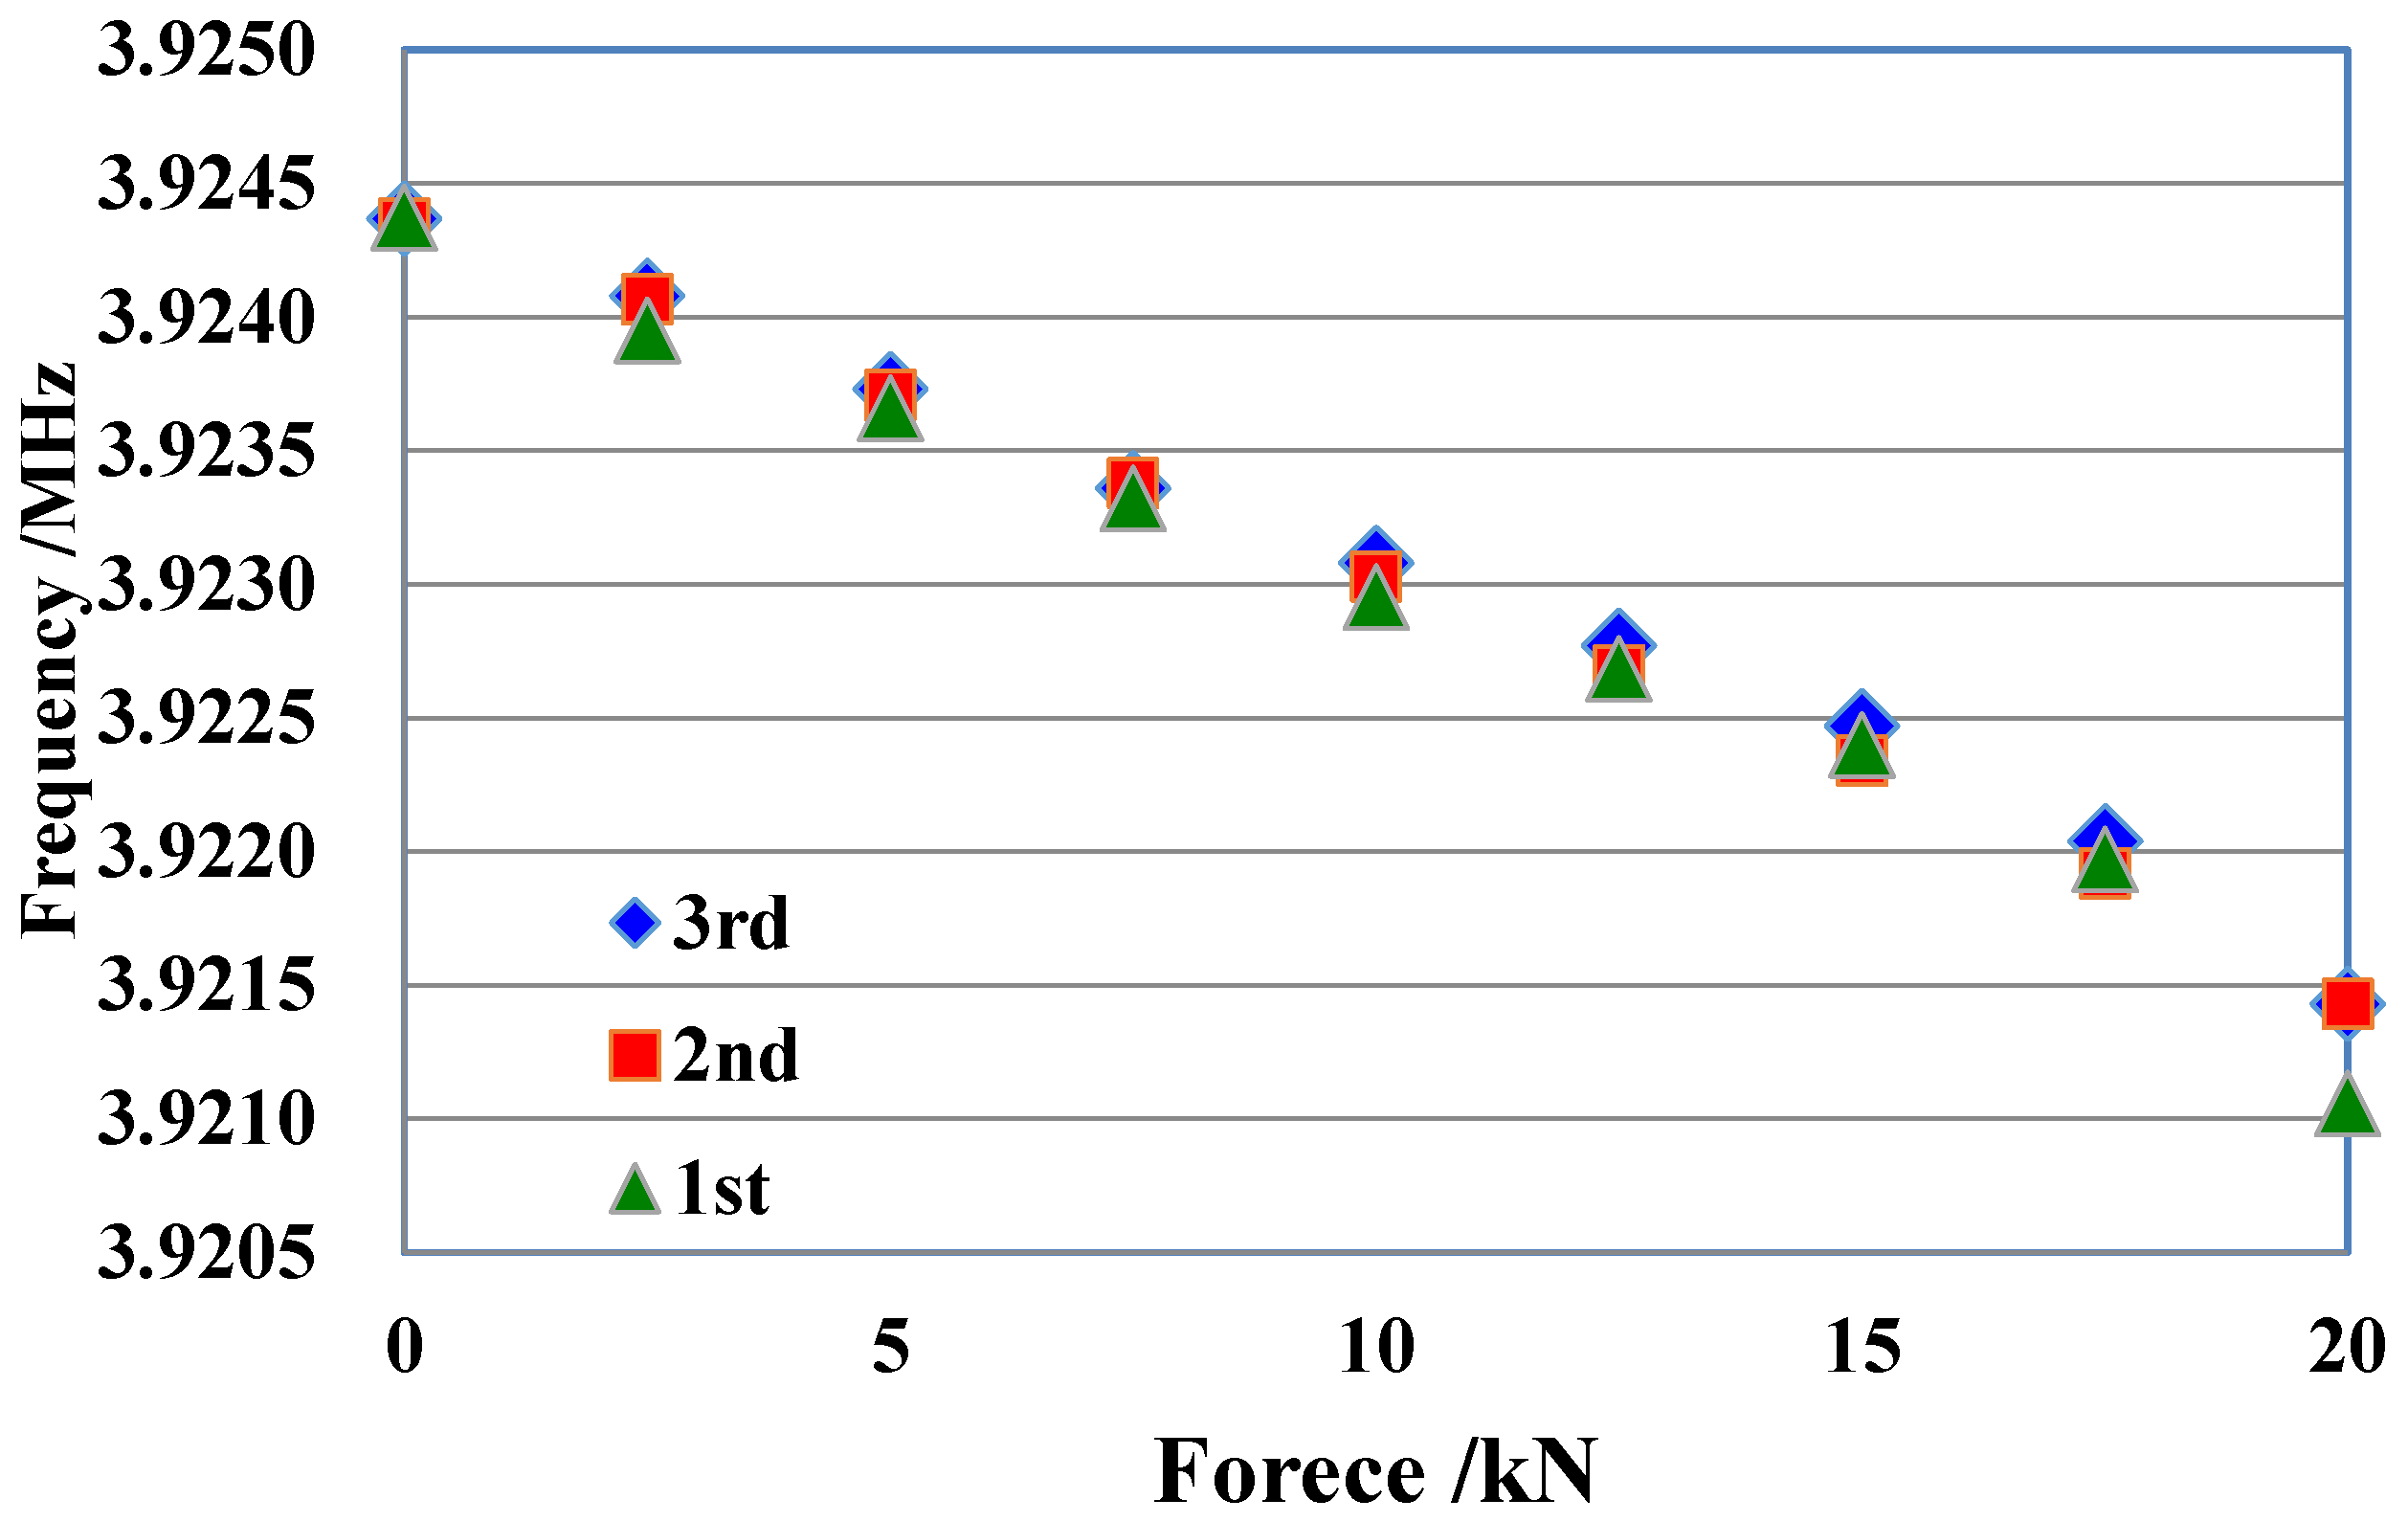
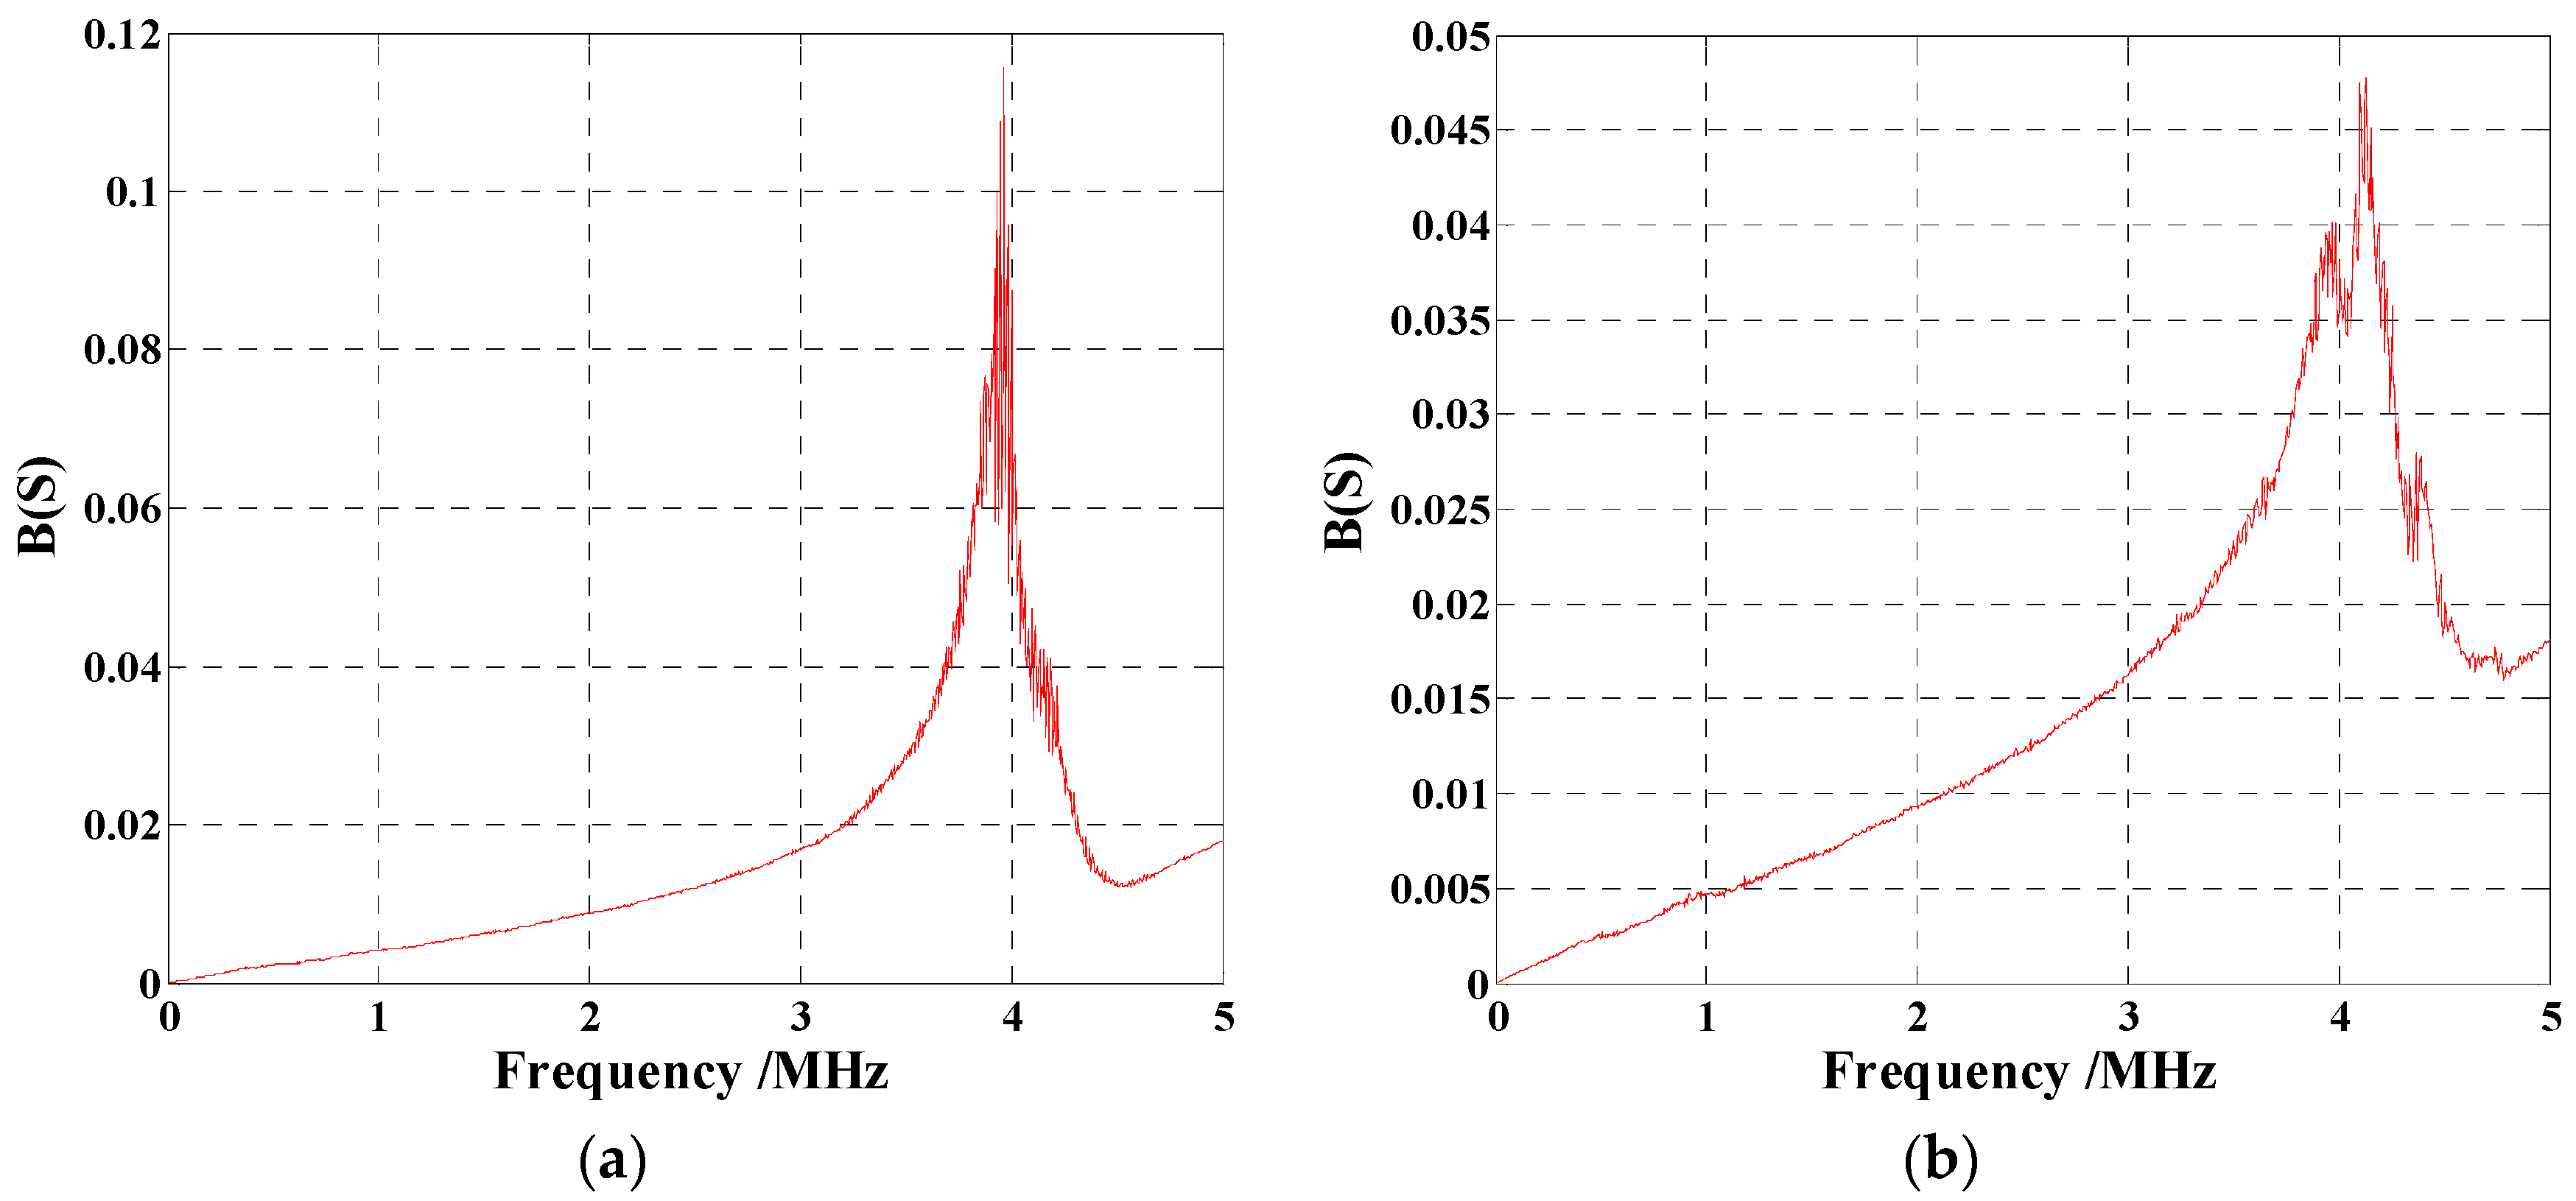
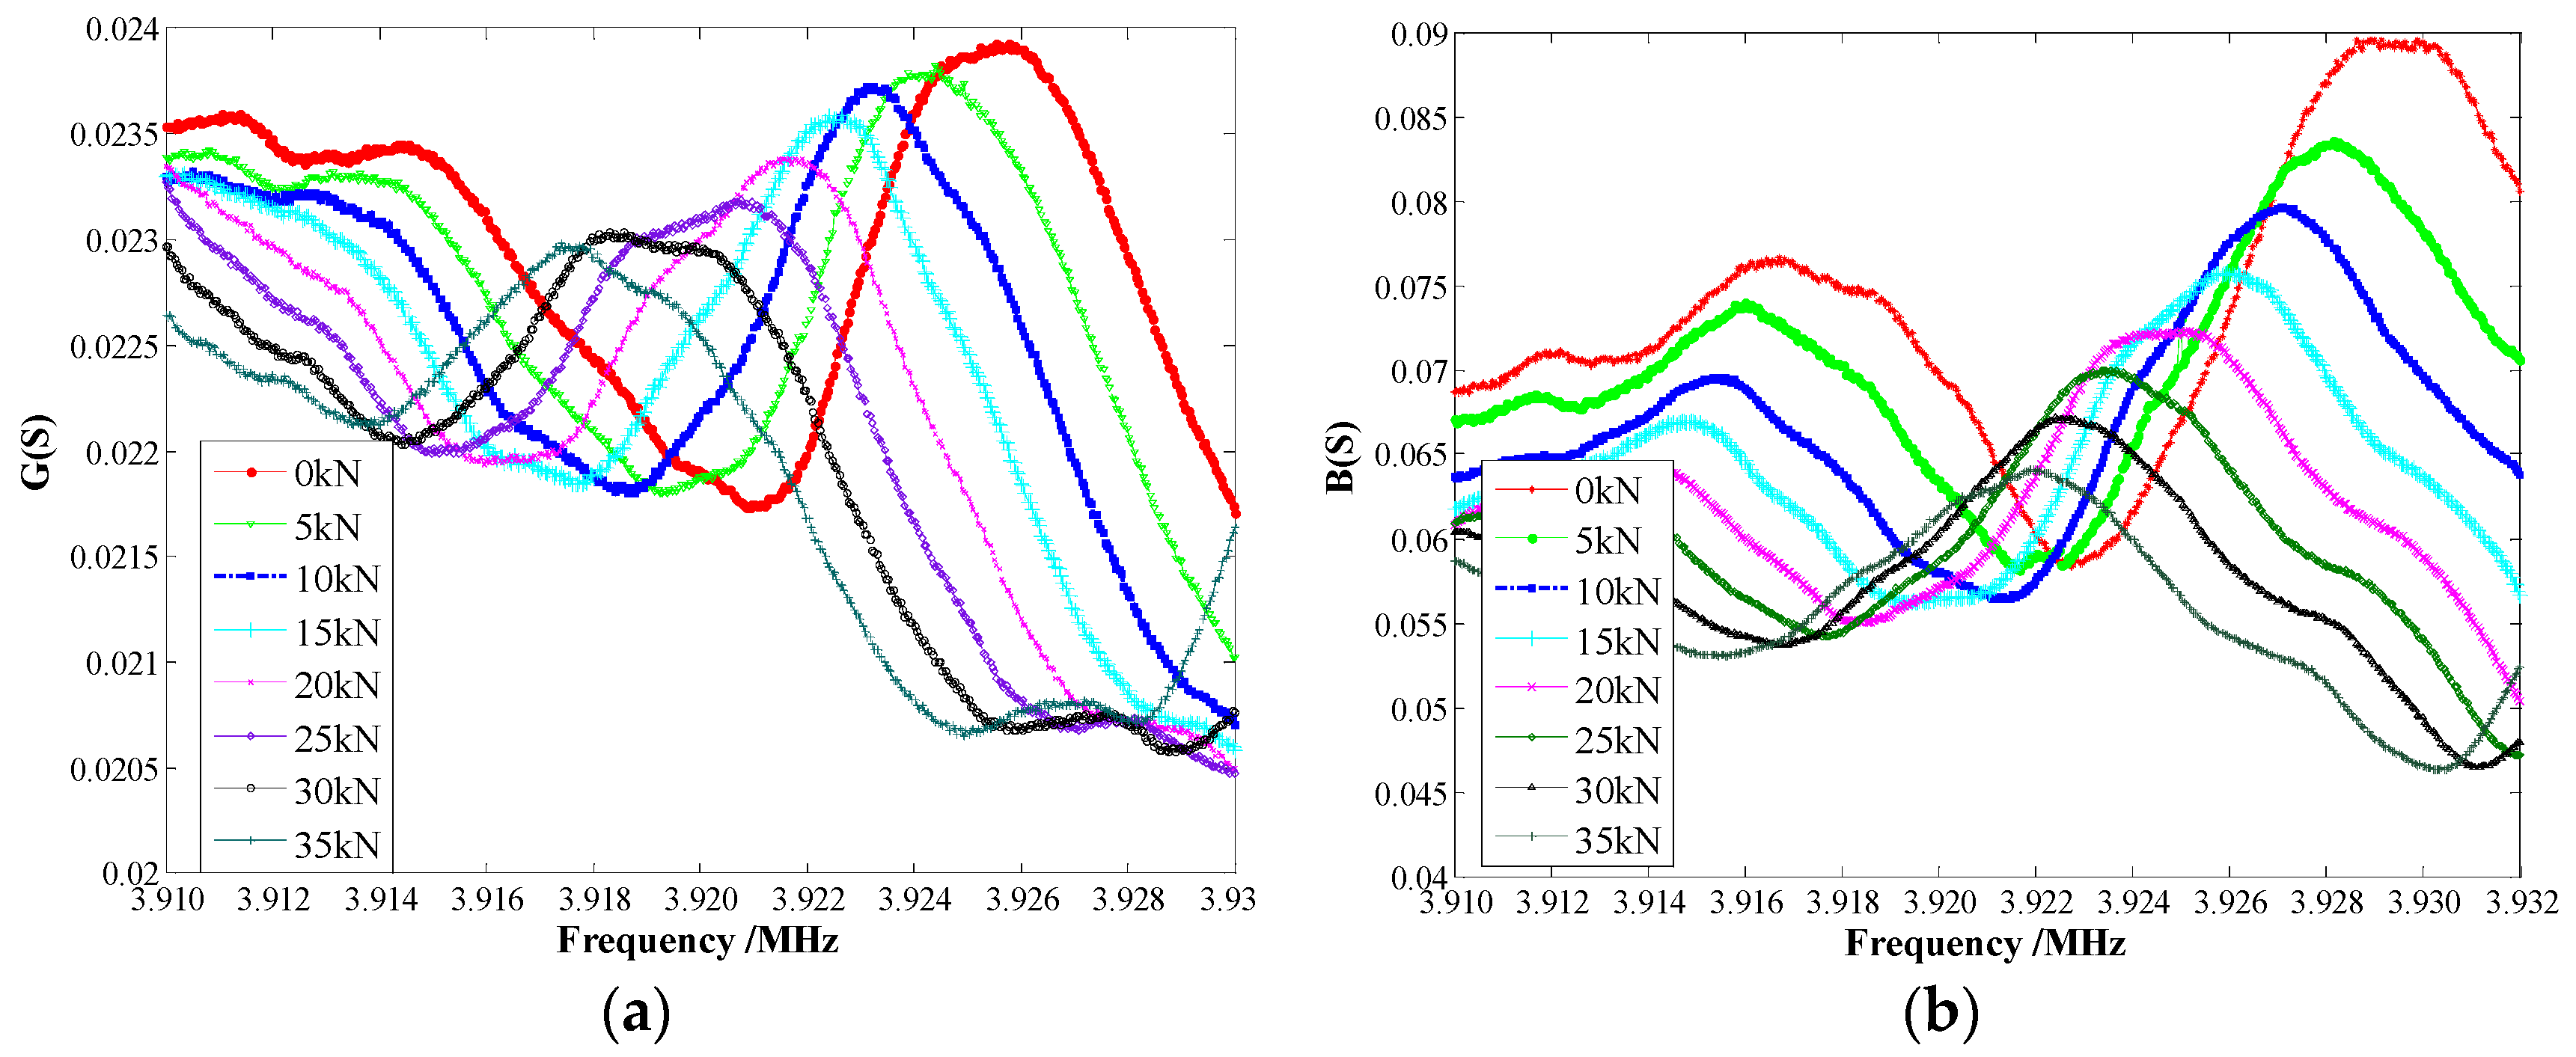
4.1. The M16 Bolt Experimental Results

The M16 bolt with the piezoelectric patch bonded on its head was first placed on the side bolt position, as shown in Figure 1, and the testing machine applied a load from 0 to the maximum 40 kN on the center bolt. Therefore, the side bolt endured a load of 0 to 20 kN. The sweep frequency range is from 3.92 MHz to 3.93 MHz, as shown in Figure 3. Figure 5 shows the conductance frequency changes of M16 bolt under different bolt preloads from 0 to 20 kN in three repeated experiments. It can be seen that the frequency, which can be considered a specified peak frequency of the coupling system of the piezoelectric patch and the bolt, decreases as the bolt preload increases. The frequency change is linear with the change of the bolt preload. Thus, by observing the peak frequency change, the bolt preload can be determined.
The specified peak frequencies in the susceptance signatures also have this tendency, as shown in Figure 6 for three repeated experiments. The specified peak frequencies of the imaginary part of admittance decrease as the bolt preloads increase.
Then the M16 bolt with the piezoelectric patch on its head was place in the center bolt position as shown in Figure 1, and the maximum force applied by the testing machine was set to 35 kN which covered the bolt’s rated preload range. The sweep frequency range was changed from 3.91 to 3.932 MHz. The specified peak frequency changes of both the real and imaginary parts of admittance for M16 bolt under different preloads are shown in Figure 7. From Figure 7, it can be seen that the specified peak frequency decreases as the bolt preload increases and the frequency change is still linear with the change of bolt preload. That means the bolt preload can be determined by the specified peak frequency shift, and this method can fulfill the full range measurement of the bolt preload.

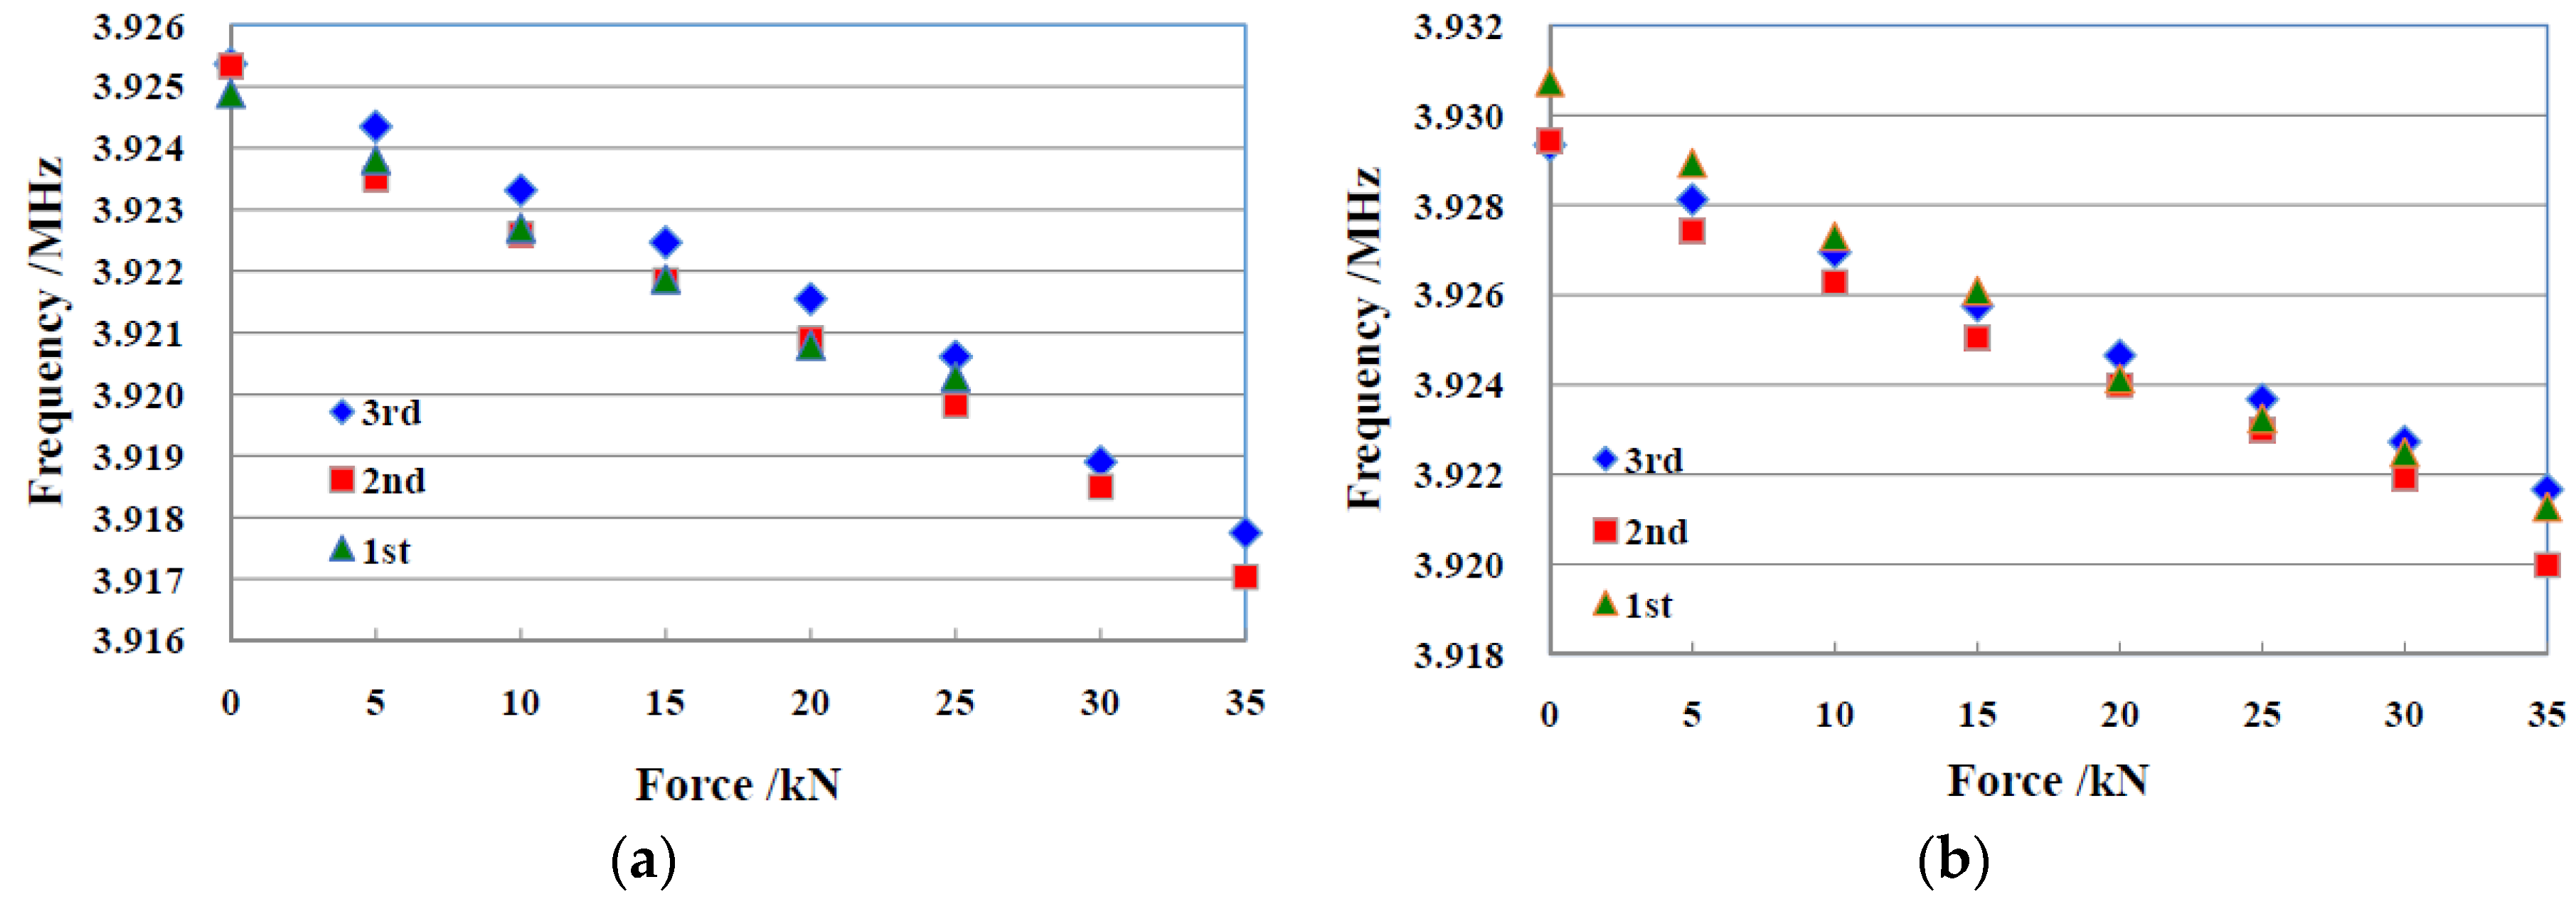
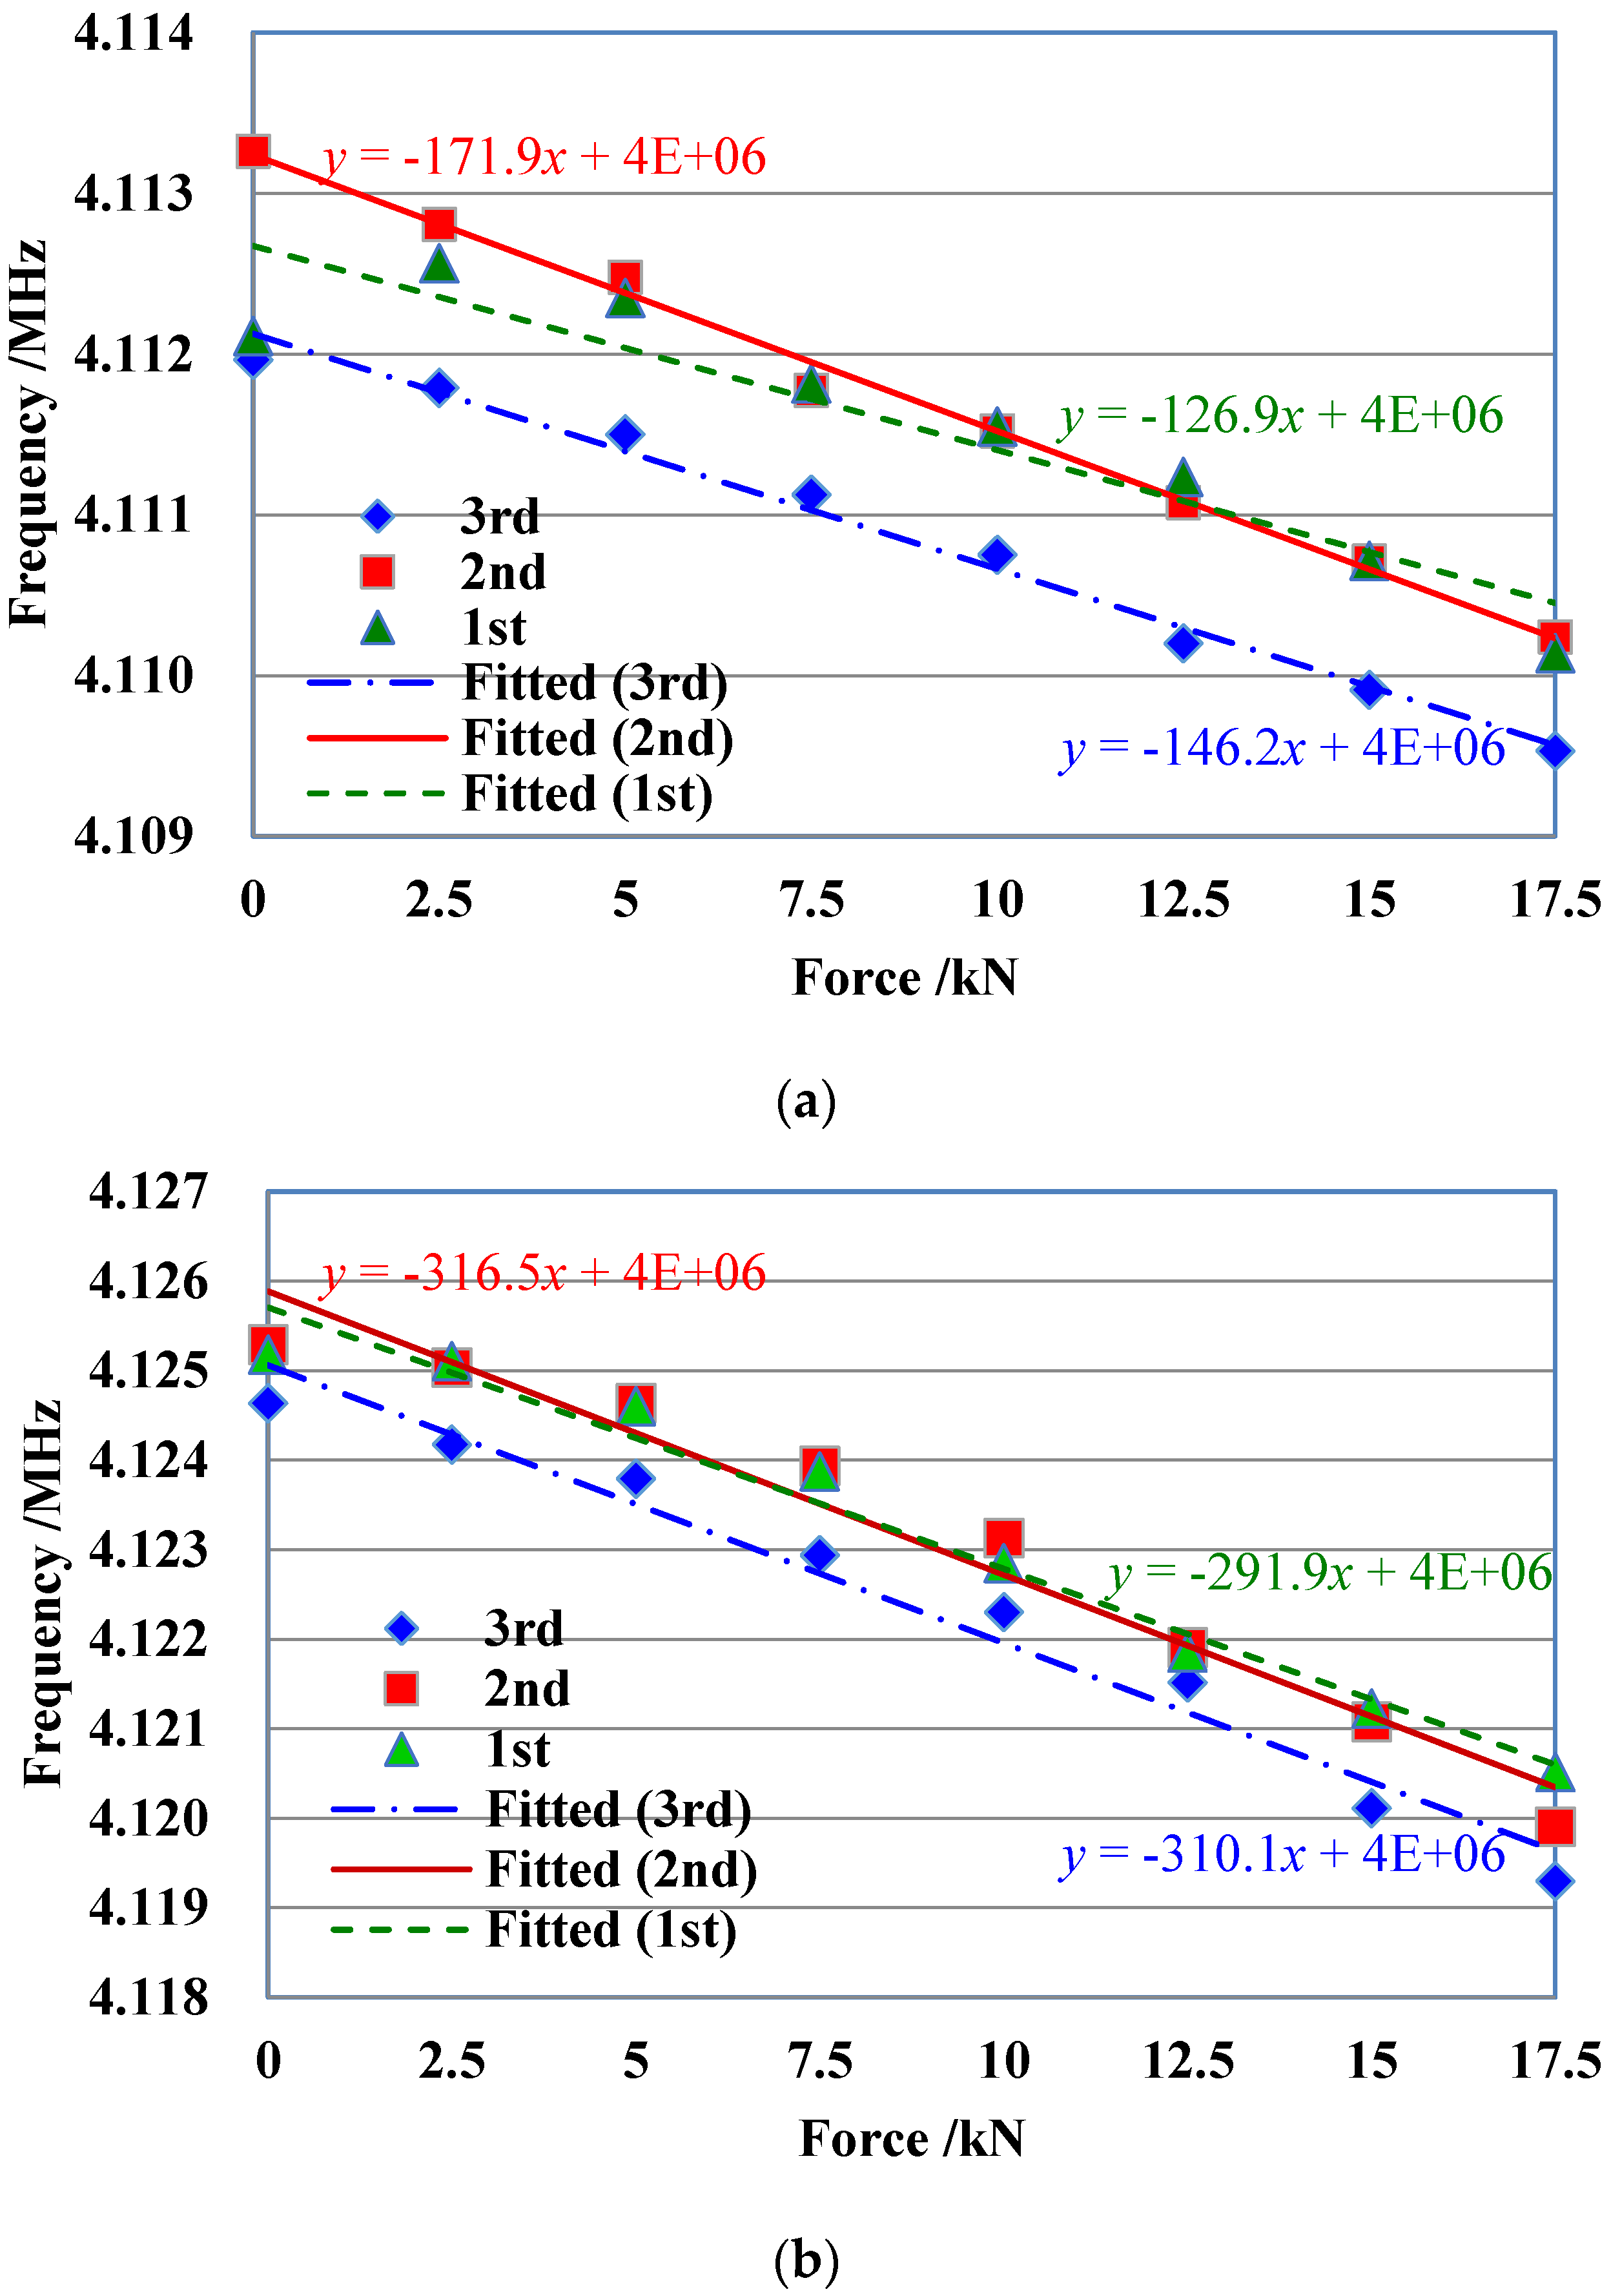
4.2. The M12 Bolt Experimental Results

An M12 bolt with the piezoelectric patch on its head is used for the experiment. The M12 bolt is placed in the side bolt position, as shown in Figure 1, and the sweep frequency band is chosen from 4.1 MHz to 4.14 MHz based on Figure 3. The applied force is set from 0 to 35 kN on the center bolt, so the M12 bolt endures an axial force from 0 to 17.5 kN.
As shown in Figure 8, the specified peak frequencies of the admittance signatures, including the real part and the imaginary part, decrease as the bolt preload’s increase, and the specified frequency changes linearly with the bolt preload. This trend is similar to that of the M16 bolt experimental results, and once again it demonstrates that by measuring the specified frequency shift of the piezoelectric admittance signature, the bolt preload can be determined. After each experiment, the bolt with the piezoelectric patch on its head is rearranged to investigate the influence of the installation on the experimental results. The experimental data, as shown in Figure 8, have little variation, and this may be due to the changes of the boundary conditions. Importantly, for each experiment, the specified frequency change rates of all three experiments are almost the same, which is represented by the slope of the fitted line. Thus, in the application of this method, the frequency change rate as a feature parameter of the bolt preload is also a better choice.

5. Conclusions

In this paper, a new piezoelectric impedance-based method is used to detect bolt looseness. In the proposed method, a wide band sweep sine wave is first used to obtain the peak frequency of the imaginary part of the admittance, and then a sensitive frequency band is determined around this peak frequency. In this sensitive frequency band, a specified peak frequency is chosen as a feature parameter to investigate its shift under different bolt preload. An experimental device that allows the precision control of the axial preload of a bolt is designed and fabricated. A piezoelectric patch is bonded on the bolt head for measuring the piezoelectric admittance. An electronic universal testing machine is adopted to apply load accurately on the bolt using the developed experimental device to simulate the bolt preload. Experiments using different bolts with different preloads are performed. The experimental results show that the specified peak frequency decreases as the bolt preload increases, and the specified frequency shift has a linear relationship with the preload on the bolt. Therefore, in the proposed method, the frequency shift can be chosen as a feature parameter to determine the bolt preload.
The piezoelectric impedance frequency shift method has better testing results than that using the damage index method, and it is more stable than just using the piezoelectric impedance data to build a damage index. However, there are still many issues, such as the mechanism of the method, the influencing factor on the accurate measurement, whether there is hysteresis effect in the loading process and unloading process, and the improvement and optimization of the test device for the measurement of more types of bolts, need further study. Based on this method, the smart bolt integrated with piezoelectric material can be designed and applied for on-site monitoring of bolt preloads.

Acknowledgments

This research was partially supported by the Natural Science Foundation of China under Grant No. 51375354 and 51278084, and the Natural Science Foundation of Hubei province under Grants No. 2015CFB306 and the Research Project of Hubei Education under Grants No.Q20131104 and No.Q20151103.

Author Contributions

Junhua Shao, Tao Wang, Dan Yang and Yourong Li conceived and designed the experiments; Junhua Shao, Tao Wang and Heyue Yin performed the experiments; Junhua Shao, Tao Wang and Dan Yang analyzed the data; Junhua Shao and Yourong Li contributed reagents/materials/analysis tools; Junhua Shao, Tao Wang, Heyue Yin, Dan Yang and Yourong Li wrote the paper.

Conflicts of Interest

The authors declare no conflicts of interest.

References

  1. Wang, T.; Song, G.; Liu, S.; Li, Y.; Xiao, H. Review of Bolted Connection Monitoring. Int. J. Distrib. Sens. Netw. 2013, 2013, 1–8. [Google Scholar] [CrossRef]
  2. Hirao, M.; Ogi, H.; Yasui, H. Contactless measurement of bolt axial stress using a shear-wave electromagnetic acoustic transducer. NDT & E Int. 2001, 34, 179–183. [Google Scholar]
  3. Jhang, K.Y.; Quan, H.H.; Ha, J.; Kim, N.Y. Estimation of clamping force in high-tension bolts through ultrasonic velocity measurement. Ultrasonics 2006, 44, e1339–e1342. [Google Scholar] [CrossRef] [PubMed]
  4. Kim, N.; Hong, M. Measurement of axial stress using mode-converted ultrasound. NDT & E Int. 2009, 42, 164–169. [Google Scholar]
  5. Chaki, S.; Corneloup, G.; Lillamand, I.; Walaszek, H. Combination of longitudinal and transverse ultrasonic waves for in situ control of the tightening of bolts. J. Press. Vessel Technol. 2007, 129, 383–390. [Google Scholar] [CrossRef]
  6. Joshi, S.G.; Pathare, R.G. Ultrasonic instrument for measuring bolt stress. Ultrasonics 1984, 22, 261–269. [Google Scholar] [CrossRef]
  7. Caccese, V.; Mewer, R.; Vel, S.S. Detection of bolt load loss in hybrid composite/metal bolted connections. Eng. Struct. 2004, 26, 895–906. [Google Scholar] [CrossRef]
  8. Amerini, F.; Barbieri, E.; Meo, M.; Polimeno, U. Detecting loosening/tightening of clamped structures using nonlinear vibration techniques. Smart Mater. Struct. 2010, 19, 085013. [Google Scholar] [CrossRef]
  9. Amerini, F.; Meo, M. Structural health monitoring of bolted joints using linear and nonlinear acoustic/ultrasound methods. Struct. Health Monit. 2011, 10, 659–672. [Google Scholar] [CrossRef]
  10. Meyer, J.L.; Harrington, W.B.; Agrawal, B.N.; Song, G. Vibration suppression of a spacecraft flexible appendage using smart material. Smart Mater. Struct. 1998, 7, 95–104. [Google Scholar] [CrossRef]
  11. Sethi, V.; Song, G. Optimal vibration control of a model frame structure using piezoceramic sensors and actuators. J. Vib. Control 2005, 11, 671–684. [Google Scholar] [CrossRef]
  12. Song, G.; Gu, H.; Mo, Y.L.; Hsu, T.T.C.; Dhonde, H. Concrete structural health monitoring using embedded piezoceramic transducers. Smart Mater. Struct. 2007, 16, 959–968. [Google Scholar] [CrossRef]
  13. Laskar, A.; Gu, H.; Mo, Y.L.; Song, G. Progressive collapse of a two-story reinforced concrete frame with embedded smart aggregates. Smart Mater. Struct. 2009, 18, 075001. [Google Scholar] [CrossRef]
  14. Yang, J.; Chang, F.K. Detection of bolt loosening in C–C composite thermal protection panels: I. Diagnostic principle. Smart Mater. Struct. 2006, 15, 581–590. [Google Scholar] [CrossRef]
  15. Yang, J.; Chang, F.K. Detection of bolt loosening in C–C composite thermal protection panels: II. Experimental verification. Smart Mater. Struct. 2006, 15, 591–599. [Google Scholar] [CrossRef]
  16. Wang, T.; Song, G.; Wang, Z.; Li, Y. Proof-of-concept study of monitoring bolt connection status using a piezoelectric based active sensing method. Smart Mater. Struct. 2013, 22, 087001. [Google Scholar] [CrossRef]
  17. Wang, T.; Liu, S.; Shao, J.; Li, Y. Health monitoring of bolted joints using the time reversal method and piezoelectric transducers. Smart Mater. Struct. 2016, 25, 025010. [Google Scholar] [CrossRef]
  18. Song, G.; Li, H.; Gajic, B.; Zhou, W.; Chen, P.; Gu, H. Wind turbine blade health monitoring with piezoceramic-based wireless sensor network. Int. J. Smart Nano Mater. 2013, 4, 150–166. [Google Scholar] [CrossRef]
  19. Ruan, J.; Ho, S.C.M.; Patil, D.; Li, M.; Song, G. Wind turbine blade damage detection using an active sensing approach. Smart Mater. Struct. 2014, 23, 105005. [Google Scholar] [CrossRef]
  20. Liang, C.; Sun, F.P.; Rogers, C.A. Coupled electro-mechanical analysis of adaptive material systems—Determination of the actuator power consumption and system energy transfer. J. Intell. Mater. Syst. Struct. 1994, 5, 12–20. [Google Scholar] [CrossRef]
  21. Park, G.; Sohn, H.; Farrar, C.R.; Inman, D.J. Overview of piezoelectric impedance-based health monitoring and path forward. Shock Vib. Dig. 2003, 35, 451–463. [Google Scholar] [CrossRef]
  22. Gu, H.; Moslehy, Y.; Sanders, D.; Song, G.; Mo, Y.L. Multi-functional smart aggregate-based structural health monitoring of circular reinforced concrete columns subjected to seismic excitations. Smart Mater. Struct. 2010, 19, 065026. [Google Scholar] [CrossRef]
  23. Ruan, J.; Ho, S.C.M.; Patil, D.; Song, G. Structural health monitoring of wind turbine blade using piezoceremic based active sensing and impedance sensing. In Proceedings of the 2014 IEEE 11th International Conference on Networking, Sensing and Control (ICNSC), Miami, FL, USA, 7–9 April 2014; pp. 661–666.
  24. Wong, Y.R.; Du, H.; Pang, X. Real-time electrical impedance resonance shift of piezoelectric sensor for detection of damage in honeycomb core sandwich structures. NDT & E Int. 2015, 76, 61–65. [Google Scholar]
  25. Selva, P.; Cherrier, O.; Budinger, V.; Lachaud, F.; Morlier, J. Smart monitoring of aeronautical composites plates based on electromechanical impedance measurements and artificial neural networks. Eng. Struct. 2013, 56, 794–804. [Google Scholar] [CrossRef] [Green Version]
  26. Bhalla, S.; Soh, C.K. Structural health monitoring by piezo-impedance transducers. I: Modeling. J. Aerosp. Eng. 2004, 17, 154–165. [Google Scholar] [CrossRef]
  27. Lim, Y.Y.; Bhalla, S.; Soh, C.K. Structural identification and damage diagnosis using self-sensing piezo-impedance transducers. Smart Mater. Struct. 2006, 15, 987–995. [Google Scholar] [CrossRef]
  28. Peairs, D.M.; Park, G.; Inman, D.J. Improving accessibility of the impedance-based structural health monitoring method. J. Intell. Mater. Syst. Struct. 2004, 15, 129–139. [Google Scholar] [CrossRef]
  29. Lu, X.; Zhu, C.; Zhang, J.; Wang, N.; Li, Y. Application of Electro-Mechanical Impedance Method in Crack Detecting of Welding Line. J. Nanjing Univers. Aeron. Astron. 2011, 2, 205–209. [Google Scholar]
  30. Lim, Y.Y.; Soh, C.K. Fatigue life estimation of a 1D aluminum beam under mode-I loading using the electromechanical impedance technique. Smart Mater. Struct. 2011, 20, 125001. [Google Scholar] [CrossRef]
  31. Liang, Y.; Li, D.; Parvasi, S.M.; Kong, Q.; Song, G. Bond-slip detection of concrete-encased composite structure using electro-mechanical impedance technique. Smart Mater. Struct. 2016, 25, 095003. [Google Scholar] [CrossRef]
  32. Martowicz, A.; Sendecki, A.; Salamon, M.; Rosiek, M.; Uhl, T. Application of electromechanical impedance-based SHM for damage detection in bolted pipeline connection. Nondestruct. Test. Eval. 2015, 31, 17–44. [Google Scholar] [CrossRef]
  33. Ritdumrongkul, S.; Abe, M.; Fujino, Y.; Miyashita, T. Quantitative health monitoring of bolted joints using a piezoceramic actuator-sensor. Smart Mater. Struct. 2003, 13, 20–29. [Google Scholar] [CrossRef]
  34. Park, G.; Cudney, H.H.; Inman, D.J. Feasibility of using impedance-based damage assessment for pipeline structures. Earthquake Eng. Struct. Dyn. 2001, 30, 1463–1474. [Google Scholar] [CrossRef]
  35. Wait, J.R.; Park, G.; Farrar, C.R. Integrated structural health assessment using piezoelectric active sensors. Shock Vib. 2005, 12, 389–405. [Google Scholar] [CrossRef]
  36. An, Y.K.; Sohn, H. Integrated impedance and guided wave based damage detection. Mech. Syst. Signal Process. 2012, 28, 50–62. [Google Scholar] [CrossRef]
  37. Annamdas, V.G.M.; Yang, Y.; Soh, C.K. Influence of loading on the electromechanical admittance of piezoceramic transducers. Smart Mater. Struct. 2007, 16, 1888–1897. [Google Scholar] [CrossRef]
  38. Ong, C.W.; Yang, Y.; Naidu, A.S.; Lu, Y.; Soh, C.K. Application of the electro-mechanical impedance method for the identification of in-situ stress in structures. Proc. SPIE 2002, 503–514. [Google Scholar] [CrossRef]
  39. Lim, Y.Y.; Soh, C.K. Effect of varying axial load under fixed boundary condition on admittance signatures of electromechanical impedance technique. J. Intell. Mater. Syst. Struct. 2012, 23, 815–826. [Google Scholar] [CrossRef]
  40. Lim, Y.Y.; Liew, W.Y.H.; Soh, C.K. A Parametric Study on Admittance Signatures of a PZT Transducer under Free Vibration. Mech. Adv. Mater. Struct. 2015, 22, 877–884. [Google Scholar] [CrossRef]
  41. Wang, J.; Xiao, H.; Lv, Y.; Wang, T.; Xu, Z. Detrended Fluctuation Analysis and Hough Transform Based Self-Adaptation Double-Scale Feature Extraction of Gear Vibration Signals. Shock Vib. 2016, 2016, 1–9. [Google Scholar] [CrossRef]
  42. Lv, Y.; Zhu, Q.; Yuan, R. Fault Diagnosis of Rolling Bearing Based on Fast Nonlocal Means and Envelop Spectrum. Sensors 2015, 15, 1182–1198. [Google Scholar] [CrossRef] [PubMed]
Figure 1. Schematic diagram of the bolt clamp.
Applsci 06 00298 g001
Figure 2. Testing device.
Applsci 06 00298 g002
Figure 3. Susceptance changes with frequency of (a) M16; and (b) M12 bolts.
Applsci 06 00298 g003
Figure 4. M16 bolt under different axial force: (a) Conductance; and (b) Susceptance.
Applsci 06 00298 g004
Figure 5. Conductance frequency changes of M16 bolt under different forces.
Applsci 06 00298 g005
Figure 6. Susceptance frequency changes of the M16 bolt under different forces.
Applsci 06 00298 g006
Figure 7. Frequency change for M16bolt with maximum 35 kN bolt preload. (a) Real part; (b) Imaginary part.
Applsci 06 00298 g007
Figure 8. Admittance peak frequency changes with different bolt load for the M12 bolt. (a) Real part; (b) Imaginary part.
Applsci 06 00298 g008
Table 1. Parameters of PZT.
ParameterSymbolValue
Density ρ 7800 kg/m3
Piezoelectric constantd31150 × 10−12 C/N
Dielectric constant ε 31 T 1.3 × 10⁻⁸ F/m

