Article

A Modified Thermal Treatment Method for the Up-Scalable Synthesis of Size-Controlled Nanocrystalline Titania

1
Department of Physics, Faculty of Science, University Putra Malaysia (UPM), Serdang 43400, Selangor, Malaysia
2
Department of Radiology, College of Health & Medical Technologies, Baghdad 10047, Iraq
3
Young Researchers and Elite Club, Shahr-e-Qods Branch, Islamic Azad University, Tehran 13115-37541, Iran
4
Shahid Rajaee Branch, Farhangian University, Isfahan 81786-83441, Iran
*
Authors to whom correspondence should be addressed.
Appl. Sci. 2016, 6(10), 295; https://doi.org/10.3390/app6100295
Submission received: 12 August 2016 / Revised: 27 September 2016 / Accepted: 30 September 2016 / Published: 12 October 2016
(This article belongs to the Section Nanotechnology and Applied Nanosciences)

Abstract

:
Considering the increasing demand for titania nanoparticles with controlled quality for various applications, the present work reports the up-scalable synthesis of size-controlled titanium dioxide nanocrystals with a simple and convenient thermal treatment route. Titanium dioxide nanocrystals with tetragonal structure were synthesized directly from an aqueous solution containing titanium (IV) isopropoxide as the main reactant, polyvinyl pyrrolidone (PVP) as the capping agent, and deionized water as a solvent. With the elimination of the drying process in a thermal treatment method, an attempt was made to decrease the synthesis time. The mixture directly underwent calcination to form titanium dioxide (TiO2) nanocrystalline powder, which was confirmed by FT-IR, energy dispersive X-ray spectroscopy (EDX), and X-ray diffraction (XRD) analysis. The control over the size and optical properties of nanocrystals was achieved via variation in calcination temperatures. The obtained average sizes from XRD spectra and transmission electron microscopy (TEM) images showed exponential variation with increasing calcination temperature. The optical properties showed a decrease in the band gap energy with increasing calcination temperature due to the enlargement of the nanoparticle size. These results prove that direct calcination of reactant solution is a convenient thermal treatment route for the potential large-scale production of size-controlled Titania nanoparticles.

Graphical Abstract

1. Introduction

Titanium dioxide is one of the most important and widely studied materials because of its unique and excellent properties such as chemical inertness, non-toxicity, photostability, and low cost, as well as its versatile applications in photovoltaic cells, photocatalysis, and sensors [1,2,3,4]. A significant amount of researches on titanium dioxide (TiO2) has been performed over the last five decades, and a number of reviews on various aspects of that transition metal oxide have been published to understand and summarize the progress in this field [5,6,7,8,9,10,11]. Titanium dioxide is typically an n-type semiconductor due to oxygen deficiency [12], with a significant direct band gap ranging between 2.96–3.20 eV [13]. It exists as three different polymorphs: anatase, rutile and brookite [14,15]. The primary source and the most stable form of TiO2 is rutile. All three polymorphs can be readily synthesized in the laboratory; typically, the metastable anatase and brookite will transform into the thermo-dynamically stable rutile upon calcination at temperatures exceeding 600 °C [16].
Various methods have been previously reported on the synthesis of TiO2 nanoparticles with improved chemical and physical properties, such as the hydrothermal and one-step dynamic hydrothermal process [17,18], chemical vapor deposition (CVD) [19], physical vapor deposition (PVD) [20], electrode deposition [21], plasma-assisted synthesis [22], microwave [23], micelle and inverse micelle [24], and the sol–gel method [25]. However, most of these methods are difficult to employ in large-scale production due to the complicated procedures involved, long reaction times, high reaction temperatures, and the involvement of toxic reagents and by-products in these synthesis methods.
The large-scale preparation of nanoparticles with preferred shapes and sizes under modest conditions has been the target of many researchers over the years. Among novel methods, the thermal treatment method portrays the advantages of low cost production, simplicity, a relatively low reaction temperature, and a lack of by-product effluents contaminated in the drainage system. Moreover, this method can produce nanoparticles with constant quality and has the significant capability of amending the physical structure of the material, resulting in desirable properties [26].
The purpose of the present work was to develop a simple thermal treatment method to synthesize size-controlled Titania nanoparticles at a low cost, over a short period, and at low energy consumption. The effect of calcination temperature on the structural, particle size and optical properties of TiO2 is also considered using various techniques.

2. Results and Discussion

2.1. Synthesis Mechanism

In the first step of obtaining the initial solution, polyvinyl pyrrolidone (PVP) works as a stabilizer for dissolving metallic salts through steric and electrostatic stabilization of the amide groups of the pyrrolidone rings and the methylene groups. By dissolving titanium (IV) isopropoxide in PVP solution, the Ti4+ ions are bound by the strong ionic bonds between the amide group in a polymeric chain and metallic ions. The uniform immobilization of metallic ions in the cavities of the polymer chains favors the formation of nanoparticles with uniform distribution [26,27]. During calcination, the nucleation and growth of nanoparticles is performed by reacting Ti ions and available oxygen in the air to form TiO2 particles. The organic matter is decomposed in this stage, but the carbon residual that bonded on the surface of nanoparticles protects them from uncontrolled growth and agglomeration.

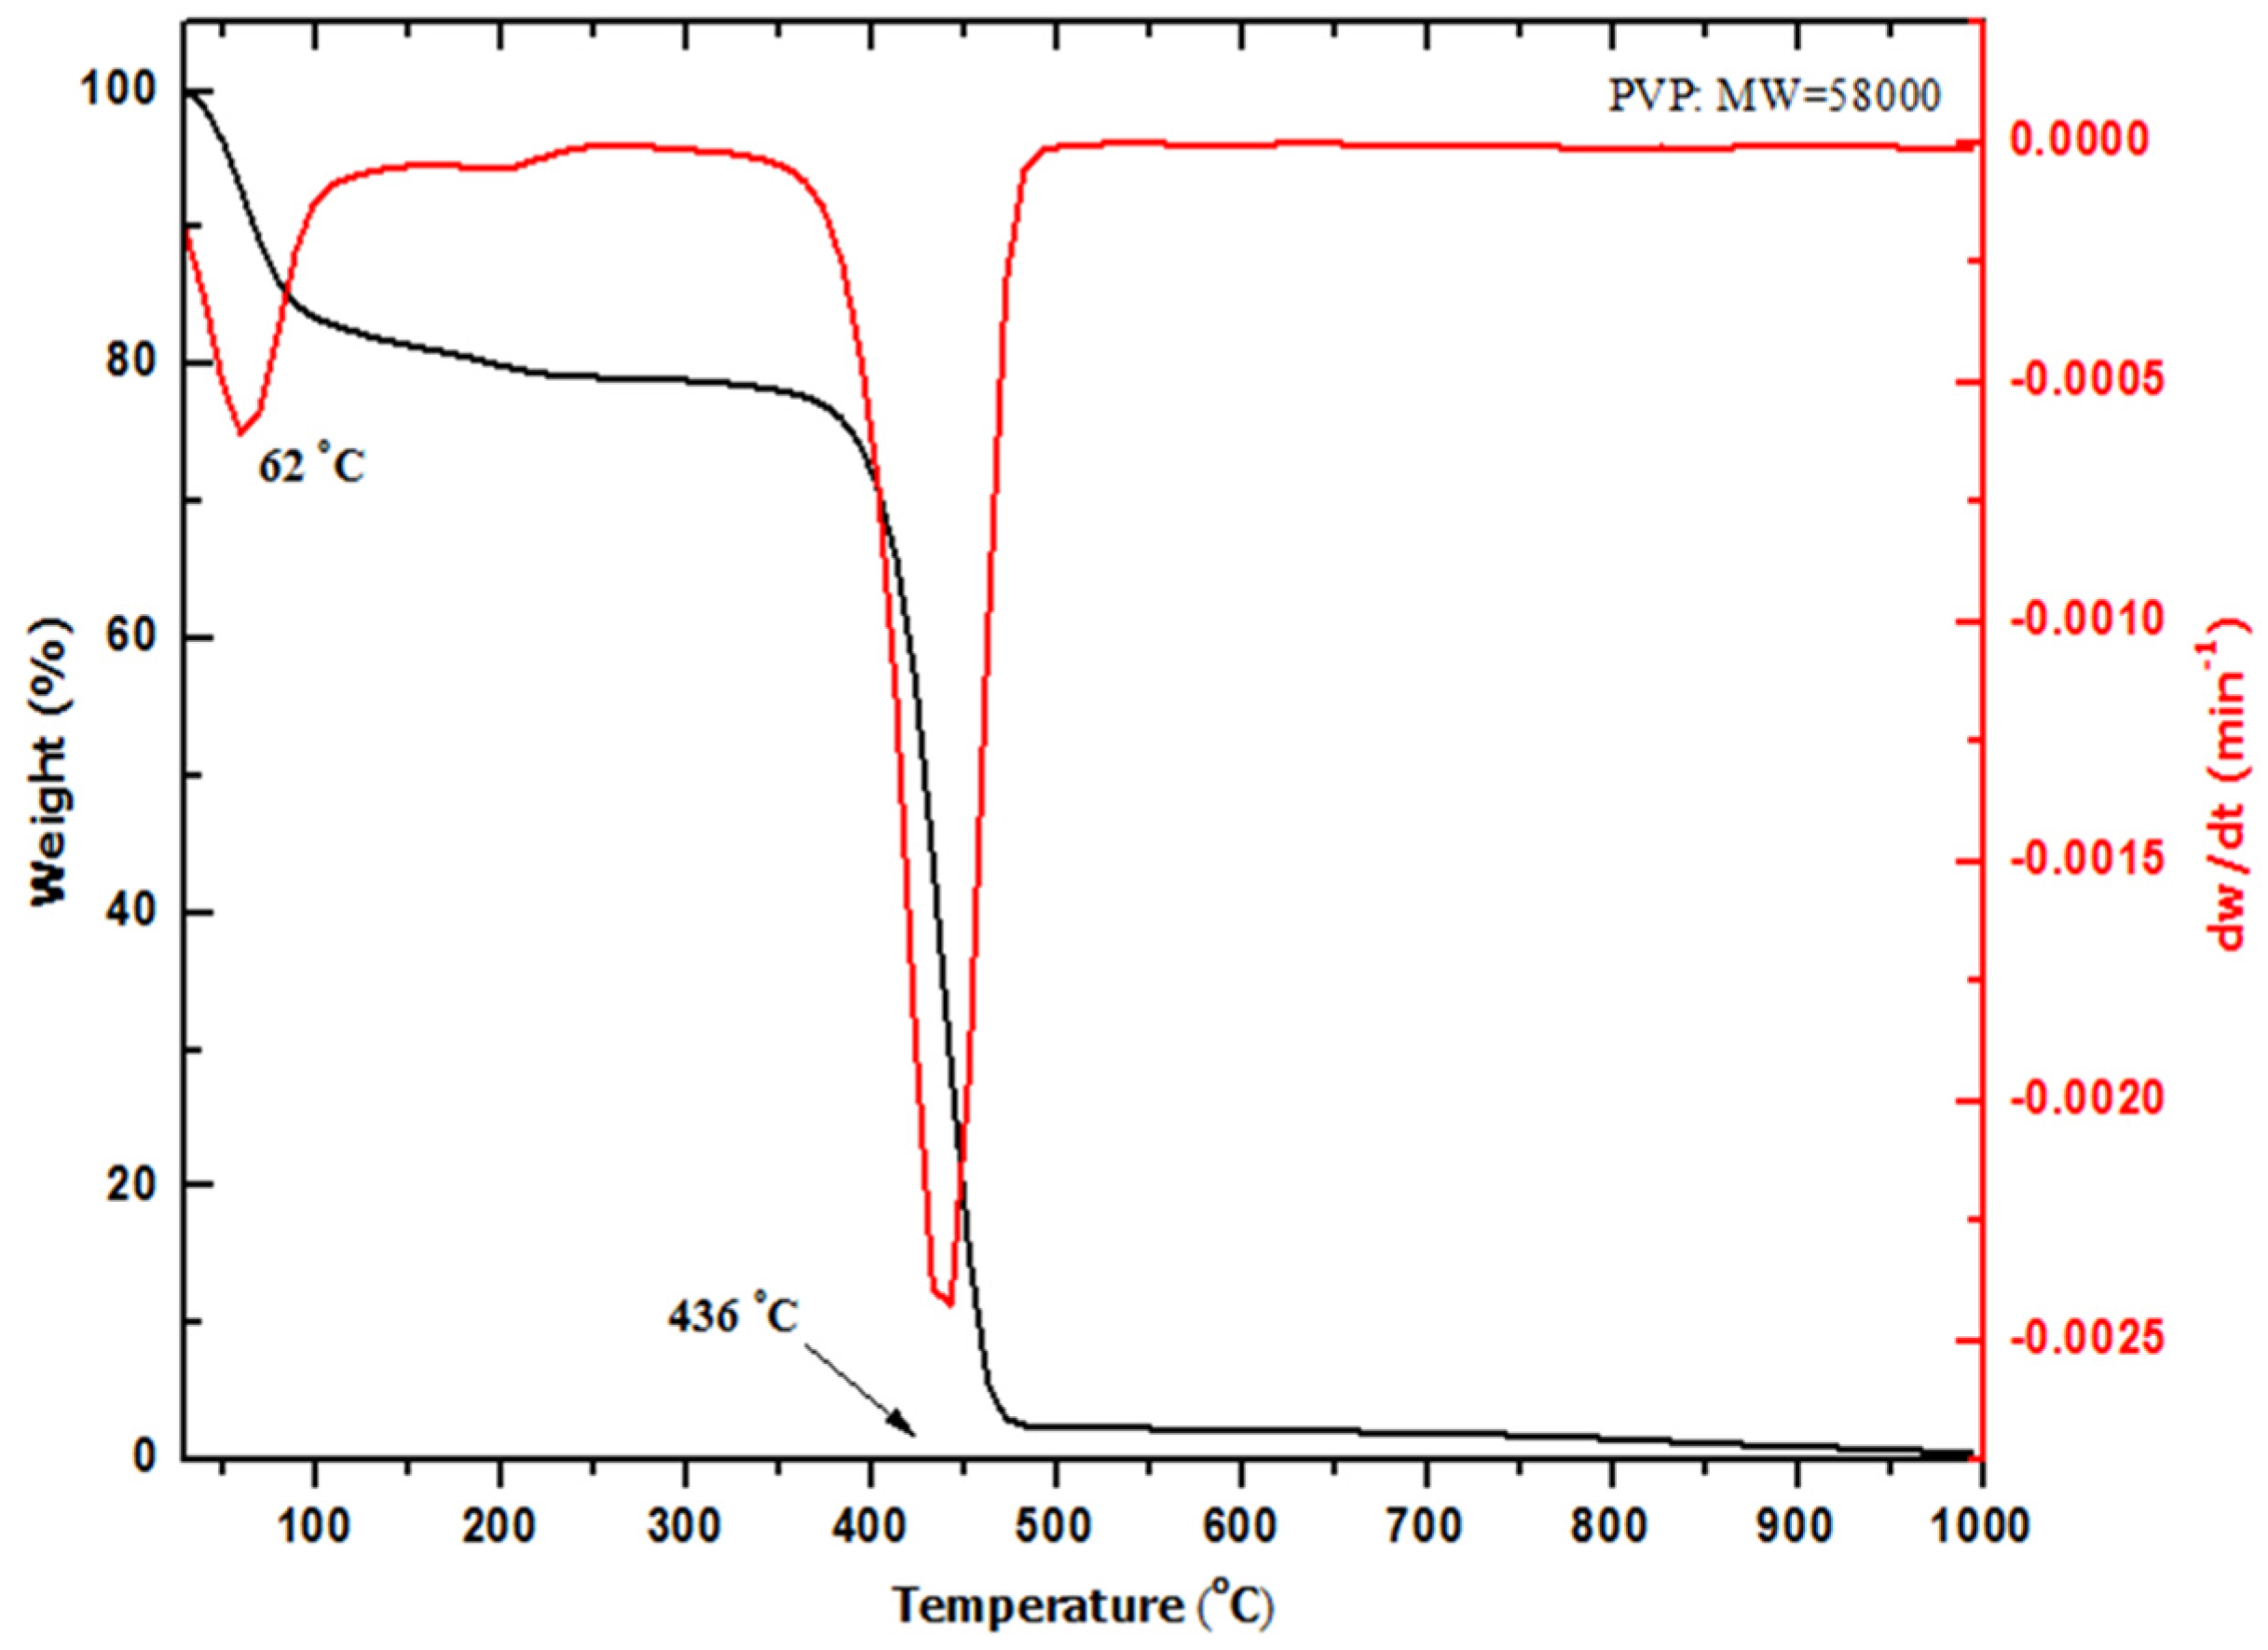
2.2. Thermal Analysis (TGA–DTG)

Thermogravimetric analysis and its derivative (TGA–DTG curves) were established to define the suitable starting temperature of the calcination process with the aim to remove organic matter and obtain the pure nanocrystalline. Figure 1 shows the thermogram of the weight percentage changing as a function of the temperature of PVP. The sample exhibited two-step degradation processes. The first step shows that insignificant weight loss occurred at an initial degradation temperature of 62 °C, which is attributed to the trapped water molecules in the sample, whereas the second step demonstrates that a maximum weight loss occurred at a temperature of 436 °C, which corresponds to an almost complete decomposition of PVP. At 471 °C, the weight loss changes as a function of temperature became insignificant, as most of the PVP content transformed into carbonaceous products [27].

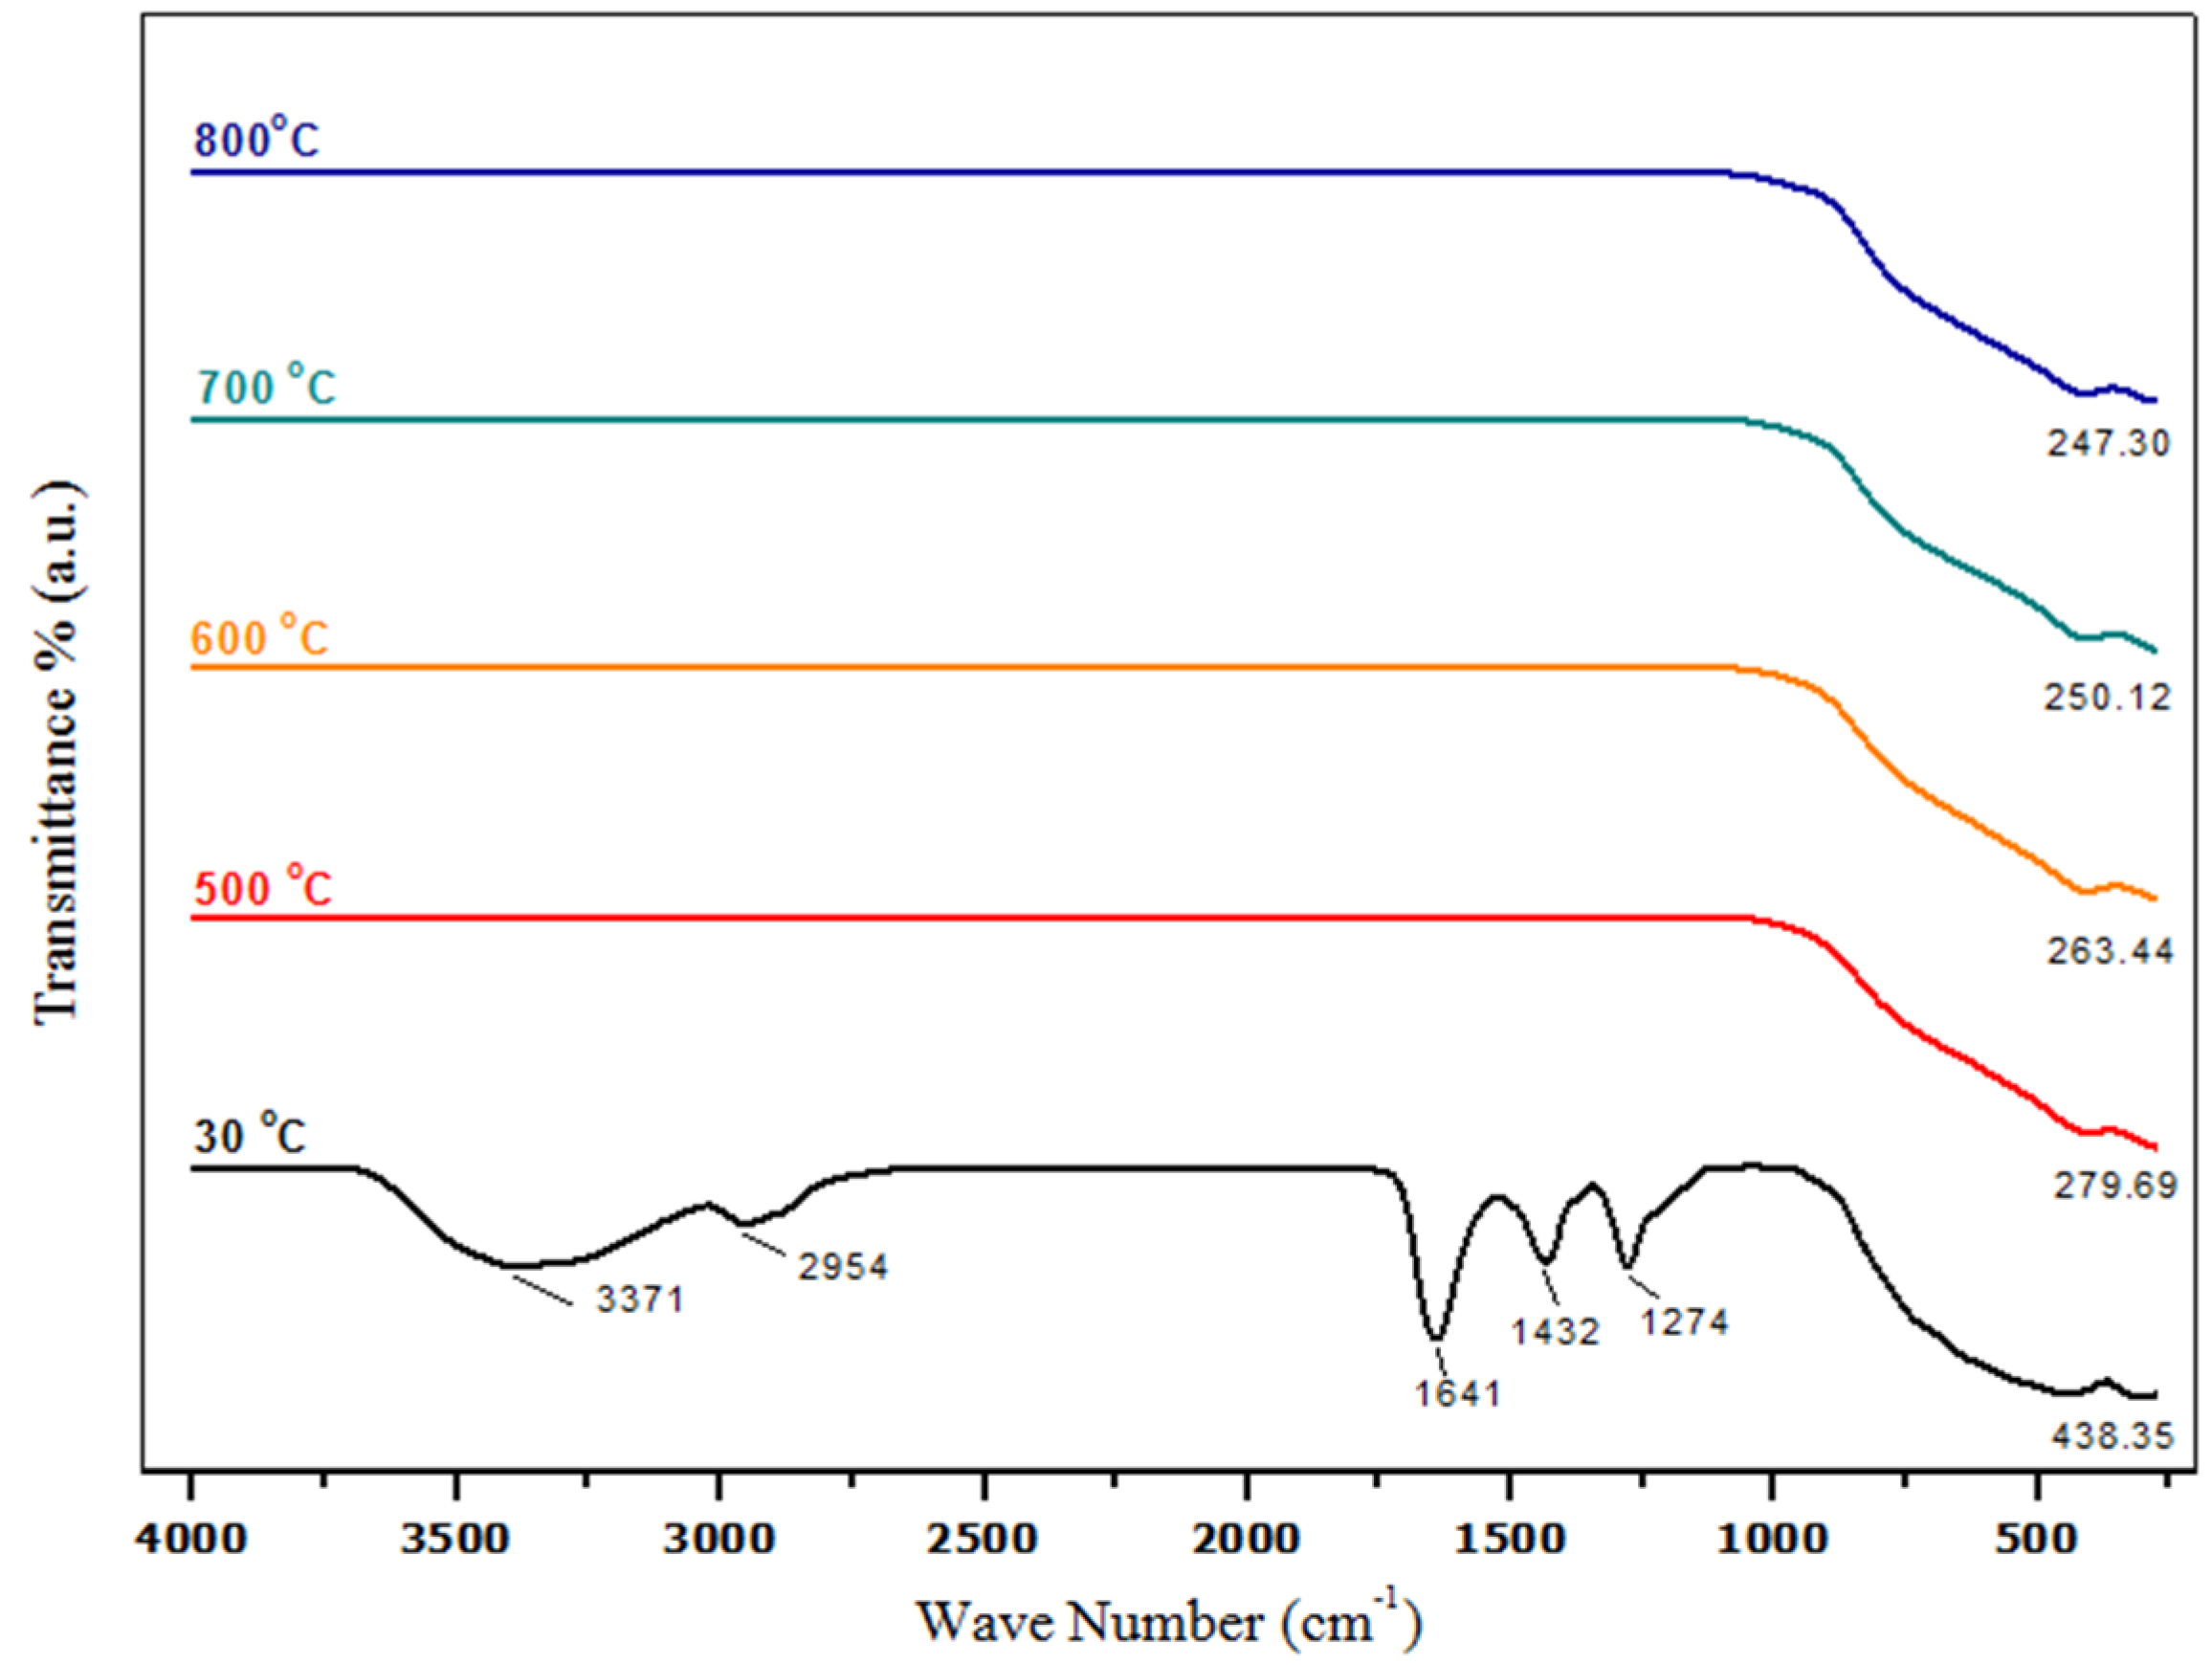
2.3. Phase Composition Analysis (Fourier Transform Infrared Spectroscopy (FT-IR))

FT-IR spectroscopy supports the analysis of multi-component systems to provide information concerning the material’s phase composition and types of interactions existing among various kinds of polymers. In the current study, FT-IR measurement was employed to study the removal of PVP covalent bonds and the ionic bonds formation of TiO2 nanoparticles. The spectra showed the organic and inorganic content of the sample before and after calcination within a wave number range of 280–4000 cm−1 (Figure 2).
Before calcination, at a room temperature of 30 °C, the spectrum reveals all absorption peaks that are credited to PVP, the absorption peaks at wave numbers 3371, 2954, and 1641 cm−1 were assigned to N–H, C–H, and C=O stretching vibrations, respectively. In addition, the absorption peak found at 1432 cm−1 was detected due to the C–H bending vibration originating from the methylene group, while 1274 cm−1 was related to the C–N stretching vibrations [28]. The calcination at 500 °C resulted in the disappearance of broadband absorption peaks that belong to the organic composition of PVP [29,30]. The remaining peak between 800 and 250 cm−1 observed for calcined samples at 500, 600, 700, and 800 °C was assigned to the Ti–O stretching bands, which were attributed to the formation of TiO2 nanoparticles with an anatase structure [31,32].

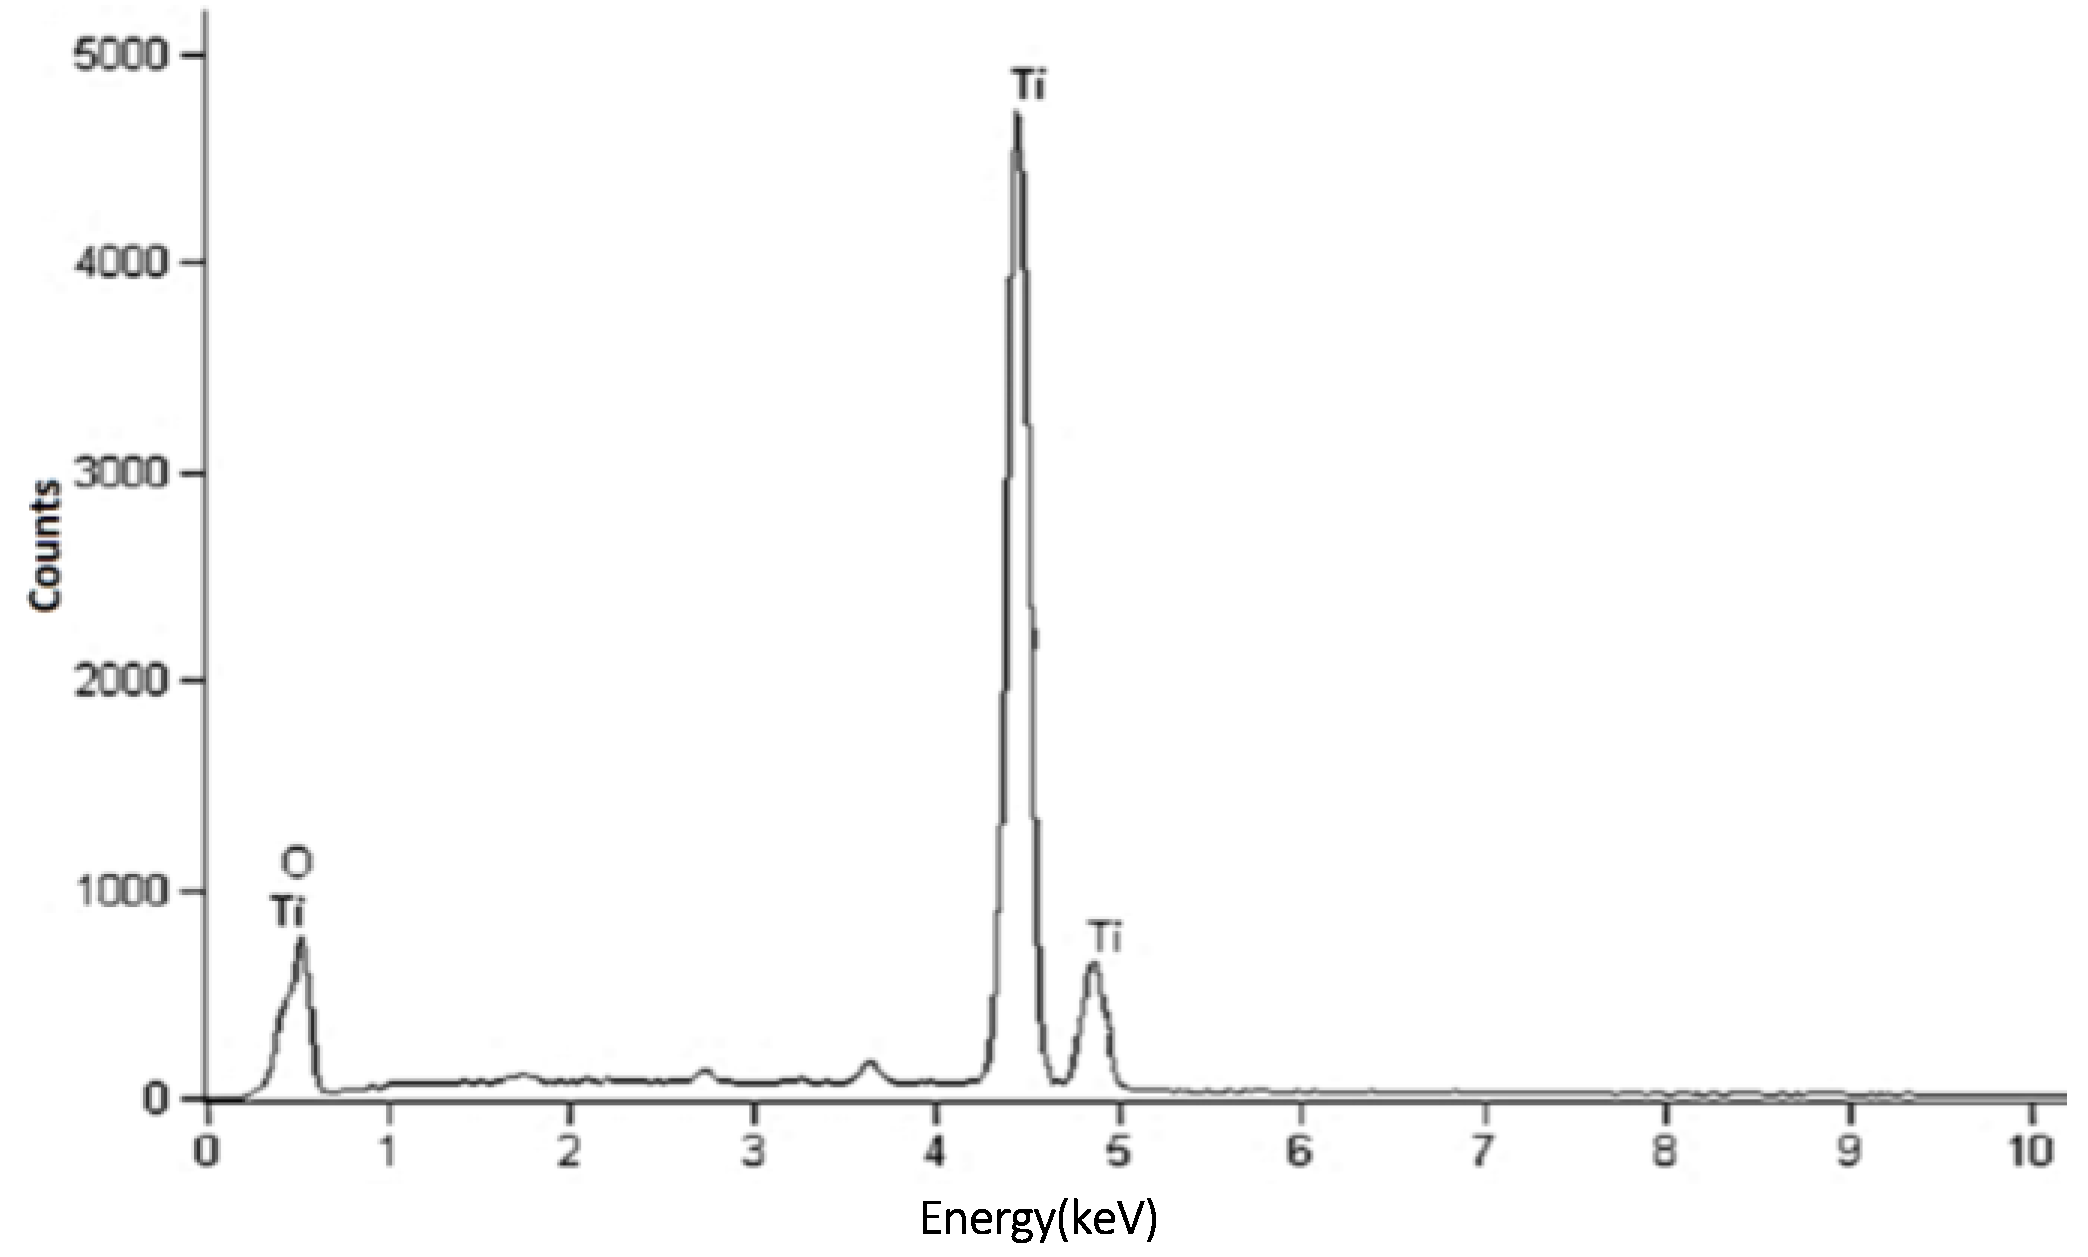
2.4. Elemental Composition Analysis (Energy Dispersive X-ray Spectroscopy (EDX))

The elemental composition of the TiO2 nanoparticles formed by the thermal treatment technique was determined using EDX. The EDX spectrum of TiO2 nanoparticles calcined at 600 °C is illustrated in Figure 3. From the spectrum, it can be seen that the Ti and O elements are clearly presented in the prepared sample by their corresponding peaks. The recorded atomic percentages of Ti and O were approximately 29.13% and 64.57%, respectively. These results indicated that the final product is nearly pure titanium dioxide (TiO2) nanoparticles.

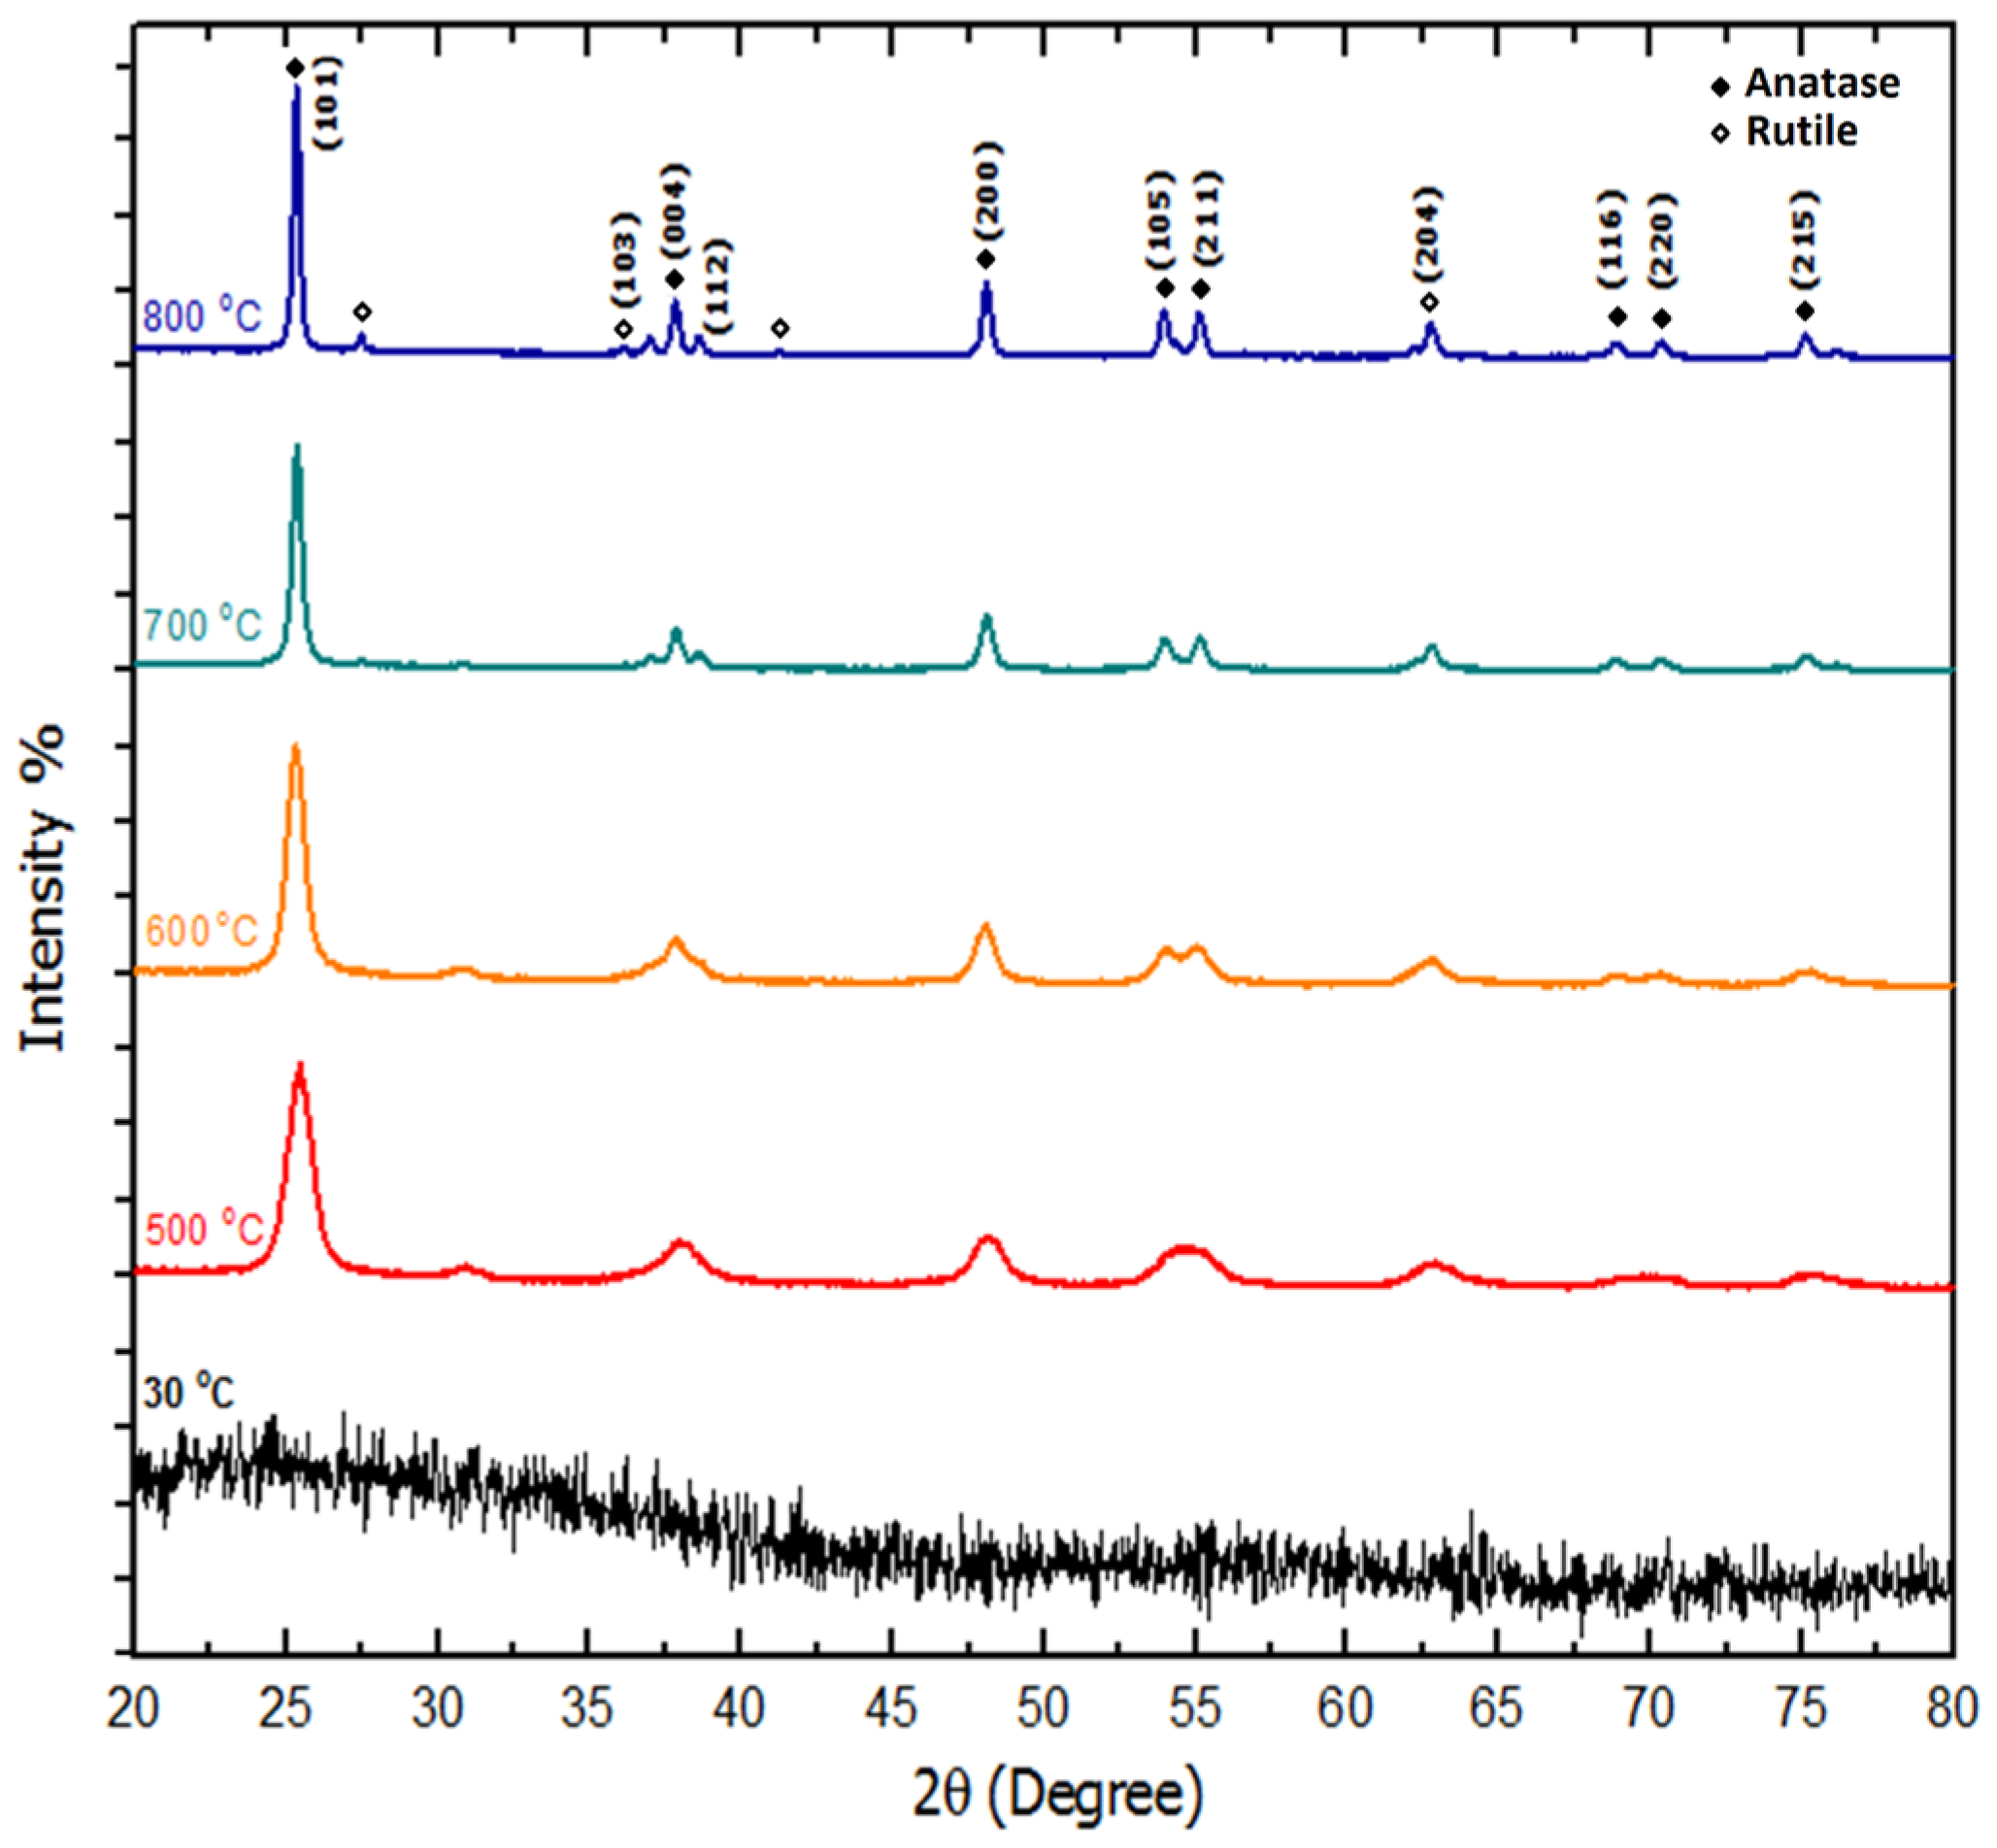
2.5. Structural Analysis (X-ray Diffraction (XRD))

Figure 4 shows characteristic XRD patterns of the samples before and after calcination. A broad spectrum exhibited by the sample before calcination indicates that the dried samples demonstrated an amorphous behavior. For the calcined samples at 500 °C and above, the spectrum shows sharp and narrow diffraction peaks, implying that the formation of crystalline TiO2 nanoparticles was established. Moreover, higher values of calcination temperatures were observed to enhance the degree of crystallinity and the purity of the TiO2 nanoparticles by increasing the intensity of the peaks and removing the undesired small peaks at lower calcination temperatures. This crystallinity enhancement is stemmed from the increment of the crystalline volume-to-surface ratio, as supported by transmission electron microscopy (TEM) images, which occurred due to particle size enlargement. The position of the Bragg’s lines of the TiO2 nanoparticles was used to determine the inter-planer spacing (d), which in turn was used to index the diffraction peaks. The existence of multiple diffraction peaks of (101), (103), (004), (112), (200), (105), (211), (204), (116), (220), and (215) in the diffraction patterns suggests that the TiO2 samples have a typical tetragonal structures, referring to (JCPDS card no. 21-1272) [1,3]. Similar XRD patterns were observed for commercial bicrystalline TiO2/P25, which was supplied by Degussa (80% anatase and 20% rutile) [33]. The co-presence of anatase and rutile crystallites induces a high level of photoactivity; the transfer of photoexcited electrons and the positive holes between interconnecting anatase and rutile particles can enhance charge separation and hence improve the efficiency of the utilization of electron-hole pairs [34].
The samples’ crystallite sizes were found to be in the range of 8–42 nm (Table 1), which were calculated for the most intense peak (101) using the Scherrer’s equation as given below:
D = 0.9 λ β cos θ ,
where D is the crystallite size (nm), β is the full width of the direction line at half of the maximum (101) intensity measured in radians, λ is the X-ray wavelength of Cu Kα = 0.154 nm, and θ is Bragg’s angle.

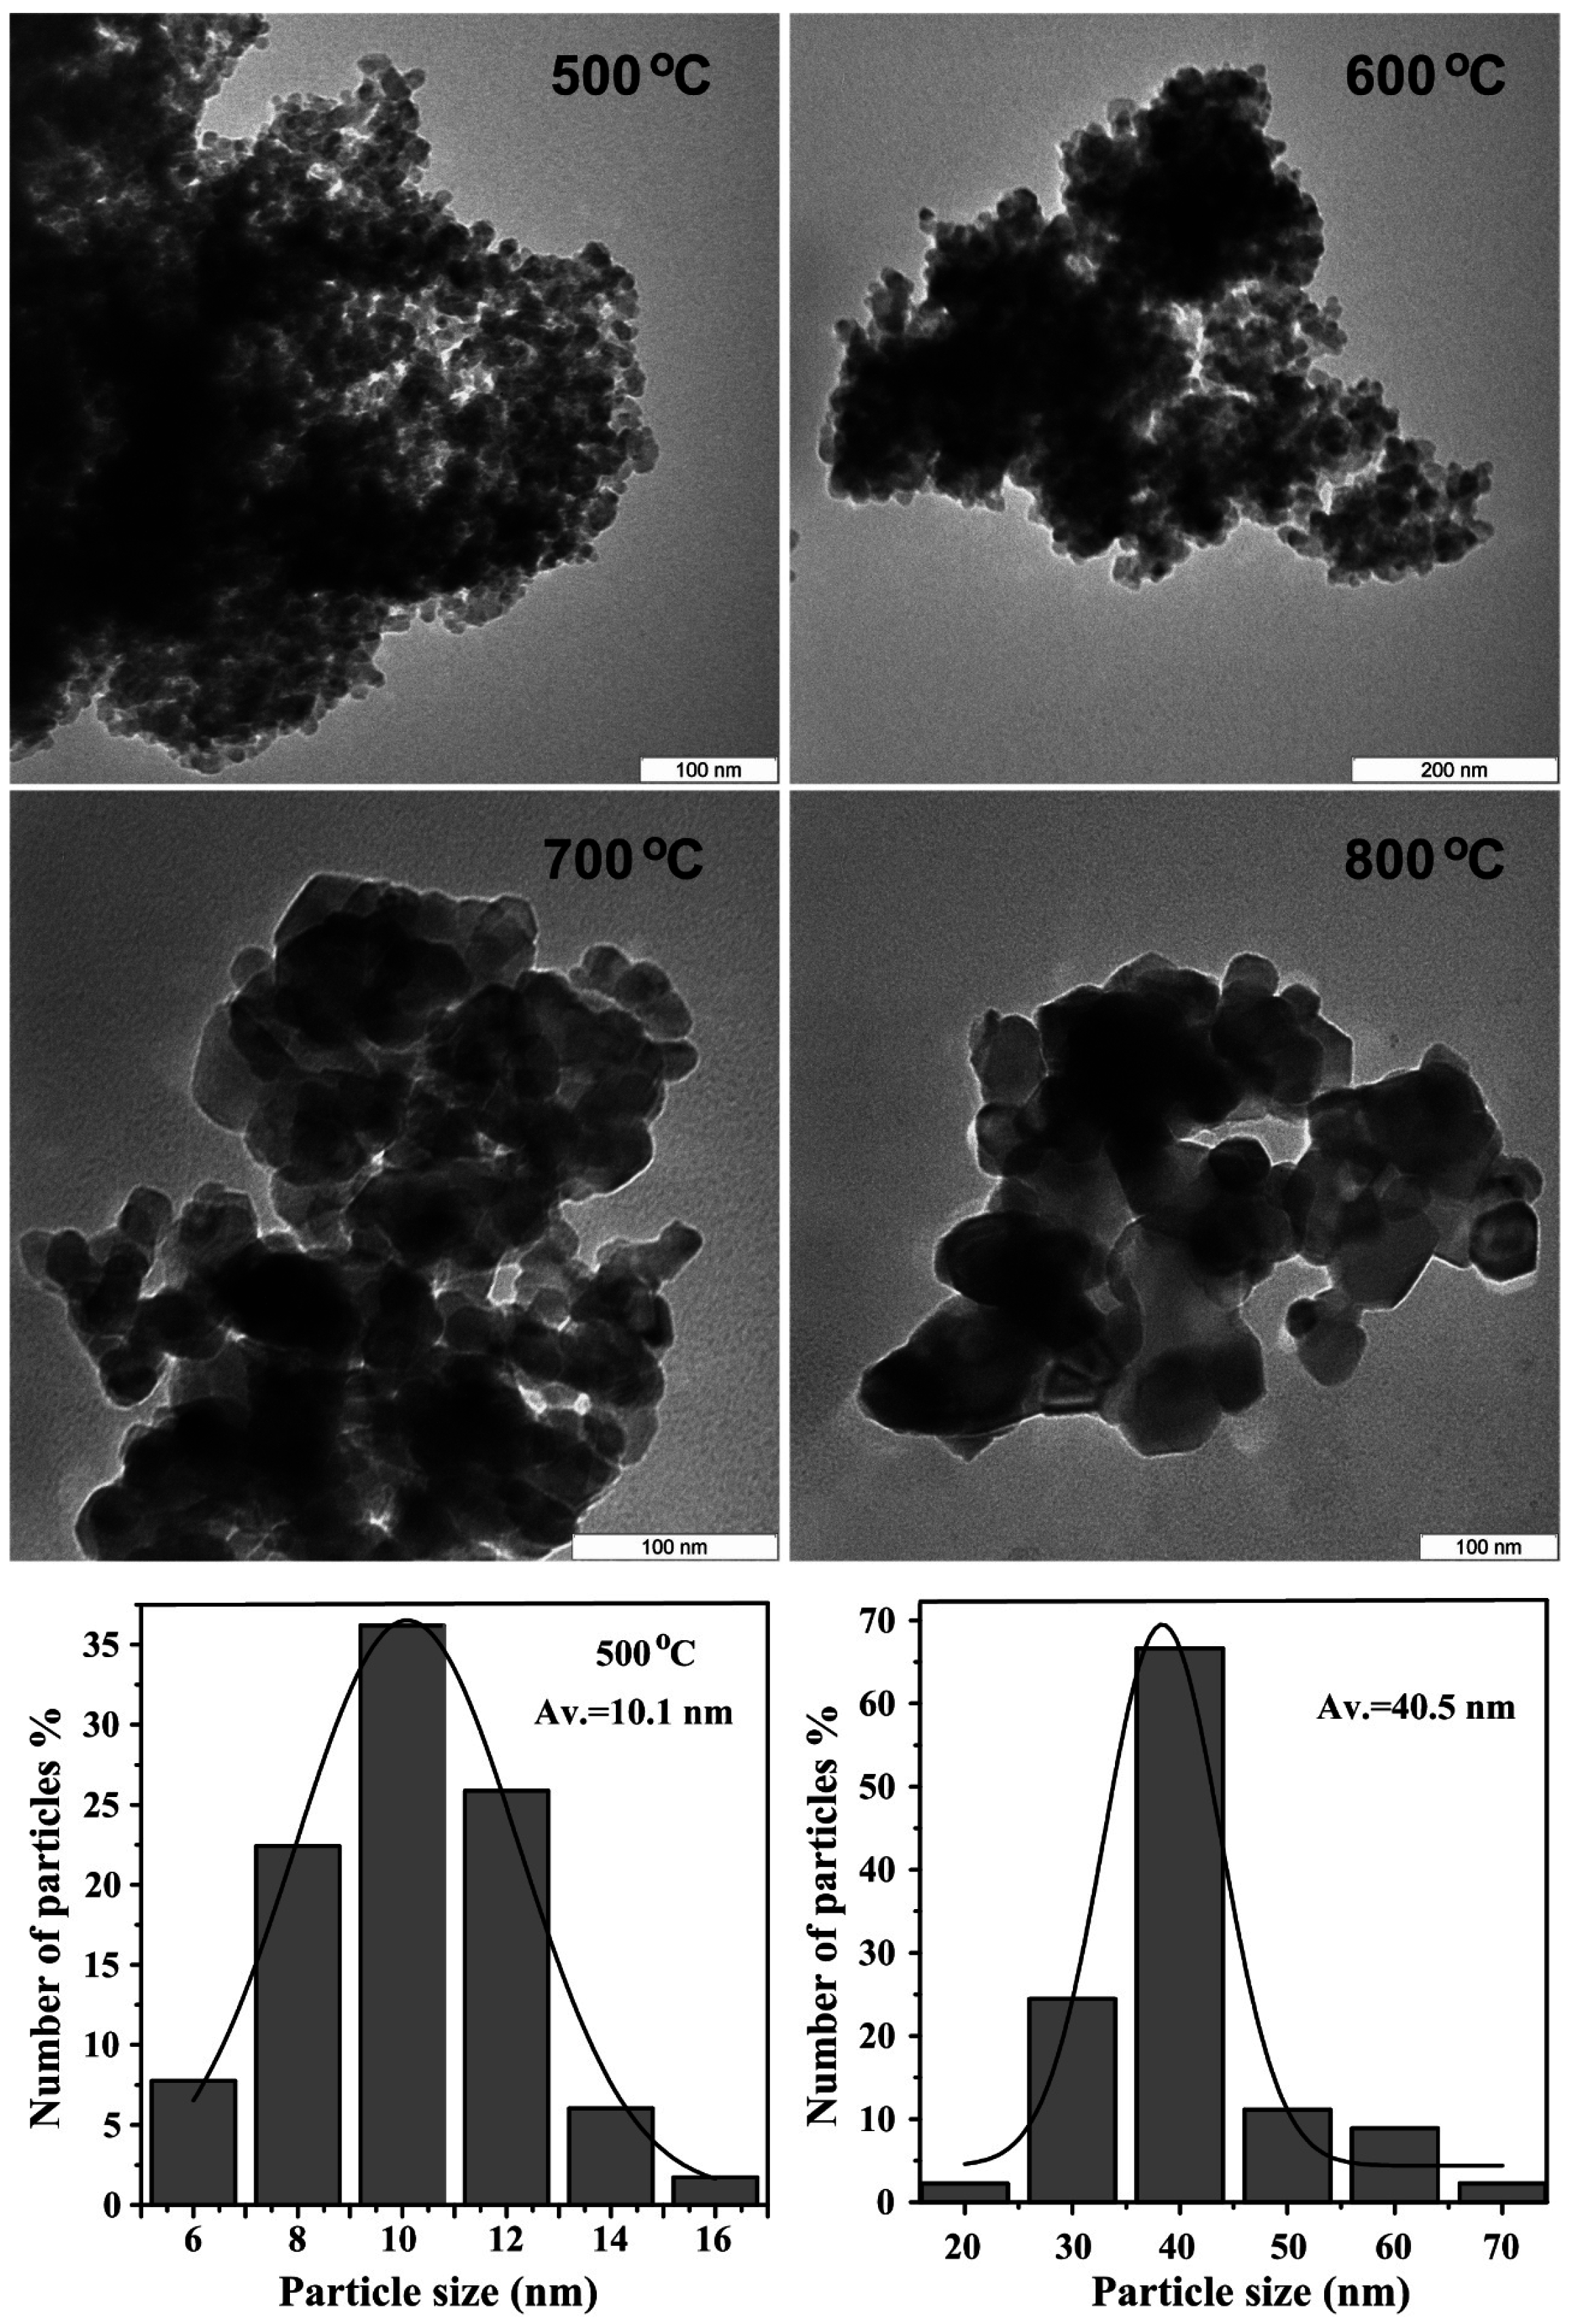
2.6. Morphology and Size Distribution

TEM images were used to demonstrate the morphology, particle size, and particle size distribution of the TiO2 nanoparticles, as shown in Figure 5. The TiO2 samples prepared by the modified thermal treatment method at a lower calcination temperature exhibited uniform morphology with adequate particle size distribution. However, at a high calcination temperature of 800 °C, the TiO2 particles exhibited irregular morphology due to the agglomeration of primary particles consisting of either some single particles or clusters of particles. The average size and size distribution of nanoparticles were determined from TEM images using Image tool software, considering at least 100 particles for each sample. The average particle size is about 10.1 and 40.5 nm at calcination temperatures of 500 and 800 °C, respectively. These results indicate that the attained particle size increased as calcination temperature increased due to the fact that, as the temperature rose, many adjacent particles tended to fuse together to form larger particle sizes by melting their surfaces [35]. The average particle size obtained from TEM images was found to be in a good agreement with the results obtained from the XRD measurements (Table 1) and demonstrate the exponential variation with increasing calcination temperature. Many researchers have already reported the effect of calcination temperature on the crystallite size and specific surface area of TiO2 [36,37]; however, in our case, the regular variation in particle size with calcination temperature offers the advantage of the size-controlled preparation of TiO2 nanoparticles. For instance, to produce a comparable particle size of TiO2 with reference material (TiO2/P25: 21 nm), a calcination temperature of 550 °C is appropriate.

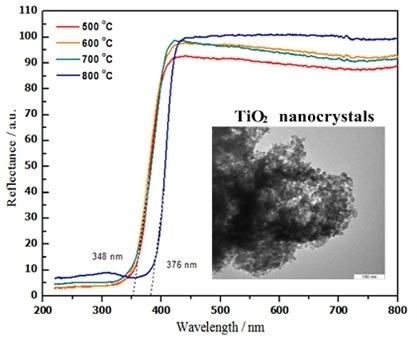
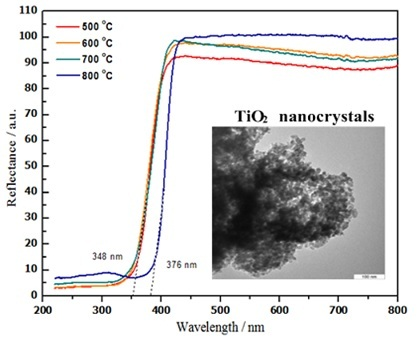
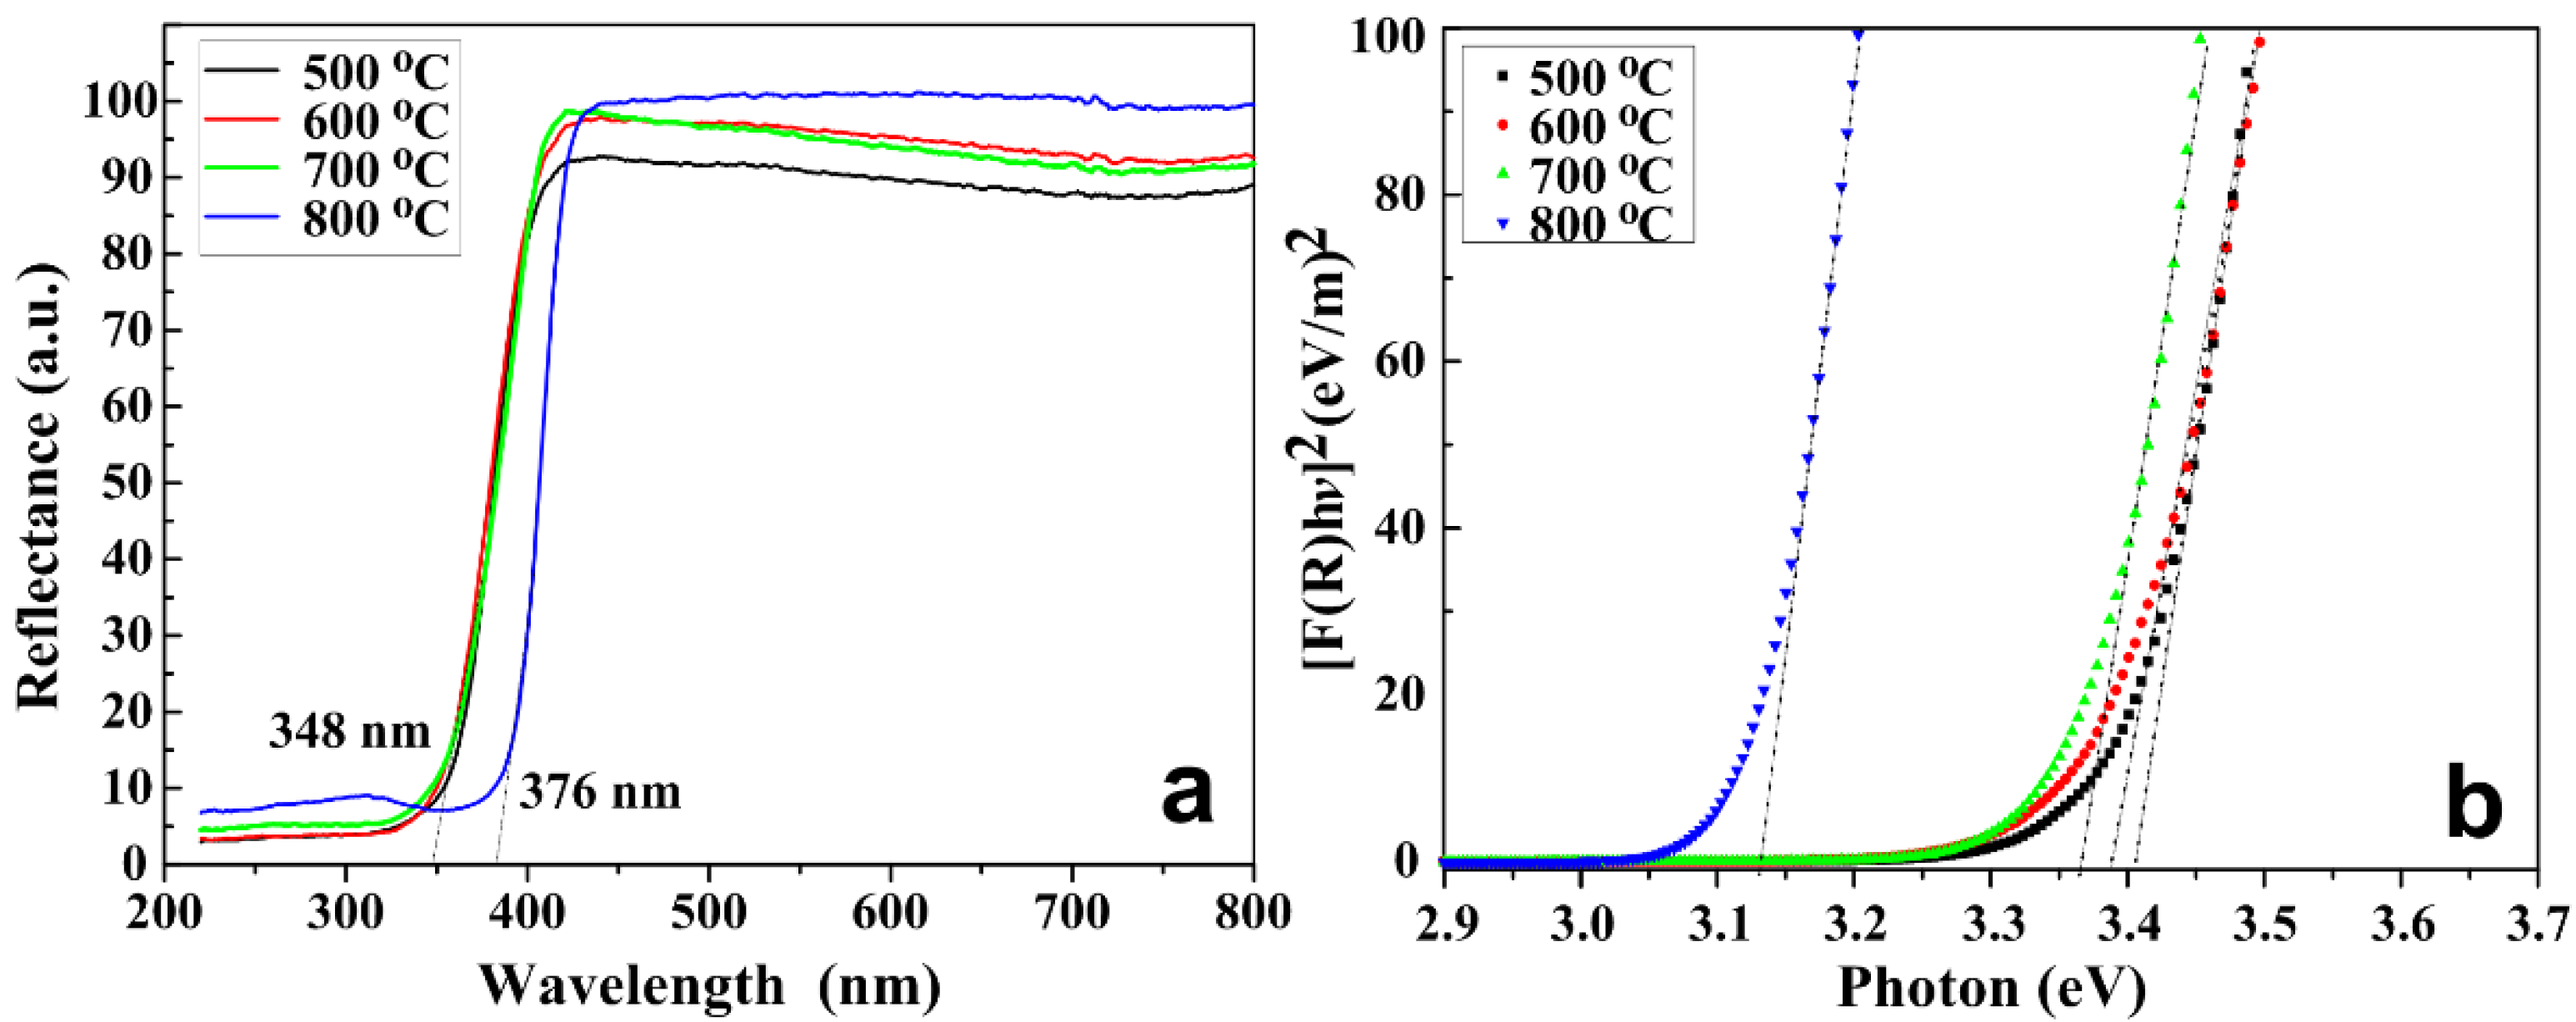
2.7. Optical Properties

Diffuse reflectance spectra are normally determined by a UV-Visible spectrophotometer. In order to investigate the calcination effect on the optical properties of TiO2 nanoparticles, the diffuse reflectance spectra were measured in the range of 200–800 nm at room temperature for all calcined samples, as shown in Figure 6a. The optical band gap values for all samples calcined at different temperatures were determined from reflectance spectra using the Kubelka–Munk equation:
( F ( R ) h υ ) 2 = A ( h υ E g ) ,
where F(R) is the so-called remission parameter or Kubelka–Munk function, hυ is the incident photon energy, A is a constant depending on the transition probability, and the diffuse reflectance R, R is the diffuse reflectance that is obtained from R = Rsample/Rstandard [38,39].
The values of (F(R)hυ)2 versus (hυ) were plotted and are illustrated in Figure 6b. Straight lines were drawn to fit the experimental band gap curves and were extended to intercept the (hυ) axis in order to determine the optical band gap values of the TiO2 nanoparticles at different calcination temperatures. It was found that the titania nanoparticles have a direct optical band gap that underwent a decrement as calcination temperature increased from 3.40 eV at 500 °C to 3.12 eV at 800 °C, as shown in Table 2. A decrease in the energy band gap with increasing calcination temperatures is attributed to the increase in the particle size and crystallinity improvement, according to the XRD and TEM analysis. It is supposed that, as the particle size increases, the number of atoms that form a particle also increase; consequently, the valence and conduction electrons is rendered more attractive to the ion core of the particles, and the band gap width of the particles thus decreases [40].

3. Materials and Methods

3.1. Materials

Polyvinyl pyrrolidone (PVP Mw = 29,000 g/mol) stock obtained from Sigma-Aldrich (Darmstadt, Germany) was used as a capping agent. Titanium(IV) isopropoxide (Mw = 284.22 g/mol) with high purity stock supplied by Sigma-Aldrich (Darmstadt, Germany) was used as a metal precursor, and deionized water was used as a solvent. All chemicals were used without further purification.

3.2. The Synthesis of TiO2 Nanoparticles

The PVP solution was made by dissolving 4 g of PVP powder in 100 mL of deionized water at a temperature of 70 °C, and was magnetically stirred for 2 h. The metal precursor of 0.2 mmol was added to the PVP solution and stirred continuously for another 2 h until a semi-transparent solution with no significant precipitation of materials was obtained. The mixture was directly placed in an alumina crucible for sintering and calcination at different temperatures ranging from 500 to 800 °C in a retaining time of 3 h to decompose the polymer and to crystallize the metal oxide nanoparticles.

3.3. Characterization Techniques

Thermal analysis of the initial solution was investigated via thermogravimetric analysis (TGA) and derivative thermogravimetry analysis (DTG) (PerkinElmer, Waltham, MA, USA), model TGA7/DTA7, in the presence of N2 with a 10 °C/min heating rate from room temperature to 1000 °C to optimize the heat treatment program. FT-IR was used to study the chemical composition of samples using PerkinElmer Spectrum 1650. Energy dispersive X-ray (EDX) measurements were performed under a variable pressure scanning electron microscope (VPSEM, LEO 1455, Carl Zeiss, Germany) with an Oxford INCA EDX 300 microanalysis attachment. The crystal phase of prepared samples was determined via the X-ray diffraction (XRD) technique using a Shimadzu 6000 diffractometer (Lab XRD-6000 SHIMADZU, Kyoto, Japan) utilizing Cu Kα (0.154 nm) radiation. The morphology and average particle size of the nanocrystalline powder were evaluated using a transmission electron microscope (HTACHI H-7100 TEM, Chula Vista, CA, USA) operating at an accelerating voltage of 100 kV. The average size and size distribution of nanoparticles were determined using Image tool software from TEM images. The optical reflectance spectra of samples were recorded using the UV-Vis spectrometer (Shimadz-UV1650PC SHIMADZU, Columbia, MD, USA), and the band gap energy was evaluated from the reflectance spectra using the Kubelka–Munk equation.

4. Conclusions

TiO2 nanoparticles were successfully synthesized via the direct calcination of an aqueous solution containing only titanium isopropoxide as a metal precursor, PVP as a capping agent, and deionized water as a solvent. The calcination has enabled the removal of organic compounds leaving a residue of crystalline TiO2 particles. The average particle size increased from approximately 10 to 41 nm as calcination temperature increased from 500 to 800 °C, respectively. The band gap energy of the TiO2 particles was determined from the reflectance spectra and found to be decreasing from 3.40 eV at 500 °C to 3.12 eV at 800 °C. The thermal treatment method is thus shown to be a simple, low-cost, and uncomplicated apparatus method to synthesize size-controlled TiO2 nanoparticles and could be used for industrial scale fabrication.

Acknowledgments

The authors would like to acknowledge technical support from the staff of the Faculty of Science and the Institute of Bioscience (IBS), Universiti Putra Malaysia. This work was financially supported by the Research Management Center (RMC), Universiti Putra Malaysia.

Author Contributions

Aysar Sabah Keiteb, Elias Saion, and Azmi Zakaria conceived and designed the experiments; Aysar Sabah Keiteb performed the experiments; Aysar Sabah Keiteb, Elias Saion, Nayereh Soltani, and Nura Abdullahi analyzed the data; Aysar Sabah Keiteb, Elias Saion, Azmi Zakaria, and Nura Abdullahi contributed reagents/materials/analysis tools; Aysar Sabah Keiteb, Elias Saion and Nayereh Soltani contributed to the discussion and wrote the paper.

Conflicts of Interest

The authors declare no conflict of interest.

References

  1. Chowdhury, I.H.; Ghosh, S.; Naskar, M.K. Aqueous-based synthesis of mesoporous TiO2 and Ag–TiO2 nanopowders for efficient photodegradation of methylene blue. Ceram. Int. 2016, 42, 2488–2496. [Google Scholar] [CrossRef]
  2. Wang, X.; Li, Y.; Liu, S.; Zhang, L. N-doped TiO2 Nanotubes as an Effective Additive to Improve the Catalytic Capability of Methanol Oxidation for Pt/Graphene Nanocomposites. Nanomaterials 2016, 6, 40. [Google Scholar] [CrossRef]
  3. Kuo, W.K.; Weng, H.P.; Hsu, J.J.; Yu, H.H. Photonic Crystal-Based Sensors for Detecting Alcohol Concentration. Appl. Sci. 2016, 6, 67. [Google Scholar] [CrossRef]
  4. Yang, L.; Luo, S.; Cai, Q.; Yao, S. A review on TiO2 nanotube arrays: Fabrication, properties, and sensing applications. Chin. Sci. Bull. 2009, 55, 331–338. [Google Scholar] [CrossRef]
  5. Diebold, U. The surface science of titanium dioxide. Surf. Sci. Rep. 2003, 48, 53–229. [Google Scholar] [CrossRef]
  6. Fujishima, A.; Rao, T.N.; Tryk, D.A. Titanium dioxide photocatalysis. J. Photochem. Photobiol. C 2000, 1, 1–21. [Google Scholar] [CrossRef]
  7. Carp, O.; Huisman, C.L.; Reller, A. Photoinduced reactivity of titanium dioxide. Prog. Solid State Chem. 2004, 32, 33–177. [Google Scholar] [CrossRef]
  8. Mor, G.K.; Varghese, O.K.; Paulose, M.; Shankar, K.; Grimes, C.A. A review on highly ordered, vertically oriented TiO2 nanotube arrays: Fabrication, material properties, and solar energy applications. Sol. Energy Mater. Sol. Cells 2006, 90, 2011–2075. [Google Scholar] [CrossRef]
  9. Chen, X.; Mao, S.S. Titanium dioxide nanomaterials: Synthesis, properties, modifications, and applications. Chem. Rev. 2007, 107, 2891–2959. [Google Scholar] [CrossRef] [PubMed]
  10. Thompson, T.L.; Yates, J.T. Surface science studies of the photoactivation of TiO2 new photochemical processes. Chem. Rev. 2006, 106, 4428–4453. [Google Scholar] [CrossRef] [PubMed]
  11. Linsebigler, A.L.; Lu, G.; Yates, J.T., Jr. Photocatalysis on TiO2 surfaces: Principles, mechanisms, and selected results. Chem. Rev. 1995, 95, 735–758. [Google Scholar] [CrossRef]
  12. Wisitsoraat, A.; Tuantranont, A.; Comini, E.; Sberveglieri, G.; Wlodarski, W. Characterization of n-type and p-type semiconductor gas sensors based on NiOx doped TiO2 thin films. Thin Solid Films 2009, 517, 2775–2780. [Google Scholar] [CrossRef]
  13. Wunderlich, W.; Oekermann, T.; Miao, L.; Hue, N.T.; Tanemura, S.; Tanemura, M. Electronic properties of nano-porous TiO2- and ZnO thin films- comparison of simulations and experiments. J. Ceram. Process. Res. 2004, 5, 343–354. [Google Scholar]
  14. Praveen, P.; Viruthagiri, G.; Mugundan, S.; Shanmugam, N. Structural, optical and morphological analyses of pristine titanium di-oxide nanoparticles–Synthesized via sol–gel route. Spectrochim. Acta. A 2014, 117, 622–629. [Google Scholar] [CrossRef] [PubMed]
  15. Nolan, N.T.; Seery, M.K.; Pillai, S.C. Spectroscopic Investigation of the Anatase-to-Rutile Transformation of Sol−Gel-Synthesized TiO2 Photocatalysts. J. Phys. Chem. C 2009, 113, 16151–16157. [Google Scholar] [CrossRef]
  16. Hu, Y.; Tsai, H.-L.; Huang, C.-L. Effect of brookite phase on the anatase–rutile transition in titania nanoparticles. J. Eur. Ceram. Soc. 2003, 23, 691–696. [Google Scholar] [CrossRef]
  17. Zhang, Q.; Gao, L. Preparation of oxide nanocrystals with tunable morphologies by the moderate hydrothermal method: Insights from rutile TiO2. Langmuir 2003, 19, 967–971. [Google Scholar] [CrossRef]
  18. Vu, T.H.T.; Au, H.T.; Tran, L.T.; Nguyen, T.M.T.; Tran, T.T.T.; Pham, M.T.; Do, M.H.; Nguyen, D.L. Synthesis of titanium dioxide nanotubes via one-step dynamic hydrothermal process. J. Mater. Sci. 2014, 49, 5617–5625. [Google Scholar] [CrossRef]
  19. Wu, J.-J.; Yu, C.-C. Aligned TiO2 nanorods and nanowalls. J. Phys. Chem. B 2004, 108, 3377–3379. [Google Scholar] [CrossRef]
  20. Wu, J.-M.; Shih, H.C.; Wu, W.-T.; Tseng, Y.-K.; Chen, I.-C. Thermal evaporation growth and the luminescence property of TiO2 nanowires. J. Cryst. Growth 2005, 281, 384–390. [Google Scholar] [CrossRef]
  21. Wu, J.-M.; Shih, H.C.; Wu, W.-T. Electron field emission from single crystalline TiO2 nanowires prepared by thermal evaporation. Chem. Phys. Lett. 2005, 413, 490–494. [Google Scholar] [CrossRef]
  22. Acayanka, E.; Djowe, A.T.; Laminsi, S.; Tchoumkwe, C.; Nzali, S.; Mbouopda, A.P.; Ndifon, P.; Gaigneaux, E.M. Plasma-assisted synthesis of TiO2 nanorods by gliding arc discharge processing at atmospheric pressure for photocatalytic applications. Plasma Chem. Plasma Process. 2013, 33, 725–735. [Google Scholar] [CrossRef]
  23. Gressel-Michel, E.; Chaumont, D.; Stuerga, D. From a microwave flash-synthesized TiO2 colloidal suspension to TiO2 thin films. J. Colloid Interface Sci. 2005, 285, 674–679. [Google Scholar] [CrossRef] [PubMed]
  24. Hong, S.-S.; Lee, M.S.; Park, S.S.; Lee, G.-D. Synthesis of nanosized TiO2/SiO2 particles in the microemulsion and their photocatalytic activity on the decomposition of p-nitrophenol. Catal. Today 2003, 87, 99–105. [Google Scholar] [CrossRef]
  25. Laranjo, M.T.; Ricardi, N.C.; Arenas, L.T.; Benvenutti, E.V.; de Oliveira, M.C.; Santos, M.J.L.; Costa, T.M.H. TiO2 and TiO2/SiO2 nanoparticles obtained by sol–gel method and applied on dye sensitized solar cells. J. Sol.-Gel Sci. Technol. 2014, 72, 273–281. [Google Scholar] [CrossRef]
  26. Bakar, S.A.; Soltani, N.; Yunus, W.M.M.; Saion, E.; Bahrami, A. Structural and paramagnetic behavior of spinel NiCr2O4 nanoparticles synthesized by thermal treatment method: Effect of calcination temperature. Solid State. Commun. 2014, 192, 15–19. [Google Scholar] [CrossRef]
  27. Naseri, M.G.; Saion, E.B.; Ahangar, H.A.; Shaari, A.H. Fabrication, characterization, and magnetic properties of copper ferrite nanoparticles prepared by a simple, thermal-treatment method. Mater. Res. Bull. 2013, 48, 1439–1446. [Google Scholar] [CrossRef]
  28. Giri, N.; Natarajan, R.; Gunasekaran, S.; Shreemathi, S. 13C-NMR and FTIR spectroscopic study of blend behavior of PVP and nano silver particles. Arch. Appl. Sci. Res. 2011, 3, 624–630. [Google Scholar]
  29. Soltani, N.; Dehzangi, A.; Kharazmi, A.; Saion, E.; Yunus, W.M.M.; Majlis, B.Y.; Zare, M.R.; Gharibshahi, E.; Khalilzadeh, N. Structural, optical and electrical properties of ZnS nanoparticles affecting by organic coating. Chalcogenide Lett. 2014, 11, 79–90. [Google Scholar]
  30. Goodarz Naseri, M.; Saion, E.B.; Kamali, A. An overview on nanocrystalline ZnFe2O4, MnFe2O4, and CoFe2O4 synthesized by a thermal treatment method. ISRN Nanotechnol. 2012, 2012. [Google Scholar] [CrossRef]
  31. Ba-Abbad, M.M.; Kadhum, A.A.H.; Mohamad, A.B.; Takriff, M.S.; Sopian, K. Synthesis and catalytic activity of TiO2 nanoparticles for photochemical oxidation of concentrated chlorophenols under direct solar radiation. Int. J. Electrochem. Sci. 2012, 7, 4871–4888. [Google Scholar]
  32. Thangavelu, K.; Annamalai, R.; Arulnandhi, D. Preparation and characterization of nanosized TiO2 powder by sol–gel precipitation route. Int. J. Emerg. Technol. Adv. Eng. 2013, 3, 636–639. [Google Scholar]
  33. White, L.; Koo, Y.; Yun, Y.; Sankar, J. TiO2 deposition on AZ31 magnesium alloy using plasma electrolytic oxidation. J. Nanomater. 2013, 2013, 280–289. [Google Scholar] [CrossRef]
  34. Ohtani, B.; Prieto-Mahaney, O.; Li, D.; Abe, R. What is Degussa (Evonik) P25? Crystalline composition analysis, reconstruction from isolated pure particles and photocatalytic activity test. J. Photochem. Photobiol. A 2010, 216, 179–182. [Google Scholar] [CrossRef]
  35. Gene, S.A.; Saion, E.; Shaari, A.H.; Kamaruddin, M.A.; Al-Hada, N.M.; Kharazmi, A. Structural, optical, and magnetic characterization of spinel zinc chromite nanocrystallines synthesised by thermal treatment method. J. Nanomater. 2014, 2014, 177–186. [Google Scholar] [CrossRef]
  36. Kominami, H.; Kohno, M.; Takada, Y.; Inoue, M.; Inui, T.; Kera, Y. Hydrolysis of titanium alkoxide in organic solvent at high temperatures: A new synthetic method for nanosized, thermally stable titanium(IV) oxide. Ind. Eng. Chem. Res. 1999, 38, 3925–3931. [Google Scholar] [CrossRef]
  37. Yu, J.G.; Yu, H.G.; Cheng, B.; Zhao, X.J.; Yu, J.C.; Ho, W.K. The effect of calcination temperature on the surface microstructure and photocatalytic activity of TiO2 thin films prepared by liquid phase deposition. J. Phys. Chem. B 2003, 107, 13871–13879. [Google Scholar] [CrossRef]
  38. Ananth, S.; Arumanayagam, T.; Vivek, P.; Murugakoothan, P. Direct synthesis of natural dye mixed titanium dioxide nano particles by sol–gel method for dye sensitized solar cell applications. Opt. J. Light Electron Opt. 2014, 125, 495–498. [Google Scholar] [CrossRef]
  39. Torrent, J.; Barrón, V. Diffuse reflectance spectroscopy of iron oxides. In Encyclopedia of Surface and Colloid Science; Taylor and Francis: New York, NY, USA, 2006; pp. 1438–1446. [Google Scholar]
  40. Lee, P.J.; Saion, E.; Al-Hada, N.M.; Soltani, N. A Simple Up-Scalable Thermal Treatment Method for Synthesis of ZnO Nanoparticles. Metals 2015, 5, 2383–2392. [Google Scholar] [CrossRef]
Figure 1. Thermogravimetric (TG) and thermogravimetric derivative (DTG) curves for polyvinyl pyrrolidone (PVP) at a heating rate of 10 °C/min.
Applsci 06 00295 g001
Figure 2. Infrared (IR) spectra of PVP and titanium dioxide (TiO2) nanoparticles before and after calcination with different temperatures in the range of 280–4500 cm−1.
Applsci 06 00295 g002
Figure 3. Energy dispersive X-ray spectroscopy (EDX) spectrum of TiO2 nanoparticles calcined at temperature of 600 °C.
Applsci 06 00295 g003
Figure 4. X-ray diffraction (XRD) pattern of TiO2 nanoparticles with various calcination temperatures.
Applsci 06 00295 g004
Figure 5. Transmission electron microscopy (TEM) images of TiO2 nanoparticles at different calcination temperatures and the size distribution histogram for samples calcined at 500 and 800 °C, respectively.
Applsci 06 00295 g005
Figure 6. (a) UV-Vis reflectance spectrum of TiO2 nanoparticles; (b) plot of the square of the Kubelka–Munk function vs. photon energy for calcined samples at different temperatures.
Applsci 06 00295 g006
Table 1. The calculated crystallite sizes and particle size of TiO2 corresponding to different calcination temperatures.
Temp. (°C)2θ°Crystallite Size from XRD (±0.3 nm)Particle Size from TEM (±0.1 nm)
50025.4368.410.1
60025.35228.431.3
70025.30036.738.0
80025.24142.940.5
Table 2. The calculated band gap of synthesized TiO2 at different calcination temperatures.
Temperature (°C)Particle Size (±0.1 nm)Eg (±0.01 eV)
50010.13.40
60031.33.38
70038.03.36
80040.53.12

