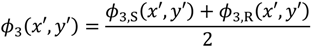
2. Principle of Volume Retardagraphy
In retardagraphy for phase data page recording, the phase of a polarization component is modulated by using a spatial variable retarder such as a parallel-aligned liquid-crystal spatial light modulator (SLM). When the SLM modulates the phase of
p-polarization component,
p- and
s-polarization components become signal
US and reference
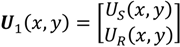
UR, respectively. The vectorial complex amplitude of a recording beam is represented by
where upper and lower components express
p- and
s-polarization components. The
p- and
s-polarization components can be converted into right- and left-circular polarization components using a quarter-wave plate (QWP) with the fast axis of 45° as follows:
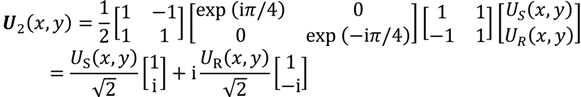
It is assumed that the vectorial complex amplitude
U2 is located at an image plane 1 as shown in
Figure 1.
Figure 1.
Schematic of optical system of volume retardagraphy. FTL is Fourier transform lens. (x, y) and (x', y') are coordinates at image planes and a plane between FTL1 and FTL2, respectively.
Figure 1.
Schematic of optical system of volume retardagraphy. FTL is Fourier transform lens. (x, y) and (x', y') are coordinates at image planes and a plane between FTL1 and FTL2, respectively.
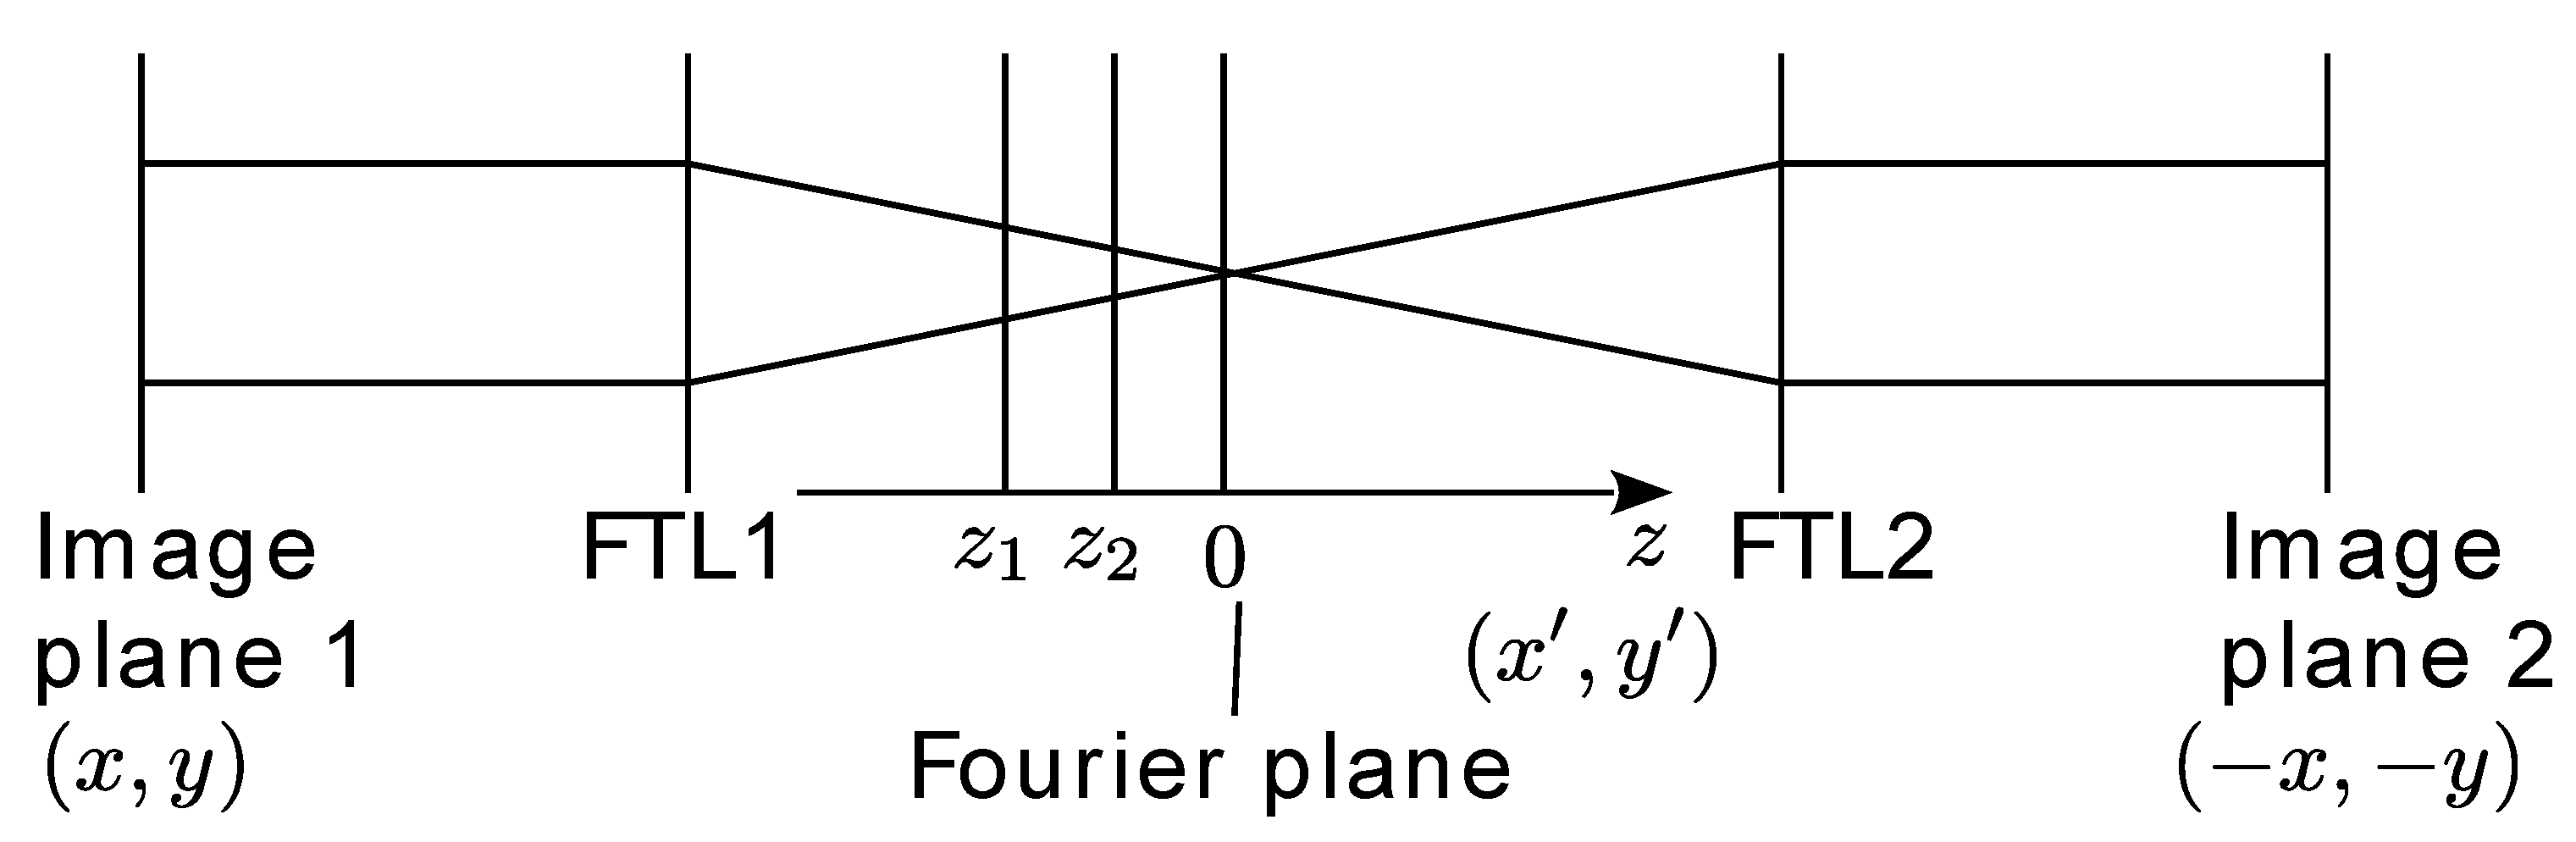
For multiplex recording, selectivity among different data pages is necessary. In this study, shift multiplex recording with a spherical wave is investigated. Therefore, the recording beam must be focused by a lens. Here, the vectorial complex amplitude after the Fourier transform lens (FTL1) is denoted to
U3.
U3 is expressed using arbitrary amplitudes
A(3,S) and
A(3,R), and arbitrary phases
ϕ(3,S) and
ϕ(3,R) by
where
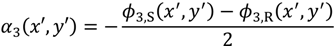
In general, a polarization-sensitive material exhibits sensitivity for polarization azimuth. When, a polarized beam is illuminated, birefringence is induced in the material. Then, the principal axis of the birefringence and retardance are corresponding to the polarization azimuth and long- and short-axis intensities of elliptical polarization. The polarization azimuth is expressed by Equation 5, and the long- and short-axis intensities
I1 and
I2 are expressed by
Then, two phase holograms corresponding to long- and short-axis of the elliptical polarization are recorded as
where
γ∥ and
γ⊥ are coefficients for the relationship between intensity and phase retardance. Then, the polarization hologram is expressed by
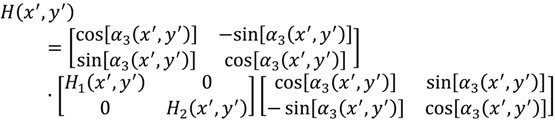
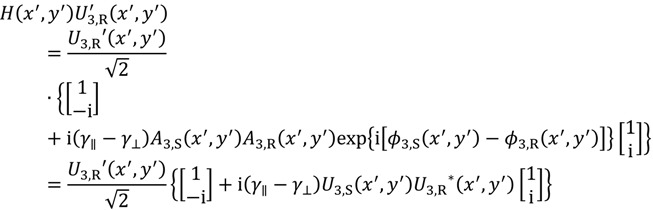
When the polarization hologram is illuminated using a illumination beam
U(3,R)', the vectorial amplitude of the transmitted beam is expressed by
where
When (
γ∥ +
γ⊥)
I(
x',
y')⁄2 and (
γ∥ -
γ⊥)Δ
I(
x',
y')⁄2 are enough small, Equation 11 can be approximately rewritten as
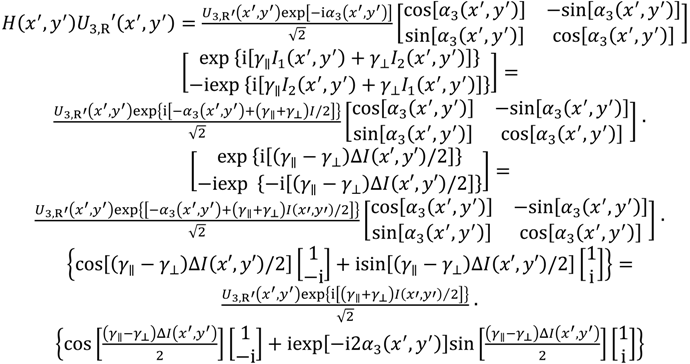
The first and the second terms of Equation 14 are the zero-order beam with left-circular polarization and the first-order diffracted beam with right-circular polarization, respectively. The reconstructed signal is included in the first-order diffracted beam. The reconstructed signal beam is expressed by
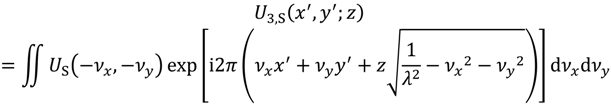
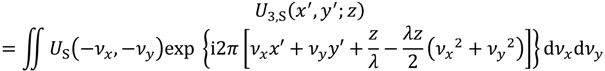
where Γ is a coefficient dependent on the sensitivity of recording material and exposure time. At the Fourier plane,
U3,S is Fourier transform pattern of
US and represented by
where
Here,
γ and
f are wavelength of recording laser and focal length of FTL1, respectively. Equation 16 can be rewritten as
where
Equation 19 shows plane wave expansion of the complex amplitude of signal beam at Fourier plane. Therefore,
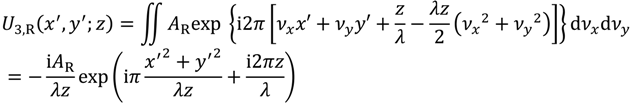
U3,S at arbitrary position is expressed by
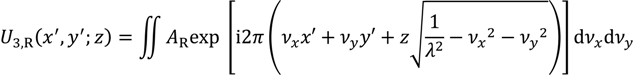
In the case of
UR =
AR,
U3,S is similarly expressed by
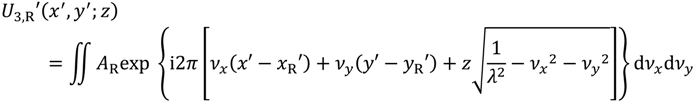
In this study, it is considered that the position of an illumination beam is shifted by (
xR',
yR'). Then,
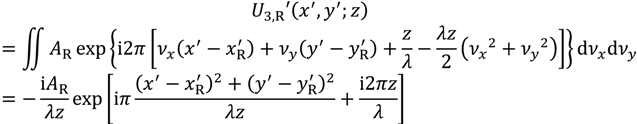
U3,R' is expressed by
In the case of |
νx|,|
νy|≪ 1⁄
λ, that is, |
x|,|y| ≪
f,
U3,S,
U3,R, and
U3,R' are approximated as
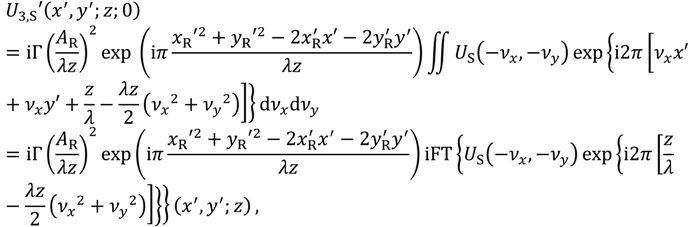
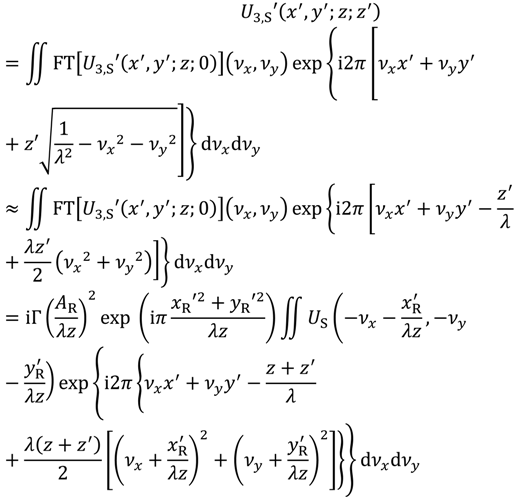
The complex amplitude of the reconstructed signal beam generated from a plane
z is expressed by
where iFT denotes inverse Fourier transform. When the reconstructed signal beam is propagated by
z', the complex amplitude is expressed by
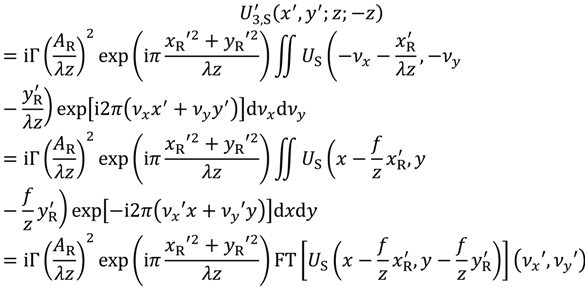
where FT denotes Fourier transform. In the case of z' = -z, Equation 29 is rewritten as
By inverse Fourier transform of Equation 30 using FTL2, the complex amplitude of the reconstructed signal beam is written at image plane 2 as
As shown in Equation 31, the position of the reconstructed image and the phase are shifted corresponding to (
xR',
yR'),
z and
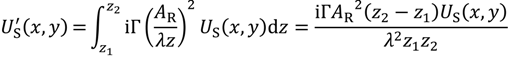
f. Equation 31 shows the case of the thickness of the recording medium is thin, that is, the recording medium is located at only
z. Here, the surface position and the back position of the recording medium are respectively defined as
z1 and
z2(
z1 ˂
z2,
z2 ˂ 0). Then, the reconstructed signal beam is expressed by
When
xR' = 0 and
yR' = 0, the reconstructed signal beam is expressed by
As shown in Equation 33, the recorded signal can be reconstructed. In retardagraphy, the phase pattern must be extracted. The phase pattern can be extracted by phase shifting algorithm using a transmitted illumination beam. The polarization state of the illumination beam is orthogonal to reconstructed signal beam. To use the phase shifting algorism, the polarization states of reconstructed signal beam and transmitted illumination beam are converted into two orthogonal linear polarizations and the phase difference is shifted by using a variable retarder. Then, two polarization components are interfered by using an analyzer and captured using an image sensor. The phase of the reconstructed signal beam is extracted from some captured images by a phase-shifting algorithm.
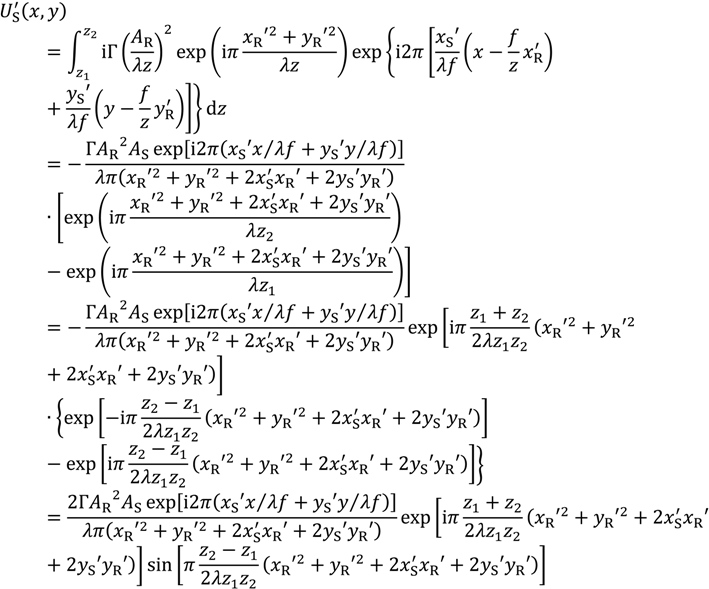
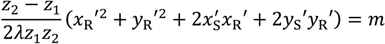
Next, the case of xR' ≠ 0 and/or yR' ≠ 0 is considered. When US is a plane wave as AS exp[i2π(xS' x ⁄λf + yS' x⁄λf)], Equation 32 is written as
Therefore, US' becomes zero in case of
where mis an integer except for zero. In the case of m = 1 and
yR' = 0,
xR' is expressed by
From Equation 36, it is found that shift multiplex recording is realized in volume retardagraphy.
3. Experimental Procedure
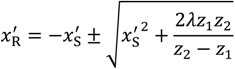
Figure 2 shows the experimental setup for volume retardagraphy. A diode laser with a wavelength of 406 nm was uses for recording and reconstruction. A liquid crystal on silicon spatial light modulator (SLM; Hamamatsu X10408-5) was used to give data pages to recording beam. The polarization state of the laser beam after QWP1 is adjusted to linear with an azimuthal angle by rotating a half-wave plate (HWP1) and QWP1. By using QWP1,
p- and
s-polarization components were converted into right- and left-circular polarization components, respectively. In this setup, when the homogeneous image was inputted to the SLM and the pixel value was changed, the azimuthal angle of the linear polarization was changed corresponding to the pixel value because the phase difference between right- and left-circular polarization components were changed. The size of patterns modulated by the SLM was reduced by two lenses and the beam was focused by using an objective lens. A polarization-sensitive recording medium made of 9,10-phentanthrenenequinone doped polymethylmethacrylate (PQ-PMMA) was put between two objective lenses. The thickness of the medium was 1 mm. Then, the position of the back of the medium was set to the position of the Fourier plane of the recording pattern. The recording beam was illuminated onto the medium. The power of the recording beam at the recording plane and the irradiation time were set to 8 mW and 33 ms, respectively.
Figure 2.
Experimental setup for volume retardagraphy. L, OL, M, HWP, QWP, P, A, SLM, VR are lens, objective lens, mirror, half-wave plate, quarter-wave plate, polarizer, analyzer, spatial light modulator, variable retarder, respectively. Focal lengths (mm) are denoted around lenses. The polarizer is used in only reconstruction.
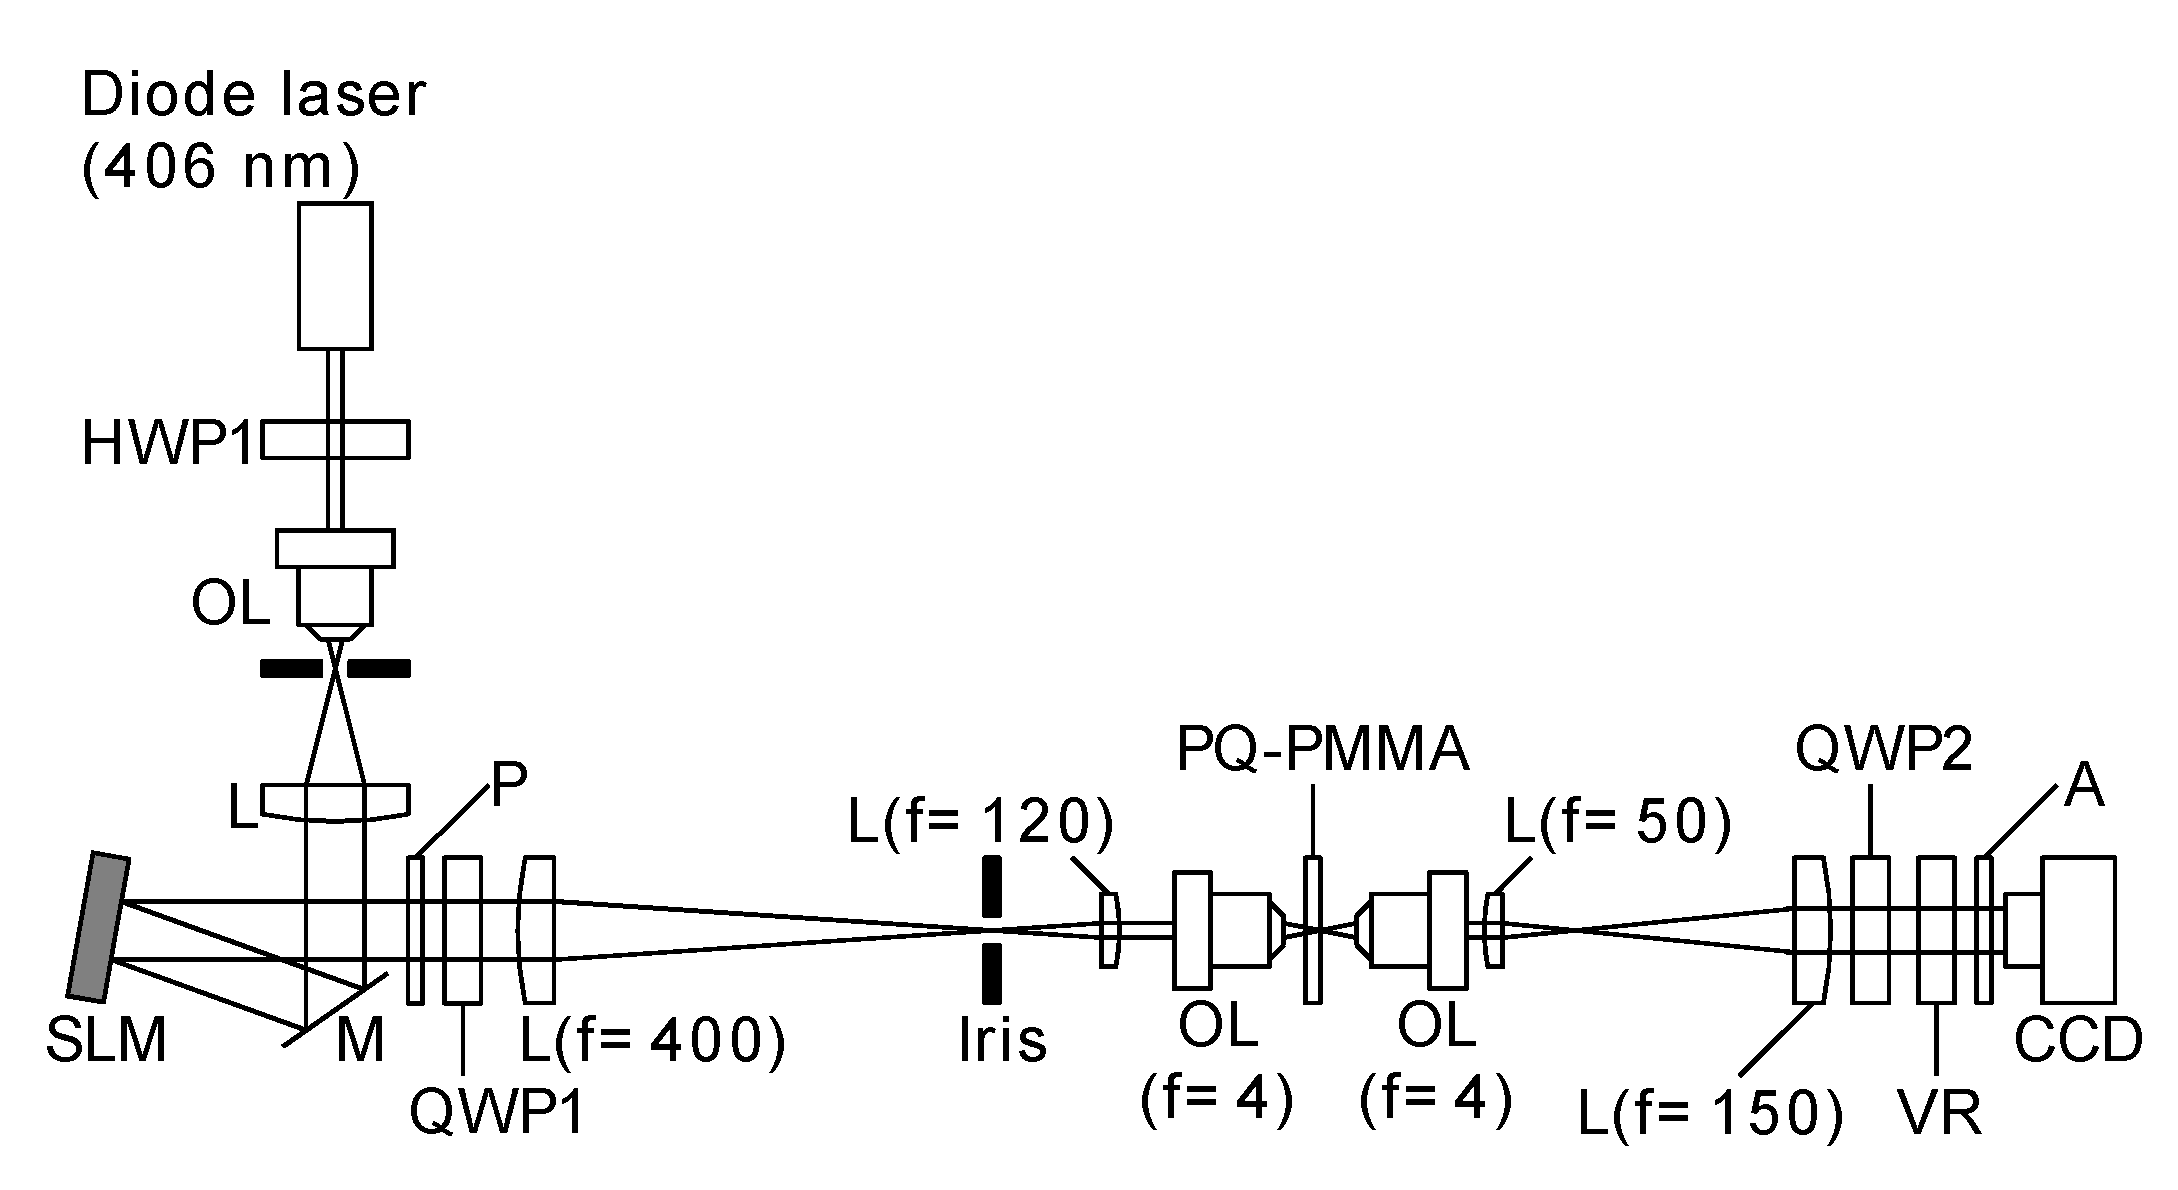
In recording, a phase data page as shown in
Figure 3 was displayed on the SLM. In the SLM, the phase of
p-polarization component was modulated corresponding to the phase data page. The phase data page consisted of 15 × 14 symbols. A symbol consisted of 2 × 2 data pixels. The data pixel consisted of 10 × 10 pixels of SLM. The pixel size of SLM is 20 μm × 20 μm. The phase value was four-valued and the valued of 0, 0.5π, 1.0π, 1.5π rad was used. In a symbol, the phase value was set as the four values were different each other. Then, a symbol can express 24 cases, that is, the information amount of symbol is more than 4 bits. Therefore, a recording digital data was divided by every 4 bits and converted into phase data pages. In this experiment, 12 phase data pages were recorded in multiple by laterally shifting the position of the medium by using a linear stage (SIGMA KOKI SGSP20-20(X)). The shift amount was set to 100 µm.
In reconstruction, a homogeneous pattern was displayed on SLM and a polarizer was put between the SLM and the QWP1. The transmission axis of the polarizer was set as s-polarization component is transmitted. Then, the s-polarized beam was converted into left circular polarized beam by using QWP1. The recorded phase data pages were reconstructed by illuminating the left circular polarized beam. Then, a reconstructed signal beam with right-circular polarization was generated from the recorded medium. The reconstructed signal beam was imaged on a CCD plane by using an objective lens and telecentric optical system. The right- and left-circular polarization components were converted into 45° and −45° linear polarization components by using QWP2. The reconstructed signal beam with 45° linear polarization and the transmitted illumination beam with −45° linear polarization were interfered through an analyzer. Therefore, an interference pattern between reconstructed signal beam and transmitted illumination beam was captured using the CCD camera. Then, the phase between the reconstructed signal beam and the transmitted illumination beam was shifted by using a liquid crystal variable retarder (Meadowlark LDC-100) and four images were captured. By using the four step phase-shifting algorithm, the complex amplitude of reconstructed signal beam was extracted. Furthermore, pixels between reconstructed data page and CCD camera were matched by cubic spline interpolation. Then, the phase was calculated from the complex amplitude.
Figure 3.
Phase data page. (a) four-valued phase data phase; (b) four symbols.
Figure 3.
Phase data page. (a) four-valued phase data phase; (b) four symbols.
4. Results and Discussion
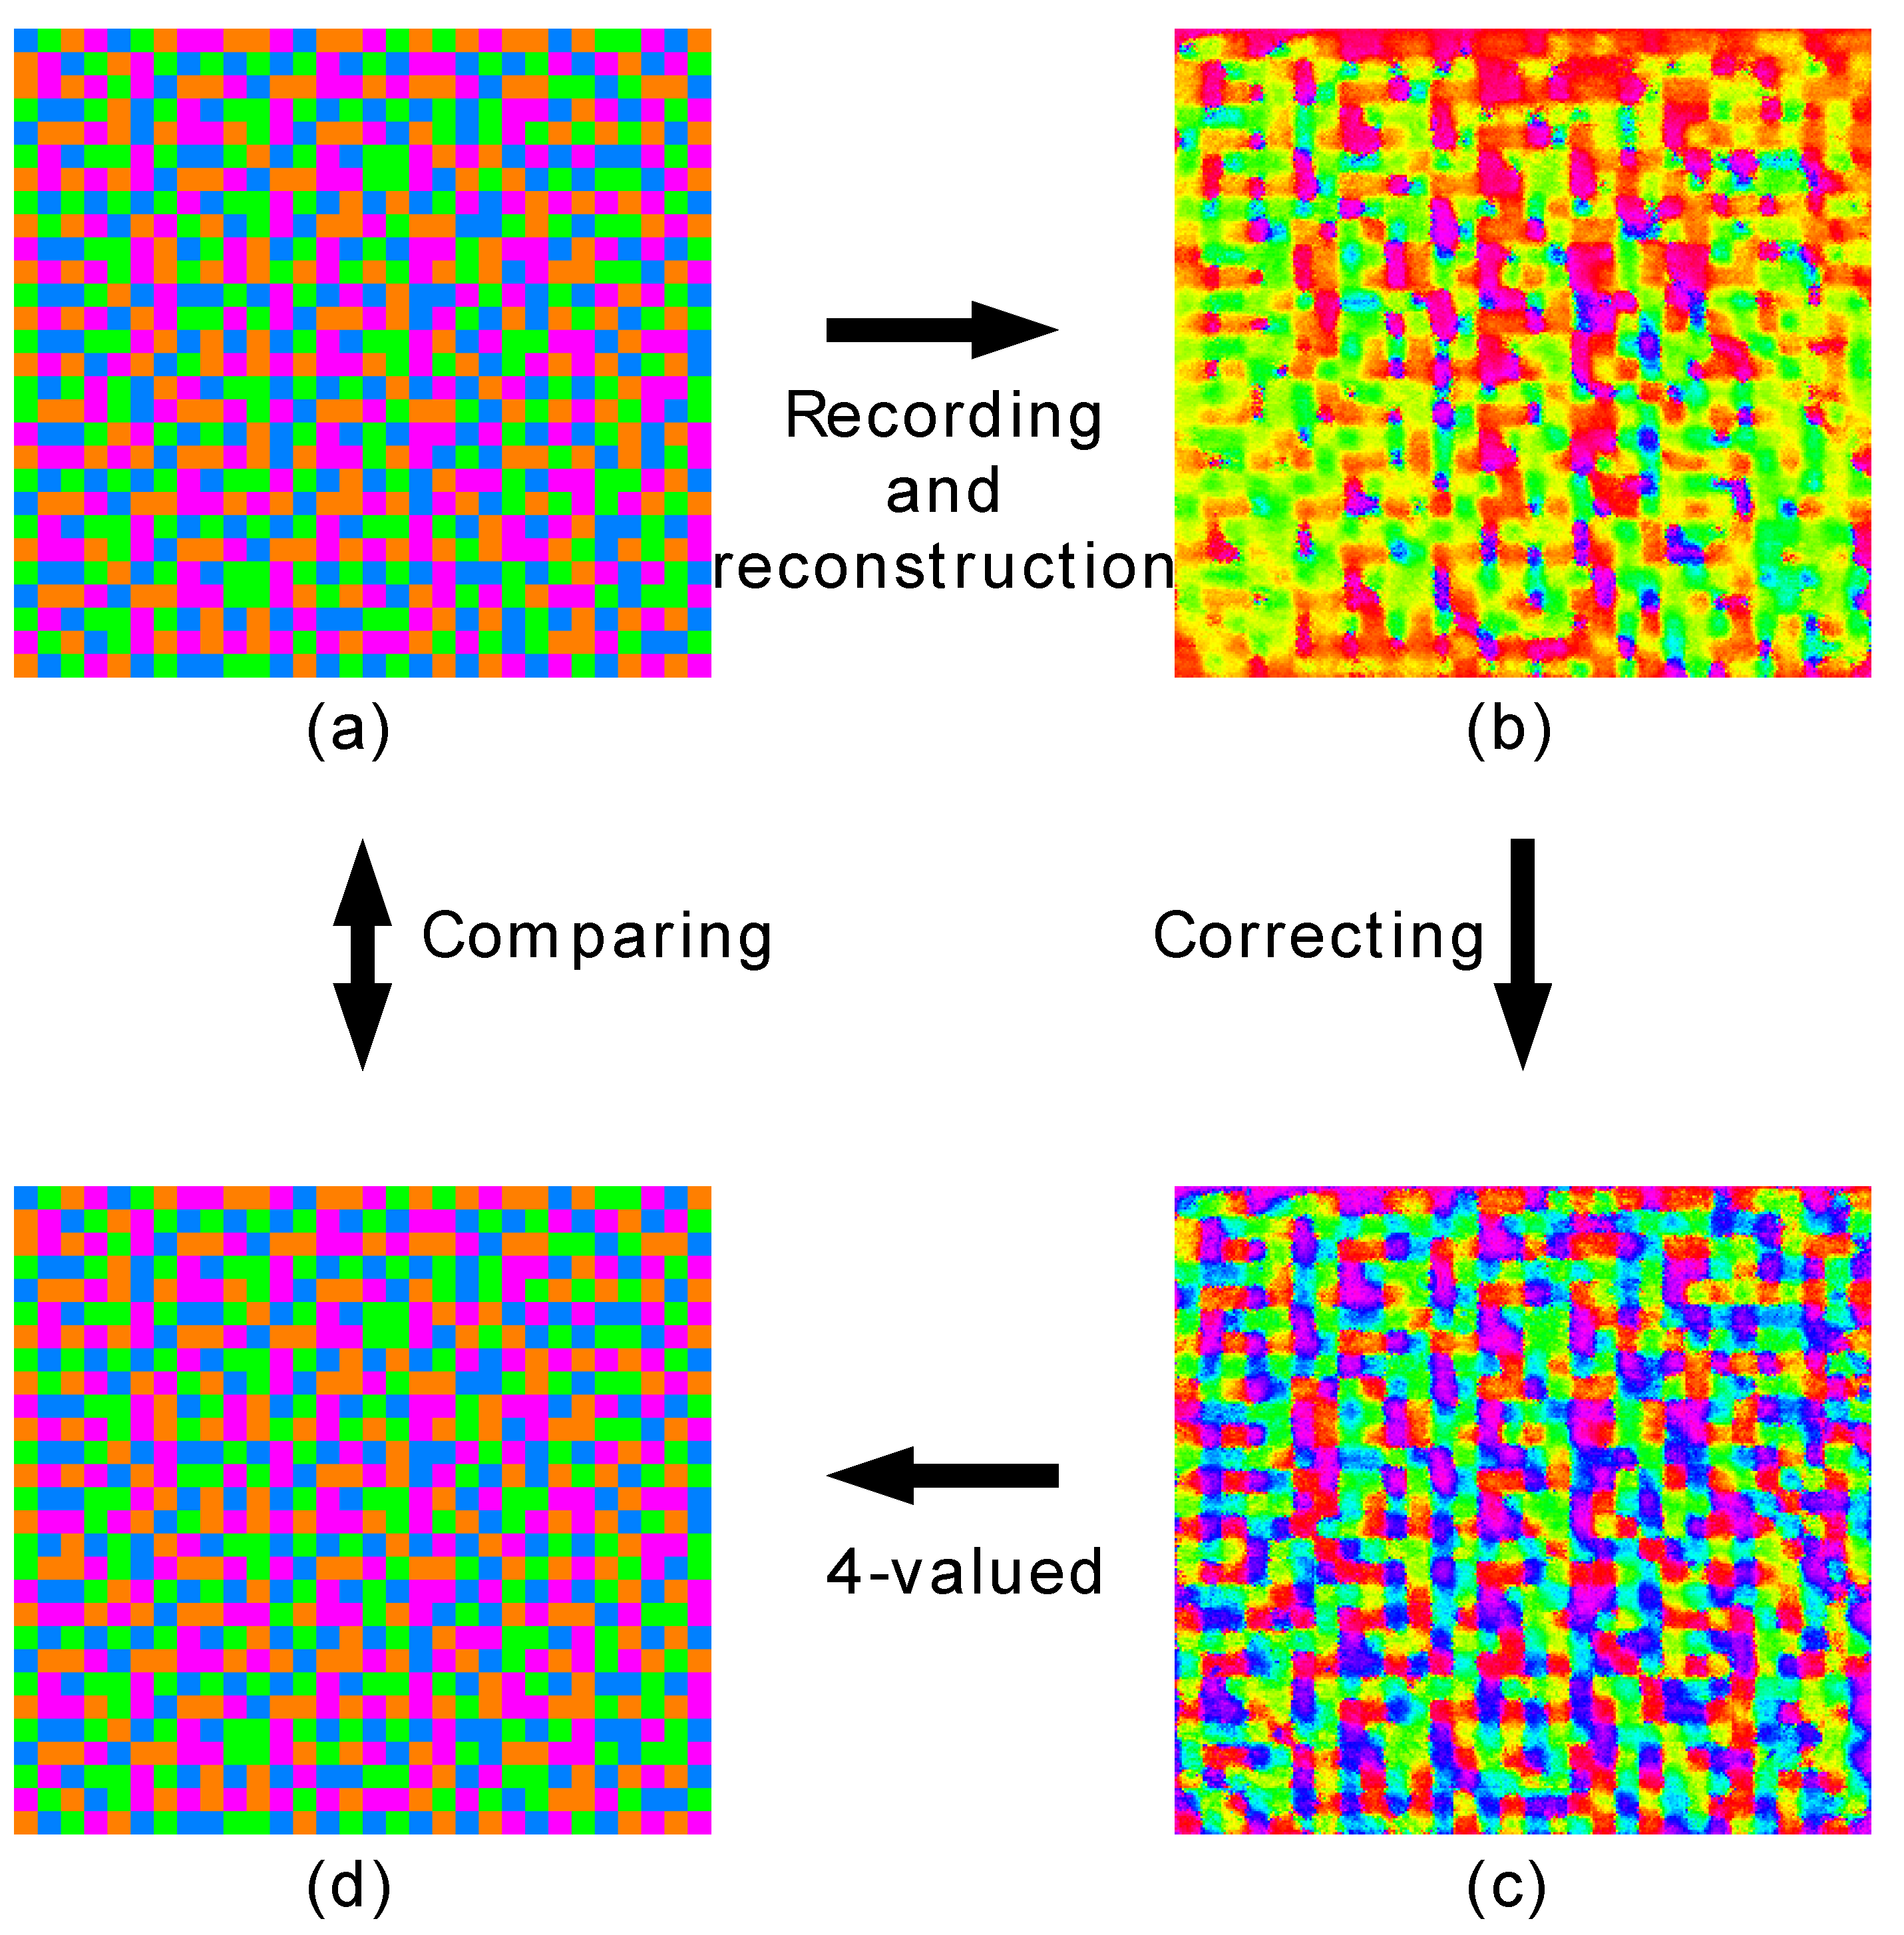
Figure 4b shows a reconstructed phase pattern. The phase value is shifted by π/4. The shift value is required by correcting initial phase in recording. It does not seem that the reconstructed phase pattern is similar to recording data page (
Figure 4a). The extinction ratio of right-circular polarization component to left-circular polarization component is not zero in this system. Therefore, the right-circular polarization component is slightly included in the illumination beam. The reconstructed signal beam is superposed with the right-circular polarization component of transmitted illumination beam. Therefore, the reconstructed phase value was changed. By considering the coding method, the transmitted illumination component can be eliminated. In the coding method, the average of complex amplitude of a symbol is always zero when it is assumed that the intensity is homogeneous. When the complex amplitude values of the reconstructed signal pattern in a symbol were averaged, the transmitted signal beam component is obtained. A data pixel consisted of 10 × 10 pixels. The central 6 × 6 pixels in the 10 × 10 pixels were used to average the complex amplitude. Then, the standard deviation of real and imaginary parts was calculated and an argument was calculated from the real and imaginary parts. When the phase difference at a pixel is larger than the argument value, the complex amplitude value at the pixel is not used to calculate average complex amplitude. By substituting the average complex amplitude from the reconstructed signal complex amplitude, corrected phase pattern is obtained. The corrected phase pattern is shown in
Figure 4c. Furthermore, to evaluate symbol error rate (SER), the reconstructed phase pattern must be four-valued. The sine and cosine of the phase value are calculated in a symbol and compared with 16 cases of symbol pattern. Then, the phase pattern is substituted by a symbol pattern with the least square of the sum of the difference. By the method, a phase data page was reconstructed. The reconstructed phase data page is shown in
Figure 4d. The symbol error rates (SERs) of reconstructed 12 phase data pages are shown
Table 1. As shown in
Table 1, SERs were under 11%. Those values were enough low to make zero by using an error correction method. The symbol error rate is dependent on the resolution and the positioning accuracy of the linear stage because of shift selectivity. In this experiment, the resolution and the accuracy are 2 µm and 10 µm, respectively.
Figure 4.
Reconstructing process. (a) Recording phase data phase; (b) Reconstructed phase pattern; (c) Corrected phase pattern; (d) Reconstructed phase data page.
Figure 4.
Reconstructing process. (a) Recording phase data phase; (b) Reconstructed phase pattern; (c) Corrected phase pattern; (d) Reconstructed phase data page.
Table 1.
Symbol error rate (SER) of reconstructed phase data pages.
Table 1.
Symbol error rate (SER) of reconstructed phase data pages.
| Page no. | 1 | 2 | 3 | 4 | 5 | 6 |
|---|
| SER (%) | 3.33 | 0 | 2.38 | 0.48 | 0 | 5.71 |
| Page no. | 7 | 8 | 9 | 10 | 11 | 12 |
| SER (%) | 10.95 | 10.95 | 2.86 | 1.90 | 2.86 | 0.48 |
In this study, the data pixel size of phase data pages was reduced from 200 µm to 60 µm. Then, the width of the data page was calculated to W = 30 × 60 = 1.8 mm. When the recording medium is thin, that is, z1 = z2, and it is located at z1 = z2 = -1 mm, |xR'| = W|z1|/f = 450 μm is required to record another phase data page. When the thickness becomes greater, that is z2 approachess zero, the reconstructed image is eliminated by shifting the recording medium with less than 450 µm. Therefore, shift multiplex recording was realized with the shift amount of 100 µm. When the shift amount is decreased, the crosstalk noise is increased. Therefore, SER is increased. For a shift amount of 100 μm, it has been determined that the SERs fall below about 10%. To achieve higher shift selectivity, the low spatial frequency components of recording phase data page must be removed. It is possible to decrease the value to remove the low spatial frequency components of signal beam pattern by using other coding methods of the phase data pages. In this study, a PQ-PMMA plate with a thickness of 1 mm, which is easy to prepare, was used as a recording medium to experimentally verify the principle of volume retardagraphy. By improving the polarization-sensitivity of recording medium as well as shift selectivity, it is expected to increase data capacity and data transfer rate.


