Abstract
Global installed capacity of renewable energy technologies is growing rapidly. The ability of renewable technologies to enable a rapid transition to a low carbon energy system is highly dependent on the energy that must be “consumed” during their life-cycle. This paper presents the results of meta-analyses of life-cycle assessments (LCA) of energy costs of three renewable technologies: solar photovoltaic (PV), concentrating solar power (CSP), and wind. The paper presents these findings as energetic analogies with financial cost parameters for assessing energy technologies: overnight capital cost, operating costs and levelized cost of electricity (LCOE). The findings suggest that wind energy has the lowest energy costs, followed by CSP and then PV.
1. Introduction
Technology assessment of energy production technologies is often computed as financial cost. The US Department of Energy (DOE) and the National Renewable Energy Laboratory have been aggregating data on cost estimates for electricity generation in an online application, the Transparent Cost Database [1]. In this database, four main metrics exist to assess the cost of, especially, electricity generating infrastructure investment:
- overnight capital cost—combines all the capital cost data without interest (as if built overnight [2], computed in $/W;
- fixed operating costs—including such costs as salaries, general overheads, insurance, taxes [3], computed as $/W;
- variable operating costs—including such costs as purchase of consumables (particularly associated with the fuel cycle, e.g., natural gas) [3], computed as $/kWh and;
- levelized cost of electricity (LCOE)—total costs (including annualized capital and yearly operating) divided by total energy service production [1], computed as $/kWh.
Life-cycle “cost” metrics are developed in other fields for energy generation technologies. The metrics presented are often variable or incommensurate. In the field of net energy analysis, the energy return on investment (EROI) is often computed, which measures the ratio of the energy in a given amount of the extracted and delivered fuel to the total primary energy used in the supply chain (i.e., the energy that is directly and indirectly required to extract, refine and deliver the fuel)” [4]. For photovoltaic (PV) technologies, the energy payback time (EPBT) is often reported instead, which measures the time necessary for an energy technology to generate the equivalent amount of primary energy used to produce it [5]. Within the field of life cycle assessment (LCA) a different set of metrics are reported, including the cumulative energy demand (CED), defined as the amount of primary energy consumed during the life-cycle of a product or a service [6], and the energy or greenhouse gas (GHG) intensity, defined as the ratio of the primary energy consumed, or CO2 emitted for the construction, operation, and decommissioning, per unit of output of electrical energy over the lifetime of the device [7].
The author believes that the multitude of different metrics and their incommensurability with financial metrics may be a barrier to more widespread use of physical information for electricity supply planning. This paper will advance the benefits of the computation of metrics for physical “costs” associated with electricity production by electricity generation technologies which are analogous to those published as financial cost described above.
A recent meta-analysis and harmonization project has been carried out by researchers at the National Renewable Energy Laboratory (NREL) and a number of other institutions to determine the distribution in greenhouse gases (GHG) emissions from a variety of electricity production technologies over their entire life-cycle. Methodological details are provided in Heath and Mann [8].
This paper presents the results of a meta-analysis of the energy requirements of electricity generation via PV, concentrated solar power (CSP) and wind. The process involved a number of stages, including: initial literature search, literature screening, data collection, and commensuration of system boundaries and units.
2. Life-Cycle Assessment
LCA is a methodology to evaluate the material flows and environmental impacts associated with the production of goods and provision of services over its full life-cycle from extraction and processing of raw materials through manufacture, operation and, finally, disposal [9,10]. The LCA is divided into four main phases:
- goal and scope—including the definition of the functional unit, which quantifies the service delivered by the product system, definition of system boundaries, clarification of assumptions and limitations, allocations methods, e.g., between co-products, and impact categories;
- life-cycle inventory (LCI)—tracking material and energy flows from and to the environment, often involving either the creation of a ”bottom-up” model of the production process, the use of input–output (I-O) tables to convert between financial and physical data, or some hybrid of the two;
- life-cycle impact assessment (LCIA)—evaluating the environmental impacts of flows associated with the LCI, including selecting appropriate impact categories, indicators and environmental impact models, classification and measurement of impacts using a common metric to place different categories on an equivalent basis and;
- • interpretation—including identification of significant issues arising from the LCI and LCIA stages, evaluation of completeness, sensitivity and consistency, and conclusions, limitations, and recommendations.
For the purposes of the current analysis, data from the LCI stage has been used. The goal of the majority of the studies used is to determine the CED of the three renewable energy technologies under analysis. The functional unit is normally one kWh of electricity generation in order to generate an energy intensity metric [kWhp/kWhe]. Most of the studies within the meta-analysis are based on bottom-up models, though some of the data from [7] comes from hybrid models.
3. Methodology: Meta-Analysis
The three areas of interest for this analysis were energy requirements for the production of capital infrastructure, energy requirements for operation of the system, and total life-cycle energy requirements for the system. The aim is to produce metrics of energy “costs” analogous to the financial metrics used to characterize energy production technologies. The capital energy cost [kWhe/Wp] serves as the analogy for the overnight capital cost [$/Wp]. The operating energy cost [kWhe/kWhe] serves as the analogy to the financial operating cost [$/kWhe]. The LCEC [kWhe/kWhe] serves as the analogy to the LCOE [$/kWhe].
3.1. Literature Search and Screening
Searches were made for a number of publication types including peer-reviewed journals, industry reports, reports by national agencies, such as the US Department of Energy (DOE), and unpublished work, including conference papers and doctoral theses. The search terms included the energy technology, e.g. “PV”, with the following phrases: “embodied energy”, “cumulative energy demand”, “life cycle inventory”, “life cycle assessment”, “energy payback time”, “net energy ratio” (NER), “energy yield ratio” (EYR), “energy return on investment” and “EROI”.
A number of criteria were used to screen the initial results: the study should be in English, the study should be original research or should reference data used, the study should give numeric data on net energy metrics, e.g., cumulative energy demand (CED), or net energy ratio (NER). Cross-referenced estimates were also eliminated.
The studies remaining after screening are presented in Table 1.

Table 1.
Studies found from search and screening process.
| Reference | Year | Technology | Location | Analysis type |
|---|---|---|---|---|
| [11] | 1995 | PV | India | Process |
| [12] | 1997 | PV | Japan | Process |
| [13] | 1997 | PV | US | Process |
| [14] | 2000 | PV | Unspecified | Process |
| [15] | 2001 | PV | Europe | Process |
| [16] | 2001 | PV | US | Process |
| [17] | 2002 | PV | India | Process |
| [18] | 2002 | PV | Europe | Process |
| [19] | 2004 | PV | Europe | Process |
| [20] | 2004 | PV | India | Process |
| [21] | 2004 | PV | Europe | Process |
| [22] | 2005 | PV | Europe | Process |
| [23] | 2006 | PV | US | Process |
| [24] | 2006 | PV | Europe | Process |
| [25] | 2006 | PV | US | Process |
| [26] | 2006 | PV | Singapore | Process |
| [27] | 2007 | PV | Europe | Process |
| [28] | 2007 | PV | US | Process |
| [29] | 2007 | PV | Europe | Process |
| [30] | 2008 | PV | China | Process |
| [31] | 2008 | PV | Many | Process |
| [32] | 2009 | PV | Europe | Process |
| [33] | 2009 | PV | US | Process |
| [34] | 2009 | PV | Europe | Process |
| [6] | 2010 | PV | US/Canada | Process |
| [35] | 2010 | PV | US | Hybrid |
| [36] | 2010 | PV | China/Japan | Process |
| [37] | 2011 | PV | Europe | Process |
| [38] | 2011 | PV | Europe | Process |
| [39] | 1990 | CSP | US | I-O |
| [40] | 1999 | CSP | Australia | Hybrid |
| [41] | 2002 | CSP | Australia | Hybrid |
| [42] | 2008 | CSP | Europe | Process |
| [43] | 2011 | CSP | US | Hybrid |
| [44] | 2011 | CSP | Europe | Process |
| [45] | 2011 | CSP | Chile | Process |
| [46] | 2011 | CSP | China | Process |
| [47] | 2004 | Wind | Europe | Process |
| [48] | 2005 | Wind | Canada | Process |
| [49] | 2006 | Wind | Europe | Process |
| [50] | 2006 | Wind | Europe | Process |
| [51] | 2008 | Wind | Taiwan | Process |
| [52] | 2008 | Wind | Europe | Process |
| [53] | 2009 | Wind | Europe | Process |
| [54] | 2009 | Wind | Europe | Process |
| [55] | 2009 | Wind | Europe | Process |
| [56] | 2009 | Wind | Australia | Hybrid |
| [57] | 2010 | Wind | Many | Meta-analysis |
| [58] | 2011 | Wind | Europe | Process |
| [59] | 2011 | Wind | Europe | Process |
| [60] | 2011 | Wind | Europe | Process |
| [61] | 2011 | Wind | Europe | Process |
| [62] | 2011 | Wind | China | Process |
| [63] | 2011 | Wind | China | Process |
| [64] | 2011 | Wind | Europe | Process |
| [65] | 2012 | Wind | Europe | Process |
| [66] | 2012 | Wind | Canada | Process |
3.2. Commensuration of Study Boundaries and Data
A number of methods were used to allow comparison of results. Data was aggregated by converting to electrical energy equivalents. Data given in terms of primary energy was changed to electricity equivalents using conversion factors given in the study. If no conversion factor was given, a standard conversion factor of 30% was used. For reference, the conversion factor for Europe’s grid is 31% and for the US is 29% [67]. Where data was given in terms of energy inputs per unit of PV system area, e.g., MJ/m2, this was converted to per unit capacity inputs by using rated PV system efficiency and standard test conditions (STC) irradiance of 1000 W/m2. If no efficiency was given, the study was not used. If data was given in terms of an energy intensity, i.e., energy inputs per unit of electricity produced, e.g., [MJ/kWhe], this was converted to per unit capacity inputs by one of the following methods: using the capacity factor, i.e., the ratio of the average power output to nameplate capacity of the system; using the total lifetime electricity production of the system; or, using the annual electricity production of the system and the lifetime of the system, and, if no lifetime was given, the system was assumed to have a nominal lifetime of 25 years.
4. Results and Discussion
Data found by the meta-analysis is presented in the supporting information. Studies on PV were disaggregated by technology: single-crystal silicon (sc-Si), multi-crystalline silicon (mc-Si), amorphous silicon (a-Si), ribbon silicon, cadmium telluride (CdTe) and copper indium gallium (di)selenide (CIGS). Studies on CSP were disaggregated by technology: parabolic trough, tower, dish and fresnel. No data was found for either dish or fresnel CSP technologies. Studies on wind were disaggregated based on wind farm location: onshore or offshore. The data from the studies was categorized according to appropriate stage in the technology production process: capital energy cost, operating energy cost and LCEC.
4.1. Capital Energy Costs
Capital costs include the energy requirements to extract and process all raw materials, manufacture and install the capital equipment including any site preparation and grid interconnection. Energetic inputs associated with operating and maintenance (O&M) and disposal are not included. Units of measurement for capital costs are kWhe per unit of nameplate capacity, Wp. Data taken from [6,7,11,12,13,14,15,16,17,18,19,20,21,22,23,24,25,26,27,28,29,30,31,32,33,34,35,36,37,38,39,40,41,42,43,44,45,46,47,48,49,50,51,52,53,54,55,56,57,58,59,60,61,62,63,64,65,66].
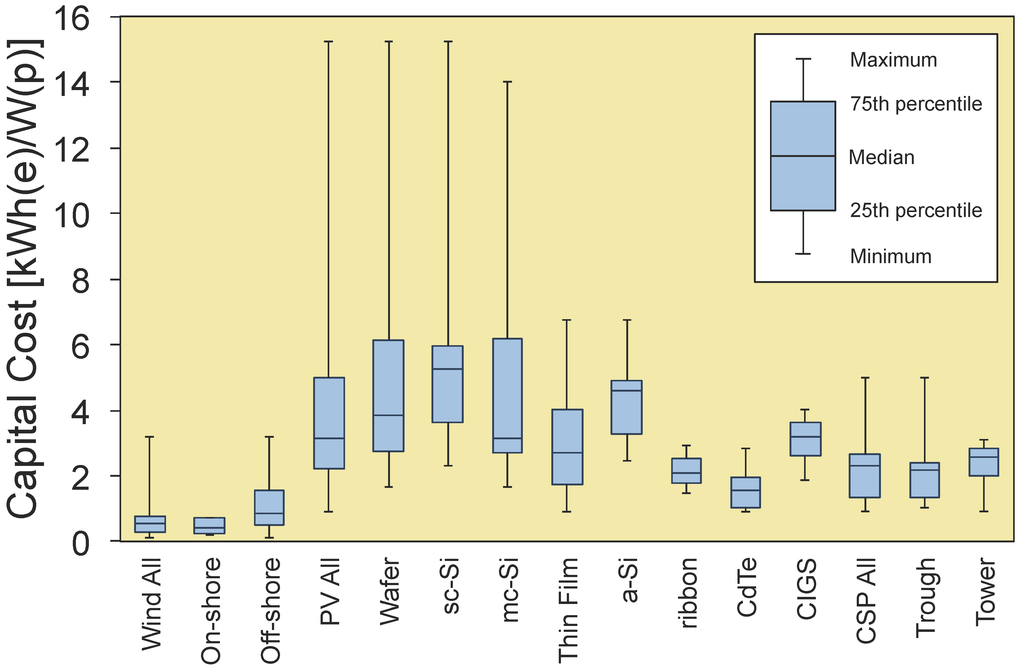
Figure 1.
Capital cost [kWhe/Wp] of various wind, PV and CSP technologies.
Figure 1 shows the distribution in estimates of capital cost for the various renewable technologies. In general, wind has the lowest capital costs, followed by CSP and then PV. Looking at each of the specific technology categories, we see that onshore wind has lower capital costs than offshore. Thin film PV has lower capital costs than wafer-based PV, with CdTe having the lowest cost. Trough CSP has a lower median value than tower systems, but a larger range in estimates. The crystalline silicon PV technologies have the greatest range in values. The most likely reason for this is due to their having estimates from a wide range of years. The spread in values fails to capture the evolution of decreasing CED through time.
For more details on this issue, see [68]. Ranking the technologies by median value we find:
| 1. onshore wind | 6. tower CSP |
| 2. offshore wind | 7. mc-Si PV |
| 3. CdTe PV | 8. CIGS PV |
| 4. ribbon silicon PV | 9. a-Si PV |
| 5. trough CSP | 10. sc-Si PV |
4.2. Operating Energy Costs
Data on operating costs includes energy requirements for maintenance of the system, e.g., washing solar systems, replacing worn parts, including the energy required to build spare parts, energy requirements for operating the systems, such as control systems, or, if necessary, the energy associated with the fuel cycle (including the energy content of any fuel consumed). Such inputs were mainly associated with CSP, where natural gas must sometimes be burned to maintain steam operating temperatures or to restart the steam turbine after an overnight shut-down. Data taken from [39,41,42,43,45,46].
There was insufficient data to distinguish fixed and variable operating costs, as is done in economic analyses. As such, all operating costs have been aggregated and are displayed in both units of kWhe/Wp and kWhe/kWhe.
Figure 2 shows the distribution of estimates for operating costs. Data could be found only for CSP technologies. As can be seen, tower CSP has higher operating costs than trough. This may be due to natural gas consumption necessary to maintain higher temperatures in the event of cloud cover [69].
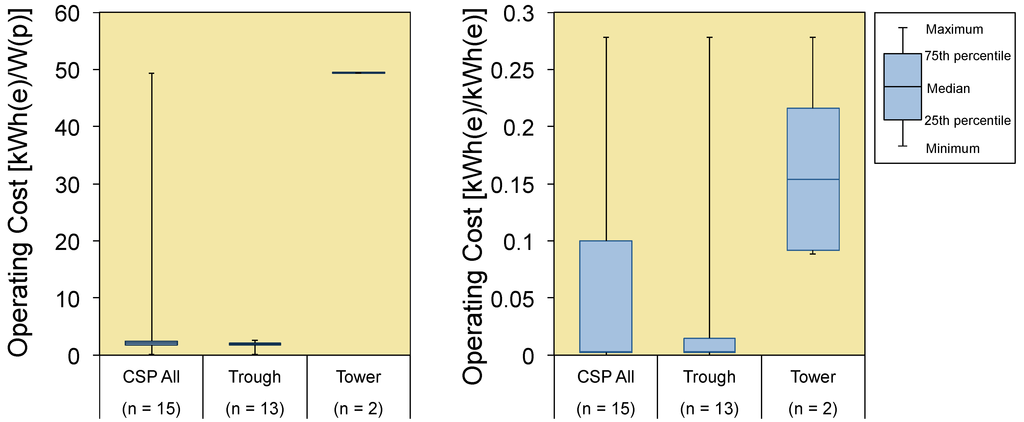
Figure 2.
Operating cost [kWhe/kWhe] of CSP technologies.
4.3. Life-Cycle Energy Costs (LCEC)
Life-cycle costs include all of the energy inputs over the full life-cycle of the system, including end- of-life, normalized by the total lifetime electricity output from the system. The unit of measurement is kWhe/kWhe. Unlike the financial metric LCOE, no discounting of inputs and outputs has been made. Data taken from [6,7,11,12,13,14,15,16,17,18,19,20,21,22,23,24,25,26,27,28,29,30,31,32,33,34,35,36,37,38,39,40,41,42,43,44,45,46,47,48,49,50,51,52,53,54,55,56,57,58,59,60,61,62,63,64,65,66].
Figure 3 shows the life-cycle energy requirements for a number of the renewable technologies. Similarly to capital costs, wind power has the lowest LCEC, followed by CSP and then PV. Ranking specific technology types by median LCEC we find:
| 1. off-shore wind | 6. CIGS PV |
| 2. on-shore wind | 7. a-Si PV |
| 3. CdTe PV | 8. mc-Si PV |
| 4. trough CSP | 9. sc-Si PV |
| 5. ribbon PV | 10. tower CSP |
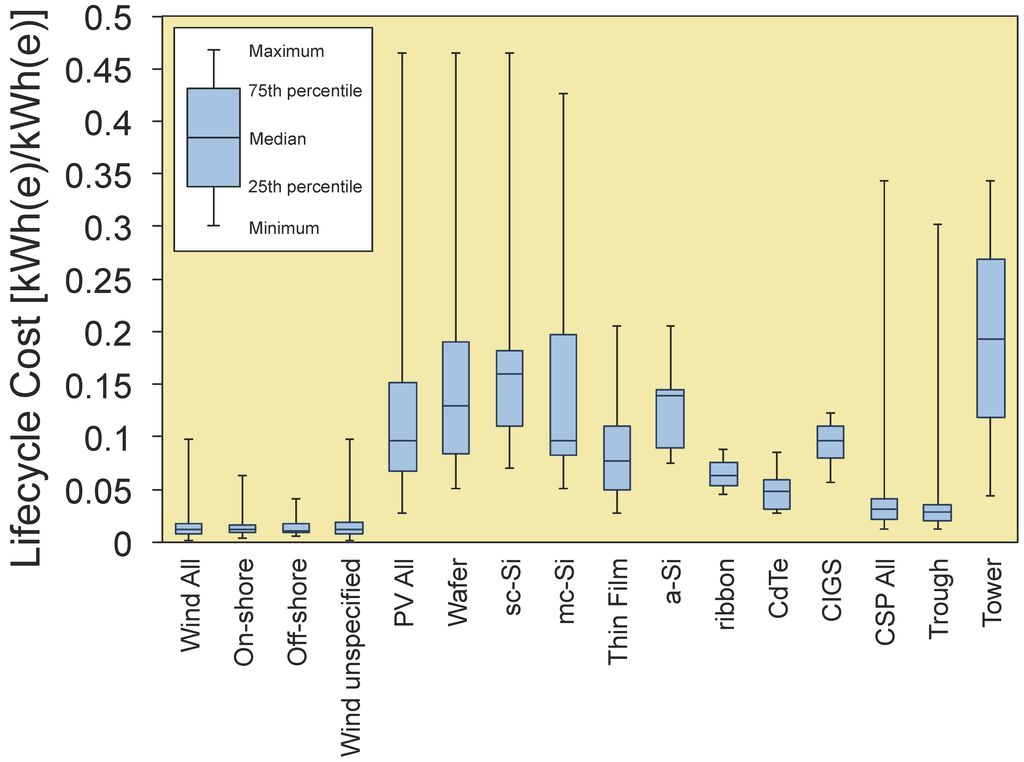
Figure 3.
Life-cycle cost [kWhe/kWhe] of various wind, PV and CSP technologies.
5. Conclusions
The results of a meta-analysis of energy requirements for three renewable electricity production technologies—wind, PV and CSP—has been presented. To facilitate the utility of this information, the metrics presented are direct analogies of financial metrics commonly used to characterize electricity production technologies: overnight capital cost, operating costs and LCOE. The author recommends the use of these metrics to enable more interaction between researchers in the field of LCA with policy makers and advisers. The analysis has found that there is a wide range in energy requirements for producing electricity from different renewable resources. Wind was found to have the lowest capital costs, followed by CSP and then PV. The LCEC followed a similar pattern, though tower CSP was found to have the highest LCEC due mainly to consumption of natural gas during operation.
Acknowledgments
The author would like to thank Charlie Barnhart, Adam Brandt, Sally Benson, and Patricia Carbajales for their help and support. Additionally, thanks to the reviewers for their helpful suggestions.
References
- Transparent Cost Database. Available online: http://en.openei.org/apps/TCDB/ (accessed on 16 December 2012).
- Koomey, J.; Hultman, N. A reactor-level analysis of busbar costs for US nuclear plants, 1970–2005. Energy Policy 2007, 35, 5630–5642. [Google Scholar]
- Gnansounou, E.; Dauriat, A. Techno-economic analysis of lignocellulosic ethanol: A review. Bioresour. Technol. 2010, 101, 4980–4991. [Google Scholar] [CrossRef] [PubMed]
- Raugei, M.; Fullana-i Palmer, P.; Fthenakis, V. The energy return on energy investment (EROI) of photovoltaics: Methodology and comparisons with fossil fuel life cycles. Energy Policy 2012, 45, 576–582. [Google Scholar] [CrossRef]
- Botsaris, P.N.; Filippidou, F. Estimation of the energy payback time (EPR) for a PV module installed in North Eastern Greece. Appl. Solar Energy 2009, 45, 166–175. [Google Scholar] [CrossRef]
- Amor, M.B.; Lesage, P.; Pineau, P.O.; Samson, R. Can distributed generation offer substantial benefits in a Northeastern American context? A case study of small-scale renewable technologies using a life cycle methodology. Renew. Sustain. Energy Rev. 2010, 14, 2885–2895. [Google Scholar] [CrossRef]
- Lenzen, M.; Munksgaard, J. Energy and CO2 life-cycle analyses of wind turbines—review and applications. Renew. Energy 2002, 26, 339–362. [Google Scholar] [CrossRef]
- Heath, G.; Mann, M. Background and reflections on the life cycle assessment harmonization project. J. Ind. Ecology 2012, 16, S8–S11. [Google Scholar] [CrossRef]
- International Organization for Standardization (ISO). Environmental Management—Life Cycle Assessment—Principles and Framework; ISO 14040:1998; ISO: Geneva, Switzerland, 1998. [Google Scholar]
- International Organization for Standardization (ISO). Environmental Management—Life Cycle Assessment—Requirements and Guidelines; ISO 14044:2006; ISO: Geneva, Switzerland, 2006. [Google Scholar]
- Prakash, R.; Bansal, N.K. Energy analysis of solar photovoltaic module production in India. Energy Sources 1995, 17, 605–613. [Google Scholar] [CrossRef]
- Kato, K.; Murata, A.; Sakuta, K. An evaluation on the life cycle of photovoltaic energy system considering production energy of off-grade silicon. Solar Energy Mater. Solar Cells 1997, 47, 95–100. [Google Scholar] [CrossRef]
- Keoleian, G.A.; Lewis, G.M. Application of life-cycle energy analysis to photovoltaic module design. Prog. Photovolt. Res. Appl. 1997, 5, 287–300. [Google Scholar] [CrossRef]
- Alsema, E.A. Energy pay-back time and CO2 emissions of PV systems. Prog. Photovolt. Res. Appl. 2000, 8, 17–25. [Google Scholar] [CrossRef]
- Frankl, P. Life Cycle Assessment of Renewables: Present Issues, Future Outlook and Implications for the Calculation of External Costs. In Porceedings of Externalities and Energy Policy: The Life Cycle Analysis Approach, Paris, France, 15–16 November 2001.
- Knapp, K.; Jester, T. Empirical investigation of the energy payback time for photovoltaic modules. Solar Energy 2001, 71, 165–172. [Google Scholar] [CrossRef]
- Mathur, J.; Bansal, N.K.; Wagner, H.J. Energy and environmental correlation for renewable energy systems in India. Energy Sources 2002, 24, 19–26. [Google Scholar] [CrossRef]
- International Institute for Sustainability Analysis and Strategy (IINAS). Global Emissions Model for Integrated Systems; IINAS: Darmstadt, Germany, 2002. [Google Scholar]
- Gürzenich, D.; Wagner, H.J. Cumulative energy demand and cumulative emissions of photovoltaics production in Europe. Energy 2004, 29, 2297–2303. [Google Scholar] [CrossRef]
- Mathur, J.; Bansal, N.K.; Wagner, H.J. Dynamic energy analysis to assess maximum growth rates in developing power generation capacity: Case study of India. Energy Policy 2004, 32, 281–287. [Google Scholar] [CrossRef]
- Krauter, S.; Ruther, R. Considerations for the calculation of greenhouse gas reduction by photovoltaic solar energy. Renew. Energy 2004, 29, 345–355. [Google Scholar] [CrossRef]
- Battisti, R.; Corrado, A. Evaluation of technical improvements of photovoltaic systems through life cycle assessment methodology. Energy 2005, 30, 952–967. [Google Scholar] [CrossRef]
- Fthenakis, V.; Alsema, E. Photovoltaics energy payback times, greenhouse gas emissions and external costs: 2004-early 2005 status. Progr. Photovolt. 2006, 14, 275–280. [Google Scholar] [CrossRef]
- Muneer, T.; Younes, S.; Lambert, N.; Kubie, J. Life cycle assessment of a medium-sized photovoltaic facility at a high latitude location. Proc. Inst. Mechan. Eng. Part A 2006, 220, 517–524. [Google Scholar] [CrossRef]
- Mason, J.E.; Fthenakis, V.M.; Hansen, T.; Kim, H.C. Energy payback and life-cycle CO2 emissions of the BOS in an optimized 35MW PV installation. Prog. Photovolt. Res. Appl. 2006, 14, 179–190. [Google Scholar] [CrossRef]
- Kannan, R.; Leong, K.C.; Osman, R.; Ho, H.K.; Tso, C.P. Life cycle assessment study of solar PV systems: An example of a 2.7 kW(p) distributed solar PV system in Singapore. Solar Energy 2006, 80, 555–563. [Google Scholar] [CrossRef]
- Mohr, N.J.; Schermer, J.J.; Huijbregts, M.A.J.; Meijer, A.; Reijnders, L. Life cycle assessment of thin-film GaAs and GaInP/GaAs solar modules. Prog. Photovolt. Res. Appl. 2007, 15, 163–179. [Google Scholar] [CrossRef]
- Pacca, S.; Sivaraman, D.; Keoleian, G.A. Parameters affecting the life cycle performance of PV technologies and systems. Energy Policy 2007, 35, 3316–3326. [Google Scholar] [CrossRef]
- Raugei, M.; Bargigli, S.; Ulgiati, S. Life cycle assessment and energy pay-back time of advanced photovoltaic modules: CdTe and CIS compared to poly-Si. Energy 2007, 32, 1310–1318. [Google Scholar] [CrossRef]
- Ito, M.; Kato, K.; Komoto, K.; Kichimi, T.; Kurokawa, K. A comparative study on cost and life-cycle analysis for 100MW very large-scale PV (VLS-PV) systems in deserts using m-Si, a-Si, CdTe, and CIS modules. Prog. Photovolt. Res. Appl. 2008, 16, 17–30. [Google Scholar] [CrossRef]
- Stoppato, A. Life cycle assessment of photovoltaic electricity generation. Energy 2008, 33, 224–232. [Google Scholar]
- Roes, A.L.; Alsema, E.A.; Blok, K.; Patel, M.K. Ex-ante environmental and economic evaluation of polymer photovoltaics. Prog. Photovolt. Res. Appl. 2009, 17, 372–393. [Google Scholar] [CrossRef]
- Fthenakis, V.; Kim, H.C.; Held, M.; Raugei, M.; Krones, J. Update of PV Energy Payback Times and Life-Cycle Greenhouse Gas Emissions. In Proceedings of the 24th European Photovoltaic Solar Energy Conference and Exhibition, Hamburg, Germany, 21–25 September 2009.
- Raugei, M.; Frankl, P. Life cycle impacts and costs of photovoltaic systems: Current state of the art and future outlooks. Energy 2009, 34, 392–399. [Google Scholar] [CrossRef]
- Zhai, P.; Williams, E.D. Dynamic hybrid life cycle assessment of energy and carbon of multicrystalline silicon photovoltaic systems. Environ. Sci. Technol. 2010, 44, 7950–7955. [Google Scholar] [CrossRef] [PubMed]
- Nishimura, A.; Hayashi, Y.; Tanaka, K.; Hirota, M.; Kato, S.; Ito, M.; Araki, K.; Hu, E.J. Life cycle assessment and evaluation of energy payback time on high-concentration photovoltaic power generation system. Appl. energy 2010, 87, 2797–2807. [Google Scholar] [CrossRef]
- Laleman, R.; Albrecht, J.; Dewulf, J. Life Cycle Analysis to estimate the environmental impact of residential photovoltaic systems in regions with a low solar irradiation. Renew. Sustain. Energy Rev. 2011, 15, 267–281. [Google Scholar] [CrossRef]
- Held, M.; Ilg, R. Update of environmental indicators and energy payback time of CdTe PV systems in Europe. Prog. Photovolt. Res. Appl. 2011, 19, 614–626. [Google Scholar] [CrossRef]
- Kreith, F.; Norton, P.; Brown, D. A comparison of CO2 emissions from fossil and solar power plants in the United States. Energy 1990, 15, 1181–1198. [Google Scholar] [CrossRef]
- Lenzen, M. Greenhouse gas analysis of solar-thermal electricity generation. Solar Energy 1999, 65, 353–368. [Google Scholar] [CrossRef]
- Lenzen, M.; Dey, C. Economic, energy and greenhouse emissions impacts of some consumer choice, technology and government outlay options. Energy Econ. 2002, 24, 377–403. [Google Scholar] [CrossRef]
- Lechón, Y.; de la Rúa, C.; Sáez, R. Life cycle environmental impacts of electricity production by solarthermal power plants in Spain. J. Solar Energy Eng. 2008, 130, 021012.1–021012.7. [Google Scholar] [CrossRef]
- Burkhardt III, J.J.; Garvin, A.H.; Craig, S.T. Life cycle assessment of a parabolic trough concentrating solar power plant and impacts of key design alternatives. Environ. Sci. Technol. 2011, 45, 2457–2464. [Google Scholar]
- Piemonte, V.; Falco, M.; Tarquini, P.; Giaconia, A. Life Cycle Assessment of a high temperature molten salt concentrated solar power plant. Solar Energy 2011, 85, 1101–1108. [Google Scholar] [CrossRef]
- Larraín, T.; Escobar, R. Net energy analysis for concentrated solar power plants in northern Chile. Renew. Energy 2011, 41, 123–133. [Google Scholar] [CrossRef]
- Zhang, M.; Wang, Z.; Xu, C.; Jiang, H. Embodied energy and emergy analyses of a concentrating solar power (CSP) system. Energy Policy 2011, 42, 232–238. [Google Scholar] [CrossRef]
- Elsam Engineering A/S. Life Cycle Assessment of Offshore and Onshore Sited Wind Farms; Technical Report; Elsam: Fredericia, Denmark, 2004. [Google Scholar]
- Khan, F.I.; Hawboldt, K.; Iqbal, M.T. Life cycle analysis of wind-fuel cell integrated system. Renew. Energy 2005, 30, 157–177. [Google Scholar] [CrossRef]
- Vestas Wind Systems A/S. Life Cycle Assessment of Electricity Produced from Onshore Sited Wind Power Plants Based on Vestas V82-1.65 MW Turbines; Technical Report; Vestas: Randers, Denmark, 2006. [Google Scholar]
- Vestas Wind Systems A/S. Life Cycle Assessment of Offshore and Onshore Sited Wind Power Plants Based on Vestas V90-3.0 MW Turbines; Technical Report; Vestas: Randers, Denmark, 2006. [Google Scholar]
- Lee, Y.; Tzeng, Y. Development and life-cycle inventory analysis of wind energy in Taiwan. J. Energy Eng. 2008, 134, 53–57. [Google Scholar] [CrossRef]
- Ardente, F.; Beccali, M.; Cellura, M.; Brano, V.L. Energy performances and life cycle assessment of an Italian wind farm. Renew. Sustain. Energy Rev. 2008, 12, 200–217. [Google Scholar] [CrossRef]
- Martínez, E.; Sanz, F.; Pellegrini, S.; Jiménez, E.; Blanco, J. Life-cycle assessment of a 2-MW rated power wind turbine: CML method. Int. J. Life Cycle Assess. 2009, 14, 52–63. [Google Scholar] [CrossRef]
- Weinzettel, J.; Reenaas, M.; Solli, C.; Hertwich, E.G. Life cycle assessment of a floating offshore wind turbine. Renew. Energy 2009, 34, 742–747. [Google Scholar] [CrossRef]
- Tremeac, B.; Meunier, F. Life cycle analysis of 4.5 MW and 250 W wind turbines. Renew. Sustain. Energy Rev. 2009, 13, 2104–2110. [Google Scholar] [CrossRef]
- Crawford, R.H. Life cycle energy and greenhouse emissions analysis of wind turbines and the effect of size on energy yield. Renew. Sustain. Energy Rev. 2009, 13, 2653–2660. [Google Scholar] [CrossRef]
- Kubiszewski, I.; Cleveland, C.; Endres, P. Meta-analysis of net energy return for wind power systems. Renew. Energy 2010, 35, 218–225. [Google Scholar] [CrossRef]
- Peter, G.; Klaus, R. Life Cycle Assessment of Electricity Production from a V80-2.0 MW Gridstreamer Wind Plant; Vestas Wind Systems A/S: Randers, Denmark, 2011. [Google Scholar]
- Peter, G.; Klaus, R. Life cycle assessment of electricity production from a V90-2.0 MW Gridstreamer wind plant; Vestas Wind Systems A/S: Randers, Denmark, 2011. [Google Scholar]
- Neil, D.S.; Erhi, G.D.; Peter, S. Life cycle assessment of electricity production from a Vestas V112 turbine wind plant; Vestas Wind Systems A/S: Randers, Denmark, 2011. [Google Scholar]
- Peter, G.; Klaus, R. Life cycle assessment of electricity production from a V100-1.8 MW Gridstreamer wind plant; Vestas Wind Systems A/S: Randers, Denmark, 2011. [Google Scholar]
- Chen, G.; Yang, Q.; Zhao, Y. Renewability of wind power in China: A case study of nonrenewable energy cost and greenhouse gas emission by a plant in Guangxi. Renew. Sustain. Energy Rev. 2011, 15, 2322–2329. [Google Scholar]
- Yang, Q.; Chen, G.; Zhao, Y.; Chen, B.; Li, Z.; Zhang, B.; Chen, Z.; Chen, H. Energy cost and greenhouse gas emissions of a Chinese wind farm. Procedia Environ. Sci. 2011, 5, 25–28. [Google Scholar] [CrossRef]
- Wagner, H.; Baack, C.; Eickelkamp, T.; Epe, A.; Lohmann, J.; Troy, S. Life cycle assessment of the offshore wind farm alpha ventus. Energy 2011, 36, 2459–2464. [Google Scholar] [CrossRef]
- Guezuraga, B.; Zauner, R.; Pölz, W. Life cycle assessment of two different 2 MW class wind turbines. Renew. Energy 2012, 37, 37–44. [Google Scholar] [CrossRef]
- Kabir, M.; Rooke, B.; Dassanayake, G.; Fleck, B. Comparative life cycle energy, emission, and economic analysis of 100 kW nameplate wind power generation. Renew. Energy 2012, 37, 133–141. [Google Scholar] [CrossRef]
- Fthenakis, V.; Kim, H. Photovoltaics: Life-cycle analyses. Solar Energy 2011, 85, 1609–1628. [Google Scholar] [CrossRef]
- Dale, M.; Benson, S.M. The Energy Balance of the Photovoltaic Industry-is the PV industry a net electricity producer? Environ. Sci. Technol. submitted for publication. 2013. [Google Scholar]
- Dones, R.; Bauer, C.; Bolliger, R.; Burger, B.; Faist Emmenegger, M.; Frischknecht, R.; Heck, T.; Jungbluth, N.; Röder, A.; Tuchschmid, M. Life Cycle Inventories of Energy Systems: Results for Current Systems in Switzerland and Other UCTE Countries; EcoInvent Report No. 5; Swiss Center for Life Cycle Inventories: St-Gallen, Switzerland, December 2007. [Google Scholar]
© 2013 by the authors; licensee MDPI, Basel, Switzerland. This article is an open access article distributed under the terms and conditions of the Creative Commons Attribution license (http://creativecommons.org/licenses/by/3.0/).