Article

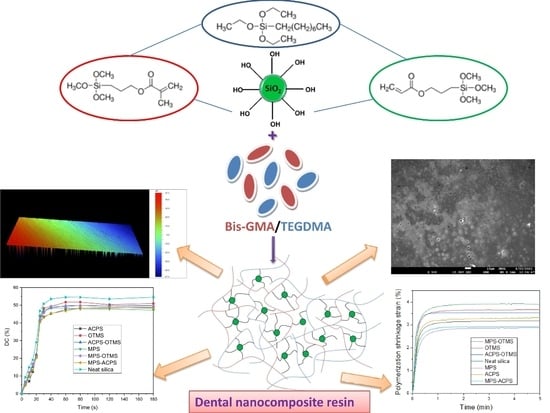
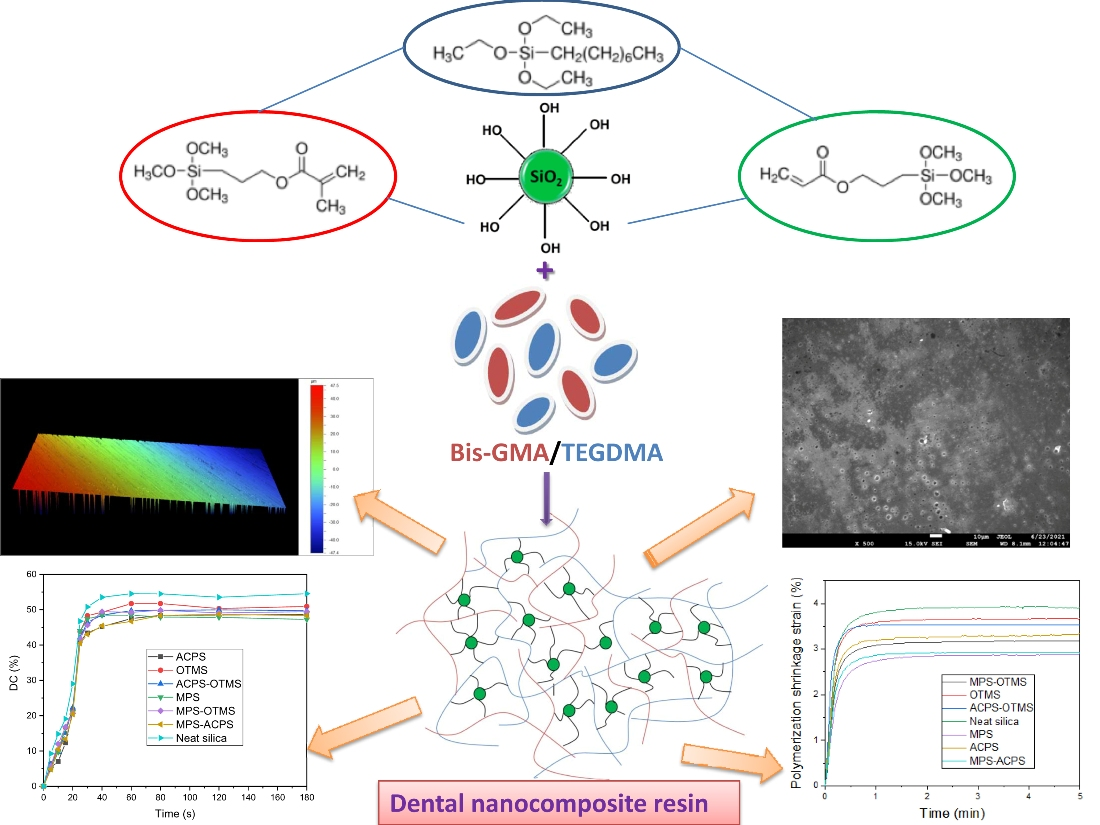
Effect of Silica Nanoparticles Silanized by Functional/Functional or Functional/Non-Functional Silanes on the Physicochemical and Mechanical Properties of Dental Nanocomposite Resins

by
Stefanos Karkanis
1,
Alexandros K. Nikolaidis
2,
Elisabeth A. Koulaouzidou
2 and
Dimitris S. Achilias
1,*
1
Laboratory of Polymer and Color Chemistry and Technology, Department of Chemistry, Aristotle University Thessaloniki, 541 24 Thessaloniki, Greece
2
Division of Dental Tissues’ Pathology and Therapeutics (Basic Dental Sciences, Endodontology and Operative Dentistry), School of Dentistry, Aristotle University Thessaloniki, 541 24 Thessaloniki, Greece
*
Author to whom correspondence should be addressed.
Appl. Sci. 2022, 12(1), 159; https://doi.org/10.3390/app12010159
Submission received: 20 November 2021 / Revised: 17 December 2021 / Accepted: 20 December 2021 / Published: 24 December 2021
(This article belongs to the Special Issue Recent Advances in Technology for Polymer Composite Materials)

Abstract

:
Dental nanocomposite resins have been proposed as potential restorative materials that are inevitably challenged with dynamic oral conditions. This investigation focused on the contribution of miscellaneous silane blends, used as coupling agents, to the ultimate performance of dental nanocomposite dimethacrylate resins. Herein, silica nanoparticles were initially silanized with functional/functional or functional/non-fuctional silane mixtures (50/50 wt/wt). Fourier transforms infrared (FTIR) spectroscopy and thermogravimetric analysis (TGA) verified the modification of nanosilica. The organomodified nanoparticles were then inserted into Bis-GMA/TEGDMA based resins by hand spatulation process. Scanning electron microscopy (SEM) findings revealed a broad distribution of fillers in the polymer network when reactive silanes and their corresponding blends were used. Furthermore, optical profilometry results showed that the presence of functional/non-functional mixtures can produce relatively smooth composite surfaces. Polymerization shrinkage was found to be limited upon the decrease of the degree of conversion regarding all the tested silane mixtures. The functional/functional silane blend assured the highest flexural properties and the lowest solubility after the storage of the nanocomposite in water for 1 week at 37 °C. The above experimental data could contribute to the proper designing of dental nanocomposite resins which may fit the modern clinical applications.

Graphical Abstract

1. Introduction

Over the last decades, composite resins dominated as dental restorative materials especially due to superior aesthetics, better operability, and toxicity concerns associated with amalgam [1]. In the oral cavity, dental restoratives are subjected to extremely dynamic conditions affecting their longevity such as high masticatory forces, pH and temperature variations, water sorption, bacterial attack, and enzymatic changes [2,3,4], while they are often challenged with polymerization shrinkage and marginal microleakage [5]. From the chemical point of view, dental composite resins mainly consist of methacrylate-based monomers like 2,2-Bis[p-(2′-hydroxy-3′-methacryloxypropoxy) phenylene]propane (Bis-GMA) and 1,6-bis(methacryloxy-2-ethoxycarbonylamino)-2,4,4-trimethylhexane (UDMA), co-monomers like triethylene glycol dimethacrylate (TEGDMA), reinforcing inorganic micro- and/or nanofillers (e.g., glass, silica, quartz), as well as organosilane compounds constituting the coupling agent between the polymer matrix and the reinforcing filler.
A strong binding between matrix-filler is generally assured through the covalent bond formation provoked by the presence of bifunctional trialkoxy silanes. The aforementioned process usually involves the copolymerization reaction between the methacrylated groups of monomers and the vinyl groups of the (meth)acrylic segment of the silane, as well as the condensation reaction between the silanol groups of filler and the corresponding intermediate silanols of silane produced after the hydrolysis of its alkoxy segments [6]. Hence, the derived siloxane Si-O-Si linkages lead to the formation of interface adhesion between the organic matrix and inorganic filler. This, in turn, might facilitate the stress transition from the flexible matrix to the stiffer filler particles resulting in improved mechanical performance of the dental composite resin [7,8,9]. Besides, this link contributes to the enhancement of the overall performance of the composite by protecting the filler against fracture while improving the resistance to hydrolytic degradation [10,11,12]. The successful matrix-filler bonding depends on the optimal matching between the organic functional group of the resin monomer and the functional group of the silane [13]. Undoubtedly, the most commonly functional silane coupling agent used in dental composites is 3-(trimethoxysilyl)propyl methacrylate (γ-MPS), which is proven to provide high interfacial stability, thus ensuring promising ultimate physicochemical and mechanical properties of the composite resin [14,15,16,17,18,19,20,21,22,23]. Other typical organofunctional silane coupling agents such as 3-acryloxypropyltrimethoxysilane (ACPS) [24], N-allylaminopropyltrimethoxysilane [25], quaternary ammonium silane compounds (QASiC) [26], 3-styrylethyltrimethoxysilane [24], vinyltrimethoxysilane [24], 3-(isocyanato)propyltriethoxysilane (UDMS) [24,27,28], 3-aminopropyltriethoxysilane (APTES), 3-glycidoxypropyltrimethoxysilane (GPS) [29,30], and styrylethyltrimethoxysilane (SETMS) [31] have also been extensively studied in the research field of dental composite resins.
Except for functional organosilanes, non-functional silanes containing an additional hydrolysable alkoxy group instead of a C=C group can also be utilized. For instance, the hydrophobic nature of octyltrimethoxysilane (OTMS) usually renders it preferable toward the limitation of the hydrolysis phenomena over the matrix-filler interfacial region [27,31,32,33] in dental composites, even if it interacts through weaker van der Waals forces. In some cases, non-functional silanes may have two silicon atoms, each one with three alkoxy groups capable of forming extensive cross-linking networks [34] into the composite. The bis-1,2-(triethoxysilyl)ethane (BTSE) [13,24,35,36,37,38,39], bis-[3-(trimethoxysilyl)propyl]amine [37], bis-1,6-(trichloroxysilyl)ethane (BISET), bis-1,6-(trichloroxysilyl)hexane (BISHEX), and bis-1,8-(trichloroxysilyl)octane (BISOCT) [40] are considered to serve as typical cross-linker silanes. In such a way, the formed stiff siloxane films can hinder the diffusion of water molecules inside the network [13], increasing the hydrolytic stability of the composite resin.
On the other hand, dual silanization is a process of inorganic filler modification with blends of functional with non-functional silanes in diverse mass ratios. The concept is generally based on the combining effect of the high reactivity derived from the functional silane and the hydrophobicity attributed to the non-functional silane, thus resulting in a robust matrix-filler interface in the composite. This technique finally offers improved handling properties of the uncured paste, a higher degree of double bond conversion during photopolymerization, better mechanical properties, and lower water sorption and polymerization stresses [33]. In particular, when blends of MPS/OTMS (50/50 wt/wt) and UDMS/OTMS (50/50 wt/wt) were used to silanize silica nanoparticles in Bis-GMA/TEGDMA composites, they were found to impart almost the same resistance against water sorption, whereas the sorption in ethanol/water solution was higher for the UDMS/OTMS blend. Moreover, composites with MPS/OTMS blend presented lower solubility than those containing UDMS/OTMS in both aqueous solutions [27]. The workability of the uncured composite paste containing silanized silica with MPS/OTMS can be better by increasing the mass fraction of OTMS, but the flexural modulus and strength decreased as the ratio of OTMS raised to 7.5% and 10% [32,33]. Biaxial flexure strength was higher for composites with MPS/OTMS modified silica in comparison with SETMS/OTMS (1/1 mass ratio), even if the strength was enhanced due to the presence of the latter [31]. Dual silanization of silica by incorporating the cross-linker BTSE in blends with MPS, ACPS, and UDMS showed that ACPS/BTSE can result in the highest flexural strength, whereas water uptake significantly reduced for MPS/BTSE blends [24].
In the present study, dental nanocomposite resins were synthesized by incorporating silica nanoparticles silanized with functional silanes of different polarity and non-functional silane individually, as well as with blends of different functional/non-functional and functional/functional silanes. More specifically, the gold standards of MPS, ACPS, and OTMS were preferred as control silanes, while the influence of the blend systems ACPS-OTMS and MPS-ACPS in the physicochemical and mechanical properties was investigated for the first time.

2. Materials and Methods

2.1. Materials

The monomers triethylene glycol dimethacrylate (TEGDMA), 95%, 2,2-Bis[p-(2′-hydroxy-3′-methacryloxypropoxy)phenylene]propane (Bis-GMA), and the solvent cyclohexane, ≥99.5%, were all provided by SIGMA-ALDRICH CHEMIE GmbH (Steinheim, Germany). The co-initiator 2-(dimethylamino)ethyl methacrylate (DMAEMA), 99%, and initiator camphorquinone, 98%, were purchased from J&K Scientific GmbH (Pforzheim, Germany). A commercially available fumed silica nanopowder, AEROSIL OX 50, specific surface area (BET) 35–65 m2·g−1 and purity ≥ 99.8%, was supplied by EVONIK GmbH (Hanau-Wolfgang, Germany). The 3-(trimethoxysilyl)propyl methacrylate (γ-MPS), 98%, used as a conventional methacrylate functionalized silane coupling agent, was purchased from J&K Scientific GmbH (Pforzheim, Germany). The octyltrimethoxysilane (OTMS), 96%, and 3-(trimethoxysilyl)propyl acrylate (ACPS), 92%, were provided by SIGMA-ALDRICH CHEMIE GmbH (Steinheim, Germany). The catalyst propylamine, ≥99.0%, was supplied from Merck KGaA (Darmstadt, Germany). All other chemicals used were of reagent grade.

2.2. Surface Modification of Nanosilica with Quaternary Ammonium Silane Coupling Agents

The minimum weight percent of silane theoretically needed for the silica silanization was calculated according to the following equation [32,41]:
Organosilane   wt % = Filler   surface   area   m 2 · g 1 Silane   surface   coverage   m 2 · g 1 × 100
Taking into account a nanosilica with 50 m2·g−1 specific surface area and γ-MPS molecules with 2525 m2·g−1 surface coverage [42], a 2 wt% amount of γ-MPS relative to silica was required for a complete silanization. Given that the molecular weights of the OTMS and ACPS silanes (234.41 and 234.32) are close to that of γ-MPS (248.35), the weight percent required for the minimum coverage of the silica will be about 2 wt%. However, the silane amount of 10 wt% relative to silica was considered to ensure a complete coverage of silica surface by silane [27].
The silica nanoparticles were silanized on the basis of the Chen and Brauer technique [43] by using either each silane alone (MPS, OTMS, ACPS) or blends of MPS/OTMS (50/50 wt/wt), ACPS/OTMS (50/50 wt/wt), and MPS/ACPS (50/50 wt/wt) respectively. Briefly, the nanosilica (5.0 ± 0.05 g), the organosilane (0.50 ± 0.01 g), cyclohexane (100 mL), and n-propylamine (0.1 ± 0.01 g) were mixed using a mechanical stirrer at room temperature for 30 min and then at 60 °C for 30 min. The solvent and volatile by-products were then removed at 60 °C by means of a rotary evaporator. The organically modified silica nanopowder (S.MPS, S.OTMS, S.ACPS, S.MPS/OTMS, S.ACPS/OTMS, S.MPS/ACPS) was further heated at 100 °C for 1 h in the rotary evaporator and finally dried at 80 °C in a vacuum oven for 20 h. The amount of each component in the final nanoparticles formed is included in Table 1.

2.3. Preparation of the Uncured Dental Composite Pastes

Five groups of experimental composites were prepared by initially mixing a Bis-GMA/TEGDMA base (50:50 wt/wt) which contained camphorquinone (0.2 wt%) and DMAEMA (0.8 wt%) as a photo-initiating system. Afterward, the neat nanosilica, S.MPS, S.OTMS, S.ACPS, S.MPS/OTMS, S.ACPS/OTMS, and S.MPS/ACPS nanoparticles were individually inserted in the resin by manual mixing until the powder was completely wetted with organic matrix, and the obtained mixture was ultrasonicated for 10 min. The nanofiller loading was determined to 60 wt% to ensure paste handling properties almost similar to a commercial dental composite resin.

2.4. Measuremens

2.4.1. Characterization of the Organically Modified Nanosilica

KBr disks of the obtained silica nanopowders were initially prepared by means of a manual hydraulic press and then measured by using a Spectrum One Perkin-Elmer FTIR spectrometer (PerkinElmer Inc., Waltham, MA, USA) in the scanning range of 3200–1350 cm−1. The resolution of the equipment was 4 cm−1. A commercial software Spectrum v5.0.1 (Perkin-Elmer LLC 1500F2429) was used to process and calculate all the data from the spectra.
Thermogravimetric analysis (TGA) was performed with a SETARAM SETSYS TG-DTA 16/18 instrument (Setaram instrumentation, Lyon, France). The Calisto program was employed to collect and process the data. The samples (8 ± 0.2 mg) were placed in 170 μL alumina crucibles, while a blank measurement was performed and subsequently was subtracted by the experimental curve in order to eliminate the buoyancy effect. Nanosilica powder samples were heated from ambient temperature up to 750 °C in a 10 mL·min−1 N2 flow at the heating rate of 10 °C min−1. Continuous recording of both sample temperature and sample weight was carried out. Thermal degradation onsets were taken from the initial peak of the derivative of the TGA curve across the mass loss transition.

2.4.2. Surface Morphology Measurements of Nanocomposite Resins

Scanning electron microscopy (SEM) was carried out using a JEOL JSM-6390LV (JEOL USA, Inc., Peabody, MA, USA) scanning microscope (0.5–30 kV) with a high resolution of 3 nm and equipped with an energy-dispersive X-ray (EDX) INCAPentaFETx3 (Oxford Instruments, Abingdon, UK) microanalytical system. All the studied surfaces were coated with carbon black to avoid charging under the electron beam. The samples were probed with a beam of electrons focused into a spot on the sample surface and the Smile ShotTM software was used to capture the microphotos.
For surface roughness measurements, circular specimens (10 × 2 mm) were prepared by filling a Teflon mold. The mold surfaces were overlaid with glass slides covered with a Mylar sheet to avoid air entrapping and adhesion of the final set material. The assembly was held together with spring clips and irradiated by overlapping on both sides with a LED polymerization unit (Bluephase® Style M8, Ivoclar Vivadent AG, FL-9494, Schaan, Liechtenstein) at 800 mW·cm−2 ± 10%. Each overlap irradiation lasted for 40 s. A radiometer (Hilux, Benlioglu Dental Inc., Ankara, Turkey) was used to verify the output irradiance of the light-curing device. All specimens were polished under water refrigeration using sandpaper with increasing grit (#400, 600, 1250) for 10 s at 150 rpm with an automatic polishing machine (Jean Wirtz TF250/2, Dusseldorf, Germany). The average surface roughness was evaluated by vertical scanning interferometry (VSI) using a 3D optical profilometer (Contour GT, BRUKER, Tucson, AZ, USA) and magnification ×10 Vision64™ software was used to acquire the data and compute the mean surface roughness in Sa units (nm) of each image. Five images were taken from each specimen and 3 specimens (n = 3) from each group were tested.

2.4.3. Physicochemical Properties

Polymerization shrinkage kinetics were conducted according to the “bonded-disk” method which was initially published and further refined by Watts and co-workers [44,45,46]. Briefly, a disk-shaped unset specimen with dimensions of 1.0 mm × 8.0 mm (height × diameter) was formed and centrally positioned upon a 3-mm-thick rigid glass plate. A flexible cover-slip diaphragm, supported by an outer peripheral brass ring with internal diameter circa 15 mm, was rested on the upper surface of the specimen disk so as to be adherent. A uniaxial LVDT (linear variable displacement transducer) measuring system was positioned centrally onto the cover slip. The signal from the LVDT was transmitted to a computer by a transducer indicator (E 309, RDP Electronics Ltd., Wolverhampton, UK) and a high-resolution analog-to-digital converter (ADAM-4016 acquisition module). The data acquisition was supported by the datalogger software AdvantechAdam/Apax.NET Utility, version 2.05.11. Measurements records were taken by continuous irradiation of specimens with the above LED polymerization unit for 5 min directly from beneath the glass plate at room temperature. Five repetitions (n = 5) were performed at each specimen. Strain was calculated as:
ε % = 100 × Δ L L 0
where ε (%) represents the strain (%) and ΔL and L0 are the shrinkage displacement and the initial specimen thickness, respectively.
Polymerization kinetics were performed by placing a small amount of each composite between two translucent Mylar strips, which were pressed to produce a very thin film. The films of unpolymerized composites were exposed to visible light as previously described, and immediately scanned by a Spectrum One Perkin–Elmer FTIR spectrometer (PerkinElmer Inc., Waltham, MA, USA) at different curing time intervals (0, 5, 10, 15, 20, 25, 30, 40, 60, 80, 120, 180 s). A spot of samples was placed between two NaCl crystals and spectra were obtained over the 4000–600 cm−1 region and acquired with a resolution of 4 cm−1 and a total of 32 scans per spectrum. A commercial software Spectrum v5.0.1 (Perkin-Elmer LLC 1500F2429) was used to process and calculate all the data from the spectra.
The area of aliphatic C=C peak absorption at 1637 cm−1 and the aromatic C=C peak absorption at 1580 cm−1 were determined utilizing a base line technique which proved the best fit to the Beer-Lambert law [47]. The aromatic C=C vibration was used as an internal standard. The percent degree of monomer conversion (DC%) of the cured specimen, which expresses the percent amount of double carbon bond reacted at each time period, was determined according to the equation:
DC % = 1 A 1637 A 1580 polymer A 1637 A 1580 monomer ×   100
Sorption of water and solubility characteristics were determined according to the method described in ISO 4049 [48]. For this purpose, four specimen discs (15 mm diameter × 1 mm thickness) were prepared for each composite material by filling a Teflon mold with the unpolymerized material as described above. The samples were irradiated for 40 s on each side by dividing them into nine overlapping irradiation zones and using the abovementioned LED polymerization unit. All the specimens were placed in a desiccator and transferred to a pre-conditioning oven at 37 ± 1 °C. After 24 h they were removed, stored in a second desiccator (23 ± 1 °C) for 2 h, and weighed to an accuracy of ±0.1 mg using a Sartorius TE 124S balance (Sartorius AG, Goetingen, Germany). This cycle was repeated until a constant mass (m1) was obtained. The mean thickness and mean diameter of each specimen were measured by means of a digital micrometer with ± 0.02 mm accuracy in order to calculate the volume (V). The discs were then immersed in water at 37 ± 1 °C for 7 days. Afterwards, they were removed, blotted dry to remove excess liquid, waved in the air for 15 s and weighed (m2). The specimens were then reconditioned to a constant mass (m3) in the desiccators using the previously described cycle.
The values for water sorption, Wsp (μg/mm3), were calculated according to the following equation:
W s p = m 2 m 3 V
where: m2 is the mass of the specimen (μg) after immersion in water for 7 days, m3 is the mass of the reconditioned specimen (μg), and V is the volume of the specimen (mm3).
The values for solubility, Wsl (μg/mm3), were calculated from the formula:
W s l = m 1 m 3 V
where: m1 is the conditioned mass (μg) of the specimen prior to immersion in water.

2.4.4. Mechanical Properties

For flexural tests, bar-specimens were prepared by filling a Teflon mold (2 mm × 2 mm × 25 mm) with unpolymerized paste in accordance with ISO 4049 [48]. The mold assembly was irradiated by overlapping on both sides with the abovementioned LED polymerization unit. Each overlap irradiation lasted for 40 s. Ten specimen bars (n = 10) were prepared for each nanocomposite. The specimens were stored in water for 7 days at 37 ± 1 °C after curing. Afterward, they were bent in a three-point transverse testing rig with 20 mm between the two supports (3-point bending). The rig was fitted to a universal testing machine (Testometric AX, M350-10kN, Testometric Co. Ltd., Rochdale, UK). All bend tests were carried out at a cross-head speed of 0.5 mm·min−1 until fracture occurred. The load and the corresponding deflection were recorded. The data were collected and processed by means of the software WinTest Ananlysis CX Version 3.5.30.10. The flexural modulus (E) in GPa and flexural strength (σ) in MPa were calculated according to the following equations:
E = F 1 l 3 4 bd 1 h 3 10 3   and   σ = 3   F max   l 2 bh 2
where: F1 is the load recorded in N, Fmax is the maximum load recorded before fracture in N, l is the span between the supports (20 mm), b is the width of the specimen in mm, h is the height of the specimen in mm, and d1 is the deflection (in mm) corresponding to the load F1.

3. Results and Discussion

3.1. Confirmation of Silica Silanization Reaction

FTIR spectra recorded for the hydrophilic nanosilica, as well as for the different silanized types of nanoparticles, are depicted in Figure 1. The measurements were taken in the narrow range of 3200–1350 cm−1 in order to avoid any possible attenuation of the interesting peaks induced by the much stronger intensities at 1100 and 810 cm−1, usually attributed to Si-O-Si and Si-OH vibrations of the neat nanoparticles [49]. Unlike the non-treated silica, the absorbance peaks from 2965 to 2844 cm−1 due to C-H stretching were detected for the total of the organomodified silica nanoparticles. Fillers modified with MPS, ACPS, and the blends of MPS-OTMS, ACPS-OTMS, and MPS-ACPS presented a peak at 1730 cm−1 assigned to C=O bonds of the methacrylated groups. The characteristic peak at 1640 cm−1 for the aforementioned silanes and at 1465 cm−1 revealed C=C stretching of vinyl groups and C-H bending vibrations correspondingly. These FTIR findings rather denote the successful silanization of silica nanoparticles with each tested organosilane system.
The thermal stability results associated with the pure silica and nanofillers modified with different silanes and their corresponding blends are illustrated in Figure 2. The TG plots of residual mass (%) versus temperature (Figure 2a) reflect the different degradation tendencies due to the presence and the variety of the silicas’ organic content. It can be seen that the overall mass loss for all tested nanoparticles varied from 3% to 6%. The samples of silanized silica exhibited mainly a two-step mass loss as the temperature raised with constant rate. In particular, the first step was accomplished at 300 °C with maximum degradation rates at 235 °C, 150 °C, 242 °C, 240 °C, 230 °C, and 227 °C for MPS, OTMS, MPS-OTMS, ACPS, ACPS-OTMS, and MPS-ACPS respectively, as was indicated by the differential thermogravimetric analysis curves, DTG (Figure 2b). This specific step could be ascribed to the removal of the absorbed moisture in the surface of silica and/or the removal of physically absorbed organosilanes [23,41]. The second step seemed to take place over 300 °C, that is, between 356–542 °C for MPS, 453–586 °C for OTMS, 405–567 °C for MPS-OTMS, 355–554 °C for ACPS, 387–571 °C for ACPS-OTMS, and 322–523 °C for MPS-ACPS (Figure 2a) accompanied with maximum degradation rates at 442 °C, 534 °C, 518 °C, 447 °C, 508 °C, and 446 °C (Figure 2b) correspondingly. The latter step is attributed to the removal of the silane molecules chemically bonded to the surface of silica and to the condensation of the surface silanol groups [41]. The non-treated silica showed a main degradation step relative to the loss of absorbed water molecules, while silane molecules were absent. Moreover, the silane blends exhibited inflection points within the temperatures of those of their initial silanes. Regarding the maximum degradation rates, the tested samples followed the sequence: OTMS > MPS-OTMS > ACPS-OTMS > ACPS > MPS-ACPS > MPS > Neat silica (Figure 2b). Taking into account the duration of thermal decomposition, the following decreasing order was observed: ACPS > MPS-ACPS > MPS > ACPS-OTMS > MPS-OTMS > OTMS > Neat silica, whereas the thermal stability of the studied nanoparticles was: Neat silica > MPS > OΤMS > ACPS > ACPS-OTMS > MPS-OTMS > MPS-ACPS (Figure 2a). A combining mass loss in relatively labile silane blends involving the thermal behavior effect of the starting silanes accounts for their lower stability in comparison with the individual organosilanes.
The above TGA observations in combination with the previous results obtained by FTIR measurements amplify the claim about the successful surface modification of nanosilica either with pure or with blend systems of different organosilanes.

3.2. Surface Morphology Evaluation of the Produced Dental Nanocomposite Resins

Figure 3a–g displays the SEM images which are representative for each dental nanocomposite obtained after the insertion of 60 wt% both neat and silane treated silica nanofillers. It is obvious that composites containing reactive silanes MPS and ACPS (Figure 3b,d), as well as their corresponding blends (Figure 3e–g), presented an extensive distribution of fillers, meaning that silica particles (bright regions) are homogeneously dispersed in the polymer network (dark regions). However, some small aggregates also well-dispersed in the cross-linked network did not seem to disrupt the overall homogeneity. There are many literature reports associating the presence of such clusters with the specific limitations interfering with the widely utilized mixing technique of hand spatulation [31,32,50,51,52]. Τhe untreated silica and the nanoparticles with non-reactive OTMS (Figure 3a,c) were not sufficiently dispersed in the polymer matrix, leading to the formation of large clusters in some regions and the absence of silica fillers in other sites of the composite surface. The last observation implied that the absence of a coupling agent or even of a non-reactive silane incapable of covalent bonding to the polymer matrix may exclude the nanofillers from the cross-linked network, thus affecting the formation of an integrated matrix-filler interface. This claim was further supported by the fact that the surface elemental analysis of the composites reinforced with neat silica and OTMS modified silica revealed different Si contents along the surface of the composite (Figure 4a,b), while the Si content was almost constantly distributed for the rest of dental nanocomposite resins (Figure 4c). By comparing the photos of the dental nanocomposites loaded with the two reactive silanes MPS and ACPS (Figure 3b,d), with those of the nanocomposites having their blends (Figure 3e–g), it can be considered that fewer agglomerates were formed by using ACPS and its blends. This is possibly due to the higher reactivity and ability of the ACPS to achieve a strong matrix-filler bonding.
Table 2 accumulates the mean surface roughness data () of the synthesized nanocomposite resins after the polishing treatment which is an essential step in dental clinical practice. Typical topographic surface maps involving a colorimetric scale of the induced peaks (red regions) and valleys (blue regions) are also provided in Figure 5a–g. The values obtained for each composite revealed that the different ways of the initial silica silanization may deeply influence the surface characteristics as they are arranged against the abrasive effect. Indeed, the nanocomposite resin containing 60 wt% ACPS-modified silica nanoparticles presented the smoothest surface ( = 127.41 nm, Figure 5d), while relatively irregular areas were characterized by the presence of OTMS (Figure 5c) corresponding to increased average roughness value ( = 254.26 nm). In the previous case, the high reactivity of ACPS silane favors the building of a strong matrix-filler interface which probably withstands the removal of matrix or/and fillers under the exertion of the abrasive stresses. The evaluation of surface roughness is well-considered to be crucial for dental restorative materials in terms of their aesthetics and their longevity in the oral environment. High values of are generally associated with high risk of mechanical properties deterioration, plaque formation, solubility of the polymer matrix provoked by acid attack of bacteria, discoloration, and gingival inflammation [53,54,55,56]. Based on the above criteria, the neat silica ( = 308 nm) and OTMS composites could rather not meet the clinical criteria due to their remarkably high values, while this trend was captured by the deep rough canals formed along the surface representing the grinding direction on the tested specimen (Figure 5a,c). In contrast, smoother surfaces were produced when composites were reinforced with nanosilica modified with blends of MPS and ACPS, whereas the co-occurrence of OTMS with ACPS somehow limited the total reactivity of the silane blend ACPS-OTMS, resulting in rougher composite surfaces ( = 169 nm, Figure 5f).

3.3. Polymerization Kinetics Evaluation

The dependence of the degree of conversion on photopolymerization time is depicted in Figure 6, and the ultimate DC (%) values gained for the tested nanocomposites are given in Table 2. According to Figure 6, the optimal curing time was 80 s when the DC approached the maximum value, while the final conversion of the synthesized dental nanocomposites fell in the range of 47%–55%, namely relatively close to the literature data for Bis-GMA/TEGDMA based composites ranging from 46.84% to 75% [17,23,30,57]. It is clear that an abrupt increase of the DC was achieved within a short period time due to the auto-acceleration or gel-effect attributed to the influence of the diffusion-controlled phenomena on the termination reaction [58]. A reduction in the increasing rate of DC was detected until a curve plateau was drawn, which is ascribed to the movement restriction of macroradicals due to the presence of the developed polymer network. The relatively low experimental DC values were obtained by virtue of the high viscosity of the formed mixture and to the glass-effect described by the effect of the diffusion phenomena on the propagation reaction, which stabilized and finally determined the DC [58,59,60,61]. The above data denoted the occurrence of high amounts of residual monomers in nanocomposites. A comparison between the prepared dental nanocomposite resins regarding their DC values eventually revealed the following sequence: Neat silica composite > OTMS composite > ACPS-OTMS composite > MPS-OTMS composite > ACPS composite> MPS-ACPS composite> MPS composite. It is obvious that nanocomposites incorporating silane blends exhibited DC values within those obtained by using their starting silane constituents. Furthermore, nanocomposites containing ACPS silane and its corresponding blends yielded higher conversion than their counterpart reinforced only with pure MPS. This attitude could be explained by the fact that the ACPS molecule contains one less methyl- group in comparison with MPS, rendering it more reactive as it constrains the macroradicals movement in a lower degree due to chemical hindrance. Hence, the ACPS silane provides more available double bonds which are potentially responsible for the achievement of higher DC values. Nevertheless, the composites filled with neat silica and OTMS silanized nanoparticles presented the highest conversions. Such type of nanoparticles have been considered as non-reactive environments [52], which might contribute to the facilitation of the dimethacrylate monomer movement during the development of polymer network, thus resulting in the increase of the number of reactant double bonds. On the contrary, the composite resins loaded with the functional silanes MPS and ACPS as well as the their blends may act rather as multifunctional monomers because of their methacrylate moieties, resulting in the condensed accumulation of the latter on the surface of silica. Under these dominant conditions, the macroradicals mobility is restricted and, thus, the gelation process occurs earlier, triggering the induction of DC in comparison with the nanocomposite resins having non-functional silanes [28].

3.4. Polymerization Shrinkage Evaluation

Polymerization shrinkage kinetics are demonstrated in Figure 7, and the ultimate linear strain values are listed in Table 2. Shrinkage during the photocuring process of a dental composite resin is attributed to the conversion of van der Waals spaces to shorter covalent bonds [62] that contribute monomers like TEGDMA [63] into the polymer network. As a result, internal contraction stresses are created, leading to deformation in the surrounding tooth structure [64]. The real-time strain measurements (Figure 7) showed a steep augmentation at the early stage of 0.17–1.29 min for the total of nanocomposites, yielding a profile which is very close to that described by Par et al. [65]. The calculated values of the ultimate strain recorded for the majority of the experimental nanocomposite resins are in accordance with those reported by Wang et al. for Bis-GMA/TEGDMA dental composites incorporating SiO2 particles and fibers, namely in the range of 3.9–2.5% [66]. Kleverlaan et al. also referred to 1.76–5.07% shrinkage regarding 17 commercially available dental composite resins [67]. Similar values have been also recorded for dental composites reinforced with clay nanoparticles [68]. Composite resins filled with the MPS-modified silica nanoparticles showed the lowest setting contraction (2.87%), whilst the addition of silanized particles with MPS blends increased the strain values. Even higher curing shrinkage was found for the nanocomposites containing the pure ACPS (3.35%) and its corresponding blend with OTMS. The highest setting contraction was finally observed when composites were loaded with non-treated silica and OTMS silanized nanofillers (3.68% and 3.65% respectively). The inorganic filler percentage, the molecular weight of involved monomers, and the degree of conversion are some parameters capable of affecting the shrinkage [62]. Herein, the overall tendency of the strain data almost followed the trend of degree of conversion, as polymerization shrinkage is directly related to the number of the reacted double bonds. It is worthy to point out that the enhancement with all the silane blends resulted in linear strain data within the values recorded for nanocomposites with the relative individual silanes.

3.5. Water Sorption and Solubility Parameters

The weight percentage data of water sorbed by the synthesized dental nanocomposite resins at 37 °C after their storage for 7 days are given in Table 3. It is well-accepted that the presence of fillers may have a strong impact on the sorption characteristics of the composite resin [69]. It can be seen that the composite filled with ACPS silanized nanosilica showed the highest sorption value (2.68 μg/mm3) relative to the other tested materials, maybe as a result of its strongest hydrophylicity, which is responsible for hydrogen bonding between ester groups of the methacrylate moiety and water molecules. Furthermore, both pure MPS and MPS blends containing composites exhibited lower water sorption in comparison with all ACPS counterparts, probably due to the presence of the additional methyl- group in the methacrylate segment of MPS, which renders it more hydrophobic. This susceptibility of the nanocomposites with ACPS and ACPS blends may also be ascribed to the occurrence of some microvoids detected on their surface by means of SEM (Figure 3d,f,g). As was expected, the OTMS-composite exhibited the highest water resistance (2.29 μg/mm3) owing to its non-polar nature. Regarding the dental nanocomposites reinforced with silane blends, they exhibited an intermediate water sorption performance in comparison with composites loaded only with the starting silanes. The water uptake for the composite containing neat silica (2.58 μg/mm3) is due to the free surface silanols of the filler, which easily absorb water molecules through hydrogen bonding.
Solubility results reflecting the amount of residual monomer extracted by water after 7 days aging at 37 °C are also provided in Table 3. During the polymerization process, the unreacted monomer is entrapped inside the microvoids formed between the macromolecular chains and remains intact in the cross-linked network. The nanocomposites with OTMS and OTMS coupling agents indicated the highest monomer release (0.39–0.56 μg/mm3), maybe due to the absence of methacrylate groups, which could be copolymerized with the dimethacrylated monomers, thus eliminating the amount of available monomers to be released in the aqueous environment. The observed tendency MPS composite < MPS-OTMS composite < OTMS composite was in accordance with the results found by Karabela et al. [27]. On the other hand, the reactive MPS, ACPS agents either alone or in the form of blend, can copolymerize with the dimethacrylate monomers and, hence, reduce the solubility of the composite in water. The relatively high DC of the composite filled with untreated silica may account for the controlled solubility to a slight level.

3.6. Flexural Properties

Comparative charts related to the flexural properties of the experimental dental nanocomposite resins are represented in Figure 8, while the calculated median values accompanied by their interquartile range (Q3–Q1) are clearly given in Table 3. According to the obtained results, the insertion of silanized nanosilica improved the stiffness of the formed composites. Typical flexural modulus values reported in the literature for analogue composites usually range almost from 1.40 to 4.5 GPa [14,17,19,21,23,25], namely, overlapping the data of the present study. Higher values up to 9.5–10.3 GPa mentioned in previous studies [24,28,30,31,66] could be associated with the applied shorter water aging time intervals. In particular, the overall trend of the modulus increment followed the scheme: MPS nanocomposite > MPS-ACPS nanocomposite > ACPS nanocomposite > ACPS-OTMS nanocomposite > MPS-OTMS nanocomposite > OTMS nanocomposite > Neat silica. The stiffness almost doubled for composites containing MPS (130.19%), MPS-ACPS (107.55%), and ACPS (93.71%) when compared with the counterpart filled with neat silica. The higher modulus of elasticity values being yielded by the functional silane-treated silica nanocomposites could rather be justified by the relatively better dispersion of the aforementioned particles in the polymer matrix (Figure 3b,d,g). The stiffness trend between ACPS and ACPS-OTMS composite is in contrast to the results reported by Matinlinna et al. wherein ACPS was mixed with the non-functional cross-linking silane BTSE [24]. A possible explanation could be that OTMS can provide three methoxy- groups available for silica silanization, instead of BTSE with six ethoxy- groups, which can result in more efficient coupling with silica and ultimately in more stable matrix-nanofiller interface of the composite.
In the present study, the maximum flexural strength of the composites was found 44.30 MPa, i.e., in some cases much lower than that reported by other researchers [14,15,21,32,66]. This observation is reliable, as the longer aging time utilized here intended to simulate an extreme condition as it happens in the oral cavity, where the composite would be even more effectively exposed to the water molecules, as the latter would have the time needed to reach a maximum diffusion into the polymer network and highly affect the mechanical performance. It is noteworthy that a similar to modulus attitude was also detected for the strength values. The silica silanization caused a nearly 3-fold increase in the resistance of dental resin against the exerted flexural stresses, especially for MPS (189.35%), followed by MPS-ACPS (179.75%) and ACPS (162.44%) nanocomposites. The well-dispersed filler particles in the polymer network of those nanocomposites might be responsible for the normal stress distribution at the matrix-filler interface, thus limiting the agglomeration of loadings and finally improving the flexural strength. In terms of the decreasing series MPS-ACPS composite > ACPS-OTMS composite > MPS-OTMS composite, it can be stated that these comparative findings are supported by the results of Wilson et al. [31], when the functional silane SETMS led to the strength sequence MPS-SETMS composite > SETMS-OTMS composite > MPS-OTMS composite.
It should be noticed here that it would be interesting to investigate the rheological properties of the resin prior to curing in order to assess the effect of surface functionality on the dispersion quality [70]. However, this could be the subject of another publication.

Author Contributions

Conceptualization, S.K., A.K.N., E.A.K. and D.S.A.; methodology, S.K. and A.K.N.; validation, E.A.K. and D.S.A.; formal analysis, S.K. and A.K.N.; investigation, S.K. and A.K.N.; resources, E.A.K.; data curation, A.K.N.; writing—original draft preparation, A.K.N.; writing—review and editing, E.A.K. and D.S.A.; supervision, E.A.K. and D.S.A.; project administration, A.K.N.; funding acquisition, E.A.K. and D.S.A. All authors have read and agreed to the published version of the manuscript.

Funding

This research received no external funding.

Institutional Review Board Statement

Not applicable.

Informed Consent Statement

Not applicable.

Acknowledgments

The experimental procedures were performed at the Department of Basic Dental Sciences, Division of Dental Tissues Pathology and Therapeutics, School of Dentistry, Faculty of Health Sciences, and at the Laboratory of Polymer and Color Chemistry and Technology, Department of Chemistry, Aristotle University of Thessaloniki, Greece. We would like to thank Theopoula Asimakidou for performing the TGA experiments. Authors would also like to thank the EVONIK GmbH (Hanau-Wolfgang, Germany) company for the donation of silica nanoparticles.

Conflicts of Interest

The authors declare no conflict of interest.

References

  1. Li, Z.; Zhang, H.; Xiong, G.; Zhang, J.; Guo, R.; Li, L.; Zhou, H.; Chen, G.; Zhou, Z.; Li, Q. A low-shrinkage dental composite with epoxy-polyhedral oligomeric silsesquioxane. J. Mech. Behav. Biomed. Mater. 2020, 103, 103515. [Google Scholar] [CrossRef] [PubMed]
  2. Barrett, R.D.; Bishara, S.E.; Quinn, J.K. Biodegradation of orthodontic appliances. Part I. Biodegradation of nickel and chromium in vitro. Am. J. Orthod. Dentofac. Orthop. 1993, 103, 8–14. [Google Scholar] [CrossRef]
  3. Eliades, T.; Athanasiou, A.E. In vivo aging of orthodontic alloys: Implications for corrosion potential, nickel release, and biocompatibility. Angle Orthod. 2002, 72, 222–237. [Google Scholar] [CrossRef] [PubMed]
  4. Verma, D.; Garg, P.K.; Dubey, A.K. Insights into the human oral microbiome. Arch. Microbiol. 2018, 200, 525–540. [Google Scholar] [CrossRef] [PubMed]
  5. Gerdolle, D.A.; Mortier, E.; Droz, D. Microleakage and polymerization shrinkage of various polymer restorative materials. J. Dent. Child. 2008, 75, 125–133. [Google Scholar]
  6. Bento, A.P.; Bickelhaupt, F.M. Nucleophilic Substitution at Silicon (SN2@Si) via a Central Reaction Barrier. J. Org. Chem. 2007, 72, 2201–2207. [Google Scholar] [CrossRef] [PubMed]
  7. Sideridou, I.D.; Karabela, M.M. Effect of the amount of 3-methacyloxypropyltrimethoxysilane coupling agent on physical properties of dental resin nanocomposites. Dent. Mater. 2009, 25, 1315–1324. [Google Scholar] [CrossRef] [PubMed]
  8. Antonucci, J.M.; Dickens, S.H.; Fowler, B.O.; Xu, H.H.K. Chemistry of silanes: Interfaces in dental polymers and composites. J. Res. Natl. Inst. Stand. Technol. 2005, 110, 541–558. [Google Scholar] [CrossRef] [PubMed]
  9. Tanimoto, Y.; Nishiwaki, T.; Nemoto, K.; Ben, G. Effect of filler content on bending properties of dental composites: Numerical simulation with the use of the finite-element method. J. Biomed. Mater. Res. 2004, 71B, 188–195. [Google Scholar] [CrossRef] [PubMed]
  10. Brown, S.K. Mechanisms of fracture in filled thermosetting resins. Br. Polym. J. 1980, 12, 24–30. [Google Scholar] [CrossRef]
  11. Mohsen, N.M.; Craig, R.G. Effect of silanation of fillers on their dispersability by monomer systems. J. Oral Rehabil. 1995, 22, 183–189. [Google Scholar] [CrossRef]
  12. Söderholm, K.-J. Degradation of Glass Filler in Experimental Composites. J. Dent. Res. 1981, 60, 1867–1875. [Google Scholar] [CrossRef]
  13. Matinlinna, J.; Özcan, M.; Lassila, L.; Kalk, W.; Vallittu, P. Effect of the cross-linking silane concentration in a novel silane system on bonding resin-composite cement. Acta Odontol. Scand. 2008, 66, 250–255. [Google Scholar] [CrossRef]
  14. Habib, E.; Wang, R.; Zhu, X.X. Monodisperse silica-filled composite restoratives mechanical and light transmission properties. Dent. Mater. 2017, 33, 280–287. [Google Scholar] [CrossRef]
  15. Hosseinalipour, M.; Javadpour, J.; Rezaie, H.; Dadras, T.; Hayati, A.N. Investigation of mechanical properties of experimental Bis-GMA/TEGDMA dental composite resins containing various mass fractions of silica nanoparticles. J. Prosthodont. 2010, 19, 112–117. [Google Scholar] [CrossRef]
  16. Kim, J.W.; Kim, L.U.; Kim, C.K. Size control of silica nanoparticles and their surface treatment for fabrication of dental nanocomposites. Biomacromolecules 2007, 8, 215–222. [Google Scholar] [CrossRef]
  17. Liu, X.; Wang, Z.; Zhao, C.; Bu, W.; Na, H. Preparation and characterization of silane-modified SiO 2 particles reinforced resin composites with fluorinated acrylate polymer. J. Mech. Behav. Biomed. Mater. 2018, 80, 11–19. [Google Scholar] [CrossRef]
  18. Miao, X.; Li, Y.; Zhang, Q.; Zhu, M.; Wang, H. Low shrinkage light curable dental nanocomposites using SiO2 microspheres as fillers. Mater. Sci. Eng. C 2012, 32, 2115–2121. [Google Scholar] [CrossRef]
  19. Rahim, T.N.A.T.; Mohamad, D.; Ismail, A.R.; Akil, H.M. Synthesis of nanosilica fillers for experimental dental nanocomposites and their characterisations. J. Phys. Sci. 2011, 22, 93–105. [Google Scholar]
  20. Rodríguez-Quirós, H.A.; Casanova-Yepes, H.F. Effect of the functionalization of silica nanoparticles as a reinforcing agent on dental composite materials. Rev. Fac. Ing. Univ. Antioq. 2015, 75, 36–44. [Google Scholar] [CrossRef]
  21. Rodríguez, H.A.; Kriven, W.M.; Casanova, H. Development of mechanical properties in dental resin composite: Effect of filler size and filler aggregation state. Mater. Sci. Eng. C 2019, 101, 274–282. [Google Scholar] [CrossRef] [PubMed]
  22. Zanchi, C.H.; Ogliari, F.A.; Marques e Silva, R.; Lund, R.G.; Machado, H.H.; Prati, C.; Carreño, N.L.V.; Piva, E. Effect of the silane concentration on the selected properties of an experimental microfilled composite resin. Appl. Adhes. Sci. 2015, 3, 27. [Google Scholar] [CrossRef] [Green Version]
  23. Karabela, M.M.; Sideridou, I.D. Synthesis and study of properties of dental resin composites with different nanosilica particles size. Dent. Mater. 2011, 27, 825–835. [Google Scholar] [CrossRef] [PubMed]
  24. Matinlinna, J.P.; Vallittu, P.K.; Lassila, L.V. Effects of Different Silane Coupling Agent Monomers on Flexural Strength of an Experimental Filled Resin Composite. J. Adhes. Sci. Technol. 2011, 25, 179–192. [Google Scholar] [CrossRef] [Green Version]
  25. Fronza, B.M.; Lewis, S.; Shah, P.K.; Barros, M.D.; Giannini, M.; Stansbury, J.W. Modification of filler surface treatment of composite resins using alternative silanes and functional nanogels. Dent. Mater. 2019, 35, 928–936. [Google Scholar] [CrossRef]
  26. Nikolaidis, A.K.; Koulaouzidou, E.A.; Gogos, C.; Achilias, D.S. Synthesis of Novel Dental Nanocomposite Resins by Incorporating Polymerizable, Quaternary Ammonium Silane-Modified Silica Nanoparticles. Polymers 2021, 13, 1682. [Google Scholar] [CrossRef]
  27. Karabela, M.; Sideridou, I. Effect of the structure of silane coupling agent on sorption characteristics of solvents by dental resin-nanocomposites. Dent. Mater. 2008, 24, 1631–1639. [Google Scholar] [CrossRef]
  28. Karabela, M.M.; Sideridou, I.D. Synthesis and study of physical properties of dental light-cured nanocomposites using different amounts of a urethane dimethacrylate trialkoxysilane coupling agent. Dent. Mater. 2011, 27, 1144–1152. [Google Scholar] [CrossRef]
  29. Wang, R.; Bao, S.; Liu, F.; Jiang, X.; Zhang, Q.; Sun, B.; Zhu, M. Wear behavior of light-cured resin composites with bimodal silica nanostructures as fillers. Mater. Sci. Eng. C 2013, 33, 4759–4766. [Google Scholar] [CrossRef]
  30. Wang, R.; Zhang, M.; Liu, F.; Bao, S.; Wu, T.; Jiang, X.; Zhang, Q.; Zhu, M. Investigation on the physical–mechanical properties of dental resin composites reinforced with novel bimodal silica nanostructures. Mater. Sci. Eng. C 2015, 50, 266–273. [Google Scholar] [CrossRef]
  31. Wilson, K.S.; Antonucci, J.M. Interphase structure–property relationships in thermoset dimethacrylate nanocomposites. Dent. Mater. 2006, 22, 995–1001. [Google Scholar] [CrossRef]
  32. Wilson, K.S.; Zhang, K.; Antonucci, J.M. Systematic variation of interfacial phase reactivity in dental nanocomposites. Biomaterials 2005, 26, 5095–5103. [Google Scholar] [CrossRef]
  33. Wilson, K.; Allen, A.; Washburn, N.; Antonucci, J. Interphase Effects in Dental Nanocomposites Investigated by Small-Angle Neutron Scattering. J. Biomed. Mater. Res. 2007, 81A, 113–123. [Google Scholar] [CrossRef]
  34. Matinlinna, J. Silane Chemistry Aspects in Some conventional and Novel Dental Biomaterials. Ph.D. Thesis, University of Turku, Turku, Finland, 2004. [Google Scholar]
  35. Khan, A.A.; Al Kheraif, A.A.; Syed, J.; Divakar, D.D.; Matinlinna, J.P. Enhanced resin titanium adhesion with silane primers using tribochemical silica-coating. Dent. Mater. J. 2017, 36, 111–116. [Google Scholar] [CrossRef] [Green Version]
  36. Matinlinna, J.P.; Lassila, L.V.J.; Vallittu, P.K. The effect of three silane coupling agents and their blends with a cross-linker silane on bonding a bis-GMA resin to silicatized titanium (a novel silane system). J. Dent. 2006, 34, 740–746. [Google Scholar] [CrossRef]
  37. Lung, C.Y.K.; Kukk, E.; Matinlinna, J.P. Shear bond strength between resin and zirconia with two different silane blends. Acta Odontol. Scand. 2012, 70, 405–413. [Google Scholar] [CrossRef] [Green Version]
  38. Durgesh, B.H.; Alhijji, S.; Hashem, M.I.; Kheraif, A.A.A.; Malash, A.M.; Divakar, D.D.; Shahrani, O.A.A.; Asmari, M.A.; Matinlinna, J.P. Evaluation of an Experimental Silane Primer System in Promoting Adhesion Between Orthodontic Bracket and Ceramic. J. Biomater. Tissue Eng. 2016, 6, 239–245. [Google Scholar] [CrossRef]
  39. Khan, A.A.; Al Kheraif, A.A.; Syed, J.; Divakar, D.D.; Matinlinna, J.P. Effect of experimental primers on hydrolytic stability of resin zirconia bonding. J. Adhes. Sci. Technol. 2017, 31, 1094–1104. [Google Scholar] [CrossRef]
  40. Kurata, S.; Yamazaki, N. Effect of Silane Coupling Agents with a Bisfunctional Hydrolyzable Group. Dent. Mater. J. 1993, 12, 127–135, 272. [Google Scholar] [CrossRef] [Green Version]
  41. Liu, Q.; Ding, J.; Chambers, D.E.; Debnath, S.; Wunder, S.L.; Baran, G.R. Filler-coupling agent-matrix interactions in silica/polymethylmethacrylate composites. J. Biomed. Mater. Res. 2001, 57, 384–393. [Google Scholar] [CrossRef]
  42. Söderholm, K.-J.M.; Shang, S.-W. Molecular Orientation of Silane at the Surface of Colloidal Silica. J. Dent. Res. 1993, 72, 1050–1054. [Google Scholar] [CrossRef]
  43. Chen, T.M.; Brauer, G.M. Solvent Effects on Bonding Organo-silane to Silica Surfaces. J. Dent. Res. 1982, 61, 1439–1443. [Google Scholar] [CrossRef]
  44. Watts, D.; Marouf, A. Optimal specimen geometry in bonded-disk shrinkage-strain measurements on light-cured biomaterials. Dent. Mater. 2000, 16, 447–451. [Google Scholar] [CrossRef]
  45. Watts, D. Photo-polymerization shrinkage-stress kinetics in resin-composites: Methods development. Dent. Mater. 2003, 19, 1–11. [Google Scholar] [CrossRef]
  46. Al Sunbul, H.; Silikas, N.; Watts, D.C. Polymerization shrinkage kinetics and shrinkage-stress in dental resin-composites. Dent. Mater. 2016, 32, 998–1006. [Google Scholar] [CrossRef] [Green Version]
  47. Rueggeberg, F.A.; Hashinger, D.T.; Fairhurst, C.W. Calibration of FTIR conversion analysis of contemporary dental resin composites. Dent. Mater. 1990, 6, 241–249. [Google Scholar] [CrossRef]
  48. International Organization for Standardization. ISO 4049:2000 (E) Dentistry—Polymer-Based Filling, Restorative and Luting Materials; ISO: Geneva, Switzerland, 2000. [Google Scholar]
  49. Nikolaidis, A.K.; Koulaouzidou, E.A.; Achilias, D.S. Synthesis and Characterization of Novel Organomodified Nanoclays for Application in Dental Materials. Curr. Nanosci. 2019, 15, 512–524. [Google Scholar] [CrossRef]
  50. Halvorson, R.H.; Erickson, R.L.; Davidson, C.L. The effect of filler and silane content on conversion of resin-based composite. Dent. Mater. 2003, 19, 327–333. [Google Scholar] [CrossRef]
  51. Gonçalves, F.; Kawano, Y.; Pfeifer, C.; Stansbury, J.W.; Braga, R.R. Influence of BisGMA, TEGDMA, and BisEMA contents on viscosity, conversion, and flexural strength of experimental resins and composites. Eur. J. Oral Sci. 2009, 117, 442–446. [Google Scholar] [CrossRef]
  52. Sideridou, I.D.; Karabela, M.M. Effect of the structure of silane-coupling agent on dynamic mechanical properties of dental resin-nanocomposites. J. Appl. Polym. Sci. 2008, 110, 507–516. [Google Scholar] [CrossRef]
  53. Mourouzis, P.; Koulaouzidou, E.A.; Vassiliadis, L.; Helvatjoglu-Antoniades, M. Effects of sonic scaling on the surface roughness of restorative materials. J. Oral Sci. 2009, 51, 607–614. [Google Scholar] [CrossRef] [PubMed] [Green Version]
  54. Griggs, J.A.; Thompson, J.Y.; Anusavice, K.J. Effects of flaw size and auto-glaze treatment on porcelain strength. J. Dent. Res. 1996, 75, 1414–1417. [Google Scholar] [CrossRef] [PubMed]
  55. De Jager, N.; Feilzer, A.J.; Davidson, C.L. The influence of surface roughness on porcelain strength. Dent. Mater. 2000, 16, 381–388. [Google Scholar] [CrossRef]
  56. Yilmaz, C.; Korkmaz, T.; Demirköprülü, H.; Ergün, G.; Ozkan, Y. Color stability of glazed and polished dental porcelains. J. Prosthodont. 2008, 17, 20–24. [Google Scholar] [CrossRef]
  57. Ruyter, I.E.; Øysaed, H. Composites for use in posterior teeth: Composition and conversion. J. Biomed. Mater. Res. 1987, 21, 11–23. [Google Scholar] [CrossRef]
  58. Achilias, D.S. A Review of Modeling of Diffusion Controlled Polymerization Reactions. Macromol. Theory Simul. 2007, 16, 319–347. [Google Scholar] [CrossRef]
  59. Achilias, D.S.; Verros, G.D. Modeling of diffusion-controlled reactions in free radical solution and bulk polymerization: Model validation by DSC experiments. J. Appl. Polym. Sci. 2010, 116, 1842–1856. [Google Scholar] [CrossRef]
  60. Verros, G.D.; Achilias, D.S. Modeling gel effect in branched polymer systems: Free-radical solution homopolymerization of vinyl acetate. J. Appl. Polym. Sci. 2009, 111, 2171–2185. [Google Scholar] [CrossRef]
  61. Verros, G.D.; Latsos, T.; Achilias, D.S. Development of a unified framework for calculating molecular weight distribution in diffusion controlled free radical bulk homo-polymerization. Polymer 2005, 46, 539–552. [Google Scholar] [CrossRef]
  62. Peutzfeldt, A. Resin composites in dentistry: The monomer systems. Eur. J. Oral Sci. 1997, 105, 97–116. [Google Scholar] [CrossRef]
  63. Luo, S.; Liu, F.; He, J. Preparation of low shrinkage stress dental composite with synthesized dimethacrylate oligomers. J. Mech. Behav. Biomed. Mater. 2019, 94, 222–228. [Google Scholar] [CrossRef]
  64. Ferracane, J.L.; Mitchem, J.C. Relationship between composite contraction stress and leakage in Class V cavities. Am. J. Dent. 2003, 16, 239–243. [Google Scholar]
  65. Par, M.; Mohn, D.; Attin, T.; Tarle, Z.; Tauböck, T.T. Polymerization shrinkage behaviour of resin composites functionalized with unsilanized bioactive glass fillers. Sci. Rep. 2020, 10, 15237. [Google Scholar] [CrossRef]
  66. Wang, X.; Cai, Q.; Zhang, X.; Wei, Y.; Xu, M.; Yang, X.; Ma, Q.; Cheng, Y.; Deng, X. Improved performance of Bis-GMA/TEGDMA dental composites by net-like structures formed from SiO2 nanofiber fillers. Mater. Sci. Eng. C 2016, 59, 464–470. [Google Scholar] [CrossRef]
  67. Kleverlaan, C.J.; Feilzer, A.J. Polymerization shrinkage and contraction stress of dental resin composites. Dent. Mater. 2005, 21, 1150–1157. [Google Scholar] [CrossRef]
  68. Nikolaidis, A.K.; Koulaouzidou, E.A.; Gogos, C.; Achilias, D.S. Synthesis and Characterization of Dental Nanocomposite Resins Filled with Different Clay Nanoparticles. Polymers 2019, 11, 730. [Google Scholar] [CrossRef] [Green Version]
  69. Ferracane, J.L. Hygroscopic and hydrolytic effects in dental polymer networks. Dent. Mater. 2006, 22, 211–222. [Google Scholar] [CrossRef]
  70. Aliabadian, E.; Sadeghi, S.; Kamkar, M.; Chen, Z.; Sundararaj, U. Rheology of fumed silica nanoparticles/partially hydrolyzed polyacrylamide aqueous solutions under small and large amplitude oscillatory shear deformations. J. Rheol. 2018, 62, 1197–1216. [Google Scholar] [CrossRef]
Figure 1. Comparative FTIR spectra between untreated and diverse organomodified silica nanoparticles.
Applsci 12 00159 g001
Figure 2. (a) TG comparative scans reflecting the different thermal stability of the tested silica nanoparticles; (b) DTG curves for neat and silica nanoparticles treated with different types of organosilanes.
Applsci 12 00159 g002
Figure 3. SEM microphotos taken for dental nanocomposite resins filled with 60 wt% of: (a) neat silica; (b) MPS; (c) OTMS; (d) ACPS; (e) MPS-OTMS; (f) ACPS-OTMS; and (g) MPS-ACPS-treated silica nanoparticles (×500 magnification).
Applsci 12 00159 g003aApplsci 12 00159 g003b
Figure 4. EDX elemental analysis spectra showing: (a) typical regions with high Si content for composites filled with neat silica and OTMS silica; (b) typical regions with low Si content for composites filled with neat silica and OTMS silica; and (c) typical regions for nanocomposites with MPS, ACPS, and their combinations between them and OTMS.
Applsci 12 00159 g004aApplsci 12 00159 g004b
Figure 5. Surface topography characteristics measured by a 3D optical profilometer after the polishing treatment of the obtained dental nanocomposite resins containing 60 wt% of: (a) neat silica; (b) MPS; (c) OTMS; (d) ACPS; (e) MPS-OTMS; (f) ACPS-OTMS; and (g) MPS-ACPS-treated silica nanoparticles.
Applsci 12 00159 g005aApplsci 12 00159 g005b
Figure 6. Degree of conversion (DC %) versus curing time for the experimental dental nanocomposite resins reinforced with 60 wt% of different types of silica nanoparicles.
Applsci 12 00159 g006
Figure 7. Time dependence of polymerization shrinkage strain of the synthesized dental nanocomposite resins containing 60 wt% of diverse types of untreated and organically modified nanosilica.
Applsci 12 00159 g007
Figure 8. (a) Flexural modulus bar plots; (b) Flexural resistance box plots for the experimental dental nanocomposite resins filled with different silica nanofillers.
Applsci 12 00159 g008
Table 1. Materials used to prepare each nanoparticle.
Materials
CodeFumed Silica Nanopowder (AEROSIL OX 50)3-(Trimethoxysilyl)propyl methacrylate (γ-MPS) (Amount wt% Relative to Silica)Octyltrimethoxysilane (OTMS) (Amount wt% Relative to Silica)3-(Trimethoxysilyl)propyl acrylate (ACPS) (Amount wt% Relative to Silica)
Neat silica100%---
MPS10--
OTMS-10-
ACPS--10
MPS-OTMS55-
ACPS-OTMS-55
MPS-ACPS5-5
Table 2. Surface roughness (median values ± interquartile range, IQR), curing kinetics, and polymerization shrinkage data (median values ± IQR) calculated for the synthesized dental nanocomposite resins.
NanocompositeSurface Roughness, (nm)Final DC (%)Total Strain (%)
Neat silica308.00 ± 336.0854.53.68 ± 0.34
MPS227.23 ± 204.8447.22.87 ± 0.35
OTMS254.26 ± 261.4050.93.65 ± 0.15
ACPS127.41 ± 49.3948.63.35 ± 0.53
MPS-OTMS140.50 ± 19.0049.43.18 ± 0.39
ACPS-OTMS169 ± 101.0049.73.51 ± 0.56
MPS-ACPS171.5 ± 74.0048.32.91 ± 0.60
Table 3. Total median values ± interquartile range (IQR) for flexural modulus, flexural strength, and sorption/solubility parameters for dental nanocomposite resins after storage in water at 37 ± 1 °C for 7 days.
Nanocomposite Sorption, Wsp (μg/mm3)Solubility, Wsl (μg/mm3)Flexural Modulus (GPa)Flexural Strength (MPa)
Neat silica2.58 ± 0.510.08 ± 0.09 1.59 ± 0.81 15.31 ± 3.66
MPS2.48 ± 0.430.32 ± 0.17 3.66 ± 0.6744.30 ± 21.23
OTMS2.29 ± 0.150.56 ± 0.131.75 ± 0.7115.38 ± 23.45
ACPS 2.68 ± 0.840.16 ± 0.10 3.08 ± 0.40 40.18 ± 7.48
MPS-OTMS2.34 ± 0.26 0.49 ± 0.15 2.04 ± 0.62 22.21 ± 12.63
ACPS-OTMS 2.52 ± 0.25 0.39 ± 0.162.60 ± 0.9230.65 ± 10.53
MPS-ACPS2.72 ± 0.29 0.25 ± 0.11 3.30 ± 0.9342.83 ± 9.20
Publisher’s Note: MDPI stays neutral with regard to jurisdictional claims in published maps and institutional affiliations.

