
A Low-Cost System for Measuring Wind Speed and Direction Using Thermopile Array and Artificial Neural Network

Department of Mechanical Engineering, Kun Shan University, No.195, Kunda Rd., Yongkang Dist., Tainan City 710, Taiwan
*
Author to whom correspondence should be addressed.
Appl. Sci. 2021, 11(9), 4024; https://doi.org/10.3390/app11094024
Submission received: 19 April 2021
/
Revised: 27 April 2021
/
Accepted: 27 April 2021
/
Published: 28 April 2021
(This article belongs to the Collection Intelligence Systems and Sensors II)
Abstract
:Featured Application
The proposed system can be used as a low-cost alternative to anemometers and wind vane for applications in residential hybrid renewable energy systems.
Abstract
Recent developments in wind speed sensors have mainly focused on reducing the size and moving parts to increase reliability and stability. In this study, the development of a low-cost wind speed and direction measurement system is presented. A heat sink mounted on a self-regulating heater is used as means to interact with the wind changes and a thermopile array mounted atop of the heat sink is used to collect temperature data. The temperature data collected from the thermopile array are used to estimate corresponding wind speed and direction data using an artificial neural network. The multilayer artificial neural network is trained using 96 h data and tested on 72 h data collected in an outdoor setting. The performance of the proposed model is compared with linear regression and support vector machine. The test results verify that the proposed system can estimate wind speed and direction measurements with a high accuracy at different sampling intervals, and the artificial neural network can provide significantly a higher coefficient of determination than two other methods.
1. Introduction
The popularity and necessity of renewable energy is creating the demand for residential hybrid renewable energy systems (HRES). Renewable energy is not only essential for reducing pollution but also in order to satisfy the ever-increasing demand for energy. To efficiently manage energy generated HRESs, real-time monitoring of wind speed is required by many renewable energy related systems. Wind speed is crucial for computing/estimating wind power output [1,2], as well as solar power output [3,4]. Commercial wind speed sensors are mainly of three types: (a) rotary/cup anemometer, (b) hot-wire anemometer and (c) ultrasonic anemometers. Although, each of these types has different working principles, their market prices are notably high for residential usage applications. Wind speed data are broadly used for wind energy potential analysis, as presented in [5,6,7]. Similarly, wind speed data are also used for optimal sizing of renewable energy systems [8,9,10,11], energy management systems relying on weather forecasts [12,13,14,15].
The wind speed and wind direction data are invaluable for renewable energy potential analysis and renewable energy generation applications. However, many challenges regarding current technologies for measuring the wind speed and wind direction include:
- Rotating parts in cup anemometers and wind vanes are prone to degradation and faults over time and result in inaccurate readings.
- Many applications are constrained by size, and a wind flow trajectory may not be suitable for rotating anemometers.
- In order to encourage the use of such sensors in residential setups, the cost of a system should be affordable.
- Costs of wind speed and direction measurement systems are highly influenced by the components used for sensing the wind attributes. Therefore, technology that is more sophisticated may provide a higher accuracy but may lead to significantly higher system costs.
Several studies on the development of anemometers rely on expensive and complex manufacturing processes. However, such systems are not accessible to general/residential users due to the initial capital restrictions. In this study, we developed a low-cost high-accuracy wind speed and direction sensing system using a thermopile array, a positive temperature coefficient (PTC) heating element and a heat sink. The heat sink is used as a heat exchange between the PTC heater and the environment, i.e., wind behavior. An independent temperature sensor is used for collecting the ambient temperature data as changes in ambient temperature influence sensing accuracy of thermal anemometers [16,17]. The major contributions of this study are:
- This study reports on the development of a low-cost wind speed and direction sensing system using easily available and low-cost components, including a thermopile array, a PTC heater, a heat sink, and an ambient temperature sensor.
- The proposed device does not have any rotating or moving parts, hence, it requires less maintenance and can transfer measurement data wirelessly without a need for wires.
- The use of an artificial neural network (ANN) to estimate the wind speed and direction from the thermal distribution using data collected from the thermopile array and ambient temperature sensor with a high coefficient of determination (R2 score) at different sampling intervals.
In order to evaluate the accuracy of our system, we compared the wind speed and direction estimated with respect to a cup anemometer and a wind vane, respectively. We use support vector machine (SVM) [18] and linear regression (LR) [19] with least squares to compare the estimation accuracy of wind speed and direction using the thermopile data against an ANN method. Selection of SVM and LR methods for comparison is based on their applicability and popularity for use in signal processing, regression and prediction tasks, as discussed in Section 2. In addition to the contributions stated above, the proposed systems also collects thermopile and ambient temperature data which are transferred to a computing device wirelessly at an interval of 2 s.
- An artificial neural network (ANN) is trained on the thermopile array, and ambient temperature sensor data can provide a significantly higher R2 score for wind speed and direction estimation than the SVM and LR methods.
- For the evaluation of system, 96 h of data are used for training the ANN model and 72 h of data are used for the testing the model performance.
This paper is structured as follows: in Section 2, a brief discussion of related work and research is presented. Section 3 introduces the mechanical design and working principle of the proposed system. In Section 4 the collected dataset, regression results and comparison between different regression methods are discussed. Section 5 draws the conclusion for the presented study and discusses limitations and future directions.
2. Related Works
Over the years, there have been many developments in wind speed and direction sensing and making devices without rotating parts using ultrasonic or thermal technology has been the primary focus. In [20], a three-dimensional (3D) ultrasonic anemometer was developed based on the geometric placement of sensors. Based on the results, the system could estimate relatively higher wind speeds with good accuracy. Using micro-electromechanical systems (MEMS), the authors of [21] developed a low power ultrasonic anemometer using adaptive phase tracking. Additionally, in [22] a 3D ultrasonic anemometer is discussed using an ultrasonic sensor array that can provide accurate wind speed and direction measurements. Unlike ultrasonic sensors, thermal anemometers are based on the principle of heat exchange through interaction of a heated element with wind. Hot-wire anemometers [23,24,25] are popular thermal-type wind speed sensors that require minimal installation space and are portable for mobile operations. However, hot-wire anemometers can only measure wind/flow speed. In [26], a thermoelectric-type anemometer is developed that can measure wind speed with a high accuracy while keeping the power consumption ultra-low. Thermal anemometers have great potential as they can miniaturized, and due to their solid-state sensing capabilities, they require minimal maintenance. In [27], a solid-state anemometer is developed using thermal flow sensors that can, not only estimate the wind speed, but also the direction. Several research efforts on micro-machined two-dimensional thermal wind sensors can be found in [28], which focus on making solid-state anemometers smaller, more energy efficient and less sensitive to other environmental factors. Some major recent contributions to the wind speed sensing systems include the work in [29] which develops a piezoelectric wind speed sensor by establishing a mathematical relationship between wind velocity and a piezoelectric film’s vibration frequency. A portable anemometer with spherical structure proposed in [30], which uses the differential pressure measurement across two non-intersecting tunnels to estimate fixed-point wind velocity and direction with a high degree of accuracy. In another development, a wearable anemometer is presented by the authors of [31], where wind velocity and direction are estimated through a thermal flow sensor, triaxial accelerometer and triaxial magnetometer. Reference [32] discusses the development of a miniature thermal wind sensor based on constant power control and the temperature distribution principle.
Accurate wind speed measurements are important for reliable wind speed predictions and accurate wind energy assessment. Reference [33] introduces a method for offshore wind speed assessment using global wind speed datasets and in situ measurements. Most of the research on wind speed prediction on a short-term horizon relies on historical wind speed data. In [34], a short-term wind speed prediction model is proposed using variational mode decomposition (VMD) and a genetic algorithm ANN. The proposed model in [34] achieved a higher accuracy than other models in comparison. In [35], a hybrid evolutionary model was used to improve the accuracy of a long-term short-term memory neural network (LSTM) for short-term wind speed forecasting. In [36], a wind speed prediction method is introduced using ANN and wind speed measurements collected from multiple local sites. A stochastic optimization assisted ANN is used for short-term wind speed prediction in [37]. Apart from ANN, many other machine learning models have also been used for wind speed forecasting. In [38], a hybrid mode decomposition was used with an extreme learning machine in order to develop an outlier robust wind speed forecasting model. Reference [39] proposes a direct multistep wind speed prediction model by combining a self-adaptive data processing method with fuzzy entropy and a LSTM neural network. Reference [40] proposes a preprocessing-free model for multi-step wind speed forecasting using residual causal convolutional network, non-linear attention and sliding window technique. Support vector machines are also used for wind speed prediction tasks [41,42].
Apart from wind speed prediction tasks, machine learning models are used for several generic prediction, calibration and signal processing tasks. In [43], SVM regression is used to transfer the calibration between electronic noses for air pollution detection. SVM was also used in [44] for the calibration of a six-component force/torque transducer. In [45], a hot-wire anemometer calibration method is presented using Gaussian process regression and uncertainty awareness. Many studies rely on ANN models for signal processing, such as the methodologies proposed in [46,47]. ANN model performance is often compared against SVM [40,48,49,50,51,52,53], since SVM is generally used for similar applications to ANN and, in some cases, provides superior accuracy and has more deterministic results as opposed to the stochastic nature of ANN. Another relatively simple method for multivariate analysis and regression is LR [54,55,56,57,58], which also popular due to its simplicity, interpretability and minimal computing requirements.
3. Methodology
3.1. Design of Device
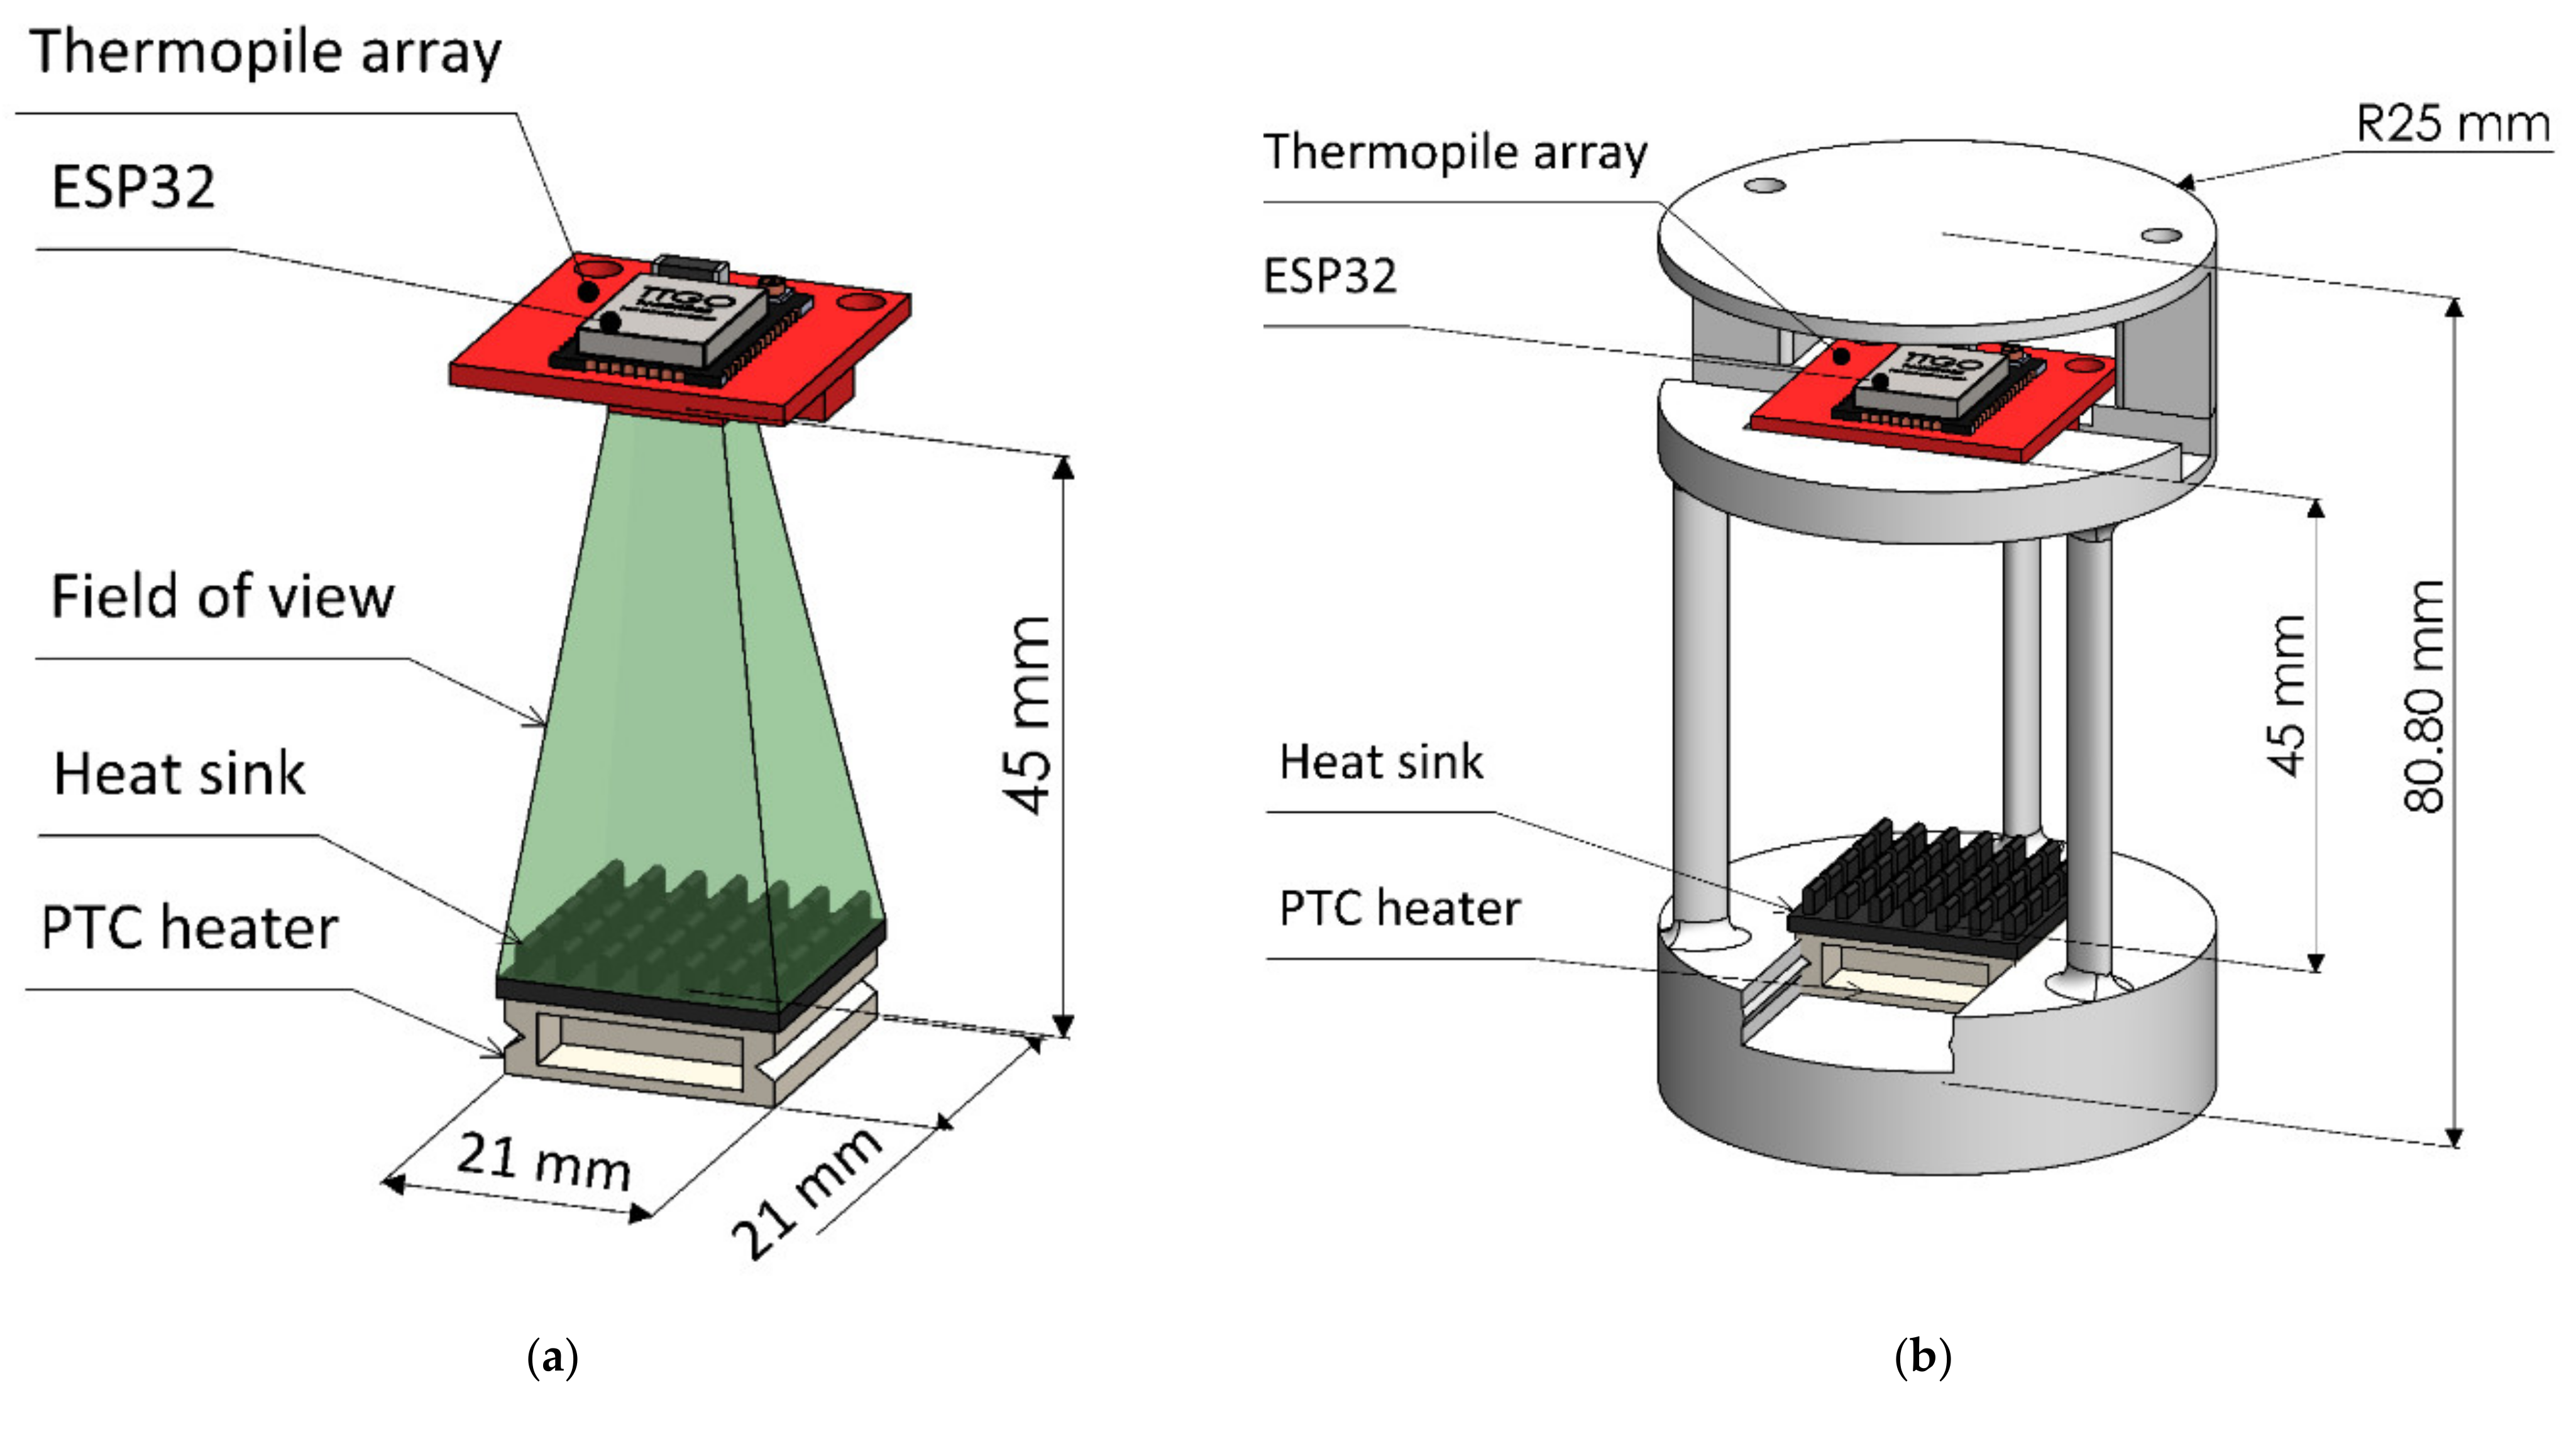
The working principle of the proposed sensing device can be seen in Figure 1a. A PTC heater is used to generate heat at a constant temperature. Since PTC heating devices are self-regulating [59,60] and can maintain a constant temperature without a dedicated close-loop control. An aluminum heat sink is mounted on the PTC heater to act as a heat exchanger. The maximum temperature of the PTC heater was set at 60 °C using a 5-V direct current supply. In this study, a thermopile array [61] with an 8 × 8 grid arrangement was used to collect the temperature data. The thermopile array was mounted 45 mm above the heat sink, so that the field of view could completely cover the heat sink area. The thermopile array had 64 thermopile sensors and a symmetric arrangement of the thermopile array allowed the temperature data to be collected from the heat sink surface as uniformly distributed grids (8 × 8). An ESP32 module [62] was used to collect the temperature data from thermopile array through an I2C interface. The collected data were then wirelessly transferred to a notebook PC via Wi-Fi. In Figure 1b, an assembled version of the proposed sensing device is shown. The PTC heater and heat sink are mounted at the bottom of the device frame, while the thermopile array and ESP32 are mounted at the top part of the frame. The device frame is supported by three cylindrical structures to keep the interference of the wind interacting with the heat sink to a minimum. In Figure 1c, a picture of the 3D printed version of the proposed device is shown, which is used for the measurements and experiments in this study.
The experimental measurement data on temperature change on the surface of the heat sink are due to wind flow. In Figure 2, some measurements collected by the thermopile array are shown in form of a heat map. Each square block on the heat map represents temperature measurements by one thermopile in the thermopile array. The color bar to the right of each heat map shows the color that corresponds to the measured temperature. In total, 64 blocks of temperature data were measured by the 8 × 8 thermopile array. Visually, at low wind speeds, the center area of the heat sink is hotter than the exterior. However, as wind speed increases, the temperature at the center starts decreasing. In addition, at higher wind speeds, the temperature is more dispersed in the opposite direction to the wind. Wind direction has a significant effect on the temperature distribution on the surface of the heat sink. The direction of higher temperature zones follows the direction of the wind. However, at lower wind speeds, the temperature at the center of the heat increases up to 60 °C, making the wind direction effect negligible.
3.2. System Architecture
The proposed wind speed and direction sensing system consist of two-stage data processing techniques. As shown in Figure 3a the thermophile and ambient temperature data are collected by the device and then transferred wirelessly to a personal computer (PC). The transferred data are then used by two ANN models for estimating wind speed and wind direction, simultaneously. The ANN models are generally used for regression, prediction and calibration tasks, as mentioned in Section 2. The major benefit of the ANN model is its ability to model non-linear and highly stochastic mathematical relationships between multiple variables. The ANN models used in this study are trained against the observed wind speed and directions that are measured by a cup anemometer and wind vane. Due to the universal approximation properties of ANN [63], it is preferred over linear regression and other machine learning models for calibration and regression tasks [55,64,65,66,67]. In this study, we used two identical ANN models with four hidden layers. The number of neurons in each layer were 64, 32, 16 and 8 neurons respectively, these hyper-parameters were obtained using a halving grid-search [68]. The sigmoid function is applied as the activation function for each layer, except the output layer, which has a linear activation. The Adam [69] optimizer was used for optimizing the ANN. The input data are normalized using minimum and maximum value of the training dataset. For comparison, support vector regression [18] and LR using least squares are used. The maximum number of iterations for the ANN model was set to 10,000 epochs, while for the SVM regression model the stopping tolerance was set to 10−5 and the squared l2 penalty was set to 0.1. All three models were programmed using the ‘Scikit-learn’ [70] library in the ‘Python’ programming environment. The data collection and transfer routine for ESP32 were written in ‘C++’ programming language. The data collection and transfer rate for the thermophile array were set to a 2-s interval. The down sampling of the collected data was performed using the PC before estimating the wind speed and direction. In Figure 3b, a potential application scheme is shown, where the proposed device can be used for the wind speed and direction measurements by an energy management system for solar panels and wind turbines. Alternatively, it can also be used for potential wind energy assessments for a given residential building or community area.
4. Results
4.1. Experimental Setup and Dataset
The proposed system is tested in an outdoor setup. The training and testing data were collected from Tainan City, Taiwan, from a residential building rooftop, as shown in Figure 4a,b. A total of 168 h (1 week) of data were collected through the thermopile array, ambient temperature sensor, cup anemometer and wind vane. The total height of the sensors from the ground was 30 m and a vertical pole was used as the fixture for the sensors. Figure 4c shows the top view of the proposed device and experimental setup. In this setup, thermopile array data are collected simultaneously with the cup anemometer and wind vane at 2-s intervals to establish a one-to-one sampling correspondence between the proposed device measurements and the observed/actual wind speed with direction.
In Figure 5, the thermopile array (64 channels), ambient temperature, wind speed and wind direction collected at 2 s intervals are shown. From the plots, it can be observed that the wind speed and wind direction data show a highly stochastic nature. However, the change in trends of wind speed corresponds to the change in the trends of the thermopile array data. This represents the relationship between these two variables. Wind direction does not show an obvious relationship. The vertical line (black colored) separating the plots shows the separation of datasets used for training and testing. The data on the left side of the vertical line are the 96-h dataset used for training the regression models, including ANN, SVM and LR, while the data on the right side are the 72-h data that are used for testing.
4.2. Estimation Results
In order to validate the accuracy and applicability of our proposed system, different sampling rates were used for training and testing the regression models. In this study, six sampling intervals were considered, 10 s, 20 s, 1 min, 2 min, 5 min and 10 min. The dataset is down sampled from 2 s intervals to the corresponding sampling interval by averaging the values. Each regression model is separately trained and tested for different sampling intervals. In Table 1, the error metrics for ANN, SVM and LR regression models are reported. The coefficient of determination (R2) [71,72] and root mean squared error (RMSE) and mean absolute error (MAE) [40] are reported in order to evaluate the wind speed and direction estimation performance. The wind speed estimation performance of the ANN model surpassed those of the SVM and LR models. Consistently, for each sampling interval the ANN model could estimate the wind speed with a high accuracy. Especially for sampling intervals above 1 min, the wind speed ANN model’s R2 score was higher than 0.95 and reached a maximum of 0.99 for the 10 min sampling interval. The RMSE and MAE errors of the ANN model were also below 1 m/s and the best performances were achieved for the 10-min sampling interval, at 0.279 and 0.207, respectively. The SVM and LR models for wind speed estimation showed similar performances throughout the different sampling rates. Therefore, in the case of a tradeoff between accuracy and computing resources, the LR model can be preferable for on-device estimation of wind speeds. For wind direction estimation, the ANN model showed an R2 score above 0.83 for each sampling interval, reaching a maximum of 0.941 for the 10-min interval. However, the SVM regression model for wind direction performed poorly, but the LR model could provide reasonable estimations at 5-min and 10-min sampling intervals.
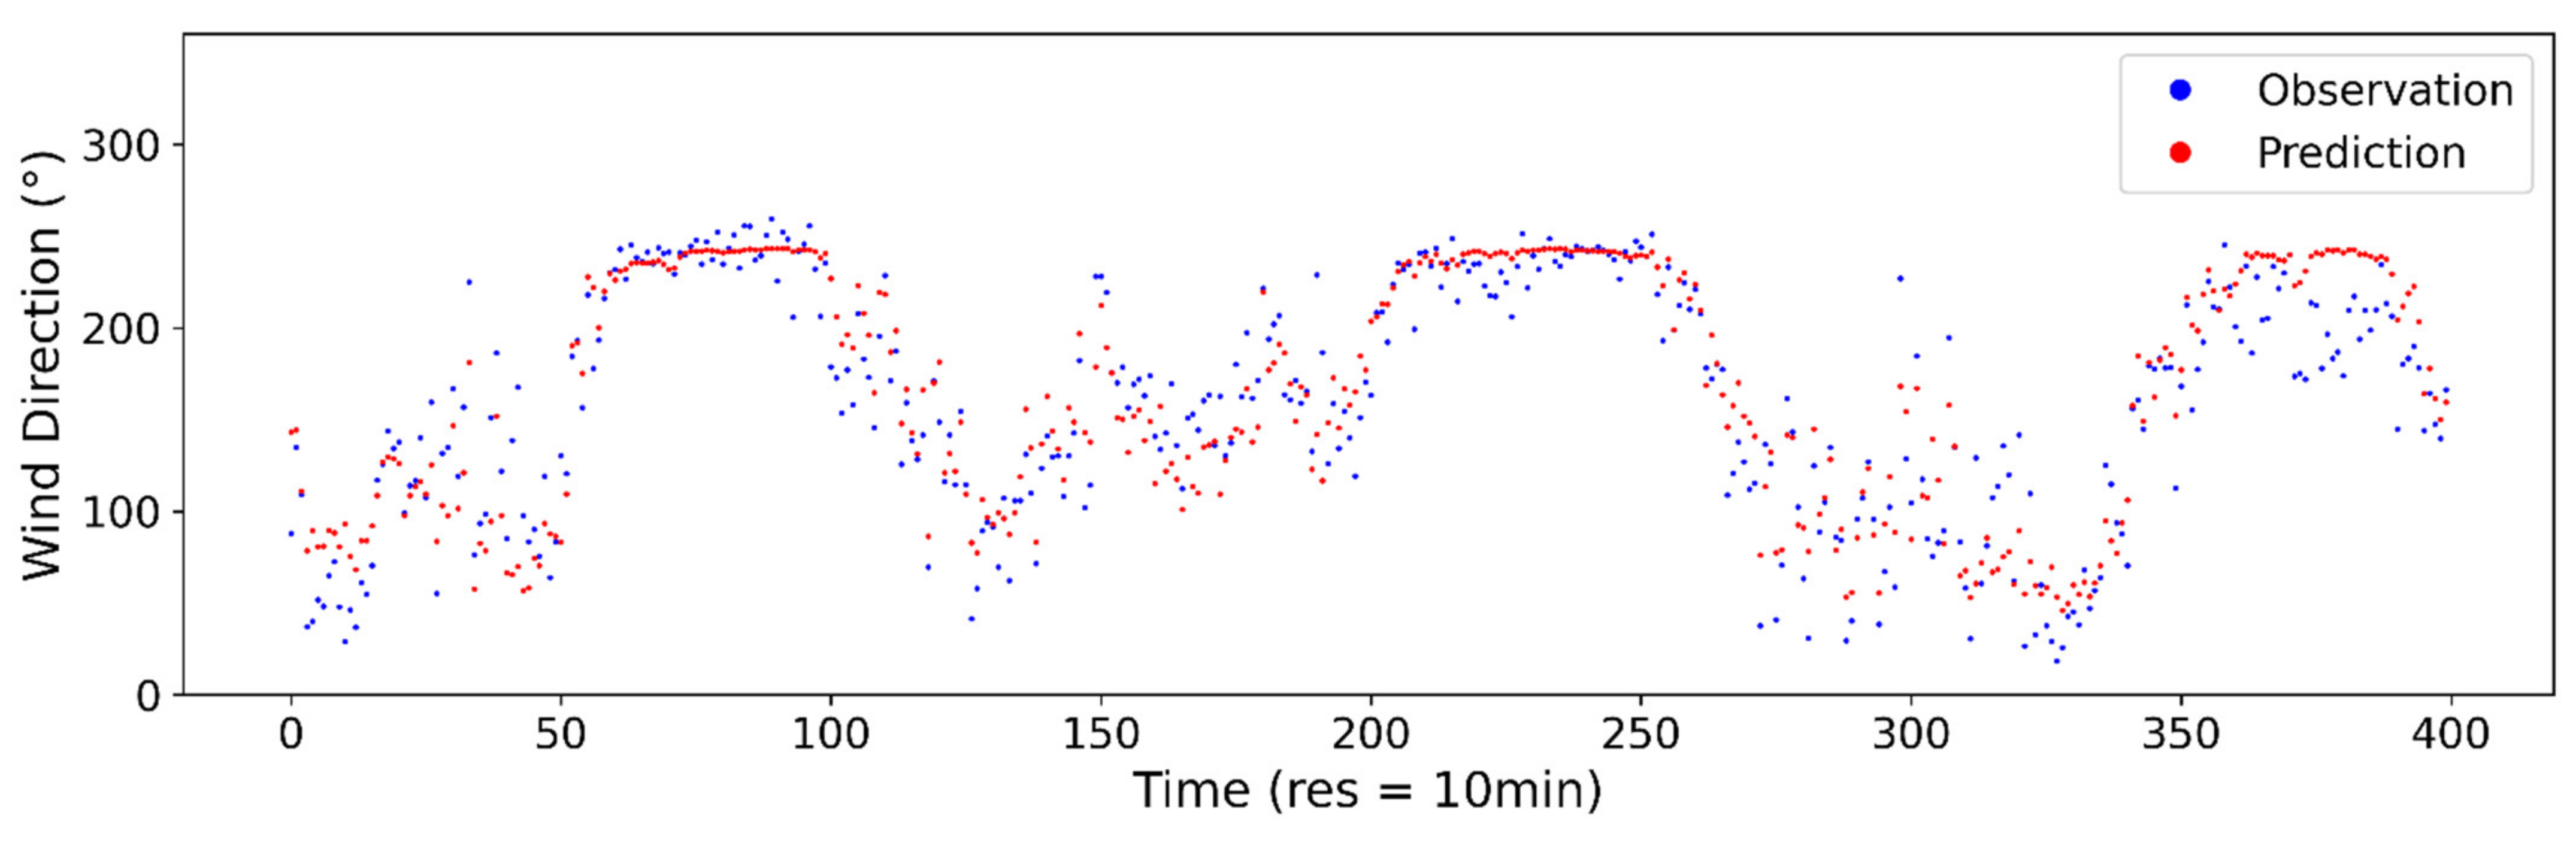
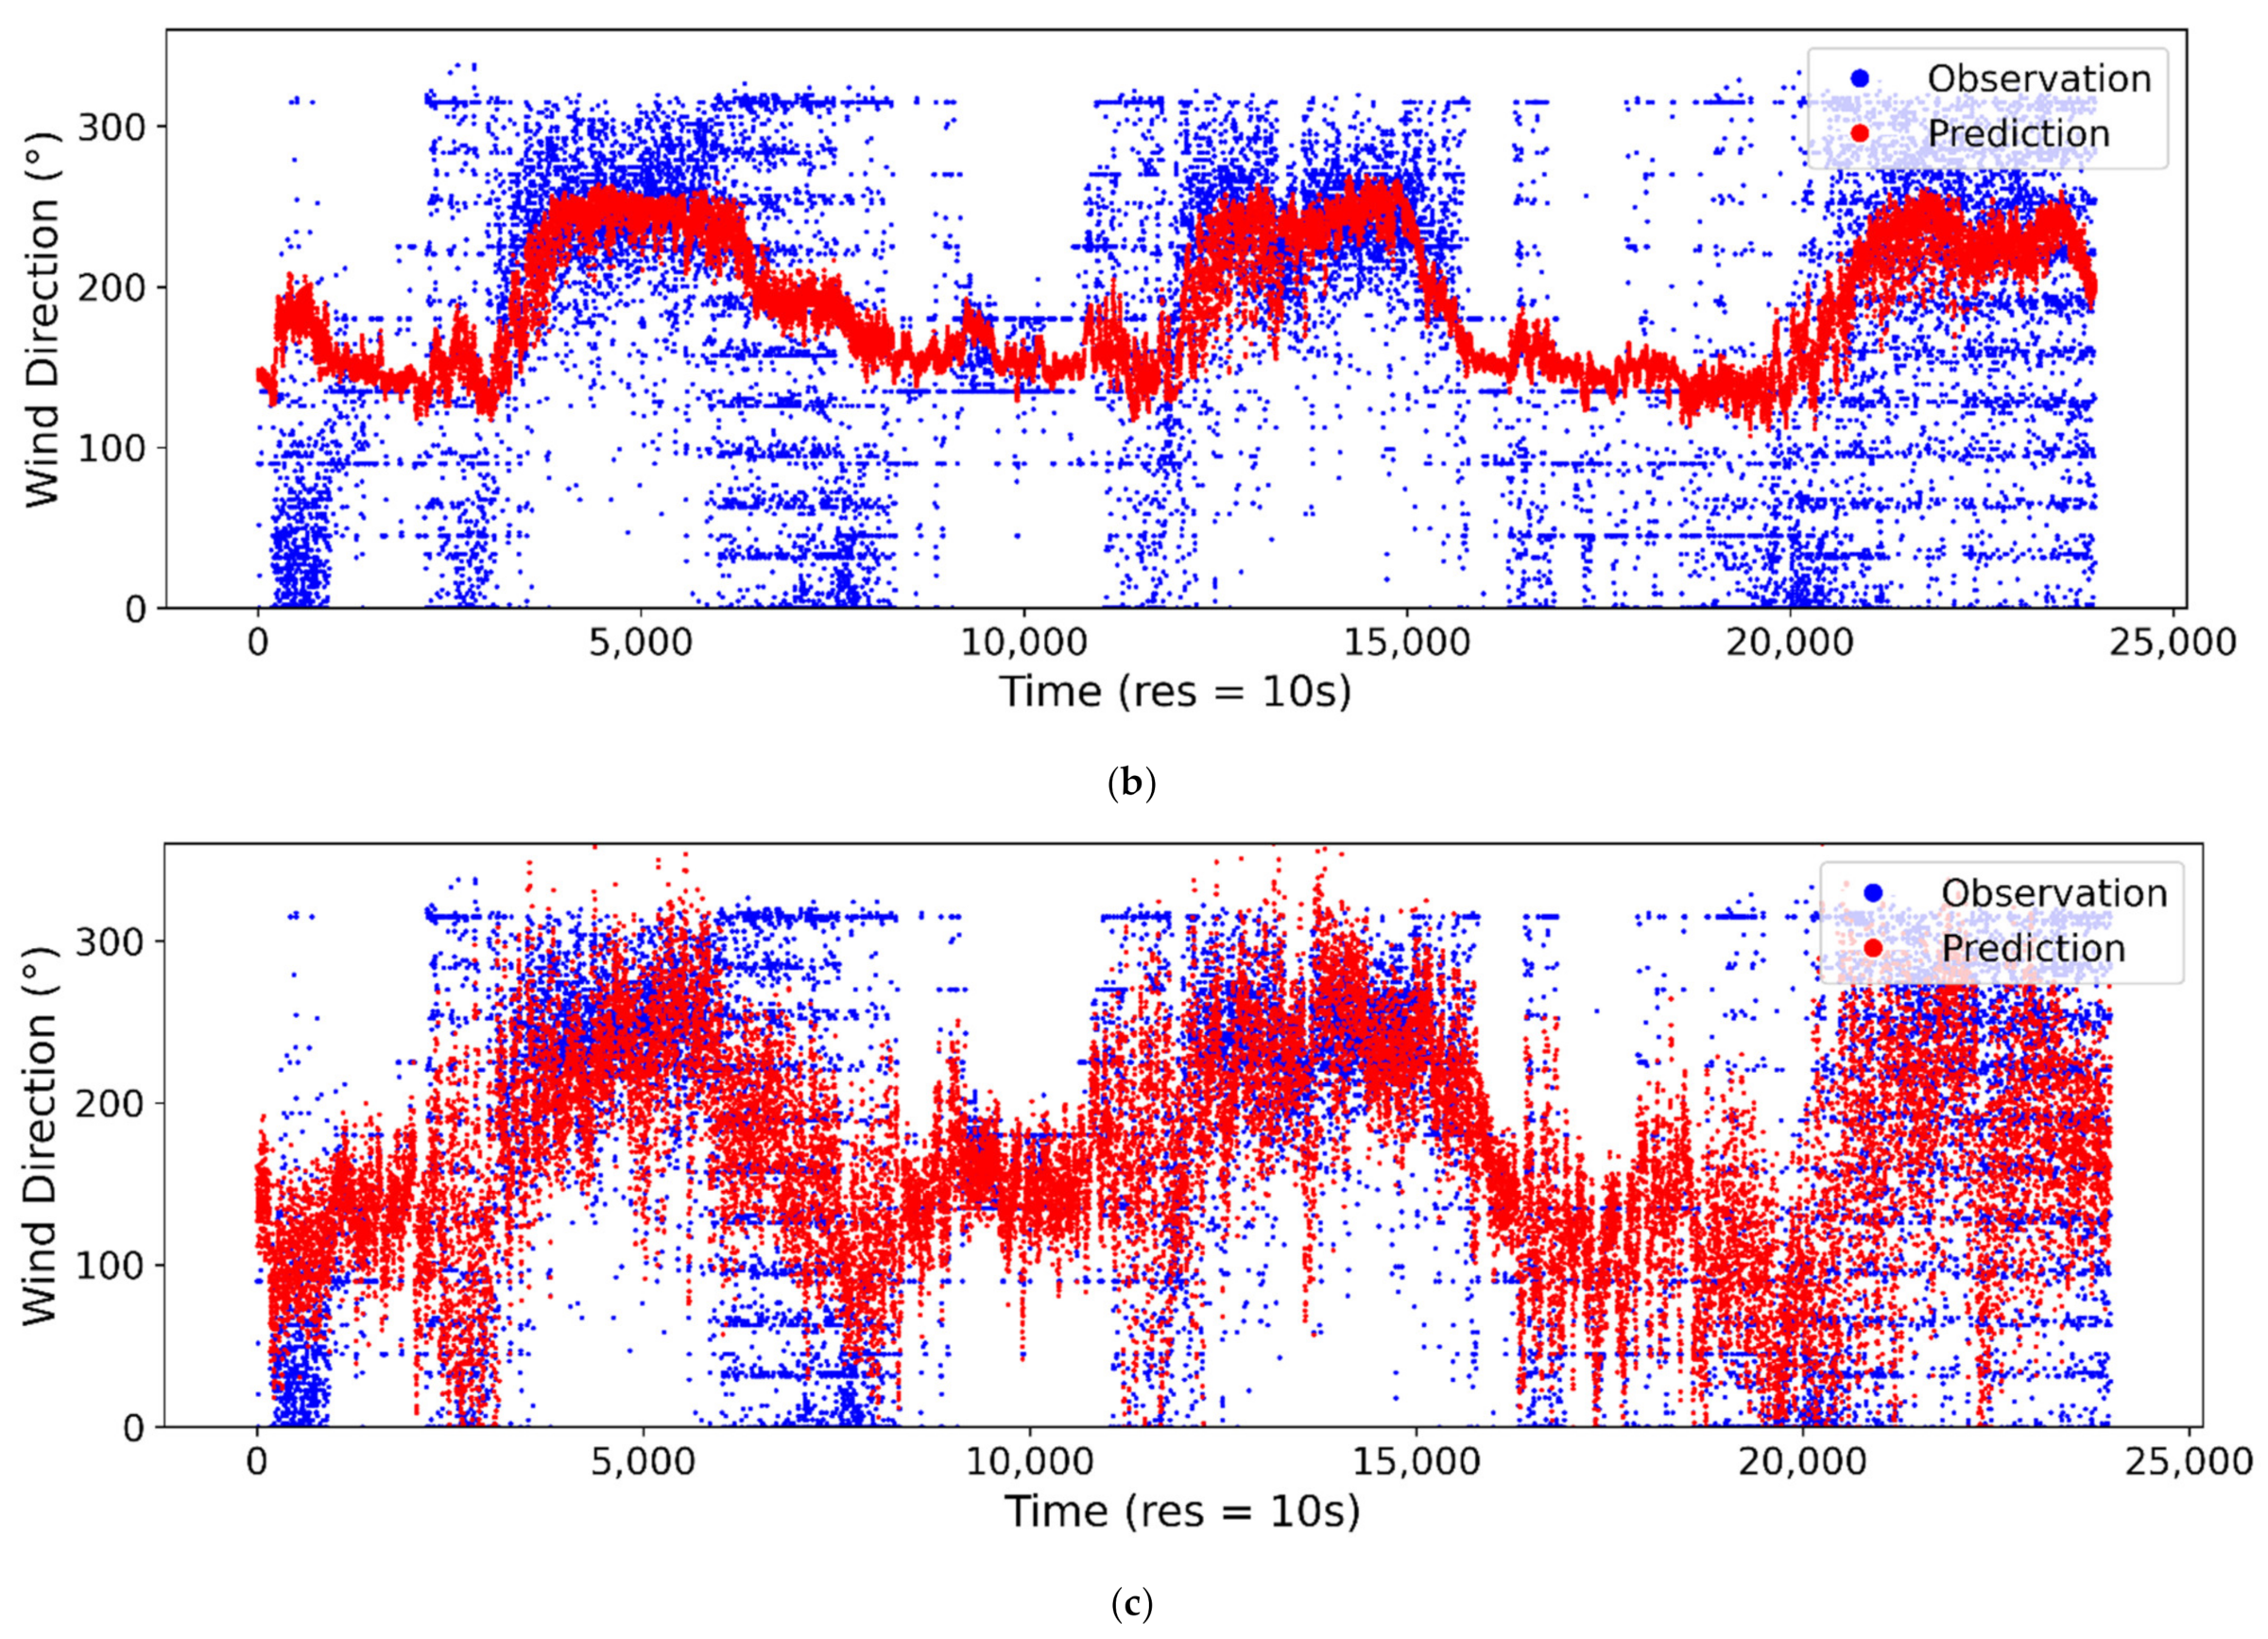
The observed vs. estimated/predicted wind speeds at the 10-s sampling interval are presented for ANN in Figure 6a, SVM in Figure 6b and LR in Figure 6c. From the plot, it can be seen that the ANN model is able to model the stochastic trends of wind speed using the thermopile array and ambient temperature data. The SVM and LR models can also reach a reasonable accuracy for wind speed estimation. However, for highly stochastic changes, especially at higher wind speeds, the ANN model performance was superior to those of SVM and LR. For wind direction estimation, the ANN model could capture most of the stochastic changes in trends, as shown in Figure 7a. However, the wind direction estimation accuracy was relatively lower than the wind speed estimation. The SVM model for wind direction could only model the average changes in trends, therefore the overall accuracy was poor, as shown in Figure 7b. The LR model was able to predict/estimate the wind direction better than the SVM model, however, it fell behind the ANN model’s performance, as shown in Figure 7c. The comparison plots for the ANN models for wind speed and direction at sampling intervals of 20 s, 1 min, 2 min, 5 min and 10 min are provided in Appendix A, Figure A1, Figure A2, Figure A3, Figure A4, Figure A5, Figure A6, Figure A7, Figure A8, Figure A9 and Figure A10.
5. Conclusions
In this study, the development of a low-cost system for wind speed and direction measurement is reported. The sensing device is designed based on temperature distribution trends using a thermopile array, ambient temperature sensor, PTC heater and heat sink. Two ANN models are trained on the thermopile array and ambient temperature data for estimating wind speed and direction. The performance of the proposed system and the ANN model are tested for different sampling intervals and are found to be superior to SVM and LR regression models for estimating wind speed and direction. We can summarize the findings, using our experimental, results as follows:
- Our proposed system could achieve an R2 score of up to 0.99 and 0.941 for wind speed and direction estimation using the ANN regression model, respectively, at a 10-min sampling interval with MAE being 0.07 m/s and 13.657°, respectively.
- The R2 score, RMSE and MAE of the proposed system at sampling intervals of 5 min, 2 min, 1 min and 20 s were well under acceptable limits.
- The ANN method outperformed SVM regression by 2.2% in terms of R2 score, 44.7% in RMSE, and 44.5% in MAE for wind speed estimation at a 10-min interval.
- The ANN method outperformed LR by 9% in terms of R2 score, 28.7% in RMSE and 24% in MAE for wind direction estimation at a 10-min interval.
Therefore, it can be concluded that our low-cost solution for wind speed and direction sensing can be used for residential and other applications without sacrificing accuracy. The proposed device can be installed in a small space and has no rotating parts, which increases the reliability and decreases the maintenance requirements.
The limitations of this study include:
- The relatively lower accuracy for wind direction estimation at smaller sampling intervals, which is suspected to be due to the lower spatial resolution of the thermopile array and the design of the heat sink that restricts the airflow from some directions.
- The wind speed and direction accuracy decrease with a shorter sampling rate because the changes in thermal distribution are not recorded as quickly as the changes in wind attributes.
The proposed system can be potentially used as an outdoor wind sensor and can also be used as a compact and portable flow sensor for indoor and tunnel settings. Other use cases for the proposed device includes, heating, ventilation and air conditioning systems in large commercial buildings and underground tunnels.
As future directions, the design of heat sinks and its fins will be studied and improved. In addition, a higher resolution thermopile array with resolutions greater than 8 × 8 grid will be considered with faster sampling rates for collecting temperature distribution data. Other environmental factors, such as humidity and atmospheric pressure, will also be considered for estimation modeling. The application potential of this device for monitoring the air flow in ventilation, air conditioning vents and underground tunnels will be explored.
Author Contributions
Conceptualization, C.-Y.D.; data curation, C.-Y.D.; formal analysis, J.-C.T.; investigation, S.-C.W.; methodology, C.-Y.D. and J.-C.T.; software, C.-Y.D.; supervision, J.-C.T. and S.-C.W.; visualization, C.-Y.D.; writing, original draft, C.-Y.D.; writing, review and editing, J.-C.T. and S.-C.W. All authors have read and agreed to the published version of the manuscript.
Funding
This research received no external funding.
Data Availability Statement
Data used for this study can be provided upon reasonable request.
Acknowledgments
The authors thank the editor and anonymous reviewers for their valuable suggestions and comments that helped improved the quality of this manuscript.
Conflicts of Interest
The authors declare no conflict of interest.
Appendix A
Figure A1.
Estimated vs. observed wind speed at 20-s sampling interval using ANN model.
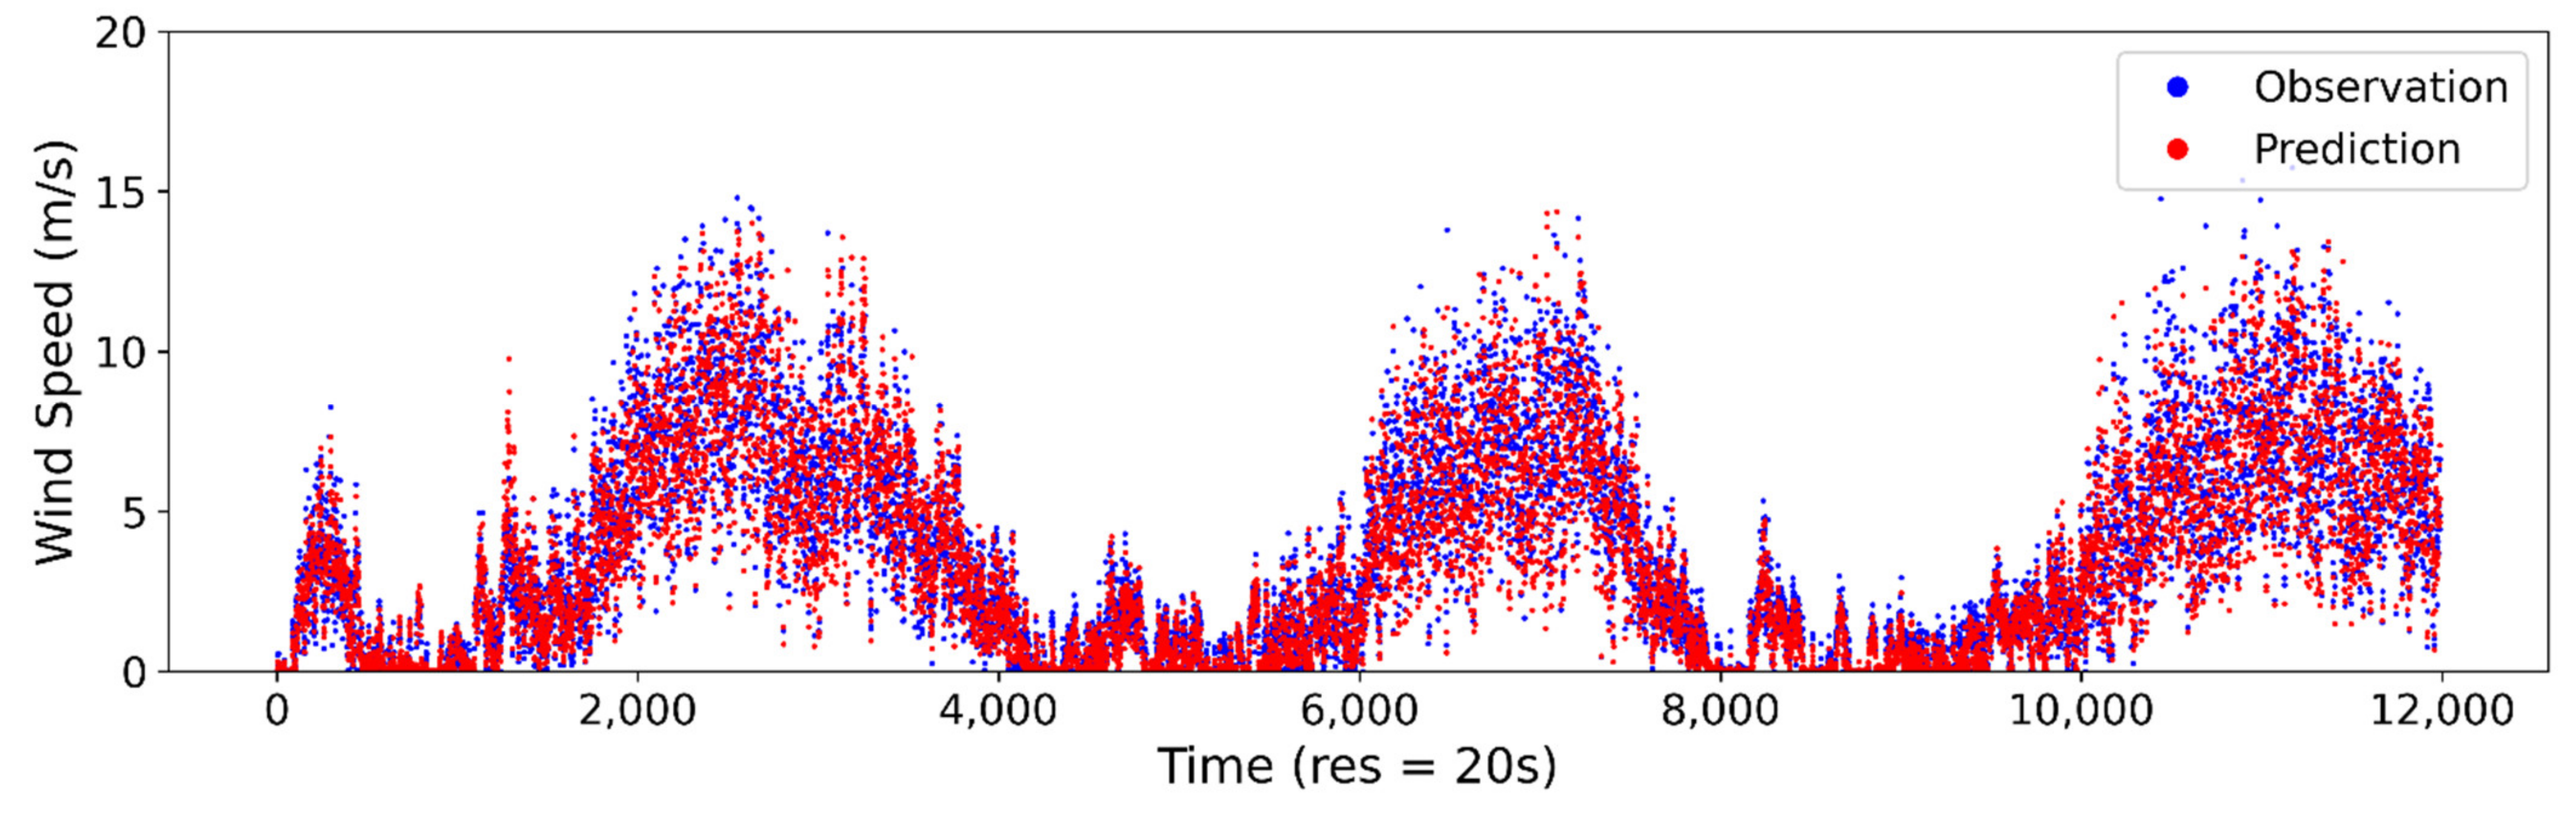
Figure A2.
Estimated vs. observed wind speed at 1-min sampling interval using ANN model.
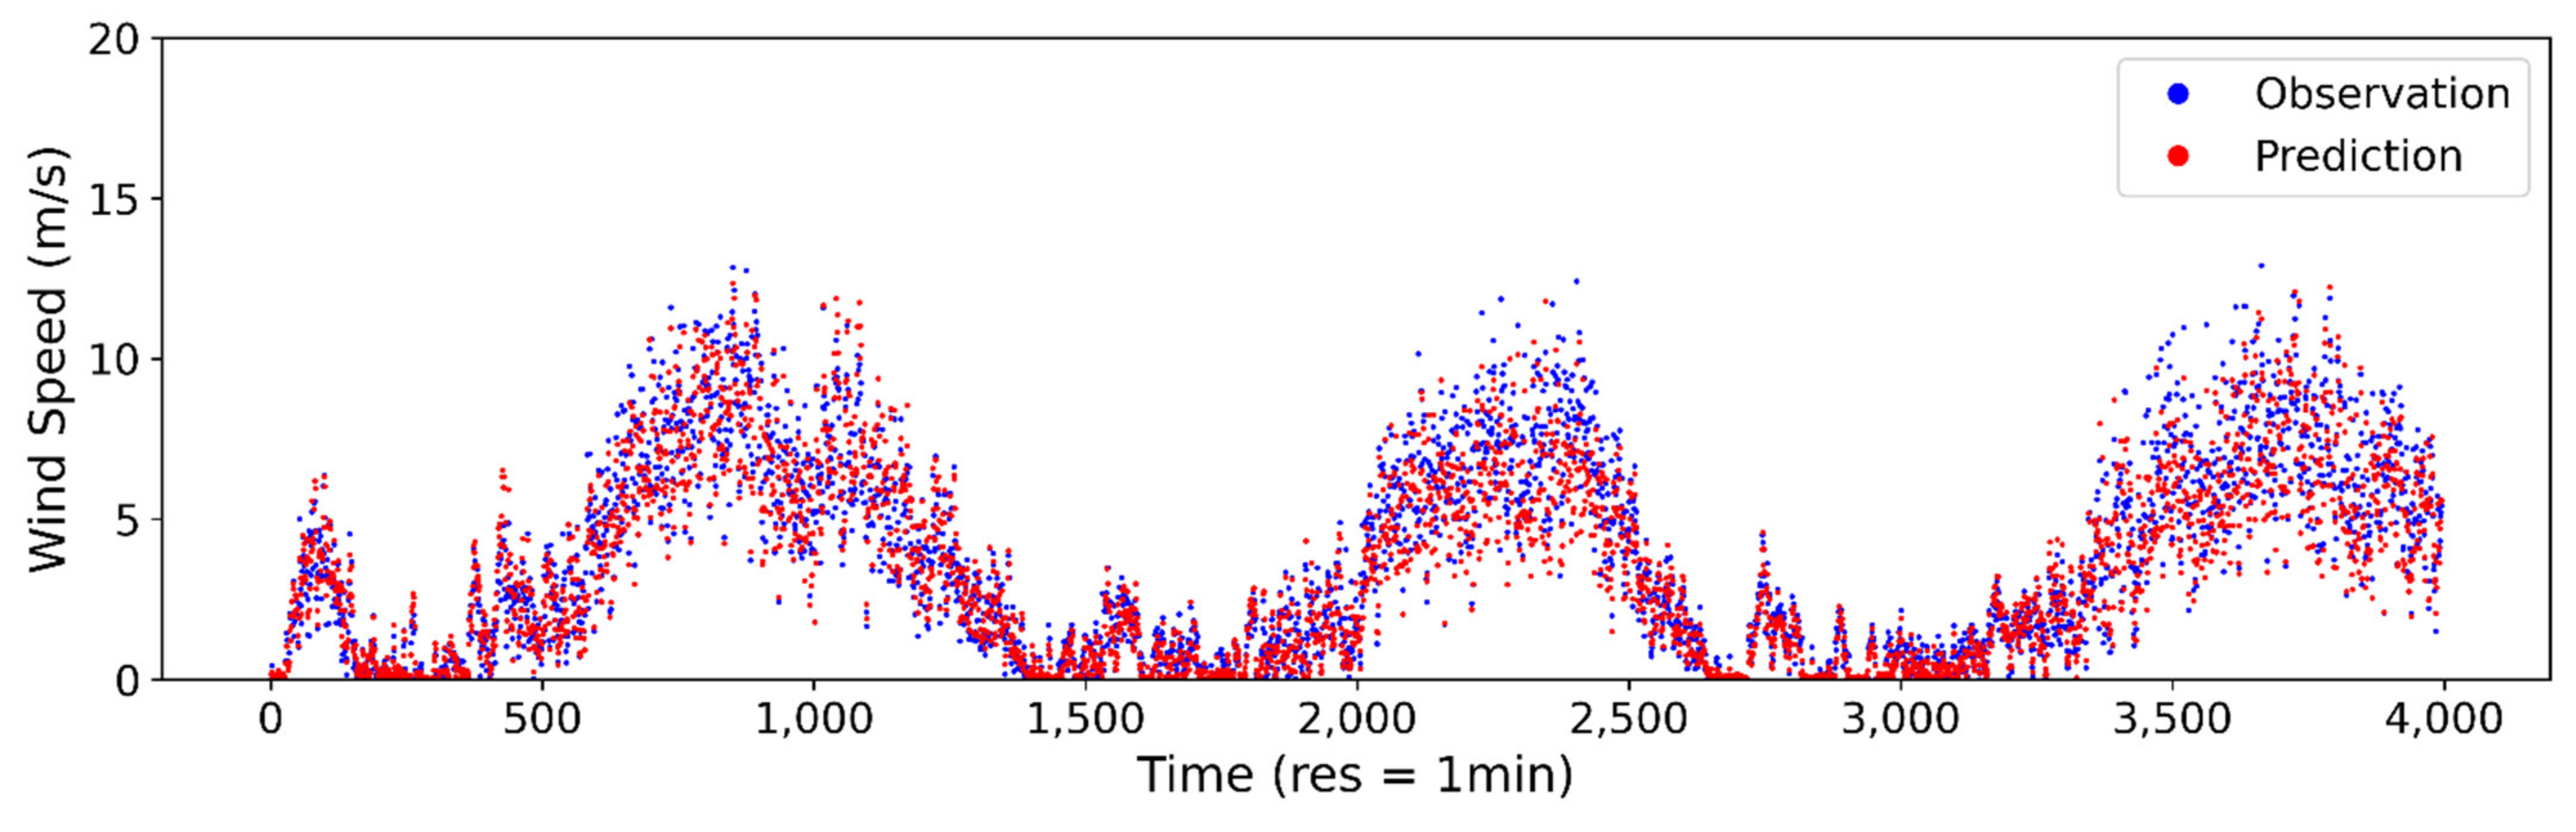
Figure A3.
Estimated vs. observed wind speed at 2-min sampling interval using ANN model.
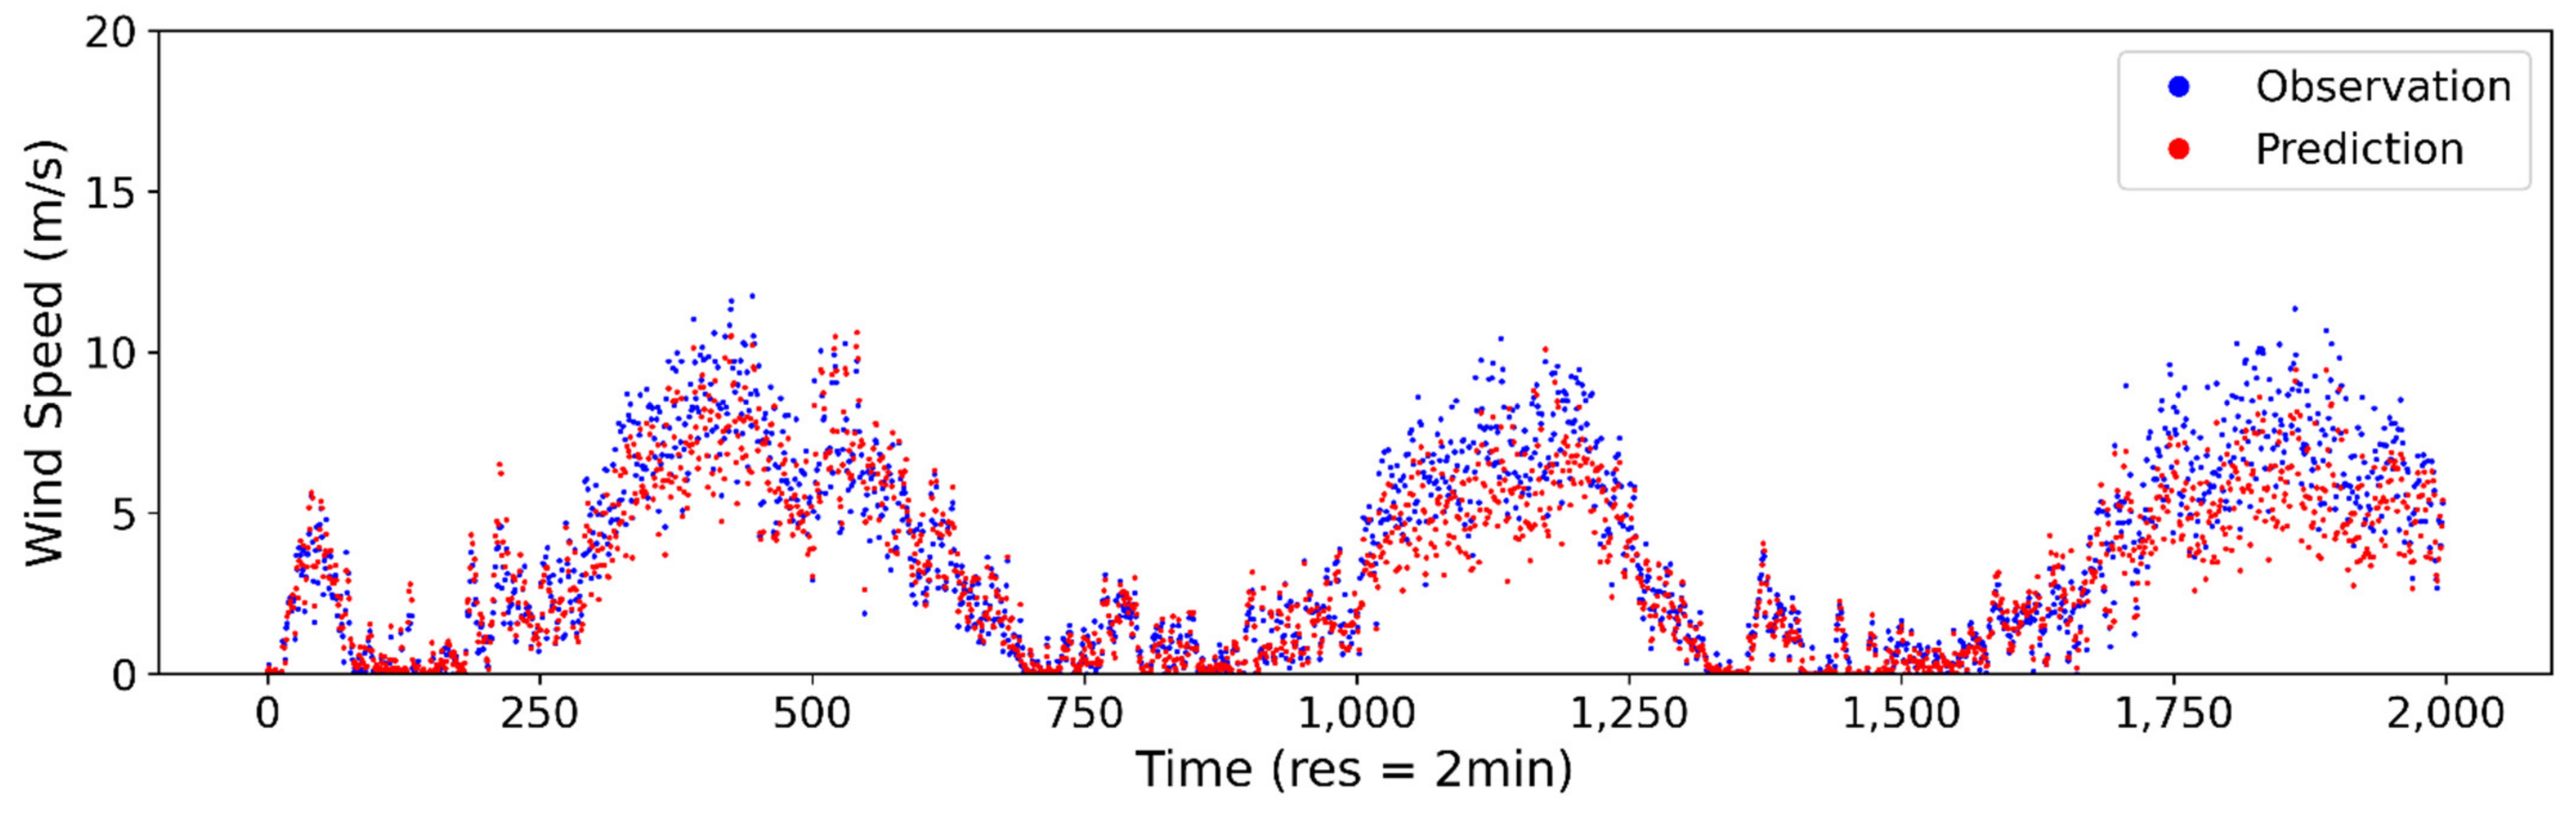
Figure A4.
Estimated vs. observed wind speed at 5-min sampling interval using ANN model.

Figure A5.
Estimated vs. observed wind speed at 10-min sampling interval using ANN model.
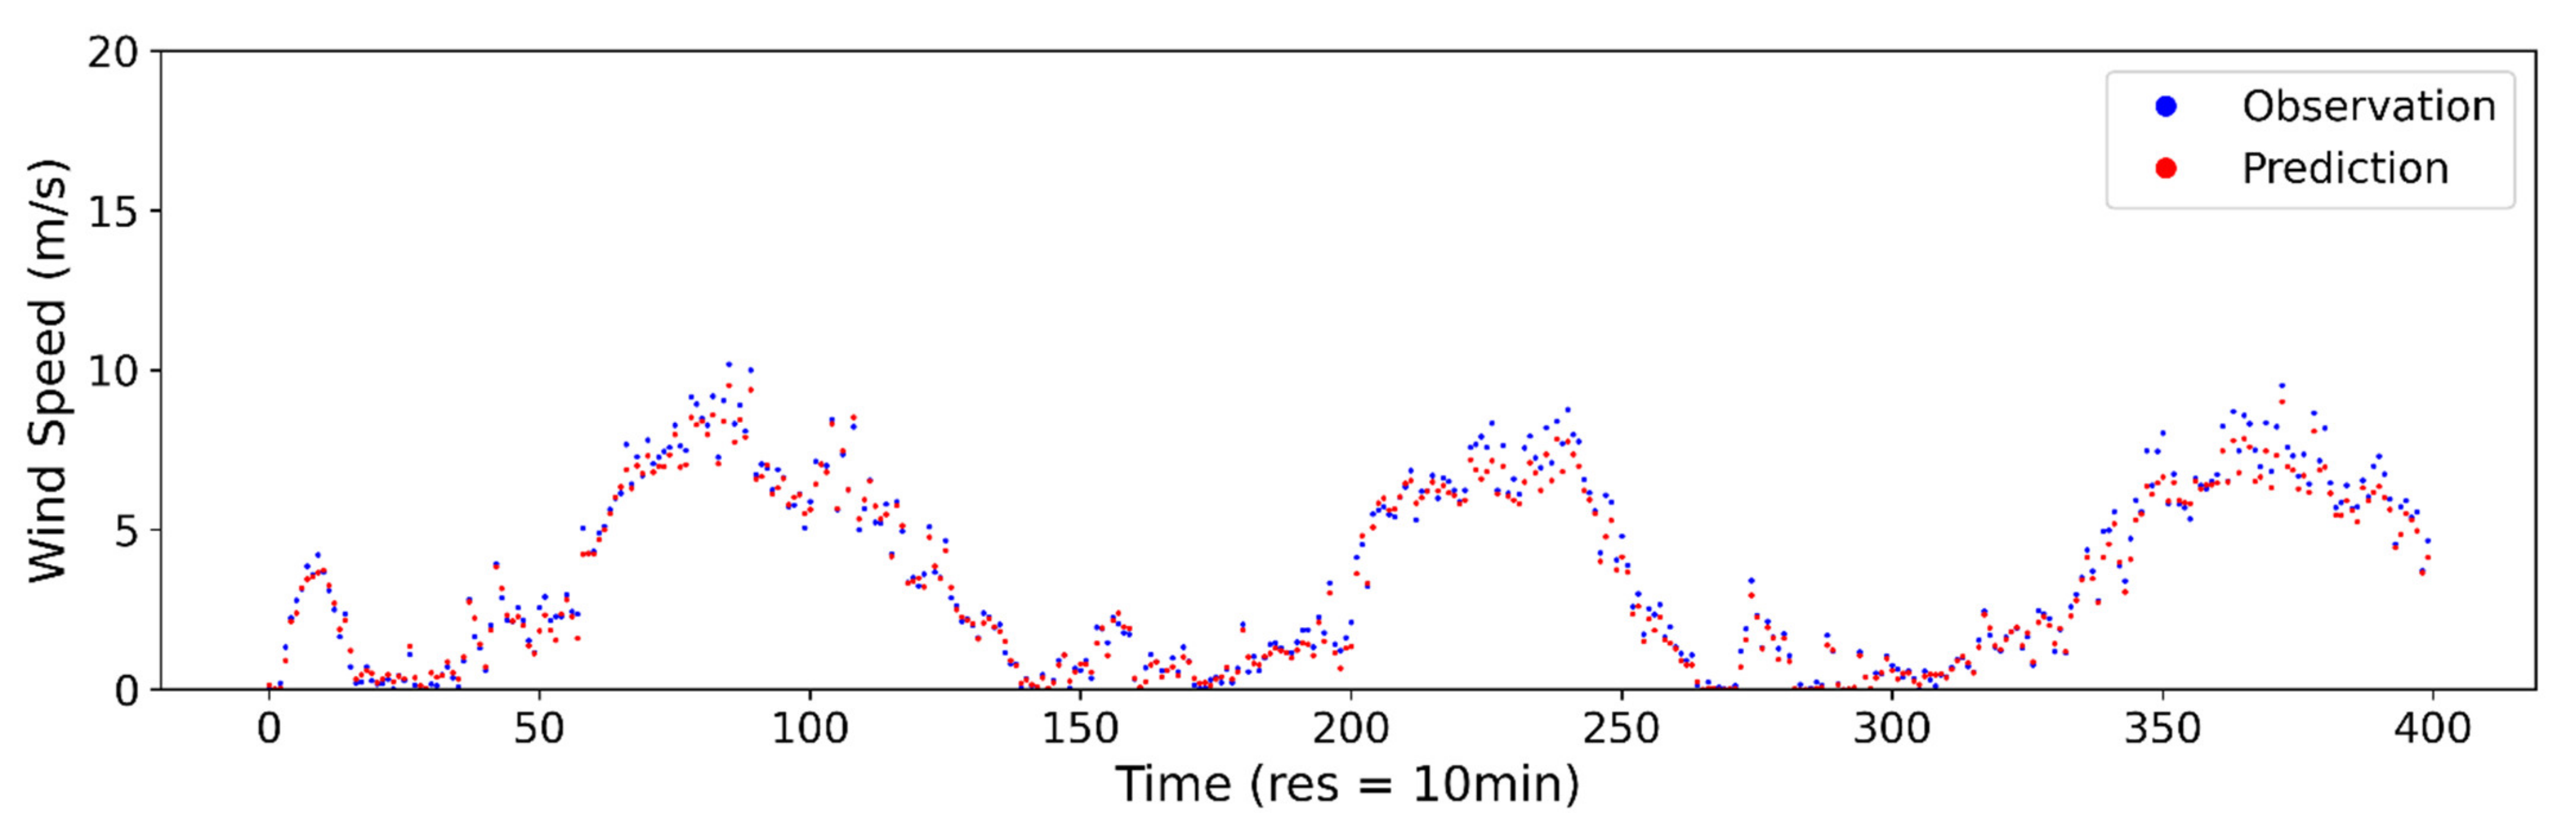
Figure A6.
Estimated vs. observed wind direction at 20-s sampling interval using ANN model.
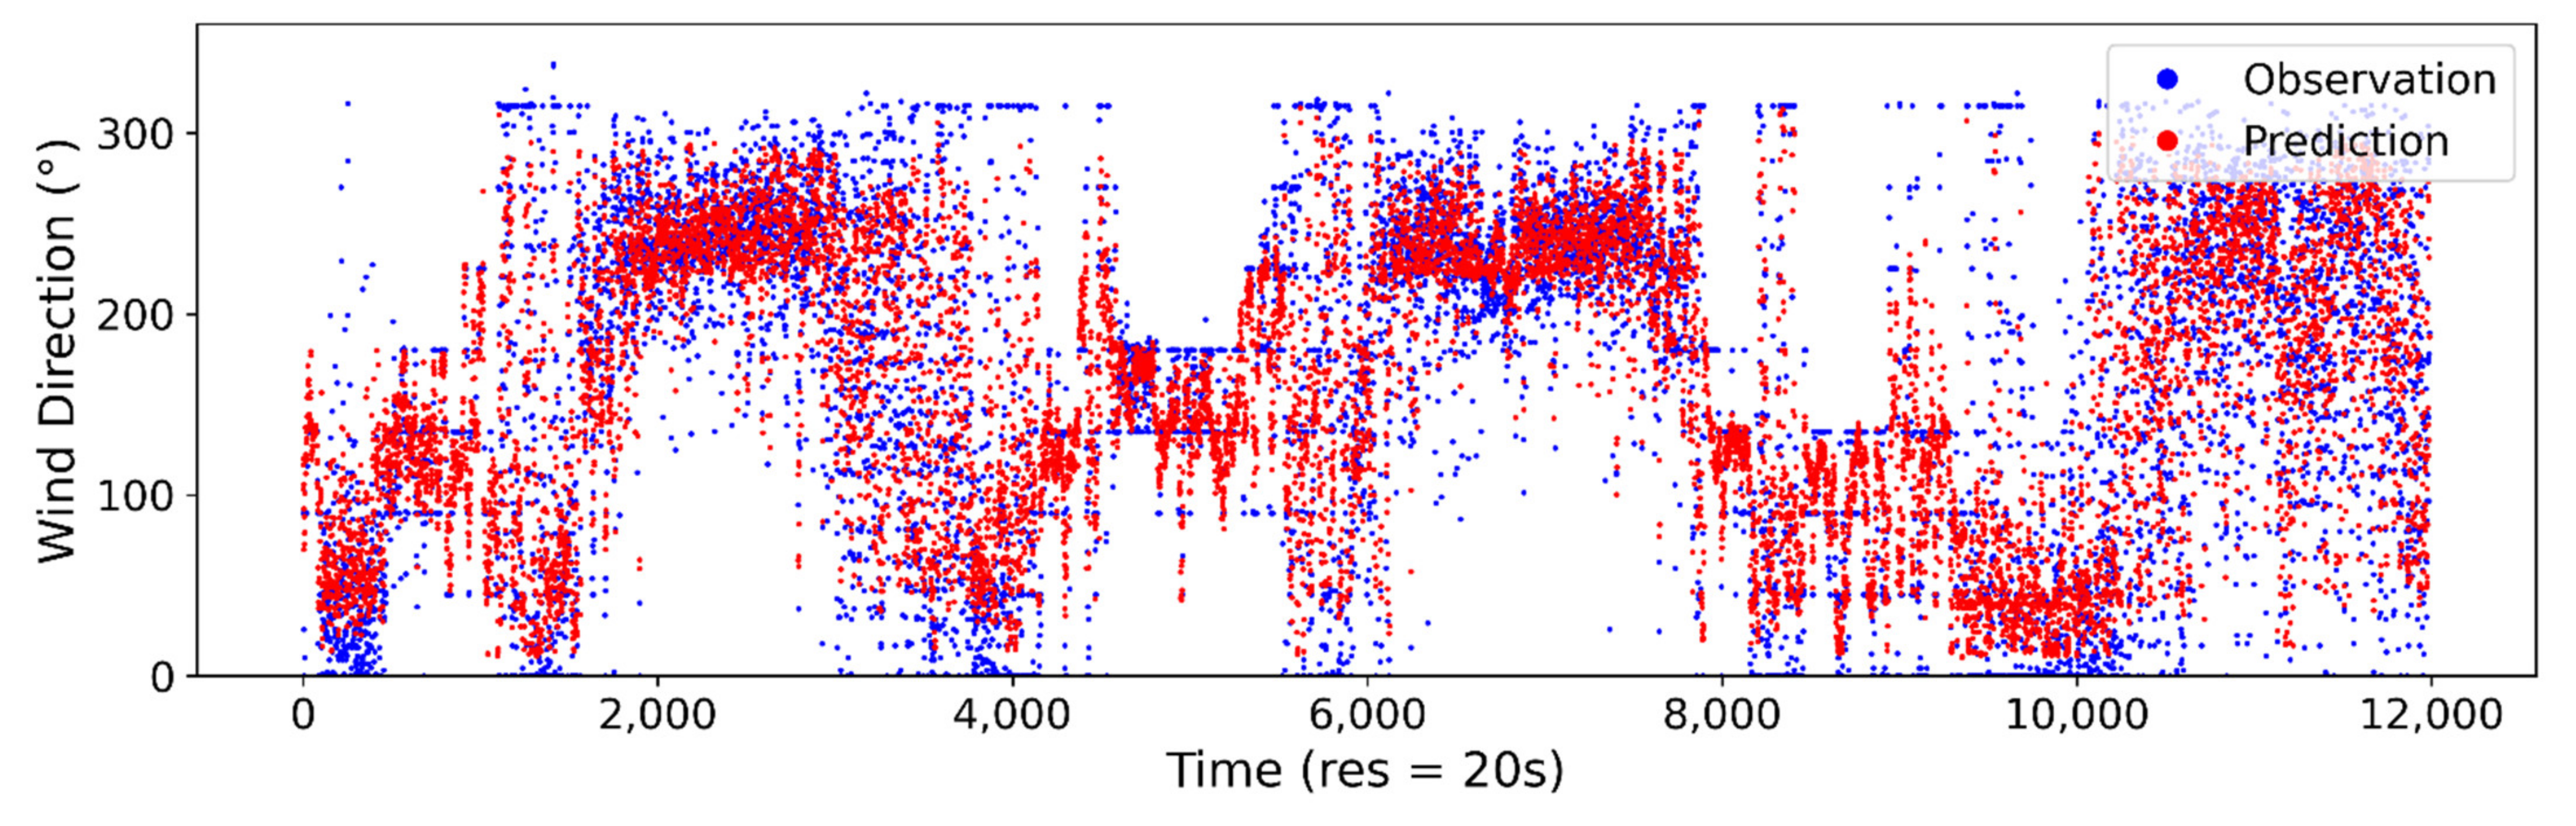
Figure A7.
Estimated vs. observed wind direction at 1-min sampling interval using ANN model.
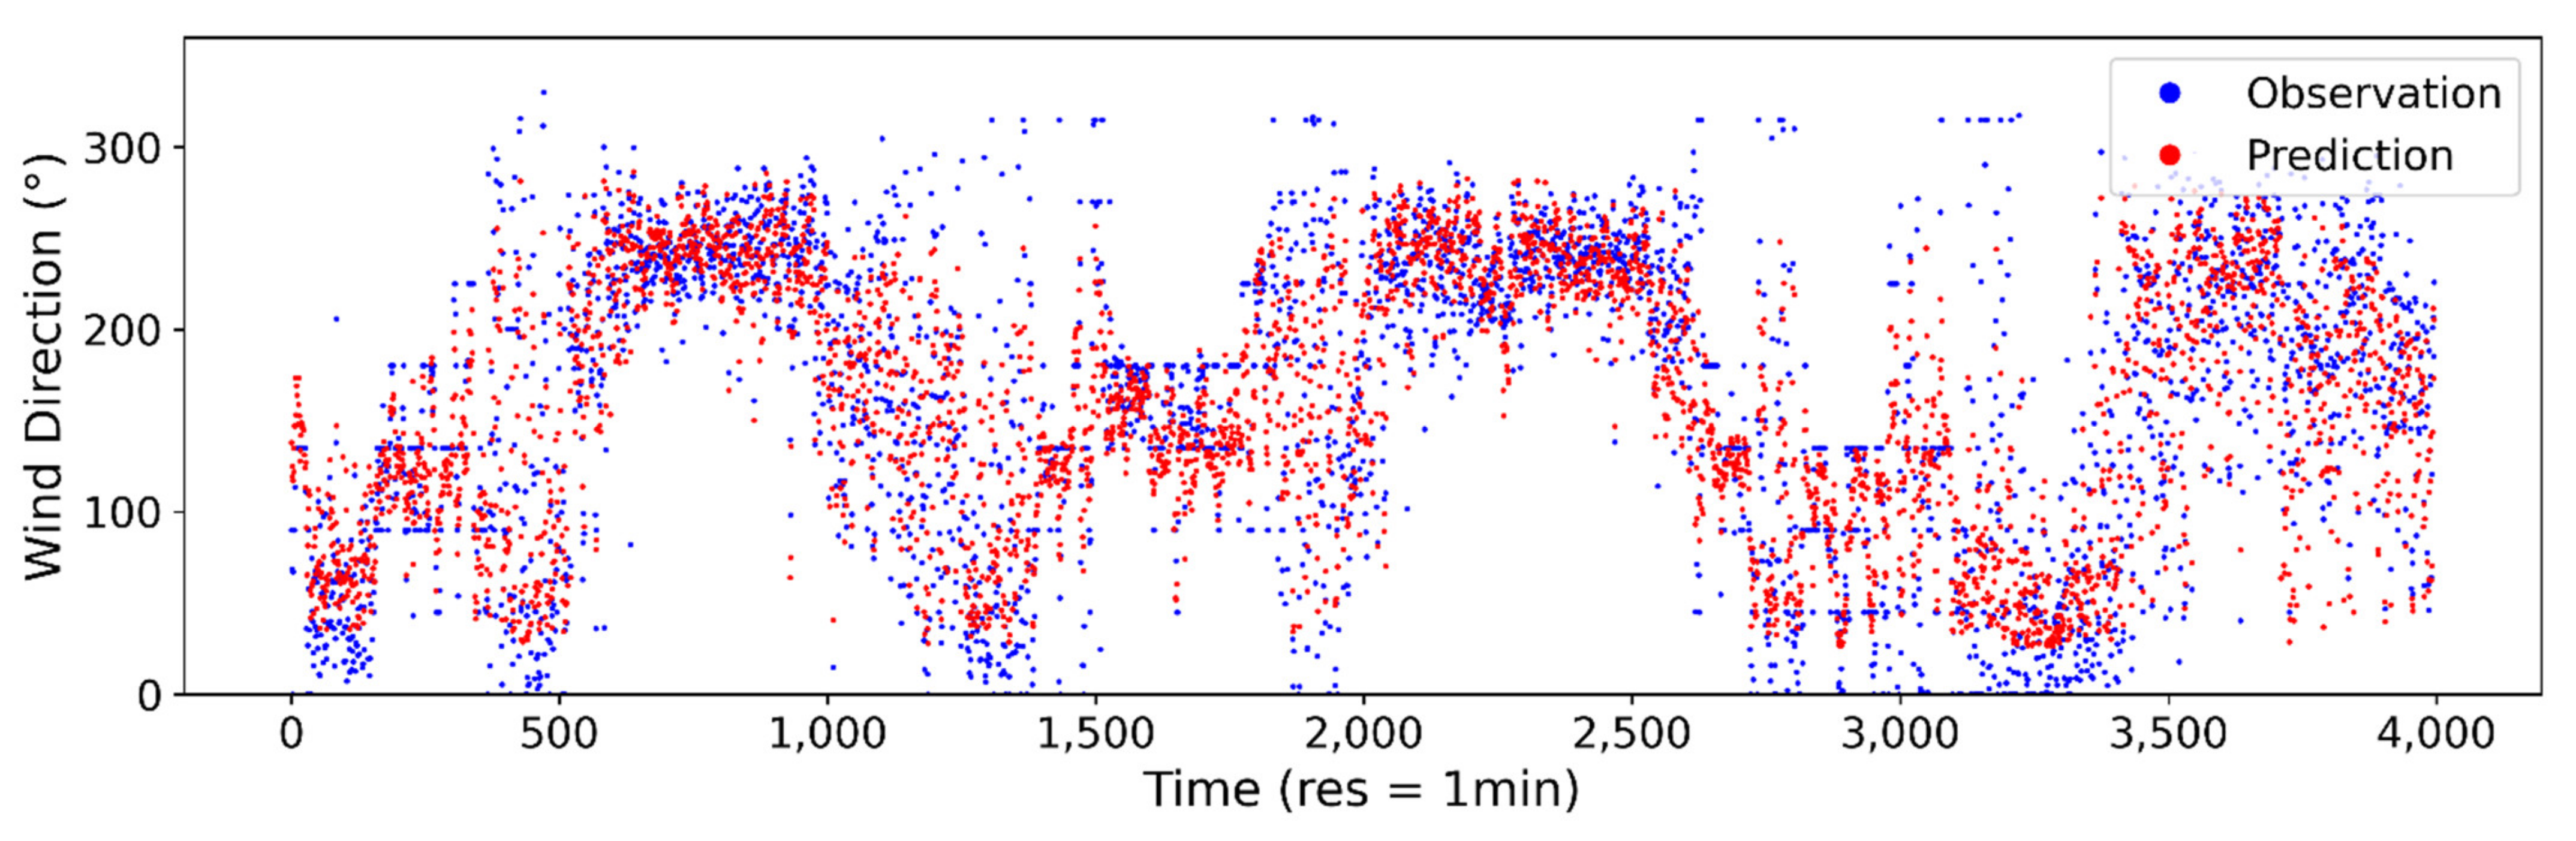
Figure A8.
Estimated vs. observed wind direction at 2-min sampling interval using ANN model.
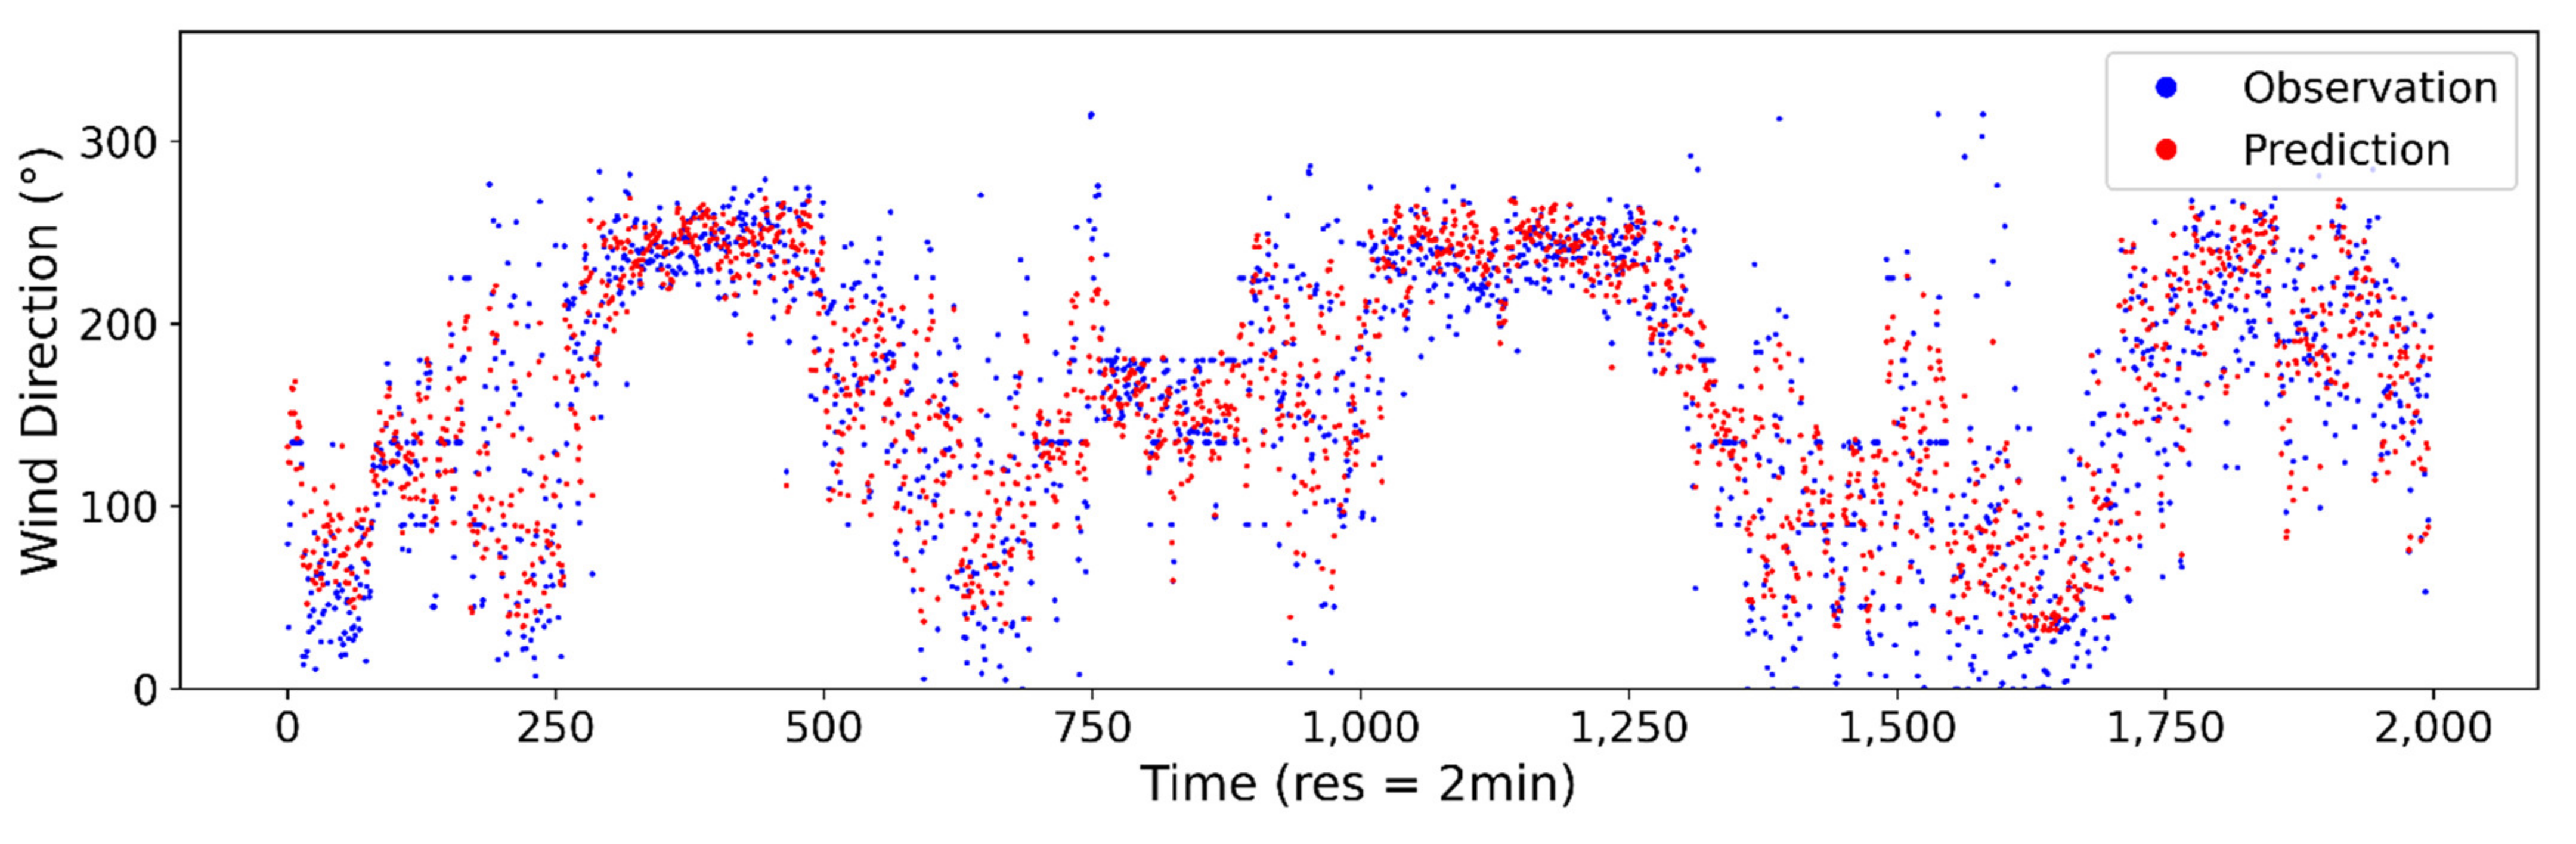
Figure A9.
Estimated vs. observed wind direction at 5-min sampling interval using ANN model.
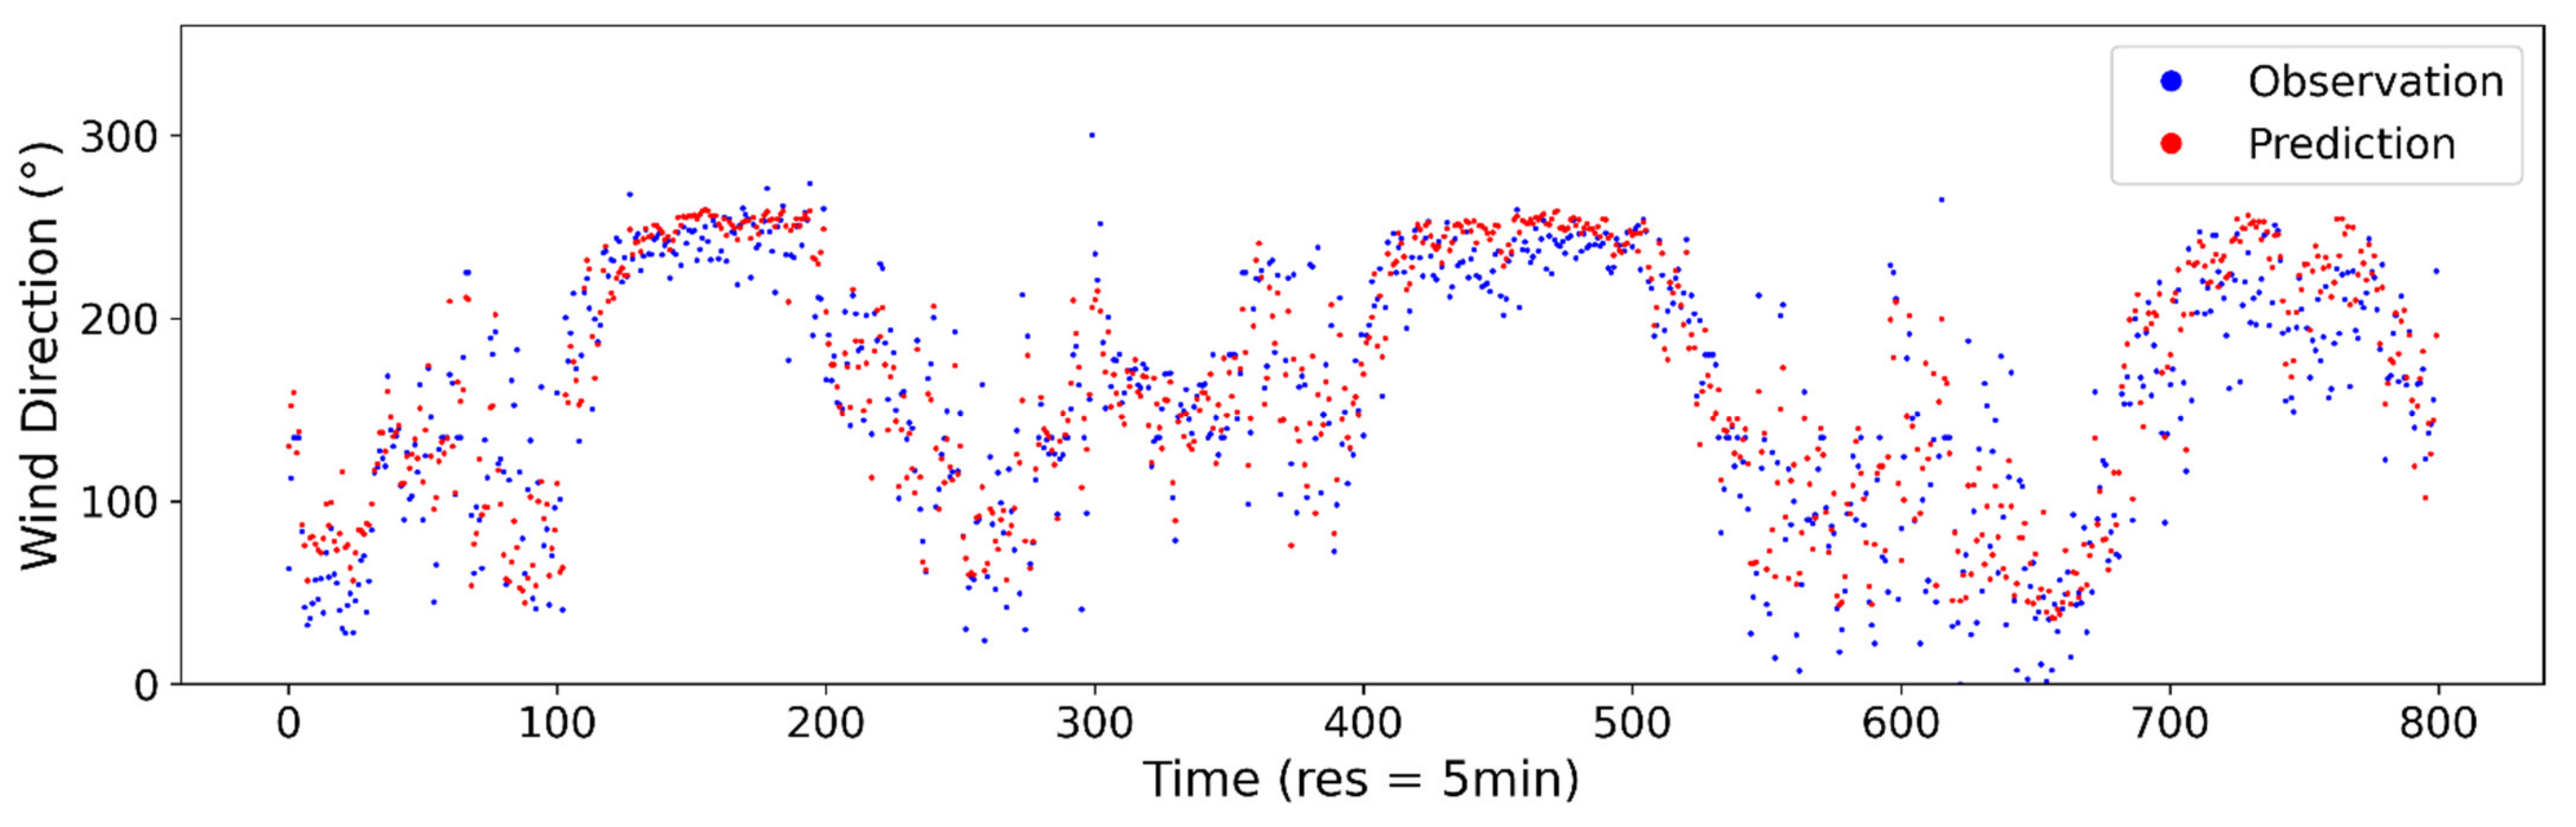
Figure A10.
Estimated vs. observed wind direction at 2-min sampling interval using ANN model.
References
- Knorr, K. Modellierung von raum-zeitlichen Eigenschaften der Windenergieeinspeisung für wetterdatenbasierte Windleistungssimulationen; Dissertation zur Erlangung des akademischen Grades Vorgelegt im Fachbereich Elektrotechnik/Informatik; Universität Kassel: Kassel, Germany, 2018. [Google Scholar]
- Staffell, I.; Pfenninger, S. Using bias-corrected reanalysis to simulate current and future wind power output. Energy 2016, 114, 1224–1239. [Google Scholar] [CrossRef] [Green Version]
- Gökmen, N.; Hu, W.; Hou, P.; Chen, Z.; Sera, D.; Spataru, S. Investigation of wind speed cooling effect on PV panels in windy locations. Renew. Energy 2016, 90, 283–290. [Google Scholar] [CrossRef]
- Bhattacharya, T.; Chakraborty, A.K.; Pal, K. Effects of Ambient Temperature and Wind Speed on Performance of Monocrystalline Solar Photovoltaic Module in Tripura, India. J. Sol. Energy 2014, 2014, 1–5. [Google Scholar] [CrossRef] [Green Version]
- Camargo, L.R.; Nitsch, F.; Gruber, K.; Valdes, J.; Wuth, J.; Dorner, W. Potential analysis of hybrid renewable energy systems for self-sufficient residential use in Germany and the Czech Republic. Energies 2019, 12, 4185. [Google Scholar] [CrossRef] [Green Version]
- Chen, F.; Lu, S.M.; Tseng, K.T.; Lee, S.C.; Wang, E. Assessment of renewable energy reserves in Taiwan. Renew. Sustain. Energy Rev. 2010, 14, 2511–2528. [Google Scholar] [CrossRef]
- Vladislavleva, E.; Friedrich, T.; Neumann, F.; Wagner, M. Predicting the energy output of wind farms based on weather data: Important variables and their correlation. Renew. Energy 2013, 50, 236–243. [Google Scholar] [CrossRef] [Green Version]
- Yimen, N.; Tchotang, T.; Kanmogne, A.; Idriss, I.A.; Musa, B.; Aliyu, A.; Okonkwo, E.C.; Abba, S.I.; Tata, D.; Meva’a, L.; et al. Optimal sizing and techno-economic analysis of hybrid renewable energy systems—A case study of a photovoltaic/wind/battery/diesel system in Fanisau, Northern Nigeria. Processes 2020, 8, 1381. [Google Scholar] [CrossRef]
- Ghofrani, M.; Hosseini, N.N. Optimizing Hybrid Renewable Energy Systems: A Review. In Sustainable Energy—Technological Issues, Applications and Case Studies; IntechOpen: London, UK, 2016. [Google Scholar]
- Alaaeddin, M.H.; Zakaria, A.; Jani, J.M.; Seyajah, N. Optimization Techniques and Multi-Objective Analysis in Hybrid Solar-Wind Power Systems for Grid-Connected Supply. Proc. IOP Conf. Ser. Mater. Sci. Eng. 2019, 538, 6–12. [Google Scholar] [CrossRef]
- Shivam, K.; Tzou, J.-C.; Wu, S.-C. Multi-Objective Sizing Optimization of a Grid-Connected Solar–Wind Hybrid System using Climate Classification: A Case Study of Four Locations in Southern Taiwan. Energies 2020, 13, 2505. [Google Scholar] [CrossRef]
- Zupančič, J.; Filipič, B.; Gams, M. Genetic-programming-based multi-objective optimization of strategies for home energy-management systems. Energy 2020, 203, 117769. [Google Scholar] [CrossRef]
- Dahmane, M.; Bosche, J.; El-Hajjaji, A. Power management strategy based on weather prediction for hybrid stand-Alone system. Energy Procedia 2015, 83, 330–340. [Google Scholar] [CrossRef] [Green Version]
- Agüera-Pérez, A.; Palomares-Salas, J.C.; González de la Rosa, J.J.; Florencias-Oliveros, O. Weather forecasts for microgrid energy management: Review, discussion and recommendations. Appl. Energy 2018, 228, 265–278. [Google Scholar] [CrossRef]
- Vera, Y.E.G.; Dufo-López, R.; Bernal-Agustín, J.L. Energy management in microgrids with renewable energy sources: A literature review. Appl. Sci. 2019, 9, 3854. [Google Scholar] [CrossRef] [Green Version]
- Atanasijevic, P.; Mihailovic, P. Temperature compensation of NTC thermistors based anemometer. Sens. Actuators A Phys. 2019, 285, 210–215. [Google Scholar] [CrossRef]
- Chen, B.; Zhu, Y.Q.; Yi, Z.; Qin, M.; Huang, Q.A. Temperature effects on the wind direction measurement of 2D solid thermal wind sensors. Sensors 2015, 15, 29871–29881. [Google Scholar] [CrossRef] [Green Version]
- Chang, C.C.; Lin, C.J. LIBSVM: A Library for support vector machines. ACM Trans. Intell. Syst. Technol. 2011, 2, 27. [Google Scholar] [CrossRef]
- Mickey, R.; Rencher, A.C. Methods of Multivariate Analysis; Wiley: Hoboken, NJ, USA, 1998; Volume 93, ISBN 0471418897. [Google Scholar]
- Yakunin, A.G. 3D Ultrasonic Anemometer with tetrahedral arrangement of sensors. J. Phys. Conf. Ser. 2017, 881. [Google Scholar] [CrossRef] [Green Version]
- Ghahramani, A.; Zhu, M.; Przybyla, R.J.; Andersen, M.P.; Galicia, P.J.; Peffer, T.E.; Zhang, H.; Arens, E. Measuring Air Speed with a Low-Power MEMS Ultrasonic Anemometer via Adaptive Phase Tracking. IEEE Sens. J. 2019, 19, 8136–8145. [Google Scholar] [CrossRef] [Green Version]
- Ma, B.; Teng, J.; Zhu, H.; Zhou, R.; Ju, Y.; Liu, S. Three-dimensional wind measurement based on ultrasonic sensor array and multiple signal classification. Sensors 2020, 20, 523. [Google Scholar] [CrossRef] [Green Version]
- Gao, Y.; Ramirez, B.C.; Hoff, S.J. Omnidirectional thermal anemometer for low airspeed and multi-point measurement applications. Comput. Electron. Agric. 2016, 127, 439–450. [Google Scholar] [CrossRef] [Green Version]
- Palma, J.; Labbé, R. Rugged constant-temperature thermal anemometer. Rev. Sci. Instrum. 2016, 87, 125112. [Google Scholar] [CrossRef] [Green Version]
- Perry, A.E.; Morrison, G.L. A study of the constant-temperature hot-wire anemometer. J. Fluid Mech. 1971, 47, 577–599. [Google Scholar] [CrossRef]
- Shen, C.H.; Lin, P.H.; Chen, S.J. Research on an ultra-low power thermoelectric-type anemometer. IOP Conf. Ser. Mater. Sci. Eng. 2018, 383, 012021. [Google Scholar] [CrossRef] [Green Version]
- Piotto, M.; Dei, M.; Pennelli, G.; Bruschi, P. A Miniaturized 2D Solid State Anemometer Based on Thermal Flow Sensors. Procedia Chem. 2009, 1, 1463–1466. [Google Scholar] [CrossRef]
- Zhu, Y.; Chen, B.; Qin, M.; Huang, Q.A. 2-D Micromachined Thermal Wind Sensors—A Review. IEEE Internet Things J. 2014, 1, 216–232. [Google Scholar] [CrossRef]
- Shi, M.; Holmes, A.S.; Yeatman, E.M. Piezoelectric wind velocity sensor based on the variation of galloping frequency with drag force. Appl. Phys. Lett. 2020, 116. [Google Scholar] [CrossRef]
- Leoni, A.; Stornelli, V.; Pantoli, L. A low-cost portable spherical directional anemometer for fixed points measurement. Sens. Actuators A Phys. 2018, 280, 543–551. [Google Scholar] [CrossRef]
- Li, G.Z.; Zhao, S.; Zhu, R. Wearable Anemometer with Multi-Sensing of Wind Absolute Orientation, Wind Speed, Attitude, and Heading. IEEE Sens. J. 2019, 19, 297–303. [Google Scholar] [CrossRef]
- Liu, C.; Shi, Y.; Yu, X.; Wang, T.; King, M.D. Design of thermal wind sensor with constant power control and wind vector measurement method. PLoS ONE 2020, 15, 1–22. [Google Scholar] [CrossRef] [PubMed]
- Nezhad, M.M.; Neshat, M.; Heydari, A.; Razmjoo, A.; Piras, G.; Garcia, D.A. A new methodology for offshore wind speed assessment integrating Sentinel-1, ERA-Interim and in-situ measurement. Renew. Energy 2021, 172, 1301–1313. [Google Scholar] [CrossRef]
- Zhang, Y.; Pan, G.; Chen, B.; Han, J.; Zhao, Y.; Zhang, C. Short-term wind speed prediction model based on GA-ANN improved by VMD. Renew. Energy 2020, 156, 1373–1388. [Google Scholar] [CrossRef]
- Neshat, M.; Nezhad, M.M.; Abbasnejad, E.; Mirjalili, S.; Tjernberg, L.B.; Astiaso Garcia, D.; Alexander, B.; Wagner, M. A deep learning-based evolutionary model for short-term wind speed forecasting: A case study of the Lillgrund offshore wind farm. Energy Convers. Manag. 2021, 236, 114002. [Google Scholar] [CrossRef]
- Filik, Ü.B.; Filik, T. Wind Speed Prediction Using Artificial Neural Networks Based on Multiple Local Measurements in Eskisehir. Energy Procedia 2017, 107, 264–269. [Google Scholar] [CrossRef]
- Huang, C.J.; Kuo, P.H. A short-term wind speed forecasting model by using artificial neural networks with stochastic optimization for renewable energy systems. Energies 2018, 11, 2777. [Google Scholar] [CrossRef] [Green Version]
- Zhang, D.; Peng, X.; Pan, K.; Liu, Y. A novel wind speed forecasting based on hybrid decomposition and online sequential outlier robust extreme learning machine. Energy Convers. Manag. 2019, 180, 338–357. [Google Scholar] [CrossRef]
- Qin, Q.; Lai, X.; Zou, J. Direct multistep wind speed forecasting using LSTM neural network combining EEMD and fuzzy entropy. Appl. Sci. 2019, 9, 126. [Google Scholar] [CrossRef] [Green Version]
- Shivam, K.; Tzou, J.-C.; Wu, S.-C. Multi-Step Short-Term Wind Speed Prediction Using a Residual Dilated Causal Convolutional Network with Nonlinear Attention. Energies 2020, 13, 1772. [Google Scholar] [CrossRef] [Green Version]
- Jiang, P.; Qin, S.; Wu, J.; Sun, B. Time Series Analysis and Forecasting for Wind Speeds Using Support Vector Regression Coupled with Artificial Intelligent Algorithms. Math. Probl. Eng. 2015, 2015, 939305. [Google Scholar] [CrossRef] [Green Version]
- Gangwar, S.; Bali, V.; Kumar, A. Comparative Analysis of Wind Speed Forecasting Using LSTM and SVM. ICST Trans. Scalable Inf. Syst. 2018, 7, 159407. [Google Scholar] [CrossRef]
- Laref, R.; Losson, E.; Sava, A.; Siadat, M. Support vector machine regression for calibration transfer between electronic noses dedicated to air pollution monitoring. Sensors 2018, 18, 3716. [Google Scholar] [CrossRef] [Green Version]
- Ma, Y.; Xie, S.; Zhang, X.; Luo, Y. Hybrid calibration method for six-component force/torque transducers of wind tunnel balance based on support vector machines. Chin. J. Aeronaut. 2013, 26, 554–562. [Google Scholar] [CrossRef] [Green Version]
- Garcia-Ruiz, R.A.; Blanco-Claraco, J.L.; Lopez-Martinez, J.; Callejon-Ferre, A.J. Uncertainty-Aware Calibration of a Hot-Wire Anemometer With Gaussian Process Regression. IEEE Sens. J. 2019, 19, 7515–7524. [Google Scholar] [CrossRef]
- Cho, W.J.; Kim, H.J.; Jung, D.H.; Han, H.J.; Cho, Y.Y. Hybrid signal-processing method based on neural network for prediction of NO3, K, Ca, and Mg ions in hydroponic solutions using an array of ion-selective electrodes. Sensors 2019, 19, 5508. [Google Scholar] [CrossRef] [PubMed] [Green Version]
- Azad, A.K.; Wang, L.; Guo, N.; Tam, H.-Y.; Lu, C. Signal processing using artificial neural network for BOTDA sensor system. Opt. Express 2016, 24, 6769. [Google Scholar] [CrossRef]
- Bisgin, H.; Bera, T.; Ding, H.; Semey, H.G.; Wu, L.; Liu, Z.; Barnes, A.E.; Langley, D.A.; Pava-Ripoll, M.; Vyas, H.J.; et al. Comparing SVM and ANN based Machine Learning Methods for Species Identification of Food Contaminating Beetles. Sci. Rep. 2018, 8, 1–12. [Google Scholar] [CrossRef] [PubMed]
- Patel, J.P.; Upadhyay, S.H. Comparison between Artificial Neural Network and Support Vector Method for a Fault Diagnostics in Rolling Element Bearings. Procedia Eng. 2016, 144, 390–397. [Google Scholar] [CrossRef] [Green Version]
- Shivam, K.; Tzou, J.; Wu, S. A multi-objective predictive energy management strategy for residential grid-connected PV-battery hybrid systems based on machine learning technique. Energy Convers. Manag. 2021, 237, 114103. [Google Scholar] [CrossRef]
- Wang, J.H.; Lin, G.F.; Chang, M.J.; Huang, I.H.; Chen, Y.R. Real-Time Water-Level Forecasting Using Dilated Causal Convolutional Neural Networks. Water Resour. Manag. 2019, 33, 3759–3780. [Google Scholar] [CrossRef]
- Khosravi, A.; Koury, R.N.N.; Machado, L.; Pabon, J.J.G. Prediction of wind speed and wind direction using artificial neural network, support vector regression and adaptive neuro-fuzzy inference system. Sustain. Energy Technol. Assess. 2018, 25, 146–160. [Google Scholar] [CrossRef]
- Chevalier, R.F.; Hoogenboom, G.; McClendon, R.W.; Paz, J.A. Support vector regression with reduced training sets for air temperature prediction: A comparison with artificial neural networks. Neural Comput. Appl. 2011, 20, 151–159. [Google Scholar] [CrossRef]
- Li, X.; Sha, J.; Wang, Z.L. A comparative study of multiple linear regression, artificial neural network and support vector machine for the prediction of dissolved oxygen. Hydrol. Res. 2017, 48, 1214–1225. [Google Scholar] [CrossRef]
- Ouma, Y.O.; Okuku, C.O.; Njau, E.N. Use of Artificial Neural Networks and Multiple Linear Regression Model for the Prediction of Dissolved Oxygen in Rivers: Case Study of Hydrographic Basin of River Nyando, Kenya. Complexity 2020, 2020. [Google Scholar] [CrossRef]
- Tosun, E.; Aydin, K.; Bilgili, M. Comparison of linear regression and artificial neural network model of a diesel engine fueled with biodiesel-alcohol mixtures. Alex. Eng. J. 2016, 55, 3081–3089. [Google Scholar] [CrossRef] [Green Version]
- Tsakiri, K.; Marsellos, A.; Kapetanakis, S. Artificial neural network and multiple linear regression for flood prediction in Mohawk River, New York. Water 2018, 10, 1158. [Google Scholar] [CrossRef] [Green Version]
- Aprillia, H.; Yang, H.T.; Huang, C.M. Optimal decomposition and reconstruction of discrete wavelet transformation for short-term load forecasting. Energies 2019, 12, 4654. [Google Scholar] [CrossRef] [Green Version]
- Ting, Y.H. Self-Regulating PTC Heating Systems: A New Approach for Electric Heating Appliances. IEEE Trans. Ind. Appl. 1972, IA-8, 338–344. [Google Scholar] [CrossRef]
- Li, J.; Chang, C.; Li, X.; Li, Y.; Guan, G. A new thermal controlling material with positive temperature coefficient for body warming: Preparation and characterization. Materials 2019, 12, 1758. [Google Scholar] [CrossRef] [PubMed] [Green Version]
- SparkFun. Grid-EYE Infrared Array Breakout—AMG8833 (Qwiic). Available online: https://www.sparkfun.com/products/14607 (accessed on 15 January 2021).
- LILYGO®. T-Micro32 V2.0 Wifi wireless Bluetooth Module ESP32 PICO-D4 IPEX ESP-32(1). Available online: http://www.lilygo.cn/prod_view.aspx?TypeId=50033&Id=1091&FId=t3:50033:3 (accessed on 15 January 2021).
- Hornik, K.; Stinchcombe, M.; White, H. Multilayer feedforward networks are universal approximators. Neural Netw. 1989, 2, 359–366. [Google Scholar] [CrossRef]
- Liu, D.; Yuan, Y.; Liao, S. Artificial neural network vs. nonlinear regression for gold content estimation in pyrometallurgy. Expert Syst. Appl. 2009, 36, 10397–10400. [Google Scholar] [CrossRef]
- Lecun, Y.; Bengio, Y.; Hinton, G. Deep learning. Nature 2015, 521, 436–444. [Google Scholar] [CrossRef]
- Stangierski, J.; Weiss, D.; Kaczmarek, A. Multiple regression models and Artificial Neural Network (ANN) as prediction tools of changes in overall quality during the storage of spreadable processed Gouda cheese. Eur. Food Res. Technol. 2019, 245, 2539–2547. [Google Scholar] [CrossRef] [Green Version]
- Landi, A.; Piaggi, P.; Laurino, M.; Menicucci, D. Artificial neural networks for nonlinear regression and classification. In Proceedings of the 2010 10th International Conference on Intelligent Systems Design and Applications, Cairo, Egypt, 29 November–1 December 2010; pp. 115–120. [Google Scholar] [CrossRef]
- Jamieson, K.; Talwalkar, A. Non-stochastic best arm identification and hyperparameter optimization. arXiv 2016, arXiv:1502.07943. [Google Scholar]
- Kingma, D.P.; Ba, J.L. Adam: A method for stochastic optimization. arXiv 2014, arXiv:1412.6980. [Google Scholar]
- Pedregosa, F.; Varoquaux, G.; Gramfort, A.; Michel, V.; Thirion, B.; Grisel, O.; Blondel, M.; Prettenhofer, P.; Weiss, R.; Dubourg, V.; et al. Scikit-learn: Machine Learning in Python. J. Mach. Learn. Res. 2011, 12, 2825–2830. [Google Scholar]
- Bucchianico, A. DiCoefficient of Determination (R2). In Wiley StatsRef: Statistics Reference Online; John Wiley & Sons Ltd.: Chichester, UK, 2014; pp. 1–2. [Google Scholar]
- Colin Cameron, A.; Windmeijer, F.A.G. An R-squared measure of goodness of fit for some common nonlinear regression models. J. Econom. 1997, 77, 329–342. [Google Scholar] [CrossRef]
Figure 1.
Diagram of proposed sensing device. (a) Diagram showing the working principle, (b) completely assembled system, (c) picture of proposed system assembled on a 3D printed fixture.
Figure 1.
Diagram of proposed sensing device. (a) Diagram showing the working principle, (b) completely assembled system, (c) picture of proposed system assembled on a 3D printed fixture.


Figure 2.
Temperature distribution measurements of the heat sink at different wind speeds and directions.
Figure 2.
Temperature distribution measurements of the heat sink at different wind speeds and directions.
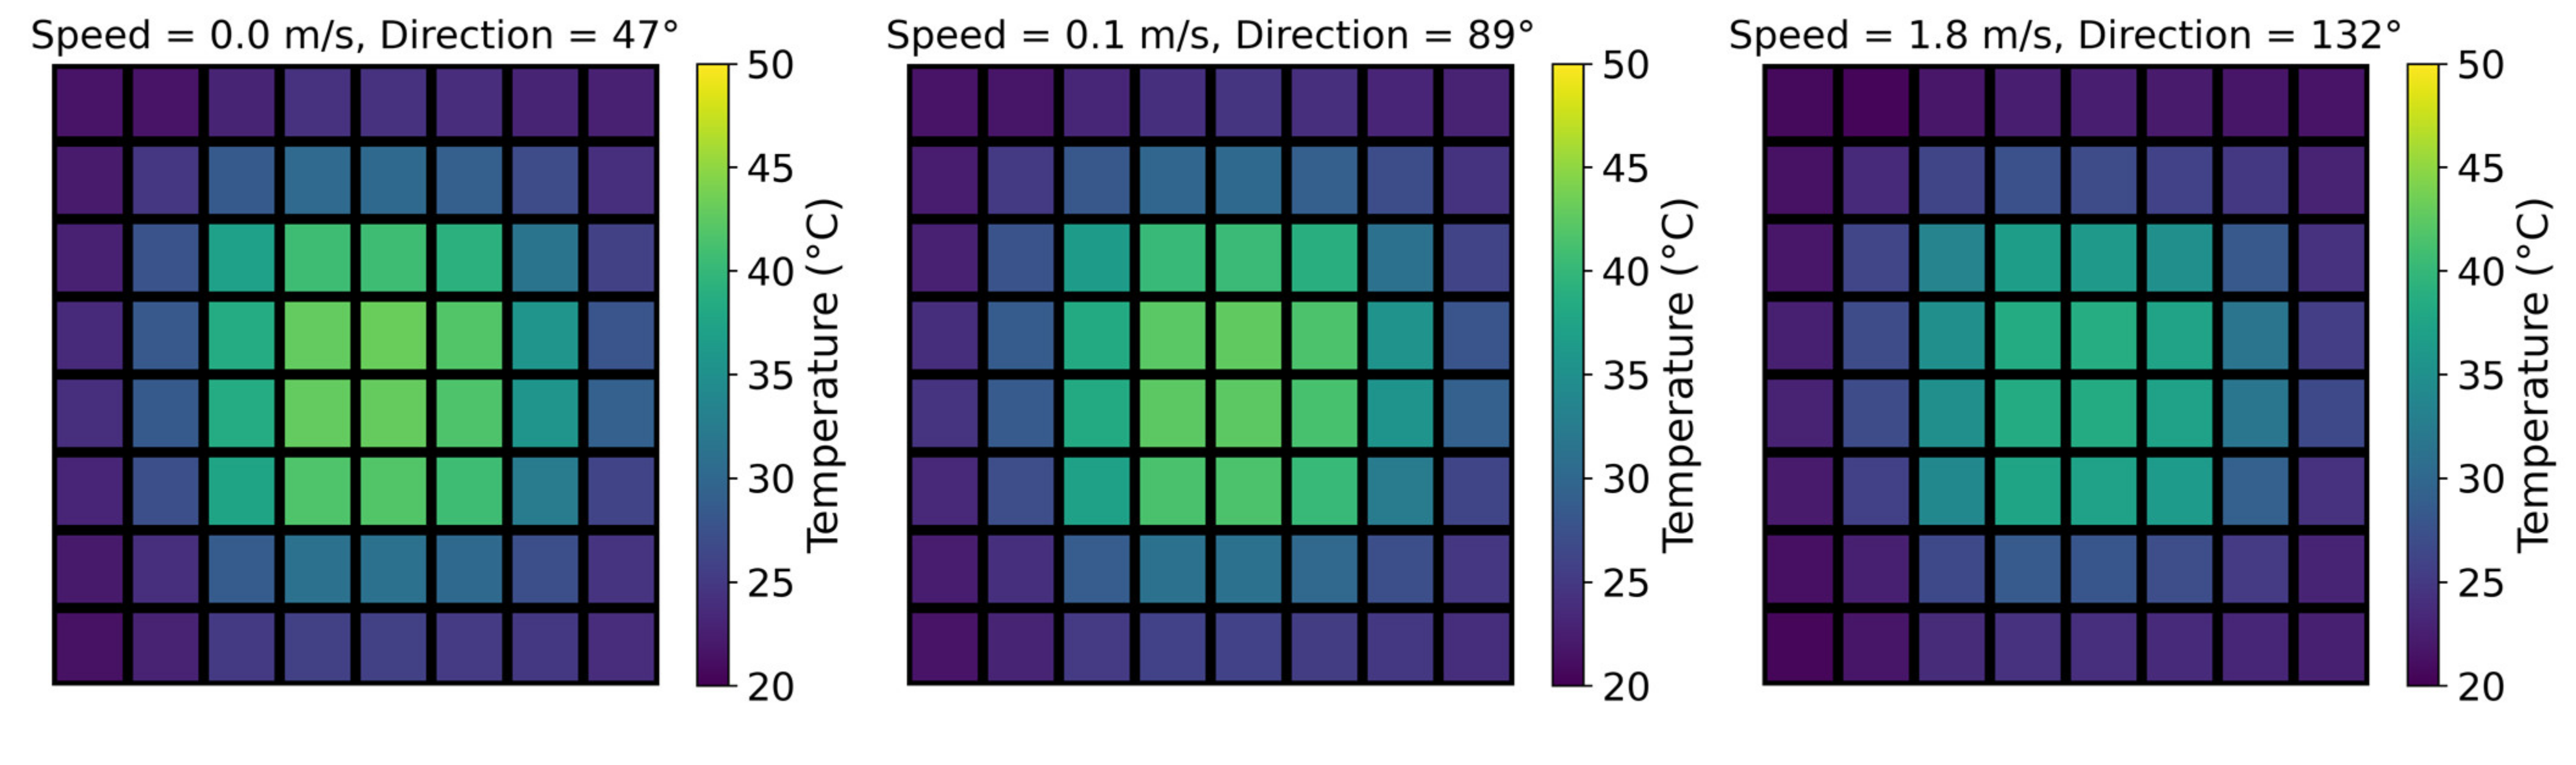
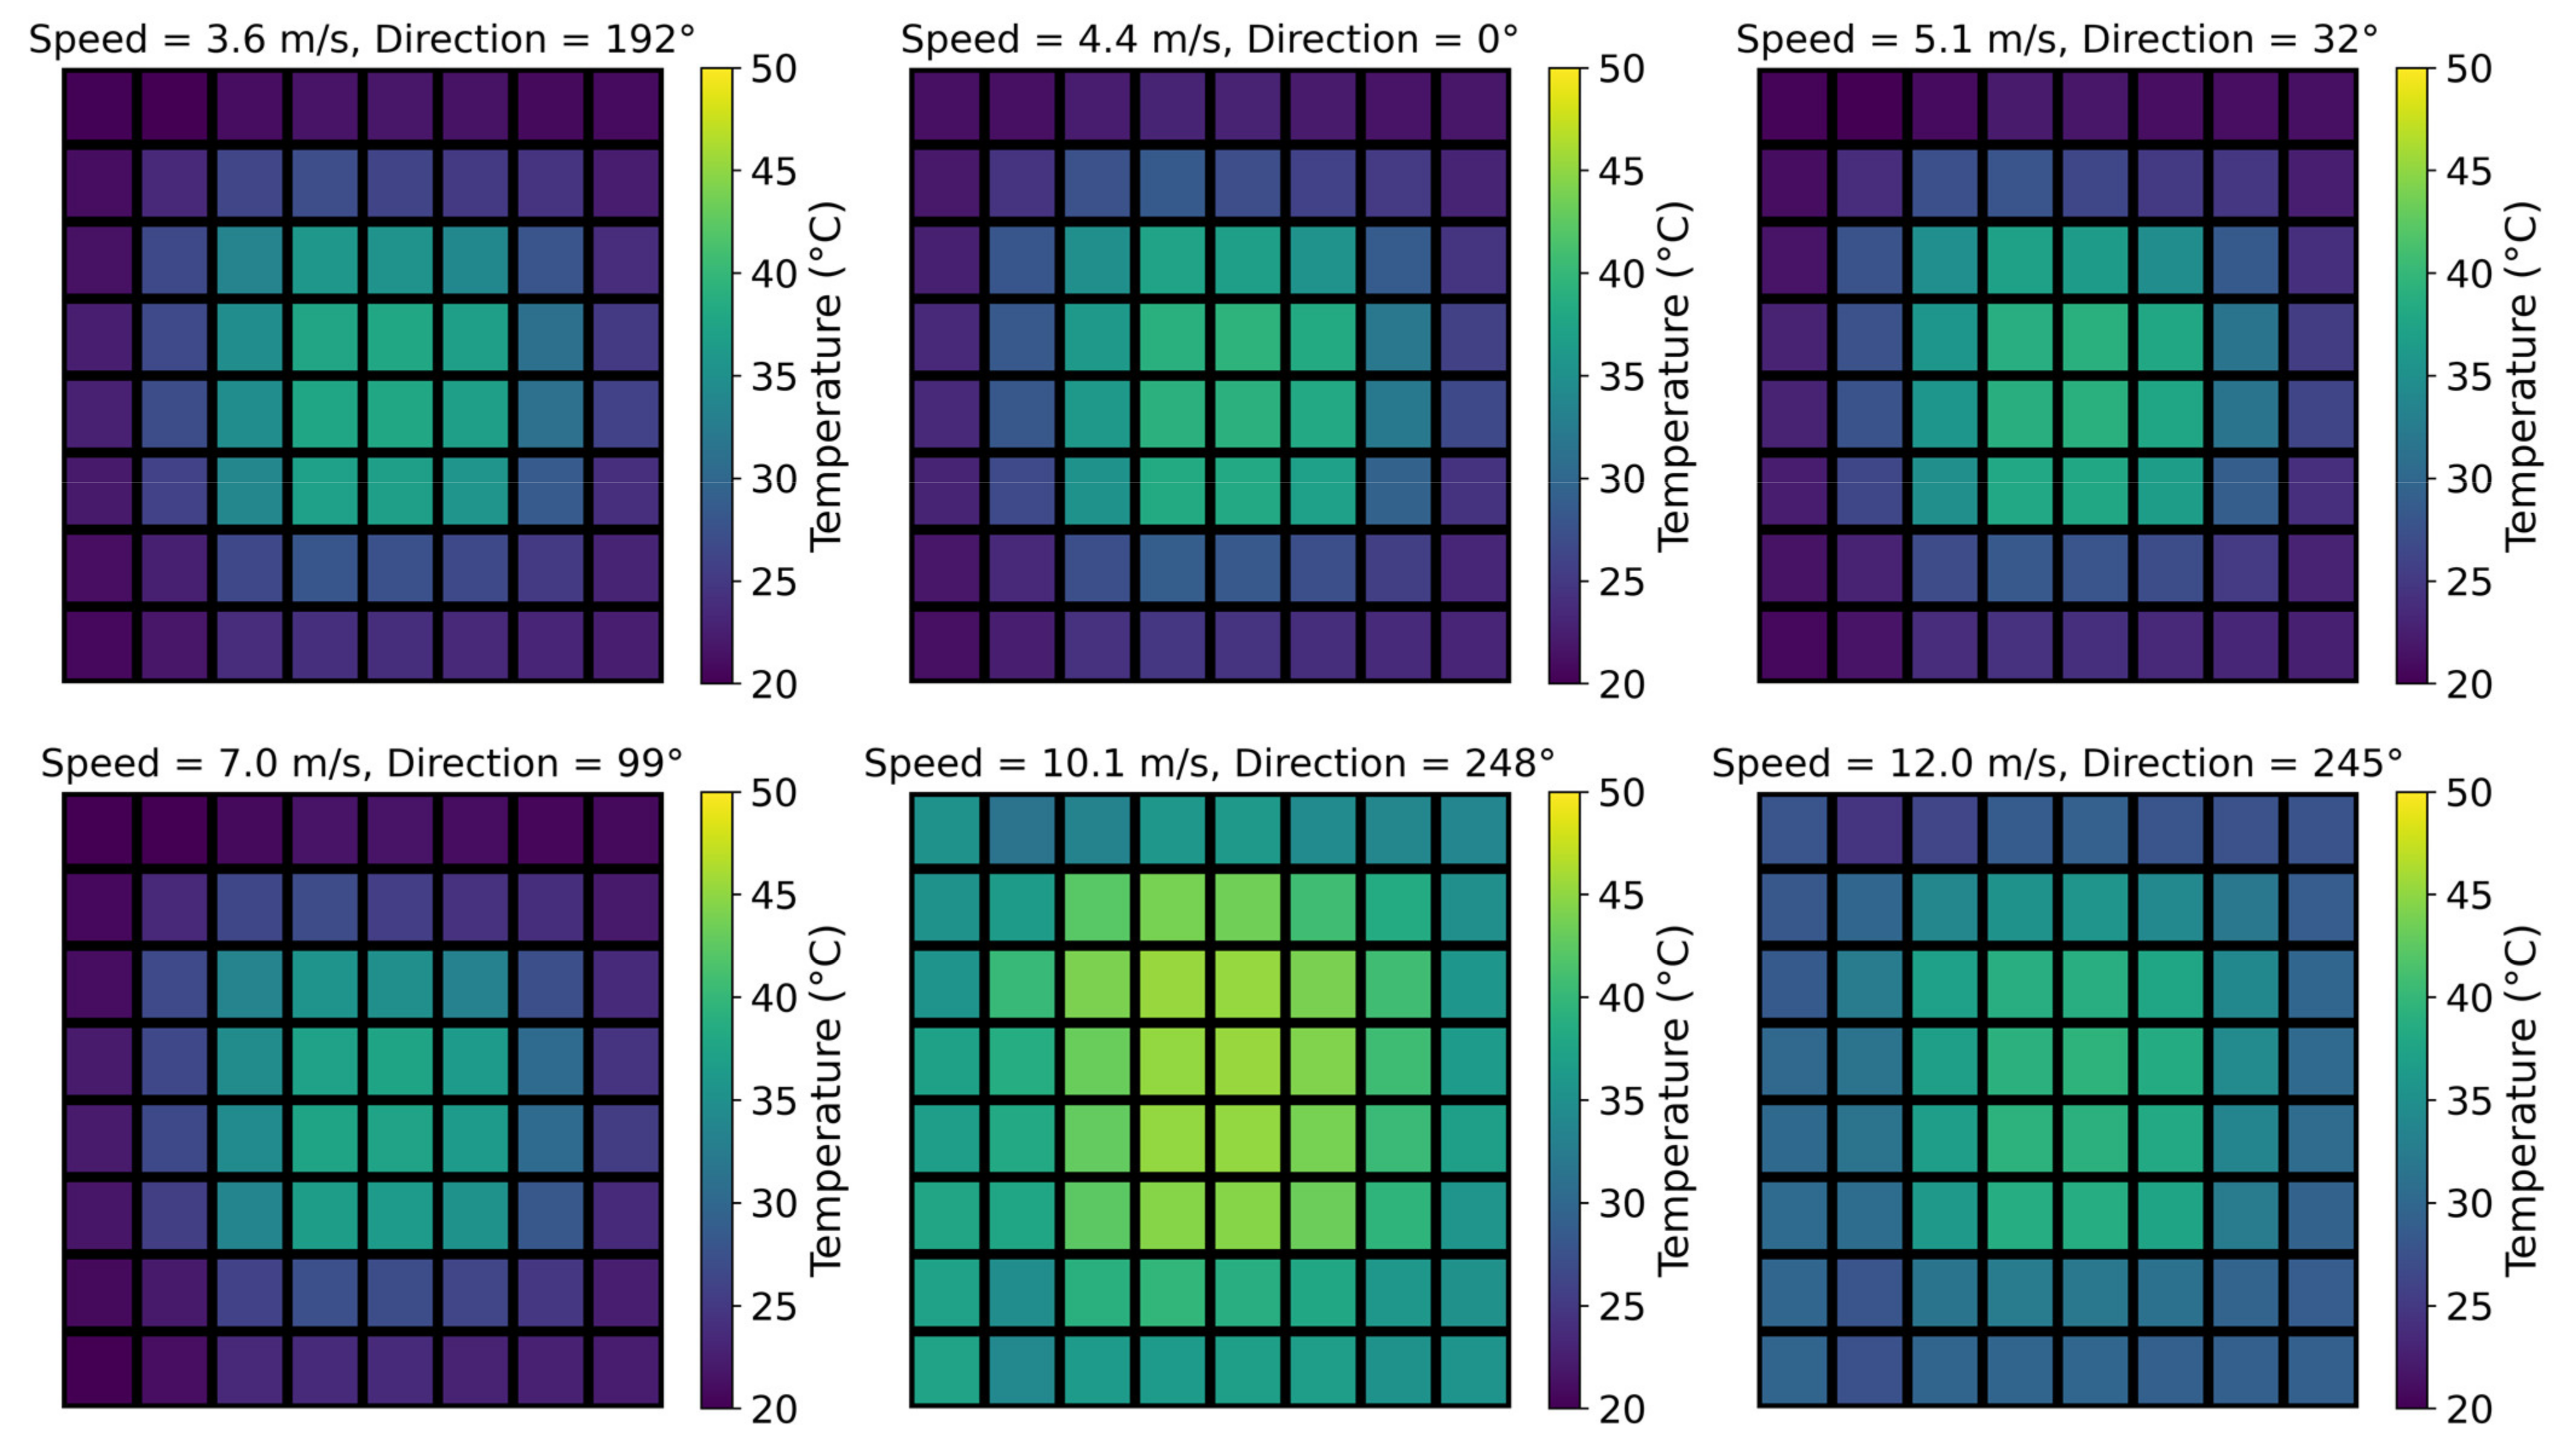
Figure 3.
(a) Estimation and working principle proposed wind speed and direction sensing system using ANN models. (b) Potential application of the proposed system.
Figure 3.
(a) Estimation and working principle proposed wind speed and direction sensing system using ANN models. (b) Potential application of the proposed system.
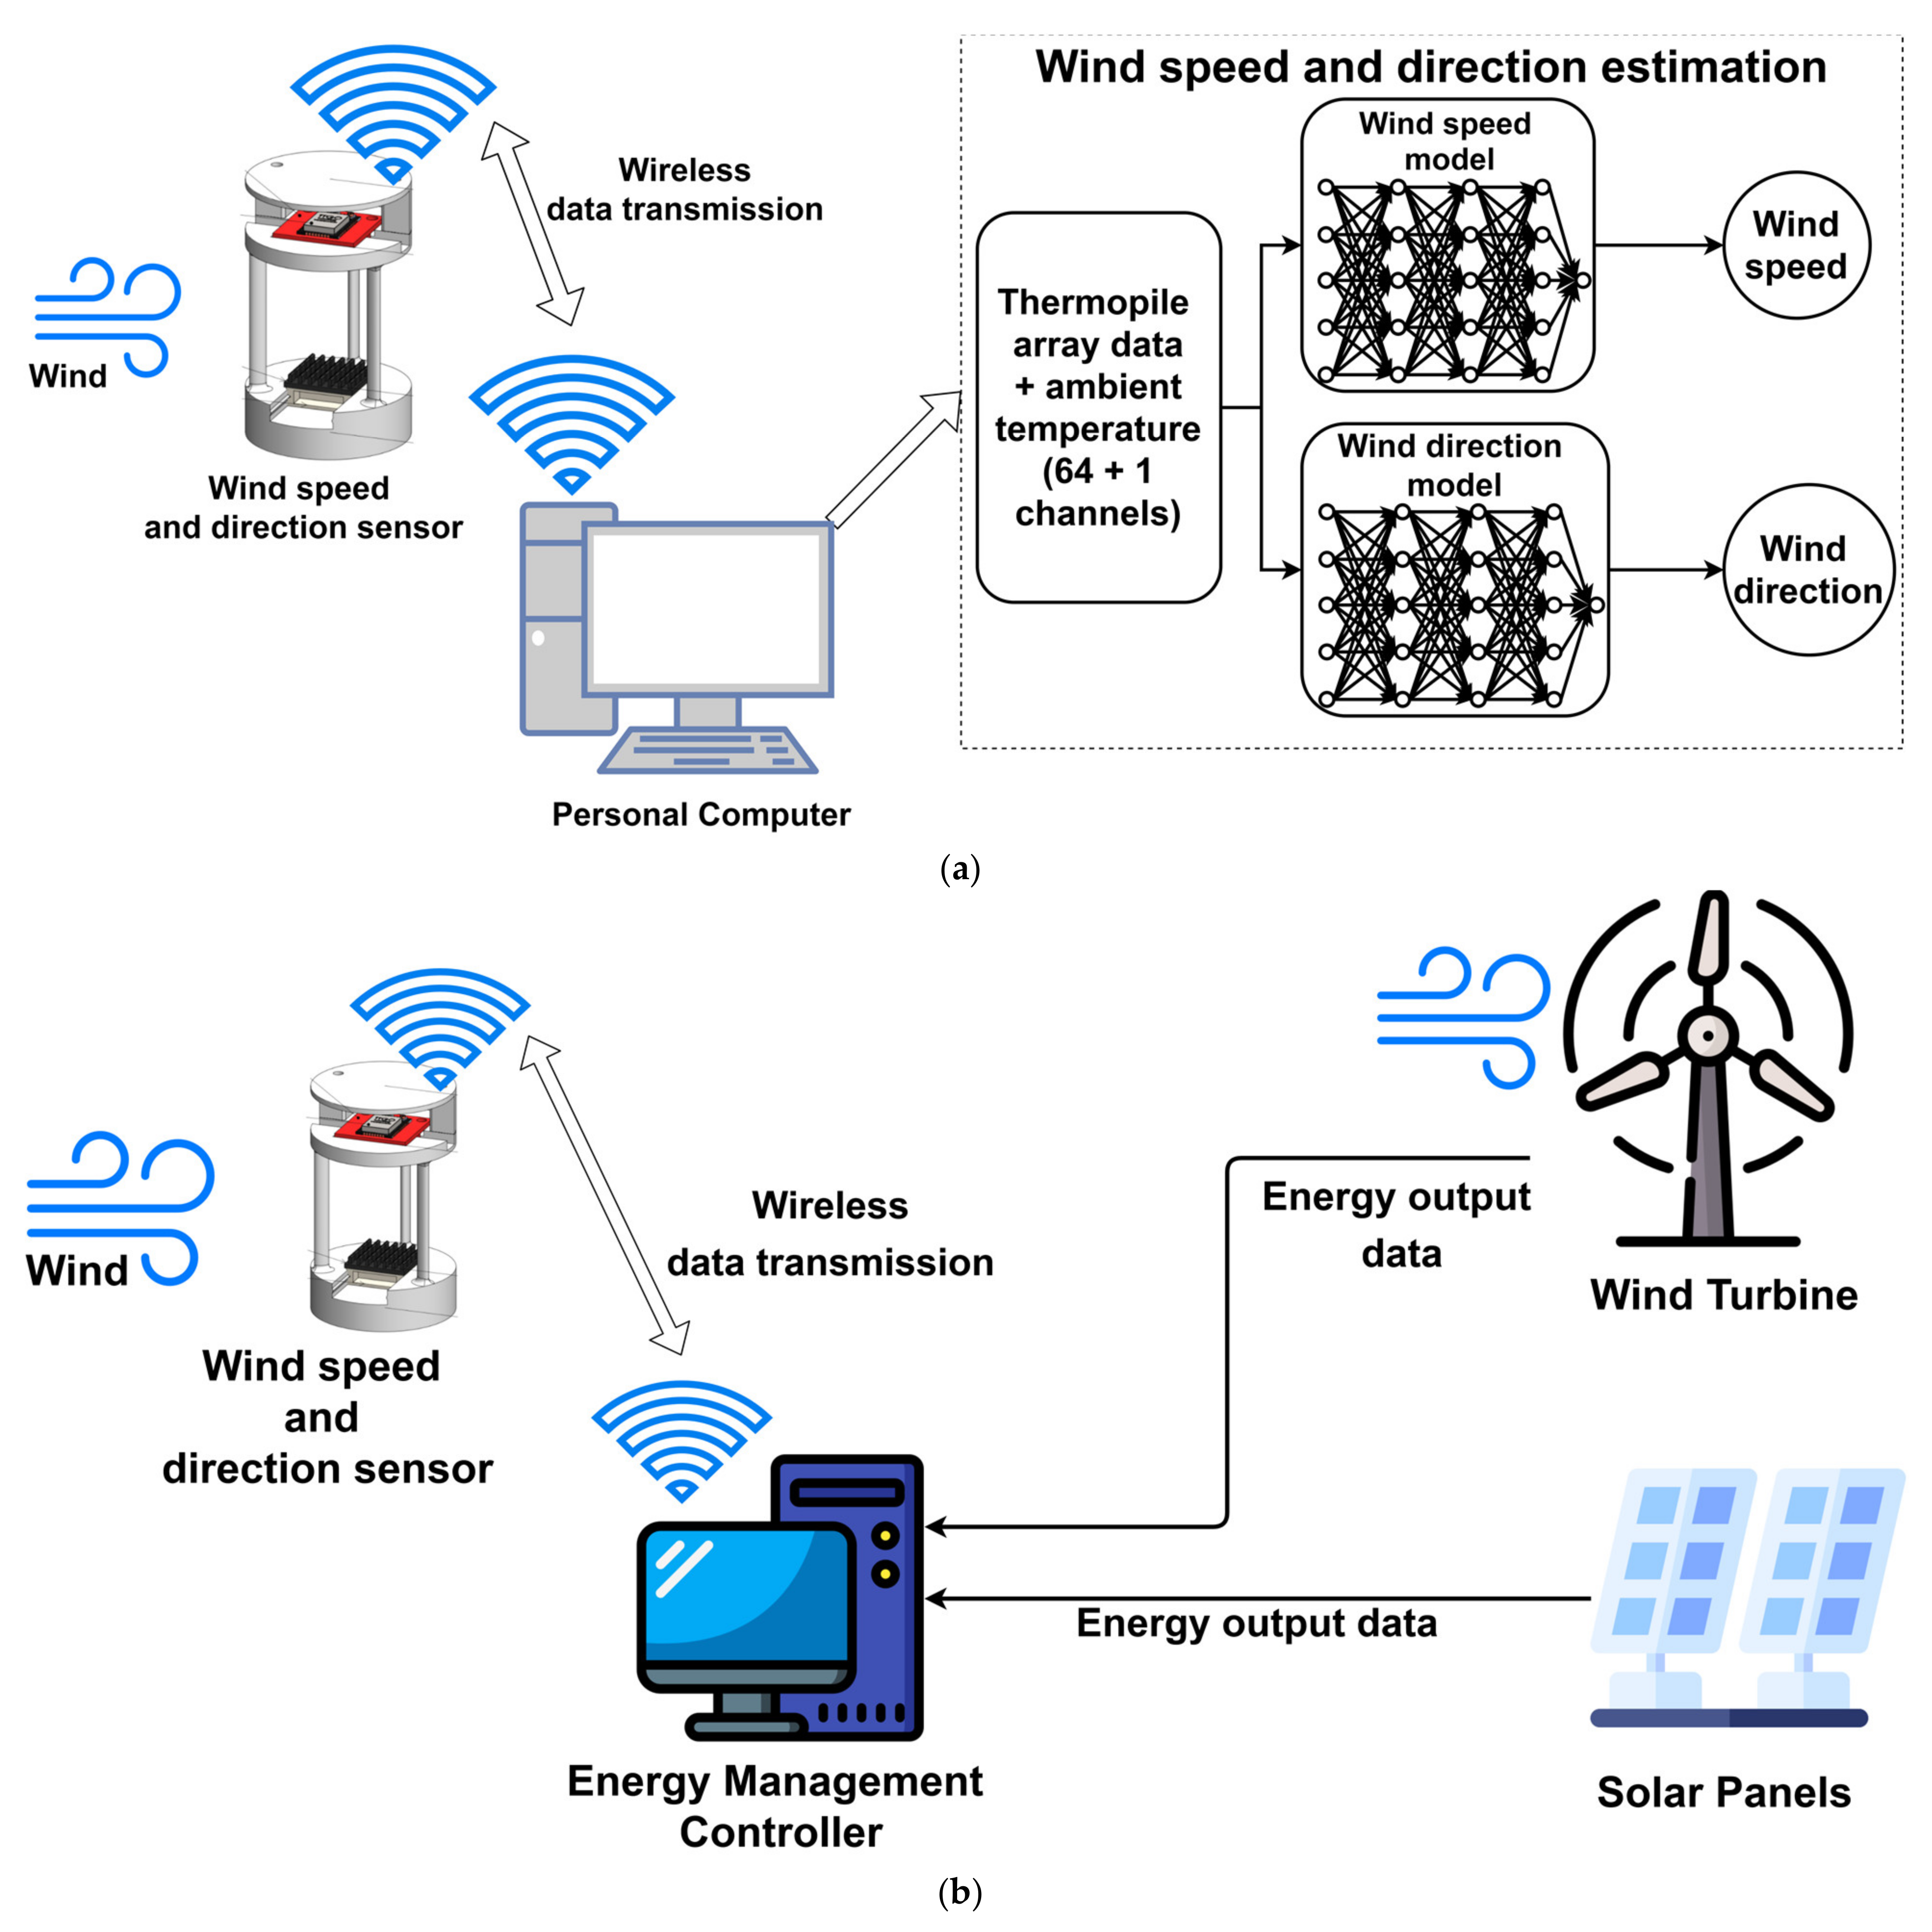
Figure 4.
Images of sensors installed for experimental setup. (a) Picture taken from below showing the cup anemometer, wind vane and proposed sensing system installed on a vertical pole and (b) picture taken from the rooftop showing the positions of different sensors on the fixture. (c) Picture taken from the top showing the arrangement of different sensors.

Figure 5.
The plots of 168 h of data collected for this study, including thermopile array, ambient temperature, wind speed and wind direction.
Figure 5.
The plots of 168 h of data collected for this study, including thermopile array, ambient temperature, wind speed and wind direction.
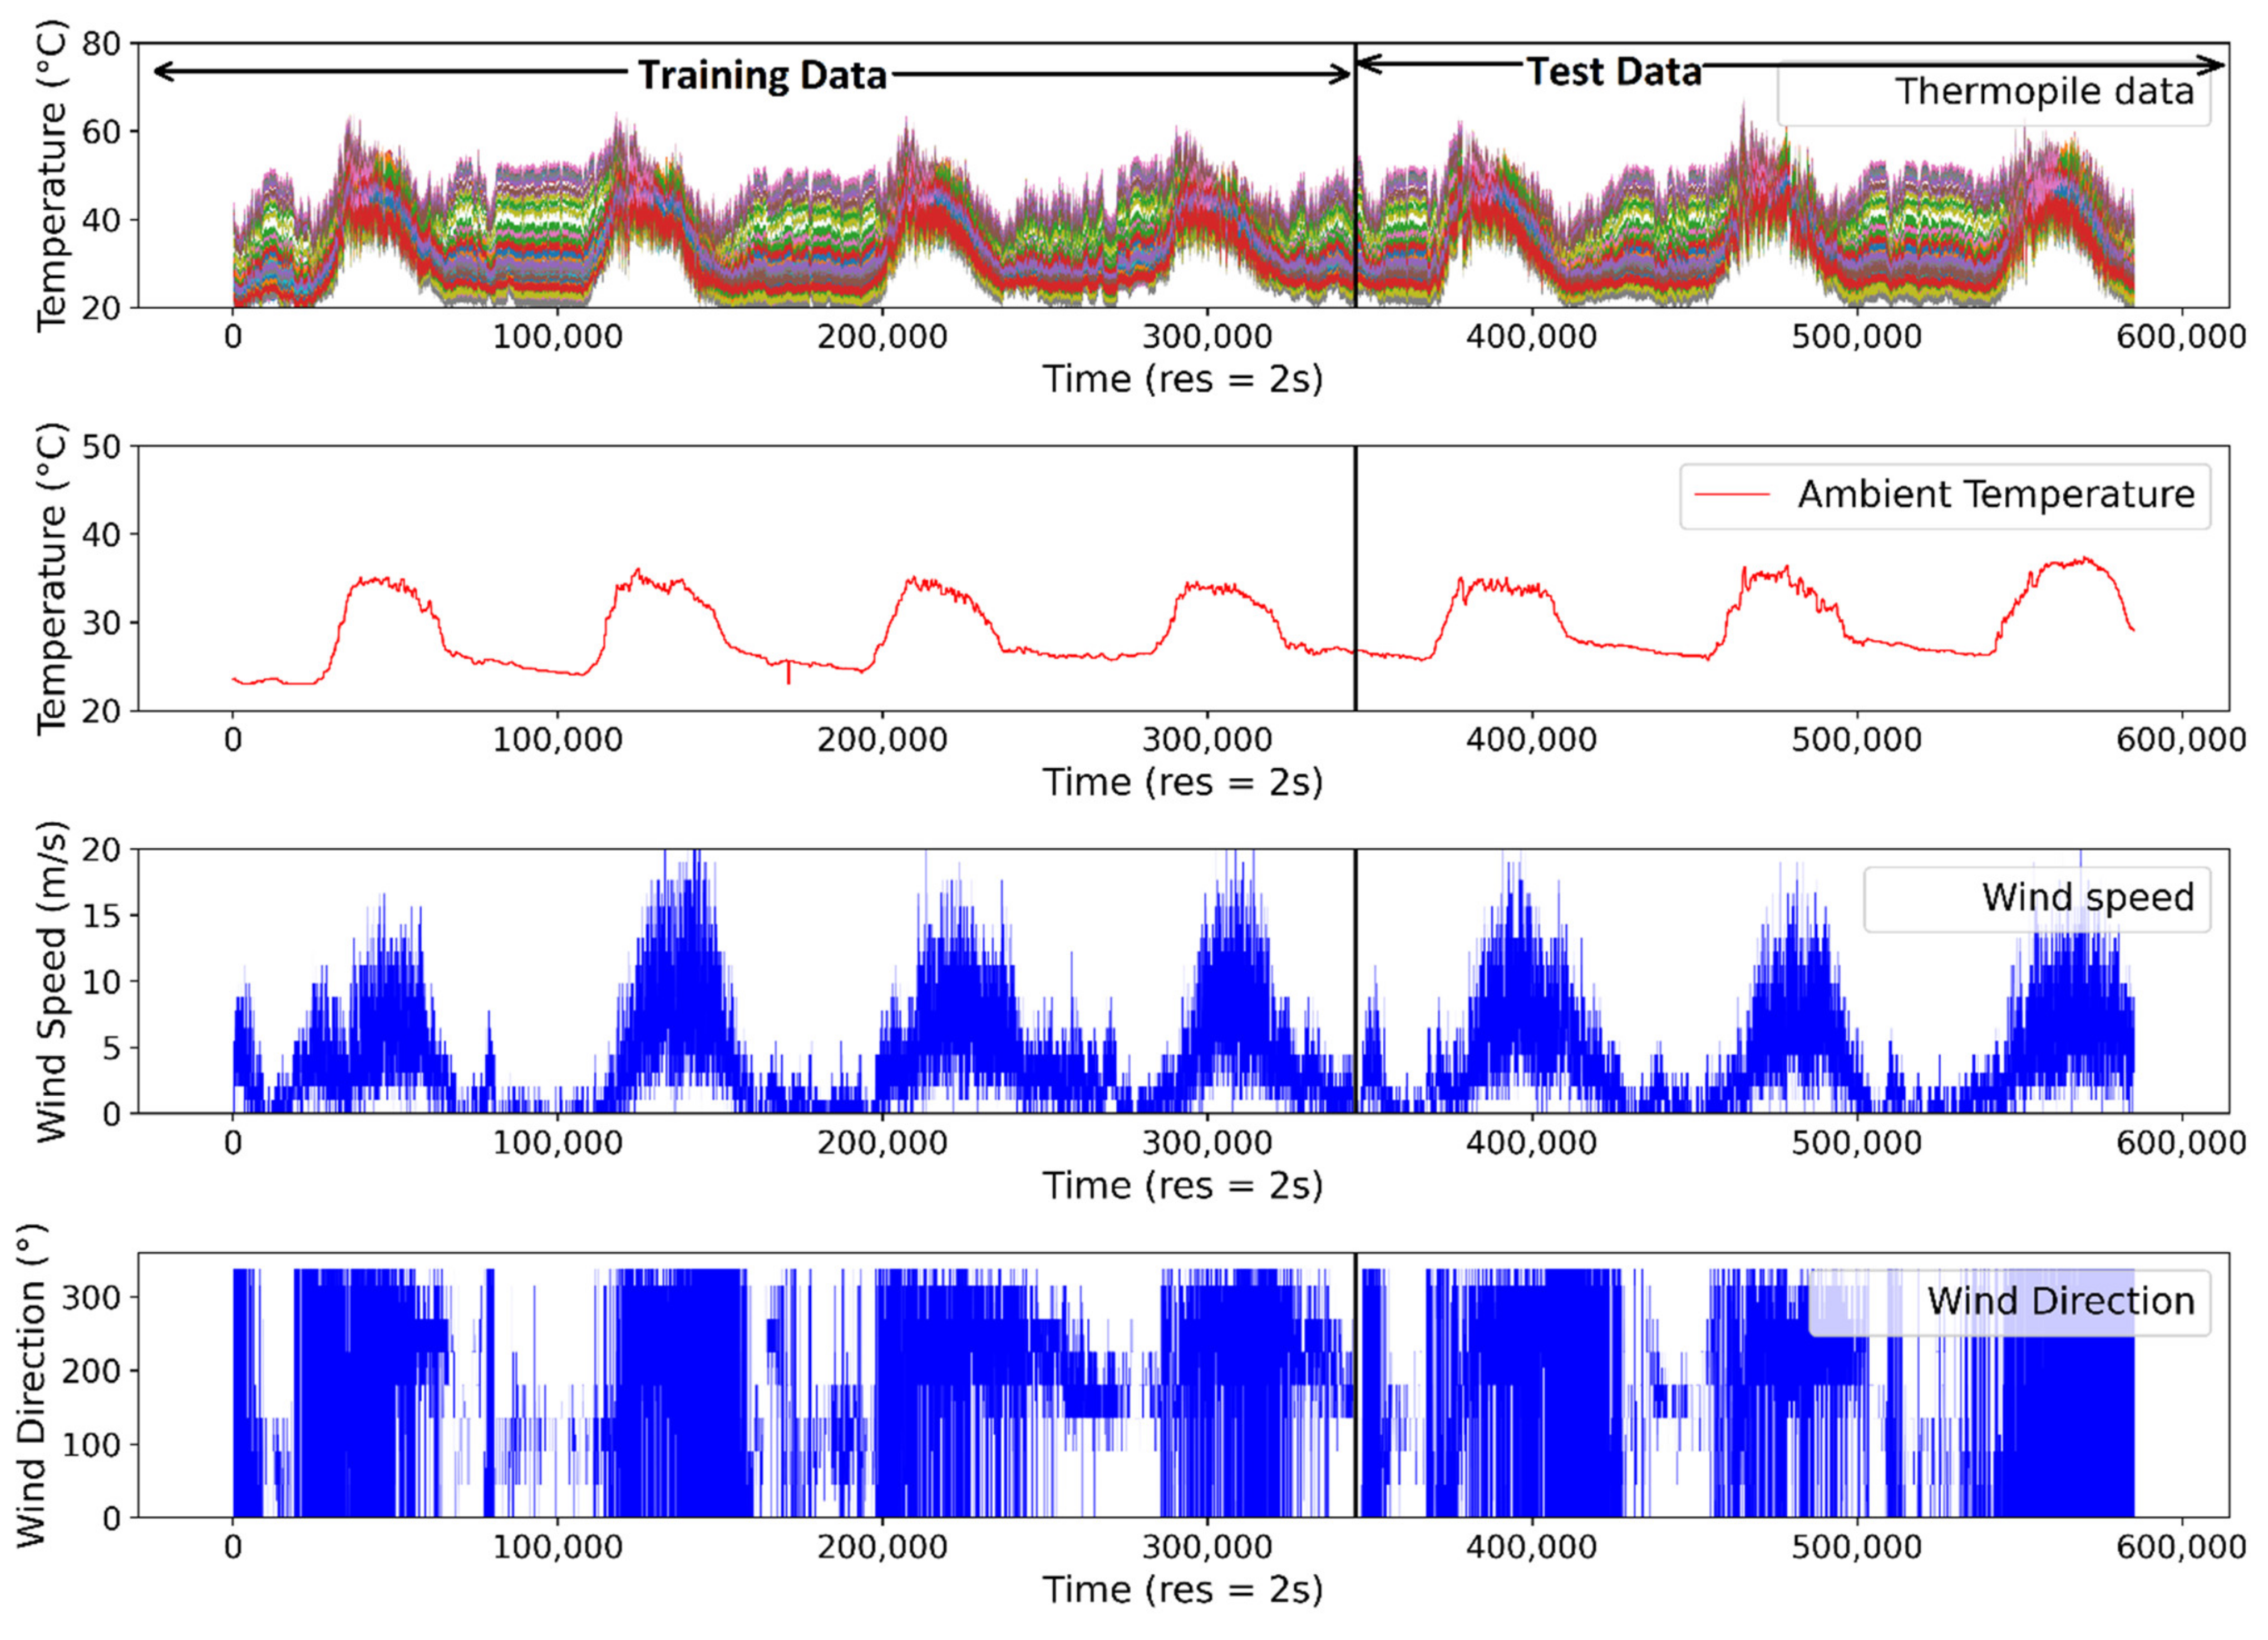
Figure 6.
Comparison of predicted/estimated and observed wind speed at 10-s sampling interval for (a) ANN, (b) SVM and (c) LR.
Figure 6.
Comparison of predicted/estimated and observed wind speed at 10-s sampling interval for (a) ANN, (b) SVM and (c) LR.

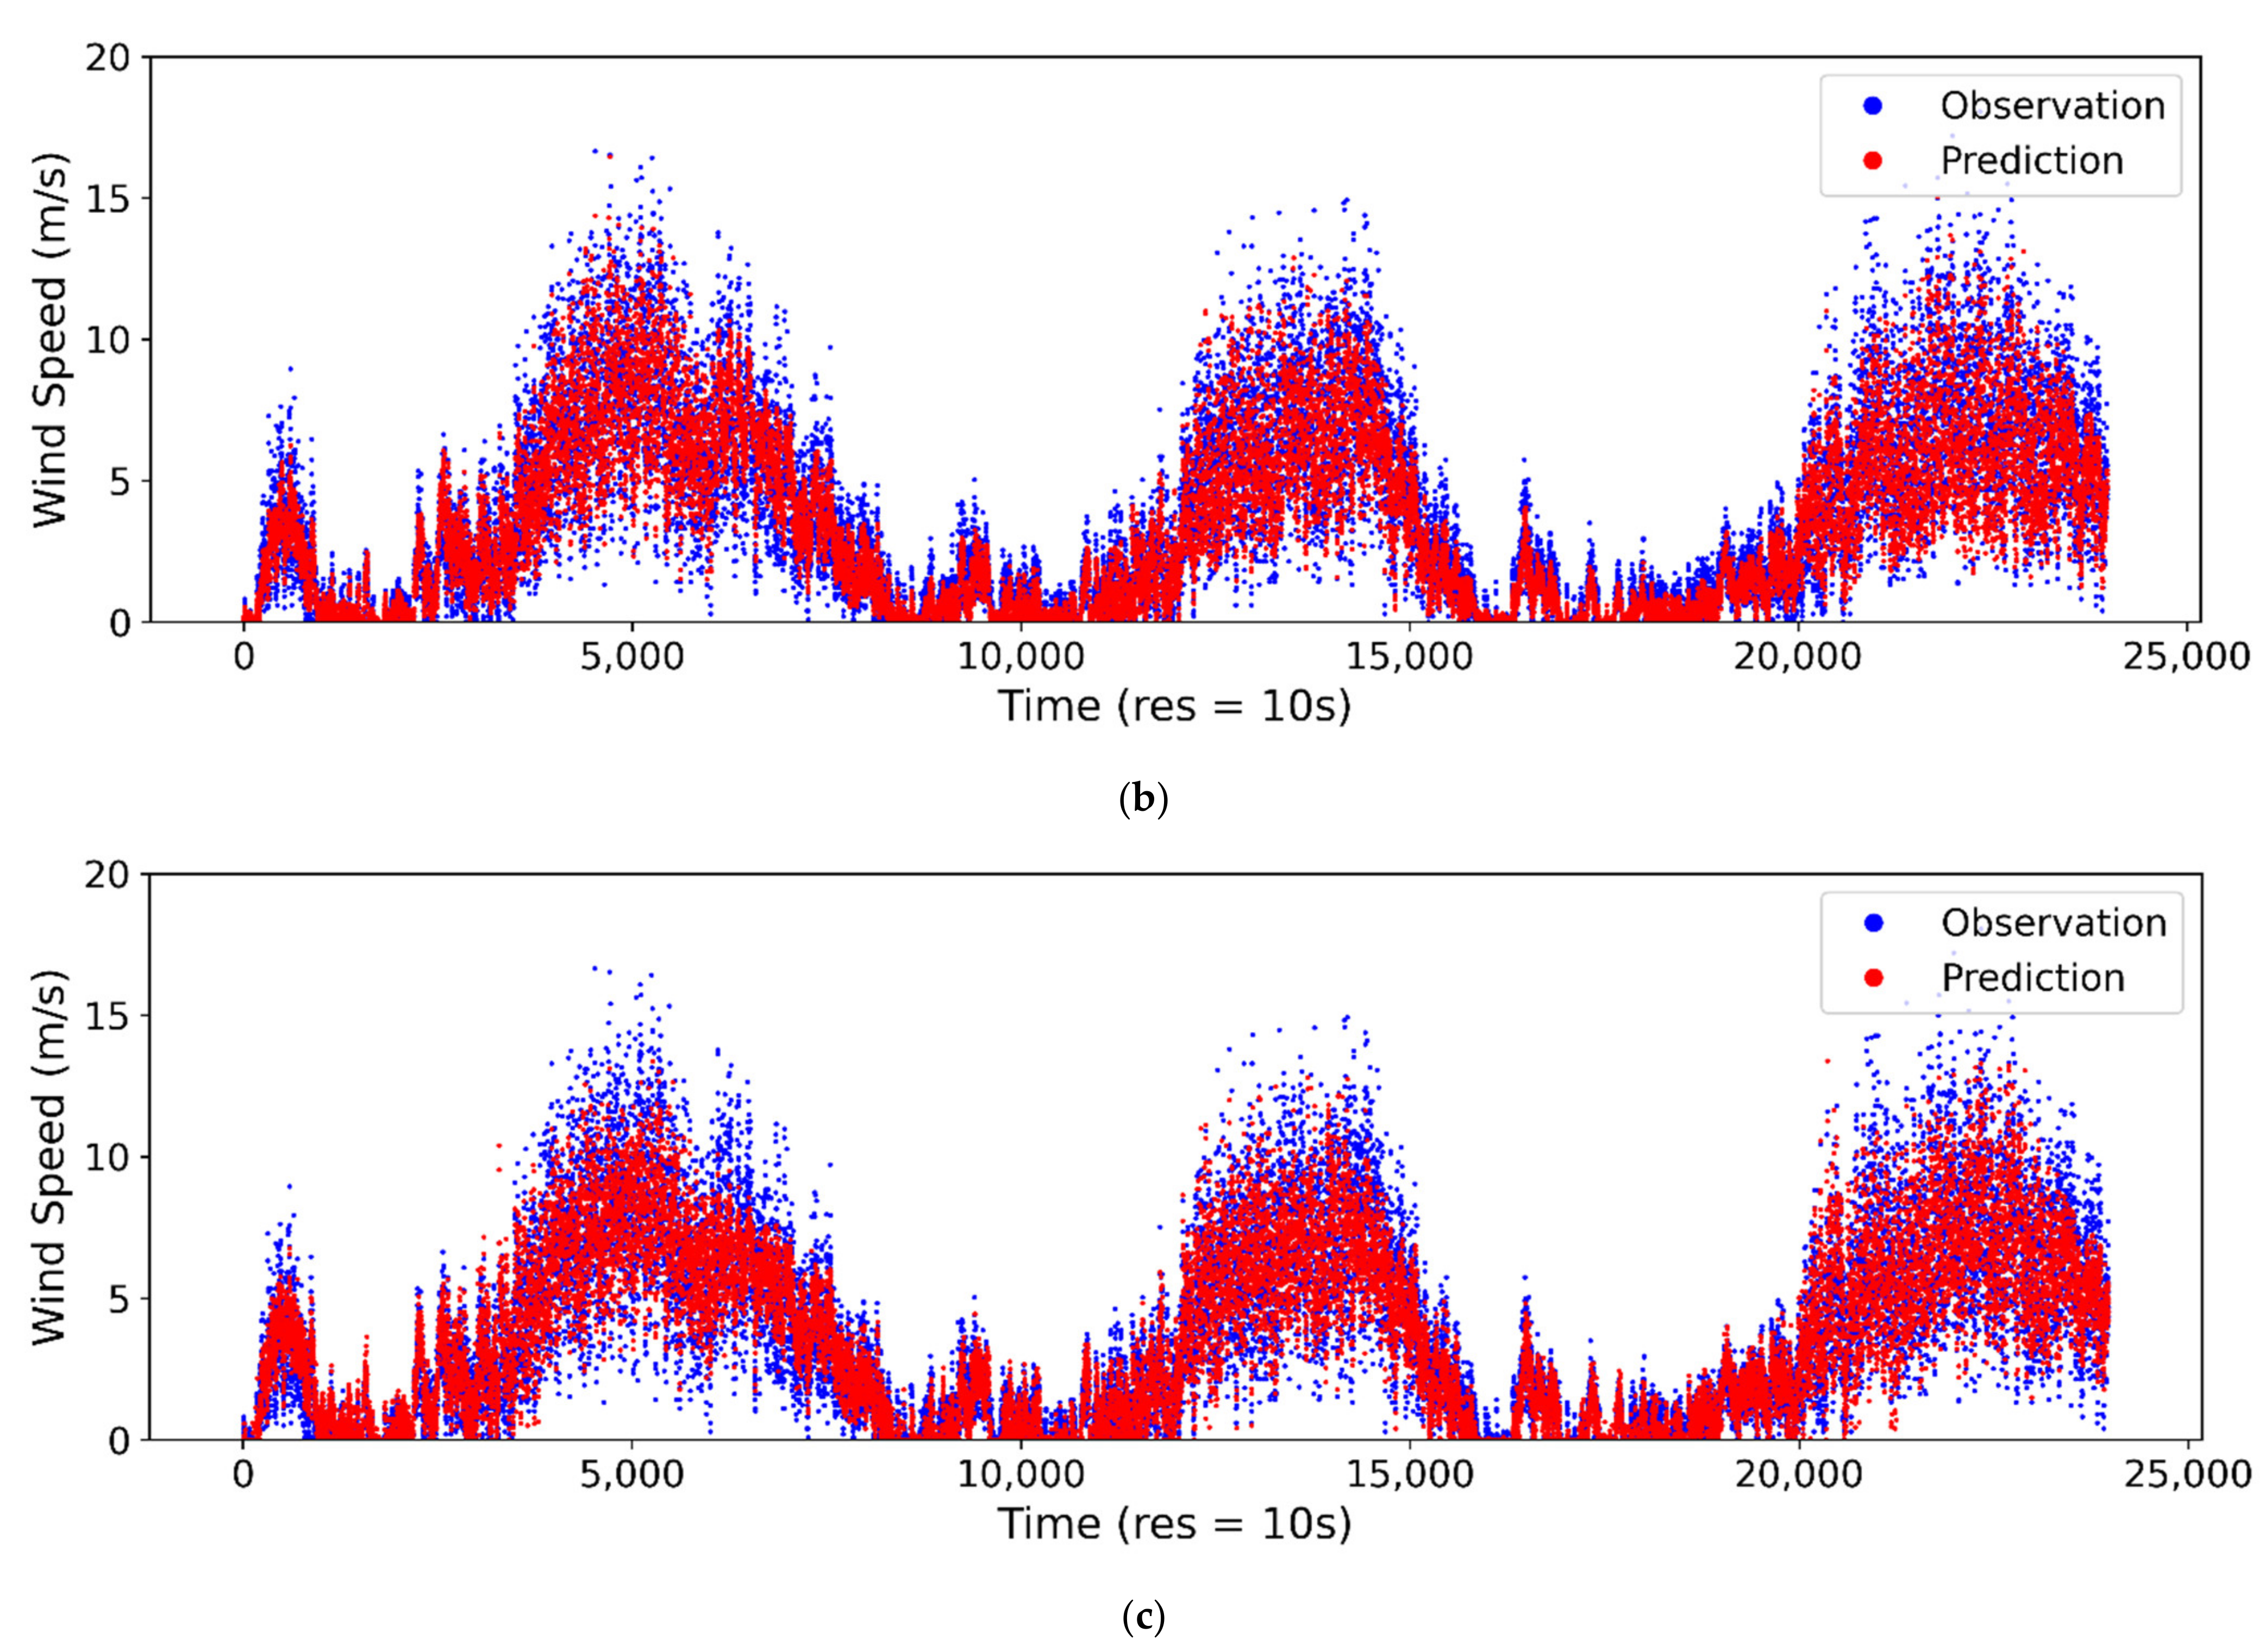
Figure 7.
Comparison of predicted/estimated and observed wind direction at 10-s sampling interval for (a) ANN, (b) SVM and (c) LR.
Figure 7.
Comparison of predicted/estimated and observed wind direction at 10-s sampling interval for (a) ANN, (b) SVM and (c) LR.


Table 1.
Performance evaluation of different regression model for estimating wind speed and direction from the thermopile array and ambient temperature data.
Table 1.
Performance evaluation of different regression model for estimating wind speed and direction from the thermopile array and ambient temperature data.
| Sampling Interval | Models | Wind Speed | Wind Direction | ||||
|---|---|---|---|---|---|---|---|
| R2 | RMSE | MAE | R2 | RMSE | MAE | ||
| 10 s | ANN | 0.916 | 0.949 | 0.622 | 0.835 | 36.89 | 23.923 |
| SVM | 0.904 | 1.017 | 0.676 | 0.34 | 69.01 | 56.097 | |
| LR | 0.892 | 1.078 | 0.759 | 0.58 | 61.997 | 46.43 | |
| 20 s | ANN | 0.936 | 0.809 | 0.525 | 0.834 | 32.967 | 23.322 |
| SVM | 0.908 | 0.974 | 0.653 | 0.35 | 69.819 | 51.471 | |
| LR | 0.912 | 0.953 | 0.679 | 0.637 | 54.226 | 40.487 | |
| 1 min | ANN | 0.954 | 0.653 | 0.437 | 0.874 | 28.331 | 16.809 |
| SVM | 0.929 | 0.811 | 0.559 | 0.388 | 62.697 | 44.167 | |
| LR | 0.935 | 0.775 | 0.574 | 0.725 | 42.283 | 31.415 | |
| 2 min | ANN | 0.969 | 0.516 | 0.353 | 0.889 | 22.211 | 17.223 |
| SVM | 0.947 | 0.684 | 0.484 | 0.359 | 59.674 | 42.4 | |
| LR | 0.95 | 0.663 | 0.503 | 0.782 | 34.471 | 26.08 | |
| 5 min | ANN | 0.981 | 0.4 | 0.278 | 0.917 | 17.685 | 12.961 |
| SVM | 0.964 | 0.546 | 0.392 | 0.354 | 58.037 | 43.038 | |
| LR | 0.963 | 0.556 | 0.425 | 0.832 | 27.732 | 21.179 | |
| 10 min | ANN | 0.99 | 0.279 | 0.207 | 0.941 | 16.836 | 13.657 |
| SVM | 0.969 | 0.505 | 0.373 | 0.355 | 53.398 | 40.549 | |
| LR | 0.966 | 0.528 | 0.389 | 0.862 | 23.614 | 17.985 | |
Publisher’s Note: MDPI stays neutral with regard to jurisdictional claims in published maps and institutional affiliations. |
© 2021 by the authors. Licensee MDPI, Basel, Switzerland. This article is an open access article distributed under the terms and conditions of the Creative Commons Attribution (CC BY) license (https://creativecommons.org/licenses/by/4.0/).
Share and Cite
MDPI and ACS Style
Wu, S.-C.; Tzou, J.-C.; Ding, C.-Y. A Low-Cost System for Measuring Wind Speed and Direction Using Thermopile Array and Artificial Neural Network. Appl. Sci. 2021, 11, 4024. https://doi.org/10.3390/app11094024
AMA Style
Wu S-C, Tzou J-C, Ding C-Y. A Low-Cost System for Measuring Wind Speed and Direction Using Thermopile Array and Artificial Neural Network. Applied Sciences. 2021; 11(9):4024. https://doi.org/10.3390/app11094024
Chicago/Turabian StyleWu, Shang-Chen, Jong-Chyuan Tzou, and Cheng-Yu Ding. 2021. "A Low-Cost System for Measuring Wind Speed and Direction Using Thermopile Array and Artificial Neural Network" Applied Sciences 11, no. 9: 4024. https://doi.org/10.3390/app11094024
Note that from the first issue of 2016, this journal uses article numbers instead of page numbers. See further details here.