
Goldmann Tonometry and Corneal Biomechanics


1
ASST Fatebenefratelli Sacco, Department of Clinical Sciences, Eye Clinic, University of Milan, 20157 Milan, Italy
2
Department of Chemistry, Materials and Chemical Engineering, “Giulio Natta”, Politecnico di Milano, 20133 Milan, Italy
3
IRCCS Istituto Ortopedico Galeazzi, 20161 Milan, Italy
*
Author to whom correspondence should be addressed.
Appl. Sci. 2021, 11(9), 4025; https://doi.org/10.3390/app11094025
Submission received: 12 March 2021
/
Revised: 21 April 2021
/
Accepted: 27 April 2021
/
Published: 28 April 2021
(This article belongs to the Special Issue Recent Developments and Applications in Tissue Mechanics and Tissue Engineering)
Abstract
:Featured Application
This manuscript presents a critical analysis of intraocular pressure (IOP) measured by Goldmann applanation tonometry (GIOP), the gold standard technique for the measurement of intraocular pressure, compared to measurements obtained by a pressure transducer inserted in the ocular anterior chamber (TIOP). Data showed significant differences between GIOP and TIOP, more evident for softer and thinner corneas and suggest GIOP should be corrected on the basis of corneal biomechanical parameters. This evidence is crucial for the detection and prevention of glaucoma as one of the main causes of irreversible blindness worldwide.
Abstract
Glaucoma is the second cause of irreversible blindness in the world. Intraocular pressure (IOP) is a recognized major risk factor for the development and progression of glaucomatous damage. Goldmann applanation tonometry (GAT) is internationally accepted as the gold standard for the measurement of IOP. The purpose of this study was to search for correlations between Goldmann tonometry and corneal mechanical properties and thickness by means of in vitro tests. IOP was measured by the Goldmann applanation tonometer (GIOP), and by a pressure transducer inserted in the anterior chamber of the eye (TIOP), at increasing pressure levels by addition of saline solution in the anterior chamber of enucleated pig eyes (n = 49). Mechanical properties were also determined by inflation tests. The GAT underestimated the real measurements made by the pressure transducer, with most common differences in the range 15–28 mmHg. The difference between the two instruments, highlighted by the Bland–Altman test, was confirmed by ANOVA, normality tests, and Mann–Whitney’s tests, both on the data arranged for infusions and for the data organized by pressure ranges. Pearson correlation tests revealed a negative correlation between (TIOP-GIOP) and both corneal stiffness and corneal thickness. In conclusion, data obtained showed a discrepancy between GIOP and TIOP more evident for softer and thinner corneas, that is very important for glaucoma detection.
1. Introduction
Glaucoma is a multifactorial optic neuropathy characterized by progressive loss of retinal ganglion cells, the neurodegeneration can also involve the neuronal pathways up to the geniculate body and occipital cortex, resulting in changes in optic disk morphology and visual field defects [1,2,3]. It is the leading cause of irreversible blindness worldwide, accounting for 8% of vision loss [4,5]. Intraocular pressure (IOP) is recognized as the most important risk factor for the development or progression of glaucomatous damage, and is controlled by the balance between aqueous humor secretion and the eye’s outflow facility [6].
An association between increased IOP and the loss of sight in glaucoma has been noted for many centuries, from observations of eye stiffness for cases of continued impaired vision following cataract surgery, through the establishment of the relationship between the IOP and loss of sight. In particular, elevated IOP increases the likelihood of visual filed alterations or scotoma and even complete blindness. For this reason, the IOP evaluation remains the primary measurement in the diagnosis of glaucoma [7]. Ocular hypertension studies also investigated and addressed whether the treatment of elevated IOP prevented or delayed the onset of glaucomatous damage, showing that a decrease of IOP reduced the risk of progression to glaucoma [8]. Furthermore, in recent epidemiological studies it has been verified that a reduction in IOP of only 1 mmHg from baseline leads to a 10% reduction of damage progression, and of the conversion from ocular hypertension (i.e., without damage) to manifest glaucoma [9,10]. Therefore, obtaining a correct measurement of IOP during the treatment of the disease or as screening test for the identification of subjects at risk, appears very important. Together with visual field analysis, IOP is the gold standard for the diagnosis and the correct evaluation of the progression of the disease. Recently, useful software has been developed to analyze optical fibers at the peripapillary and macular levels using optical coherence tomography (OCT) to monitor disease progression [11,12,13]. Unfortunately, in some glaucoma patients there is a progression of the disease, regardless of an apparently normal IOP. Known as normal tension glaucoma, it is an optic disease in which the IOP before ocular hypotonizing therapy is less than 21 mmHg, apparently normal values [14,15,16]. Many factors, such as the central corneal thickness (CCT) and biomechanical properties of the cornea, may affect IOP measurement, particularly in patients affected by glaucoma [17,18,19].
The most accurate method to evaluate the IOP is the direct one, which measures the real (actual) pressure in the eye through the cannulation of the eye, using a pressure transducer placed in direct communication with the anterior chamber. This approach, because of its high invasiveness, is not valid for routine measurements of IOP, and has to be considered only for experimental use or during surgery [20,21,22]. All other methods of measuring IOP are indirect; the cornea is deformed after application of an external force to the corneal surface. The amount of force necessary to obtain changes in corneal normal conformation is proportional to the pressure inside the bulb. In clinical practice IOP is then calculated—not measured directly—by indirect techniques. The tool that allows to make this measurement is called a tonometer (applanation or non-contact tonometry).
In addition to the Goldmann applanation tonometer (GAT), which will be further discussed below, several types of tonometers are currently available, each with advantages and disadvantages [23]. The non-contact tonometry (NCT) is influenced by tear meniscus height (TMH), as the measured IOP increases with increasing tear film, and by central corneal thickness (CCT) [24,25,26]. The ocular response analyzer (ORA) uses a jet of air as the applanating force to the apex of the cornea; it can measure corneal hysteresis and the corneal resistance factor and provides higher IOP measurements as compared to GAT [27]. Pneumatonometer is a portable instrument which overestimates IOP at high values and at high CCT [24]. The Icare HOME tonometer is a portable device, contact rebound tonometer. It also has been recently shown to overestimate IOP compared to GAT [28]. The dynamic contour tonometer (DCT) or Pascal tonometer differs from GAT having a concave tip equipped with a tiny piezoelectric sensor: it takes about a hundred measurements per second and also evaluates IOP fluctuations with systemic pressure variation; no statistically significant effect of corneal curvature, astigmatism, axial length, and age on the difference between DCT and intracameral IOP has been detected [29,30]. A recent study has been carried out on an IOP sensor mounted on contact lens, not yet available for clinical use, that can be worn by patients for up to 24 h, also measuring the circadian rhythm. The data show an overnight rise in IOP [31]. Finally, the Corvis tonometer, a rebound tonometer, able to take into account corneal biomechanical characteristics, also has been shown to measure higher IOP values compared to GAT [32]. Although observations outlined above underline that most of the tonometers on the market “overestimate” the IOP measured by the Goldmann tonometer, the Goldmann applanation tonometry (GAT) is internationally considered as the gold standard for IOP measurement in clinical practice without the need to deform appreciably the cornea [33,34]. The functioning of this device is based on the measurement of the force required for the applanation of a specific portion (of 3.06 mm in diameter) of the central cornea, and on the use of this measured force to estimate the value of the internal pressure, on the basis of a calibration procedure which depends on a number of standard parameters. The accuracy of tonometry therefore depends on the mechanical resistance of the eye structure to the applanation, which is in turn influenced by the central corneal thickness, the curvature, and the mechanical properties of the cornea [24,35,36,37,38]. Recently, the need to make the IOP measurement faster and more comfortable has led to the development of new techniques [39,40,41].
Analyzing corneal thickness, some researchers found a statistically significant correlation between corneal thickness and GAT [24,42,43], while many others argued that thicker corneas led to an overestimation of the IOP, and on the contrary thinner corneas led to IOP underestimation [24,35,44,45,46,47]. Corneal curvature has been recognized as a parameter that reduces the precision in the measurement of IOP [35,47,48].
In summary, Goldman tonometry appears imprecise. It would be very important to know how the geometrical and mechanical properties of the cornea influence and modify the pressure inside the eye, making more or less accurate the measurement made by tonometry. Noted the presence of several studies concerning the correlation between IOP measurement and corneal thickness [19,41,49,50], only a few suggest that corneal biomechanics may affect IOP measurements [19,35,51], inducing significant errors in the diagnosis of glaucoma. Thus, the purpose of this study was first to determine any difference between IOP measured indirectly by the GAT and directly by cannulation of the eye, and then to investigate the existence of statistically significant correlations between such differences and (i) the corneal thickness; and (ii) the corneal elastic modulus. In order to be able to evaluate the mechanical properties of the corneal tissue and its influence on the tonometry measurement, in vitro tests were performed in pig eyes.
2. Materials and Methods
Swine enucleated eyes collected from a local abattoir (Venegoni Spa, Boffalora Sopra Ticino, Italy) were used for the experiments. This type of eyes is very similar to human ones, both in size and mechanical response, and, unlike them, can be obtained with relative ease. Before experimentation, extraocular muscles and periorbital fat were removed. Eyes were kept in the refrigerator at 4 °C until testing. IOP measurement tests were performed the same day of eye collection, pressurization tests the same day or the day after.
2.1. Tonometry Test
The intraocular pressure detected by the Goldmann applanation tonometer (GIOP) was compared to the intraocular pressure (TIOP) invasively measured by a pressure transducer (140205D, Honeywell, Freeport, IL, USA) in 49 swine eyes. Each eye was clamped in a custom-made Plexiglass eye holder placed in vertical position on the chin rest of the slit lamp with the corneal apex in front of Goldmann tonometer, simulating the clinical measurement of IOP. A needle was cannulated at the level of limbus directly into the anterior chamber of the eye and connected to the transducer by a connecting tube and a stopcock. The transducer in turn was connected to a power supply (KAT 5VD, Kert, Caerano di San Marco (TV), Italy). The pressure transducer signal was measured by a multimeter in mV and then converted in mmHg through a mercury sphygmomanometer. A syringe connected to the stopcock was used to gradually increase intraocular pressure by saline infusion, added in steps of 100 μL, up to 500 μL. While infusing the saline solution, through the inspection system at variable magnifications and the optical system of the slit lamp, an applanation area of 7.35 mm2 was obtained under the Goldmann tonometer. For each saline infusion, TIOP and GIOP were recorded, until the achievement of a TIOP of about 35 mmHg.
The needle used was chosen with the lowest possible diameter (30 gauge), in order to avoid damage to the corneal tissue, once inserted into the eye anterior chamber. The procedure of inserting the needle was carried out with particular care to avoid corneal injuries that can prevent the measurement of IOP by Goldmann tonometry or cause false assessments. Care was taken to avoid leaks in the connection circuit between the transducer and the eye and to minimize pressure losses in the pipes, by using only one tap and a short connecting pipe. Figure 1 is a schematic representation of the IOP measurement setup.
The time between the saline infusion and measurement by Goldmann/transducer was as short as possible (less than one minute) to avoid relaxation effects due to the viscoelastic properties of the ocular tissues [52] that would result in IOP values lower than the actual. During the measurement procedure eyes were kept hydrated by dropping hydrating solution (sodium hyaluronate 0.2%, distilled water). Fluorescein (1 mg fluorescein sodium) was used to visualize the two GAT semi-circles by blue light.
2.2. Inflation Test
With the purpose of measuring the corneal stiffness and correlate it to any possible difference between the IOP measured by the two instruments, inflation tests were then performed on the same eyes by cutting the cornea from the eye. A ring of sclera around the cornea was left to allow clamping of the cornea into a custom-made device previously described in [53]. During the inflation tests, each specimen was subjected to three loading-unloading pressure cycles with the pressure ranging from 1.8 to 30 mmHg serving as precondition cycles. Then corneal specimens were subjected to a posterior pressure, P (from 1.8 to 30 mmHg in steps of 2.5 mmHg), induced by a column of NaCl solution to simulate the effect of a growing intraocular pressure. In order to obtain quasi-steady response, we waited three minutes before recording images and applying the subsequent pressure step. Images including the entire profiles of the anterior surface of the cornea were acquired at regular intervals by means of a digital camera (Nikon DS5M, Nital, Moncalieri (TO), Italy), mounted on a stereomicroscope (Nikon SMZ800, Nital, Moncalieri (TO), Italy) and then analyzed by image analysis software (Nikon NIS-Elements D2.20, Nital, Moncalieri (TO), Italy) to track the corneal apex displacement as a function of the applied pressure. The linearized shell theory was applied to data in order to convert apex displacement and pressure in stress and strain, and to calculate the secant modulus, E, for each level of applied pressure, as already described in [53]. The geometrical parameters needed to apply the shell theory, besides the apex displacement, are the average in-plane diameter, S, and the radius of curvature, R, also evaluated by image analysis, and the corneal thickness at the apex, measured at the end of inflation tests on rectangular corneal strips cut from the tested corneas. The Poisson’s coefficient was set to 0.5, consistent with the hypothesis of isotropic material at the basis of the shell theory [54,55]. The experimental setup for the execution of the inflation tests is shown in Figure 2.
2.3. Statistical Analysis
All measurements were then analyzed in several ways. In particular, after the evidence of differences between GIOP and TIOP, that we name from now on delta-pressure, a thorough statistical analysis was performed. Shapiro–Wilk test was used to test the normality of our distributions. A two-way ANOVA test was used to test whether volume infusion or instrument type or the pressure level or combinations of the above had any influence on measurements. Pearson correlation test was used to test the presence of a correlation between the delta-pressure and the corneal stiffness, E, or the corneal thickness, CCT. Finally, Bland–Altman analysis [56,57] was also applied to our data to detect any trend in delta-pressure with the level of IOP. Statistical analysis was performed by Microsoft Excel (Redmond, WA, USA) and Statistic Package for Social Science (SPSS, version 27, Chicago, IL, USA).
Before applying Pearson test to delta-pressure and E, data were properly organized. For each eye, we had the two measurements of IOP following volume infusions, namely GIOP and TIOP, and one value of stiffness, E, for every applied pressure, P, from the inflation tests. We matched the inflation pressure, P, to TIOP, considering pressure ranges of 5 mmHg, and then we obtained for each eye the following data to compare: P, E, delta-pressure. Pearson correlation test was then applied between E and delta-pressure considering the whole set of data for all pressures, P, and 3 sub-sets of data, divided according to the range of p values: group 1, from 1 to 12 mmHg, group 2 from 13 to 21 mmHg, group 3 from 22 to 35 mmHg. To perform Pearson tests between delta-pressure and CCT, data were simply matched by considering the thickness of each eye for which the delta-pressure was measured.
3. Results
3.1. Tonometry Results
For each of the 49 pig eyes, we obtained a few couples of measurements of IOP by the two instruments, for a total of 126 measurements.
The values of IOP increase with volume increase for both the instruments, with a trend line for GIOP lower than TIOP, as shown in Figure 3a. Lower GIOP values are also evident from Figure 3b, in which GIOP is plotted versus TIOP, and most of the experimental points are below the first quadrant bisector.
Table 1 and Table 2 summarize results of normality test (Shapiro–Wilk) and significance test (t-test or Mann–Whitney test) for the five groups of data in Figure 4a. Delta-pressure values of 4–7 mmHg are the most frequent (30%), followed by the intervals 8–11 and 12–15 mmHg (both 20%), as Figure 4b illustrates. t-test was applied to normal distributions, Mann–Whitney test otherwise.
Given the presence of consistent differences in IOP measured by the two instruments, we applied a two-way ANOVA test to our data.
First, we grouped our data by volume infusion to test whether only volume infusion had an influence on the measured IOP, or the instrument too, or the combination of volume infusion and instrument. Of the total 126 measurements, 78 were relative to 0 mL infusion, 66 to 100 mL, 52 to 200 mL, 30 to 300 mL, 18 to 400 mL, and eight to 500 mL. The p-value resulted less than 0.001 for both volume infusion and instrument, whereas the combination of instrument and volume infusion resulted in a p-value of 0.51. Therefore, we conclude that both volume infusion and instrument affect the measurement but not the combination of the two.
We also applied two-way ANOVA to data organized by pressure level. Data were divided by five groups identified by the mean pressure of pressure ranges in Table 1, i.e., 4, 11, 18, 25, and 32 mmHg. This time we tested whether the pressure level or the instrument had an influence on IOP measurement. Again, the p-value was less than 0.001 for both pressure level and instrument. The combination of instrument and pressure level resulted in a p-value of 0.004, so this time also the combination of the two variables had an effect on IOP.
We finally applied Bland–Altman analysis to our data to evaluate more deeply the differences in IOP measured by the two instruments. Figure 5a reports the difference in IOP measurements, delta-pressure, as a function of the average of the two measurements, average. Being most points between the two dashed lines, which represent the confidence lines, the two methods give congruent results, apart from an error. A positive mean value of delta-pressure of 7.8 mmHg is calculated (thick horizontal line in Figure 5a). No trend in delta-pressure with pressure can be observed from Figure 5a. Although delta-pressure for the average lower than 10 mmHg seems lower than for the higher average, Figure 5b shows that such values are on the contrary very high (about 200%) when considered as percentage values (Bland–Altman PI plot, Figure 5b). Figure 5b shows a negative trend in the normalized percentage delta-pressure, confirming a roughly constant delta-pressure vs. the average [58].
3.2. Inflation Test Results
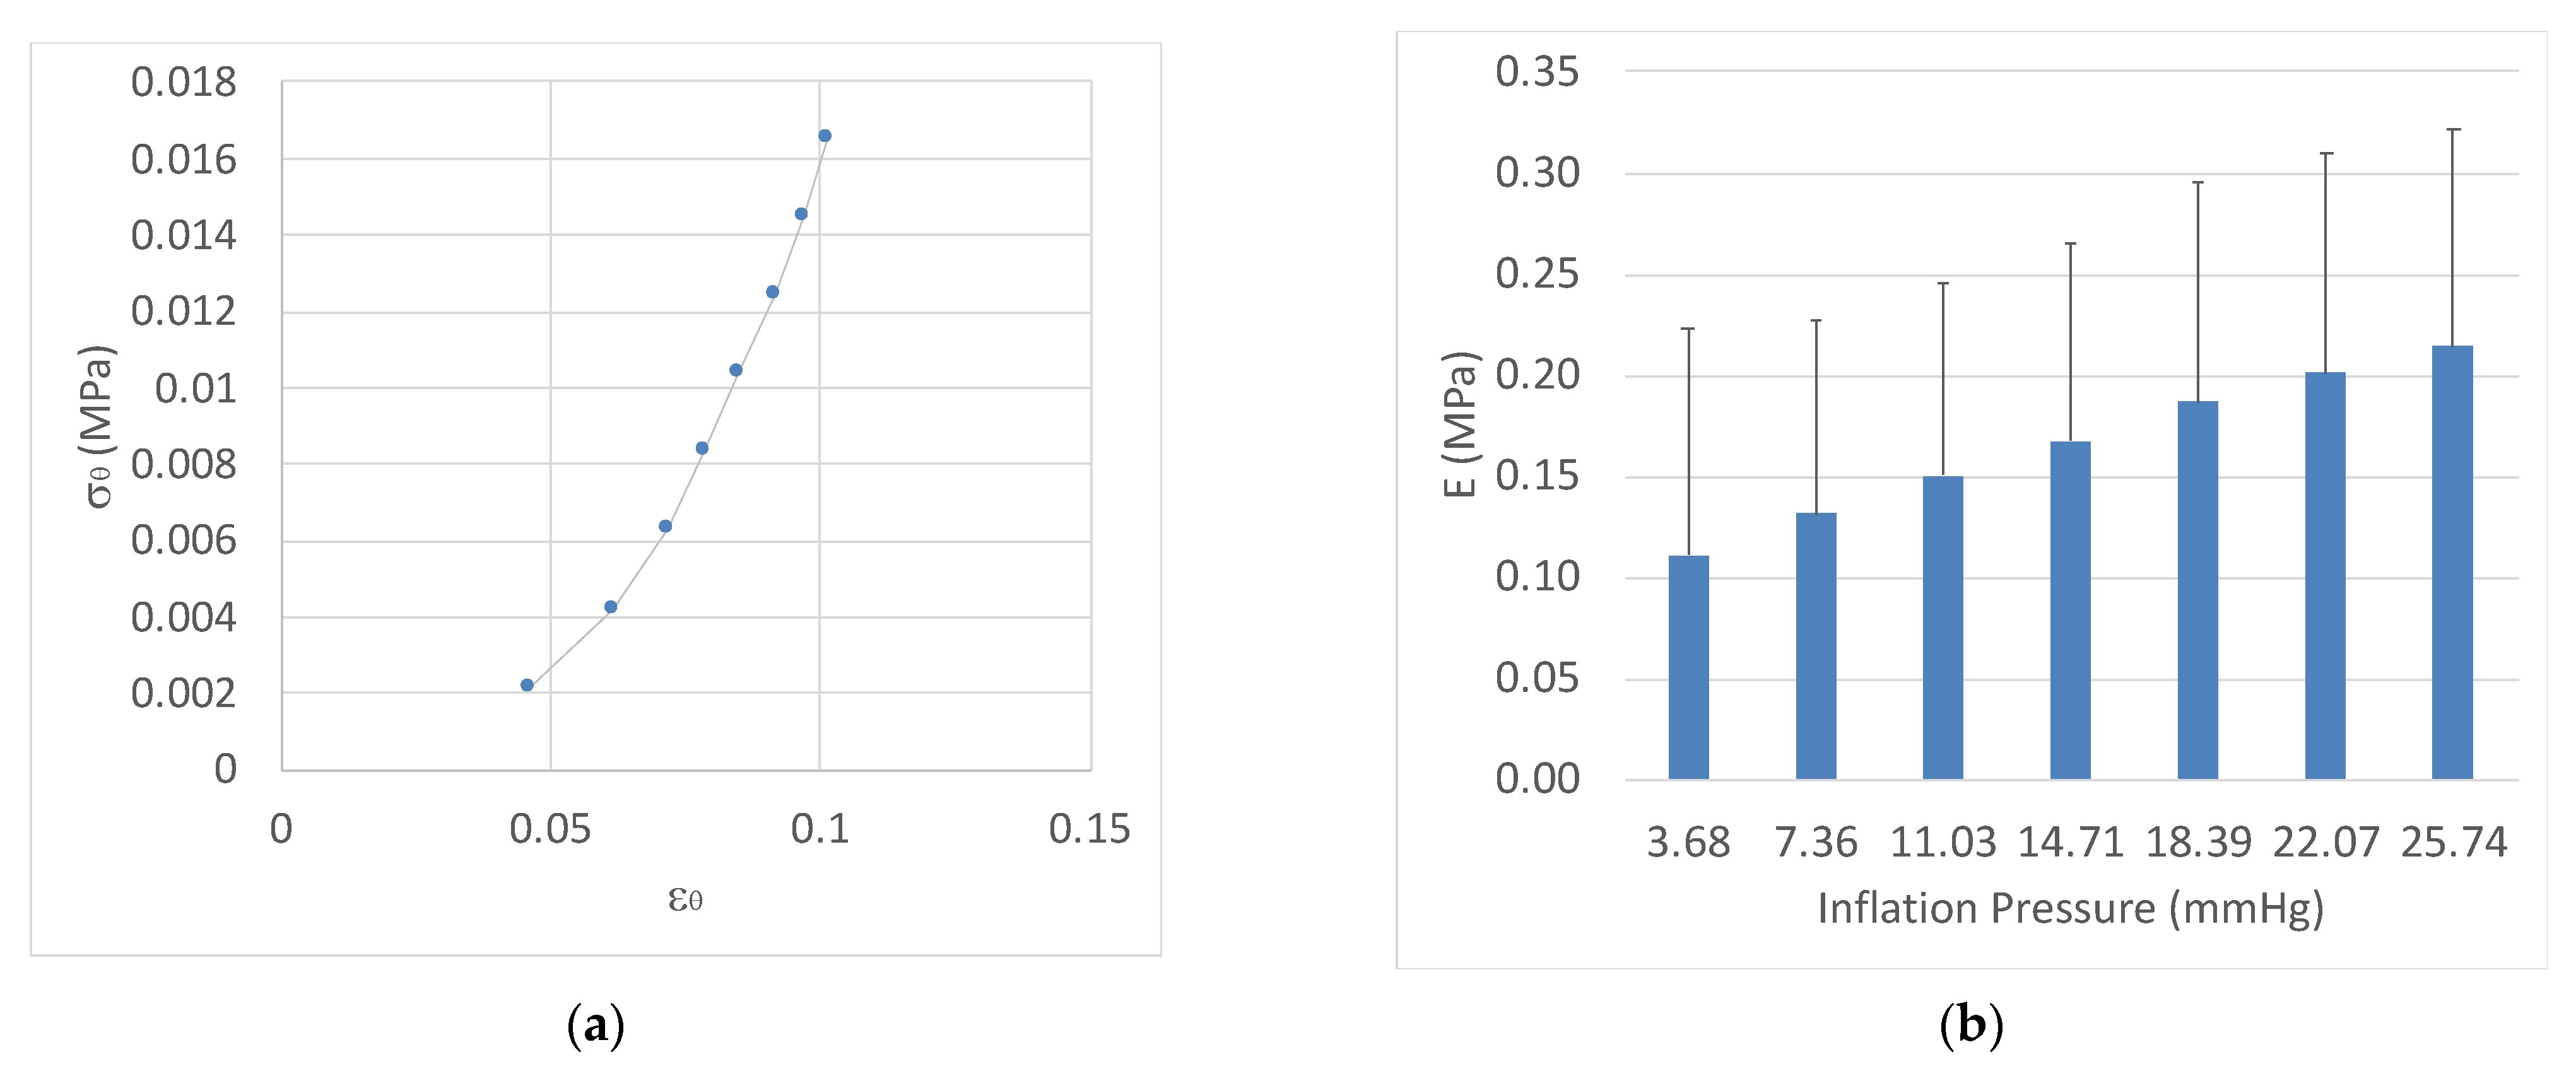
From image analysis of corneas in the unstressed state taken during inflation tests, we obtained the geometry data necessary for stress and elastic modulus calculations through the linear shell theory for each of the 49 pig corneas tested. The average geometrical data are listed in Table 3, whereas Table 4 lists the average apex displacement evaluated for each value of inflation pressure. Using such data and the numerical procedure detailed in the Appendix of our previous paper [53], average stress-strain data (Figure 6a), and the distribution of the secant modulus with pressure (Figure 6b) were obtained.
3.3. Correlations
Since our hypothesis is that the GAT measurements are affected by the mechanical properties of the cornea, we searched for a correlation between delta-pressure and corneal elastic modulus, E, (Pearson correlation test), after organizing our data as described in the materials and methods section. Shapiro–Wilk test applied to delta-pressure resulted in normal distributions for all of the subsets of data presented in Table 5, a condition required for use of Pearson’s test. Pearson correlation test results for E are shown in Table 5. A weak negative correlation was found for the whole pressure interval, whereas the negative correlation is stronger for pressures in the ranges 13–21 and 22–35 mmHg. A negative Pearson correlation of (−0.38) was found between delta-pressure and the corneal thickness, CCT.
4. Discussion
The purpose of the present work was to test the hypothesis that corneal stiffness and thickness are correlated to errors in IOP measured indirectly by GAT, as compared to the true IOP invasively detected using a pressure transducer. The experimental tests were performed on enucleated pig eyes, chosen for their similarity to human eyes both from the anatomical and mechanical point of view [59], also in the studies of glaucoma associated diseases [58,60,61,62]. ANOVA tests demonstrated that the values of IOP are significantly affected by the instrument used to measure it, therefore deviations of GIOP from TIOP can be attributed to the use of GAT. Although we applied ANOVA test to our two groups of data (GIOP and TIOP) even if none of the two were normally distributed, it should be recalled that ANOVA test remains a valid statistical procedure even under non-normality [63]. GAT in most measurement underestimated IOP measured by the transducer, and the average difference as evaluated by Bland–Altman plots is roughly 8 mmHg. The Bland–Altman plot is the elective method to put in evidence differences in measurements between two instruments. Being such difference roughly constant throughout the whole pressure range, we conclude that GAT underestimated IOP for any level of pressure in our enucleated eyes. Figure 4a shows an increase in delta-pressure with pressure which is not in contrast with Figure 5a, being variables on the x-axis different in the two figures.
Inflation tests confirmed the non-linear mechanical behavior with large data dispersion typical of porcine corneas [53] and other soft biological tissues. The average values of apex displacement reported in Table 4 are very similar to values measured by Bryant and McDonnell [64] in human corneas, but lower than those measured by Elsheikh et al. [65]. The difference may be attributed to corneal viscoelasticity. Our data and those of Bryant and McDonnell [64] were obtained under quasi-static conditions, whereas Elsheikh et al. [65] applied pressures at variable rates from 3.7 to 37.5 mmHg/min. Furthermore, our pressure ranges are much more similar to those of Bryant and McDonnell [64] and in the physiological range.
A weak negative correlation was found between delta-pressure and corneal stiffness, E. Even more importantly, the negative correlation becomes stronger if we look at physiologic or high values of pressure, where it would be important not to underestimate the IOP. For very high values of IOP, the increase in E (Figure 6b) may compensate the errors in GAT (last bar in Figure 4a). In the interval 0–12 mmHg no correlation could be found between delta-pressure and E, we attribute this result to the hypotonic state of eyes. Such pressure ranges are never met in vivo, though, and were measured in our excised eyes which become hypotonic soon after the animal death and need volume infusion to regain tone.
As the GAT is usually calibrated to work with a range of “normal” stiffnesses, our results suggest that GAT introduces larger errors for softer than normal corneas. As a support to this consideration, Susanna et al. [66] reported thin cornea and low corneal hysteresis as main risk factors for glaucomatous visual field progression in eyes with well-controlled IOP. Corneal hysteresis is not E, although it is directly related to it, being defined as the difference between the pressure at which the cornea bends inward during an air jet applanation and the pressure at which it bends out. Sit et al. [67] also measured a lower stiffness in glaucomatous eyes.
A negative correlation was found between delta-pressure and corneal thickness, CCT, meaning that thinner corneas result in greater IOP measurement errors by GAT, and in particular larger underestimation of IOP. The possible influence of corneal thickness in the measurement of IOP was identified and briefly discussed by Goldmann and Schmidt in 1957 [33]. Subsequent studies, performed by Ehlers et al. [44], described in great detail the effect of corneal thickness in the measurement of internal pressure, and the interest in this phenomenon grew again with the advent of refractive surgery. The procedure by which the refractive surgery is performed in fact determines a thinning of the cornea, and was widely discussed, in relation to tonometry, in several experimental works [68]. Orssenigo et al. [45] and Liu et al. [35] found that a high value of corneal thickness leads to an overestimate of IOP, which is line with our findings.
It is known that porcine corneas are thicker (about 1 mm [69]) than human ones (about 600 μm [70]). Average thickness for our porcine corneas was 1.4 mm, meaning that they probably underwent swelling. Nevertheless, since measurements were taken a-posteriori from images of excised strips, a rapid swelling may have occurred as a consequence of the cut of the protective endothelium and epithelium. Although our thickness measurements therefore are affected by an error, the negative correlation with delta-pressures is still valid and suggests that an even larger error would have been measured for thinner corneas.
The accuracy of the GAT depends on the mechanical strength to applanation, which is in turn influenced by central corneal thickness (CCT), by the curvature, and the mechanical properties of cornea and sclera. The measurement of the intraocular pressure by means of tonometry is, therefore, affected by several sources of error, which may lead to an erroneous diagnosis of ocular hypotension or hypertension or glaucoma. In this paper we demonstrated the correlation between such errors and corneal stiffness and corneal thickness.
Our study presents a few limitations. First of all, it was conducted in vitro, so missing several of the in vivo factors which may affect the results. Although this is an obvious drawback, it also allows to perform controlled experiments and to obtain reproducible results. Tests were conducted on pig eyes which are very similar to human eyes but present some differences. In particular, pig corneas are much thicker than human corneas and they may possess different material properties relative to the human corneas. The effect of thickness on the results of the present study has already been discussed above. The interpretation of experimental data on porcine eyes [71,72], showed that the porcine stroma has, on average, mechanical properties very similar to the ones of the human stroma. Tests conducted on human corneas would clearly be of great importance to confirm our results obtained on porcine corneas. Regarding the methods, we evaluated the apex displacement of corneas from 2D images, whereas a 3D strain distribution may have resulted in more precise calculations. We measured the cornea thickness after the experiments on excised strips of the tested corneas. A pachymetry used on corneas during the test would probably give more precise results. Finally, we did not investigate the correlation with the radius of curvature, R, since our pig eyes, originating from animals of the same age of the same facility, were roughly of the same dimension with very low variability in R data (see Table 3).
Future work will be directed to the quantification of possible correlations with the scleral stiffness, since the presence of various types of diseases can easily lead to considerable changes in the elasticity of the scleral tissue [73,74,75].
In conclusion, glaucoma is a multifactorial opticopathy with a neurodegenerative component also present at the extraocular level [1,2,3]. Of all the factors to be taken into consideration, at present only IOP certainly plays an important diagnostic role, besides being the target of therapies to treat glaucoma. Obviously, correct measurement and assessment of IOP is essential. Goldmann tonometry has been a gold standard reference for at least 70 years, though with the improvement of technology, it is now being discussed and critically analyzed. In our study, we have clearly shown that several factors, and in particular corneal stiffness and thickness, come into play in the measurement and assessment of ocular tone, and, above all, that the Goldmann tonometer underestimated IOP values with respect to real intraocular pressure especially for softer and thinner than normal corneas. From this point of view, these data could explain, at least in part, why normotensive glaucoma are diagnosed and also why, after medical, par-surgical or surgical hypotonization, glaucomatous disease still progresses in some patients. Further clinical investigation should be carried out in presence of normal GIOP values if the cornea appears particularly thin and soft, whereas the thickness is regularly measured by a pachymeter, at present only the ophthalmologist experience and sensitivity can detect a sub-normal corneal stiffness. The development of a novel instrument, able to measure the force required to flatten the cornea coupled with a biomechanical model would be a great step forward for measuring the real IOP.
Author Contributions
Conceptualization: D.M. and F.B.; validation: F.B. and M.F.; formal analysis: F.B. and M.F.; investigation: F.B. and D.M.; resources: F.B. and D.M.; writing—original draft preparation: D.M. and F.B.; writing—review and editing: F.B., M.F., and D.M.; visualization: F.B. and M.F.; supervision: F.B. All authors have read and agreed to the published version of the manuscript.
Funding
This research received no external funding.
Institutional Review Board Statement
Not applicable. Our study did not involve animals as the experiments were conducted in vitro on pig eyes bought at a local abattoir.
Acknowledgments
Authors are grateful to Francesca Daga, and Ylenia Ferra, for their help in conducting the in vitro experiments.
Conflicts of Interest
The authors declare no conflict of interest.
References
- Zhang, H.-J.; Mi, X.-S.; So, K.-F. Normal tension glaucoma: From the brain to the eye or the inverse? Neural Regen. Res. 2019, 14, 1845–1850. [Google Scholar] [CrossRef]
- Gupta, N.; Greenberg, G.; de Tilly, L.N.; Gray, B.; Polemidiotis, M.; Yücel, Y.H. Atrophy of the lateral geniculate nucleus in human glaucoma detected by magnetic resonance imaging. Br. J. Ophthalmol. 2009, 93, 56–60. [Google Scholar] [CrossRef]
- Gupta, N.; Ang, L.-C.; Noël de Tilly, L.; Bidaisee, L.; Yücel, Y.H. Human glaucoma and neural degeneration in intracranial optic nerve, lateral geniculate nucleus, and visual cortex. Br. J. Ophthalmol. 2006, 90, 674–678. [Google Scholar] [CrossRef] [PubMed]
- Wang, W.; He, M.; Li, Z.; Huang, W. Epidemiological variations and trends in health burden of glaucoma worldwide. Acta Ophthalmol. 2019, 97, e349–e355. [Google Scholar] [CrossRef] [PubMed] [Green Version]
- Pascolini, D.; Mariotti, S.P. Global estimates of visual impairment: 2010. Br. J. Ophthalmol. 2012, 96, 614–618. [Google Scholar] [CrossRef] [PubMed] [Green Version]
- Japan Glaucoma Society. The Japan Glaucoma Society Guidelines for Glaucoma (3rd Edition). Nihon Ganka Gakkai Zasshi 2012, 116, 3–46. [Google Scholar]
- The Collected Papers of Sir William Bowman, Bart., F.R.S. Nature 1893, 48, 26. [CrossRef]
- Kass, M.A.; Heuer, D.K.; Higginbotham, E.J.; Johnson, C.A.; Keltner, J.L.; Miller, J.P.; Parrish, R.K., II; Wilson, M.R.; Gordon, M.O.; Group for the O.H.T.S. The Ocular Hypertension Treatment Study: A Randomized Trial Determines That Topical Ocular Hypotensive Medication Delays or Prevents the Onset of Primary Open-Angle Glaucoma. Arch. Ophthalmol. 2002, 120, 701–713. [Google Scholar] [CrossRef]
- Leskea, M.C.; Heijl, A.; Hyman, L.; Bengtsson, B.; Komaroff, E. Factors for progression and glaucoma treatment: The Early Manifest Glaucoma Trial. Curr. Opin. Ophthalmol. 2004, 15, 102–106. [Google Scholar] [CrossRef]
- Gordon, M.O.; Beiser, J.A.; Brandt, J.D.; Heuer, D.K.; Higginbotham, E.J.; Johnson, C.A.; Keltner, J.L.; Miller, J.P.; Parrish, R.K., II; Wilson, M.R.; et al. The Ocular Hypertension Treatment Study: Baseline Factors That Predict the Onset of Primary Open-Angle Glaucoma. Arch. Ophthalmol. 2002, 120, 714–720. [Google Scholar] [CrossRef]
- Mihaylova, B.; Dimitrova, G. Evaluation of Retinal Nerve Fiber Layer and Inner Macular Layers in Primary Open-Angle Glaucoma with Spectral-Domain Optical Coherence Tomography. Opt. Nerve 2019. [Google Scholar] [CrossRef] [Green Version]
- Bussel, I.I.; Wollstein, G.; Schuman, J.S. OCT for glaucoma diagnosis, screening and detection of glaucoma progression. Br. J. Ophthalmol. 2014, 98 (Suppl. S2), ii15–ii19. [Google Scholar] [CrossRef] [Green Version]
- Michelessi, M.; Li, T.; Miele, A.; Azuara-Blanco, A.; Qureshi, R.; Virgili, G. Accuracy of optical coherence tomography for diagnosing glaucoma: An overview of systematic reviews. Br. J. Ophthalmol. 2021, 105, 490–495. [Google Scholar] [CrossRef] [PubMed]
- Mallick, J.; Devi, L.; Malik, P.K.; Mallick, J. Update on Normal Tension Glaucoma. J. Ophthalmic Vis. Res. 2016, 11, 204–208. [Google Scholar] [CrossRef] [PubMed]
- Killer, H.E.; Pircher, A. Normal tension glaucoma: Review of current understanding and mechanisms of the pathogenesis. Eye 2018, 32, 924–930. [Google Scholar] [CrossRef] [PubMed]
- Messenio, D.; Marano, G.; Biganzoli, E. Electrophysiological evaluation in normal-tension glaucoma suspects: A pilot study. J. Model. Ophthalmol. 2016, 1, 9–30. [Google Scholar]
- Smedowski, A.; Weglarz, B.; Tarnawska, D.; Kaarniranta, K.; Wylegala, E. Comparison of Three Intraocular Pressure Measurement Methods Including Biomechanical Properties of the Cornea. Investig. Ophthalmol. Vis. Sci. 2014, 55, 666–673. [Google Scholar] [CrossRef] [Green Version]
- Hagishima, M.; Kamiya, K.; Fujimura, F.; Morita, T.; Shoji, N.; Shimizu, K. Effect of corneal astigmatism on intraocular pressure measurement using ocular response analyzer and Goldmann applanation tonometer. Graefe’s Arch. Clin. Exp. Ophthalmol. 2010, 248, 257–262. [Google Scholar] [CrossRef] [PubMed]
- Yaoeda, K.; Fukushima, A.; Shirakashi, M.; Fukuchi, T. Comparison of intraocular pressure adjusted by central corneal thickness or corneal biomechanical properties as measured in glaucomatous eyes using noncontact tonometers and the Goldmann applanation tonometer. Clin. Ophthalmol. 2016, 10, 829–834. [Google Scholar] [CrossRef] [Green Version]
- Shim, J.; Kang, S.; Park, Y.; Kim, S.; Go, S.; Lee, E.; Seo, K. Comparative intraocular pressure measurements using three different rebound tonometers through in an ex vivo analysis and clinical trials in canine eyes. Vet. Ophthalmol. 2021, 24 (Suppl. S1), 186–193. [Google Scholar] [CrossRef]
- Elsmo, E.J.; Kiland, J.A.; Kaufman, P.L.; McLellan, G.J. Evaluation of rebound tonometry in non-human primates. Exp. Eye Res. 2011, 92, 268–273. [Google Scholar] [CrossRef] [Green Version]
- McCafferty, S.; Levine, J.; Schwiegerling, J.; Enikov, E.T. Goldmann and error correcting tonometry prisms compared to intracameral pressure. BMC Ophthalmol. 2018, 18, 2. [Google Scholar] [CrossRef] [PubMed] [Green Version]
- Aziz, K.; Friedman, D.S. Tonometers—Which one should I use? Eye 2018, 32, 931–937. [Google Scholar] [CrossRef] [PubMed]
- Tonnu, P.-A.; Ho, T.; Newson, T.; El Sheikh, A.; Sharma, K.; White, E.; Bunce, C.; Garway-Heath, D. The influence of central corneal thickness and age on intraocular pressure measured by pneumotonometry, non-contact tonometry, the Tono-Pen XL, and Goldmann applanation tonometry. Br. J. Ophthalmol. 2005, 89, 851–854. [Google Scholar] [CrossRef] [Green Version]
- Yilmaz, I.; Altan, C.; Aygit, E.D.; Alagoz, C.; Baz, O.; Ahmet, S.; Urvasizoglu, S.; Yasa, D.; Demirok, A. Comparison of three methods of tonometry in normal subjects: Goldmann applanation tonometer, non-contact airpuff tonometer, and Tono-Pen XL. Clin. Ophthalmol. 2014, 8, 1069–1074. [Google Scholar] [CrossRef] [PubMed] [Green Version]
- Seol, B.R.; Kang, T.G.; Gu, B. Intraocular pressure according to different types of tonometry (non-contact and Goldmann applanation) in patients with different degrees of bilateral tearing. PLoS ONE 2019, 14, e0222652. [Google Scholar] [CrossRef]
- Kynigopoulos, M.; Schlote, T.; Kotecha, A.; Tzamalis, A.; Pajic, B.; Haefliger, I. Repeatability of intraocular pressure and corneal biomechanical properties measurements by the ocular response analyser. Klin. Monbl. Augenheilkd. 2008, 225, 357–360. [Google Scholar] [CrossRef]
- Takagi, D.; Sawada, A.; Yamamoto, T. Evaluation of a New Rebound Self-tonometer, Icare HOME: Comparison With Goldmann Applanation Tonometer. J. Glaucoma 2017, 26, 613–618. [Google Scholar] [CrossRef]
- Francis, B.A.; Hsieh, A.; Lai, M.-Y.; Chopra, V.; Pena, F.; Azen, S.; Varma, R. Effects of corneal thickness, corneal curvature, and intraocular pressure level on Goldmann applanation tonometry and dynamic contour tonometry. Ophthalmology 2007, 114, 20–26. [Google Scholar] [CrossRef]
- Bochmann, F.; Kaufmann, C.; Thiel, M.A. Dynamic contour tonometry versus Goldmann applanation tonometry: Challenging the gold standard. Expert Rev. Ophthalmol. 2010, 5, 743–749. [Google Scholar] [CrossRef] [Green Version]
- Posarelli, C.; Ortenzio, P.; Ferreras, A.; Toro, M.D.; Passani, A.; Loiudice, P.; Oddone, F.; Casini, G.; Figus, M. Twenty-Four-Hour Contact Lens Sensor Monitoring of Aqueous Humor Dynamics in Surgically or Medically Treated Glaucoma Patients. J. Ophthalmol. 2019, 2019, 9890831. [Google Scholar] [CrossRef] [PubMed] [Green Version]
- Hong, J.; Xu, J.; Wei, A.; Deng, S.X.; Cui, X.; Yu, X.; Sun, X. A new tonometer—the Corvis ST tonometer: Clinical comparison with noncontact and Goldmann applanation tonometers. Investig. Ophthalmol. Vis. Sci. 2013, 54, 659–665. [Google Scholar] [CrossRef] [PubMed]
- Goldmann, H.; Schmidt, T. Über Applanationstonometrie. Ophthalmologica 1957, 134, 221–242. [Google Scholar] [CrossRef] [PubMed]
- Cook, J.A.; Botello, A.P.; Elders, A.; Fathi Ali, A.; Azuara-Blanco, A.; Fraser, C.; McCormack, K.; Margaret Burr, J. Systematic Review of the Agreement of Tonometers with Goldmann Applanation Tonometry. Ophthalmology 2012, 119, 1552–1557. [Google Scholar] [CrossRef] [PubMed] [Green Version]
- Liu, J.; Roberts, C.J. Influence of corneal biomechanical properties on intraocular pressure measurement: Quantitative analysis. J. Cataract Refract. Surg. 2005, 31, 146–155. [Google Scholar] [CrossRef]
- Kaushik, S.; Pandav, S.S.; Banger, A.; Aggarwal, K.; Gupta, A. Relationship between corneal biomechanical properties, central corneal thickness, and intraocular pressure across the spectrum of glaucoma. Am. J. Ophthalmol. 2012, 153, 840–849.e2. [Google Scholar] [CrossRef]
- Costin, B.R.; Fleming, G.P.; Weber, P.A.; Mahmoud, A.M.; Roberts, C.J. Corneal biomechanical properties affect Goldmann applanation tonometry in primary open-angle glaucoma. J. Glaucoma 2014, 23, 69–74. [Google Scholar] [CrossRef] [PubMed]
- Andreanos, K.; Koutsandrea, C.; Papaconstantinou, D.; Diagourtas, A.; Kotoulas, A.; Dimitrakas, P.; Moschos, M.M. Comparison of Goldmann applanation tonometry and Pascal dynamic contour tonometry in relation to central corneal thickness and corneal curvature. Clin. Ophthalmol. 2016, 10, 2477–2484. [Google Scholar] [CrossRef] [PubMed] [Green Version]
- Tejwani, S.; Dinakaran, S.; Joshi, A.; Shetty, R.; Sinha Roy, A. A cross-sectional study to compare intraocular pressure measurement by sequential use of Goldman applanation tonometry, dynamic contour tonometry, ocular response analyzer, and Corvis ST. Indian J. Ophthalmol. 2015, 63, 815–820. [Google Scholar] [CrossRef] [PubMed]
- Oncel, B.; Dinc, U.A.; Orge, F.; Yalvaç, B.I. Comparison of IOP measurement by ocular response analyzer, dynamic contour, Goldmann applanation, and noncontact tonometry. Eur. J. Ophthalmol. 2009, 19, 936–941. [Google Scholar] [CrossRef] [PubMed]
- Chen, M.; Zhang, L.; Xu, J.; Chen, X.; Gu, Y.; Ren, Y.; Wang, K. Comparability of three intraocular pressure measurement: iCare pro rebound, non-contact and Goldmann applanation tonometry in different IOP group. BMC Ophthalmol. 2019, 19, 225. [Google Scholar] [CrossRef] [PubMed]
- Feltgen, N.; Leifert, D.; Funk, J. Correlation between central corneal thickness, applanation tonometry, and direct intracameral IOP readings. Br. J. Ophthalmol. 2001, 85, 85–87. [Google Scholar] [CrossRef] [PubMed] [Green Version]
- Shah, S.; Spedding, C.; Bhojwani, R.; Kwartz, J.; Henson, D.; McLeod, D. Assessment of the diurnal variation in central corneal thickness and intraocular pressure for patients with suspected glaucoma. Ophthalmology 2000, 107, 1191–1193. [Google Scholar] [CrossRef]
- Ehlers, N.; Bramsen, T.; Sperling, S. Applanation Tonometry and Central Corneal Thickness. Acta Ophthalmol. 1975, 53, 34–43. [Google Scholar] [CrossRef] [PubMed]
- Orssengo, G.J.; Pye, D.C. Determination of the True Intraocular Pressure and Modulus of Elasticity of the Human Cornea in vivo. Bull. Math. Biol. 1999, 61, 551–572. [Google Scholar] [CrossRef]
- Gunvant, P.; Baskaran, M.; Vijaya, L.; Joseph, I.S.; Watkins, R.J.; Nallapothula, M.; Broadway, D.C.; O’Leary, D.J. Effect of corneal parameters on measurements using the pulsatile ocular blood flow tonograph and Goldmann applanation tonometer. Br. J. Ophthalmol. 2004, 88, 518–522. [Google Scholar] [CrossRef]
- Weinreb, R.N.; Brandt, J.D.; Garway-Heath, D.; Medeiros, F. Intraocular Pressure; Kugler Publications: Amsterdam, The Netherlands, 2007; Volume 4, ISBN 9789062992133. [Google Scholar]
- Mark, H.H. Corneal curvature in applanation tonometry. Am. J. Ophthalmol. 1973, 76, 223–224. [Google Scholar] [CrossRef]
- Nemesure, B.; Wu, S.-Y.; Hennis, A.; Leske, M.C.; Group for the B.E.S. Corneal Thickness and Intraocular Pressure in the Barbados Eye Studies. Arch. Ophthalmol. 2003, 121, 240–244. [Google Scholar] [CrossRef]
- Mansoori, T.; Balakrishna, N. Effect of central corneal thickness on intraocular pressure and comparison of Topcon CT-80 non-contact tonometry with Goldmann applanation tonometry. Clin. Exp. Optom. 2018, 101, 206–212. [Google Scholar] [CrossRef]
- Vinciguerra, R.; Rehman, S.; Vallabh, N.A.; Batterbury, M.; Czanner, G.; Choudhary, A.; Cheeseman, R.; Elsheikh, A.; Willoughby, C.E. Corneal biomechanics and biomechanically corrected intraocular pressure in primary open-angle glaucoma, ocular hypertension and controls. Br. J. Ophthalmol. 2020, 104, 121–126. [Google Scholar] [CrossRef] [Green Version]
- Langham, M.E.; Eisenlohr, J.E. A manometric study of the rate of fall of the intraocular pressure in the living and dead eyes of human subjects. Investig. Ophthalmol. 1963, 2, 72–82. [Google Scholar]
- Boschetti, F.; Triacca, V.; Spinelli, L.; Pandolfi, A. Mechanical Characterization of Porcine Corneas. J. Biomech. Eng. 2012, 134, 031003. [Google Scholar] [CrossRef] [PubMed]
- Pinsky, P.M.; van der Heide, D.; Chernyak, D. Computational modeling of mechanical anisotropy in the cornea and sclera. J. Cataract Refract. Surg. 2005, 31, 136–145. [Google Scholar] [CrossRef]
- Elsheikh, A.; Alhasso, D.; Rama, P. Assessment of the epithelium’s contribution to corneal biomechanics. Exp. Eye Res. 2008, 86, 445–451. [Google Scholar] [CrossRef] [PubMed]
- Martin Bland, J.; Altman, D.G. Statistical Methods for Assessing Agreement Between Two Methods of Clinical Measurement. Lancet 1986, 327, 307–310. [Google Scholar] [CrossRef]
- Giavarina, D. Understanding Bland Altman analysis. Biochem. Med. 2015, 25, 141–151. [Google Scholar] [CrossRef] [Green Version]
- Brunette, I.; Rosolen, S.G.; Carrier, M.; Abderrahman, M.; Nada, O.; Germain, L.; Proulx, S. Comparison of the pig and feline models for full thickness corneal transplantation. Vet. Ophthalmol. 2011, 14, 365–377. [Google Scholar] [CrossRef] [PubMed]
- Olsen, T.W.; Sanderson, S.; Feng, X.; Hubbard, W.C. Porcine Sclera: Thickness and Surface Area. Investig. Ophthalmol. Vis. Sci. 2002, 43, 2529–2532. [Google Scholar]
- Subasinghe, S.K.; Ogbuehi, K.C.; Mitchell, L.; Dias, G.J. Animal model with structural similarity to human corneal collagen fibrillar arrangement. Anat. Sci. Int. 2021, 96, 286–293. [Google Scholar] [CrossRef]
- Fernandez-Bueno, I.; Pastor, J.C.; Gayoso, M.J.; Alcalde, I.; Garcia, M.T. Müller and macrophage-like cell interactions in an organotypic culture of porcine neuroretina. Mol. Vis. 2008, 14, 2148–2156. [Google Scholar]
- Ruiz-Ederra, J.; García, M.; Hernández, M.; Urcola, H.; Hernández-Barbáchano, E.; Araiz, J.; Vecino, E. The pig eye as a novel model of glaucoma. Exp. Eye Res. 2005, 81, 561–569. [Google Scholar] [CrossRef]
- Blanca, M.J.; Alarcón, R.; Arnau, J.; Bono, R.; Bendayan, R. Non-normal data: Is ANOVA still a valid option? Psicothema 2017, 29, 552–557. [Google Scholar] [CrossRef]
- Bryant, M.R.; McDonnell, P.J. Constitutive laws for biomechanical modeling of refractive surgery. J. Biomech. Eng. 1996, 118, 473–481. [Google Scholar] [CrossRef] [PubMed]
- Elsheikh, A.; Wang, D.; Pye, D. Determination of the modulus of elasticity of the human cornea. J. Refract. Surg. 2007, 23, 808–818. [Google Scholar] [CrossRef] [PubMed]
- Susanna, B.N.; Ogata, N.G.; Jammal, A.A.; Susanna, C.N.; Berchuck, S.I.; Medeiros, F.A. Corneal Biomechanics and Visual Field Progression in Eyes with Seemingly Well-Controlled Intraocular Pressure. Ophthalmology 2019, 126, 1640–1646. [Google Scholar] [CrossRef]
- Sit, A.J.; Kazemi, A.; Zhou, B.; Zhang, X. Comparison of Ocular Biomechanical Properties in Normal and Glaucomatous Eyes Using Ultrasound Surface Wave Elastography. Investig. Ophthalmol. Vis. Sci. 2018, 59, 1218. [Google Scholar] [CrossRef]
- Doughty, M.J.; Laiquzzaman, M.; Müller, A.; Oblak, E.; Button, N.F. Central corneal thickness in European (white) individuals, especially children and the elderly, and assessment of its possible importance in clinical measures of intra-ocular pressure. Ophthalmic Physiol. Opt. 2002, 22, 491–504. [Google Scholar] [CrossRef]
- Hayashi, S.; Osawa, T.; Tohyama, K. Comparative observations on corneas, with special reference to Bowman’s layer and Descemet’s membrane in mammals and amphibians. J. Morphol. 2002, 254, 247–258. [Google Scholar] [CrossRef]
- Doughty, M.J.; Zaman, M.L. Human corneal thickness and its impact on intraocular pressure measures: A review and meta-analysis approach. Surv. Ophthalmol. 2000, 44, 367–408. [Google Scholar] [CrossRef]
- Pandolfi, A.; Holzapfel, G.A. Three-Dimensional Modeling and Computational Analysis of the Human Cornea Considering Distributed Collagen Fibril Orientations. J. Biomech. Eng. 2008, 130, 061006. [Google Scholar] [CrossRef] [PubMed] [Green Version]
- Pandolfi, A.; Boschetti, F. The influence of the geometry of the porcine cornea on the biomechanical response of inflation tests. Comput. Methods Biomech. Biomed. Engin. 2015, 18, 64–77. [Google Scholar] [CrossRef] [PubMed]
- Sergienko, N.M.; Shargorogska, I. The scleral rigidity of eyes with different refractions. Graefe’s Arch. Clin. Exp. Ophthalmol. 2012, 250, 1009–1012. [Google Scholar] [CrossRef] [PubMed]
- Friedman, E.; Ivry, M.; Ebert, E.; Glynn, R.; Gragoudas, E.; Seddon, J. Increased scleral rigidity and age-related macular degeneration. Ophthalmology 1989, 96, 104–108. [Google Scholar] [CrossRef]
- Graebel, W.P.; van Alphen, G.W.H.M. The Elasticity of Sclera and Choroid of the Human Eye, and Its Implications on Scleral Rigidity and Accommodation. J. Biomech. Eng. 1977, 99, 203–208. [Google Scholar] [CrossRef]
Figure 1.
Scheme of the experimental setup used to measure the intraocular pressure, IOP. G: Goldmann applanation tonometer, T: pressure transducer, V: power supply, M: multimeter.
Figure 1.
Scheme of the experimental setup used to measure the intraocular pressure, IOP. G: Goldmann applanation tonometer, T: pressure transducer, V: power supply, M: multimeter.
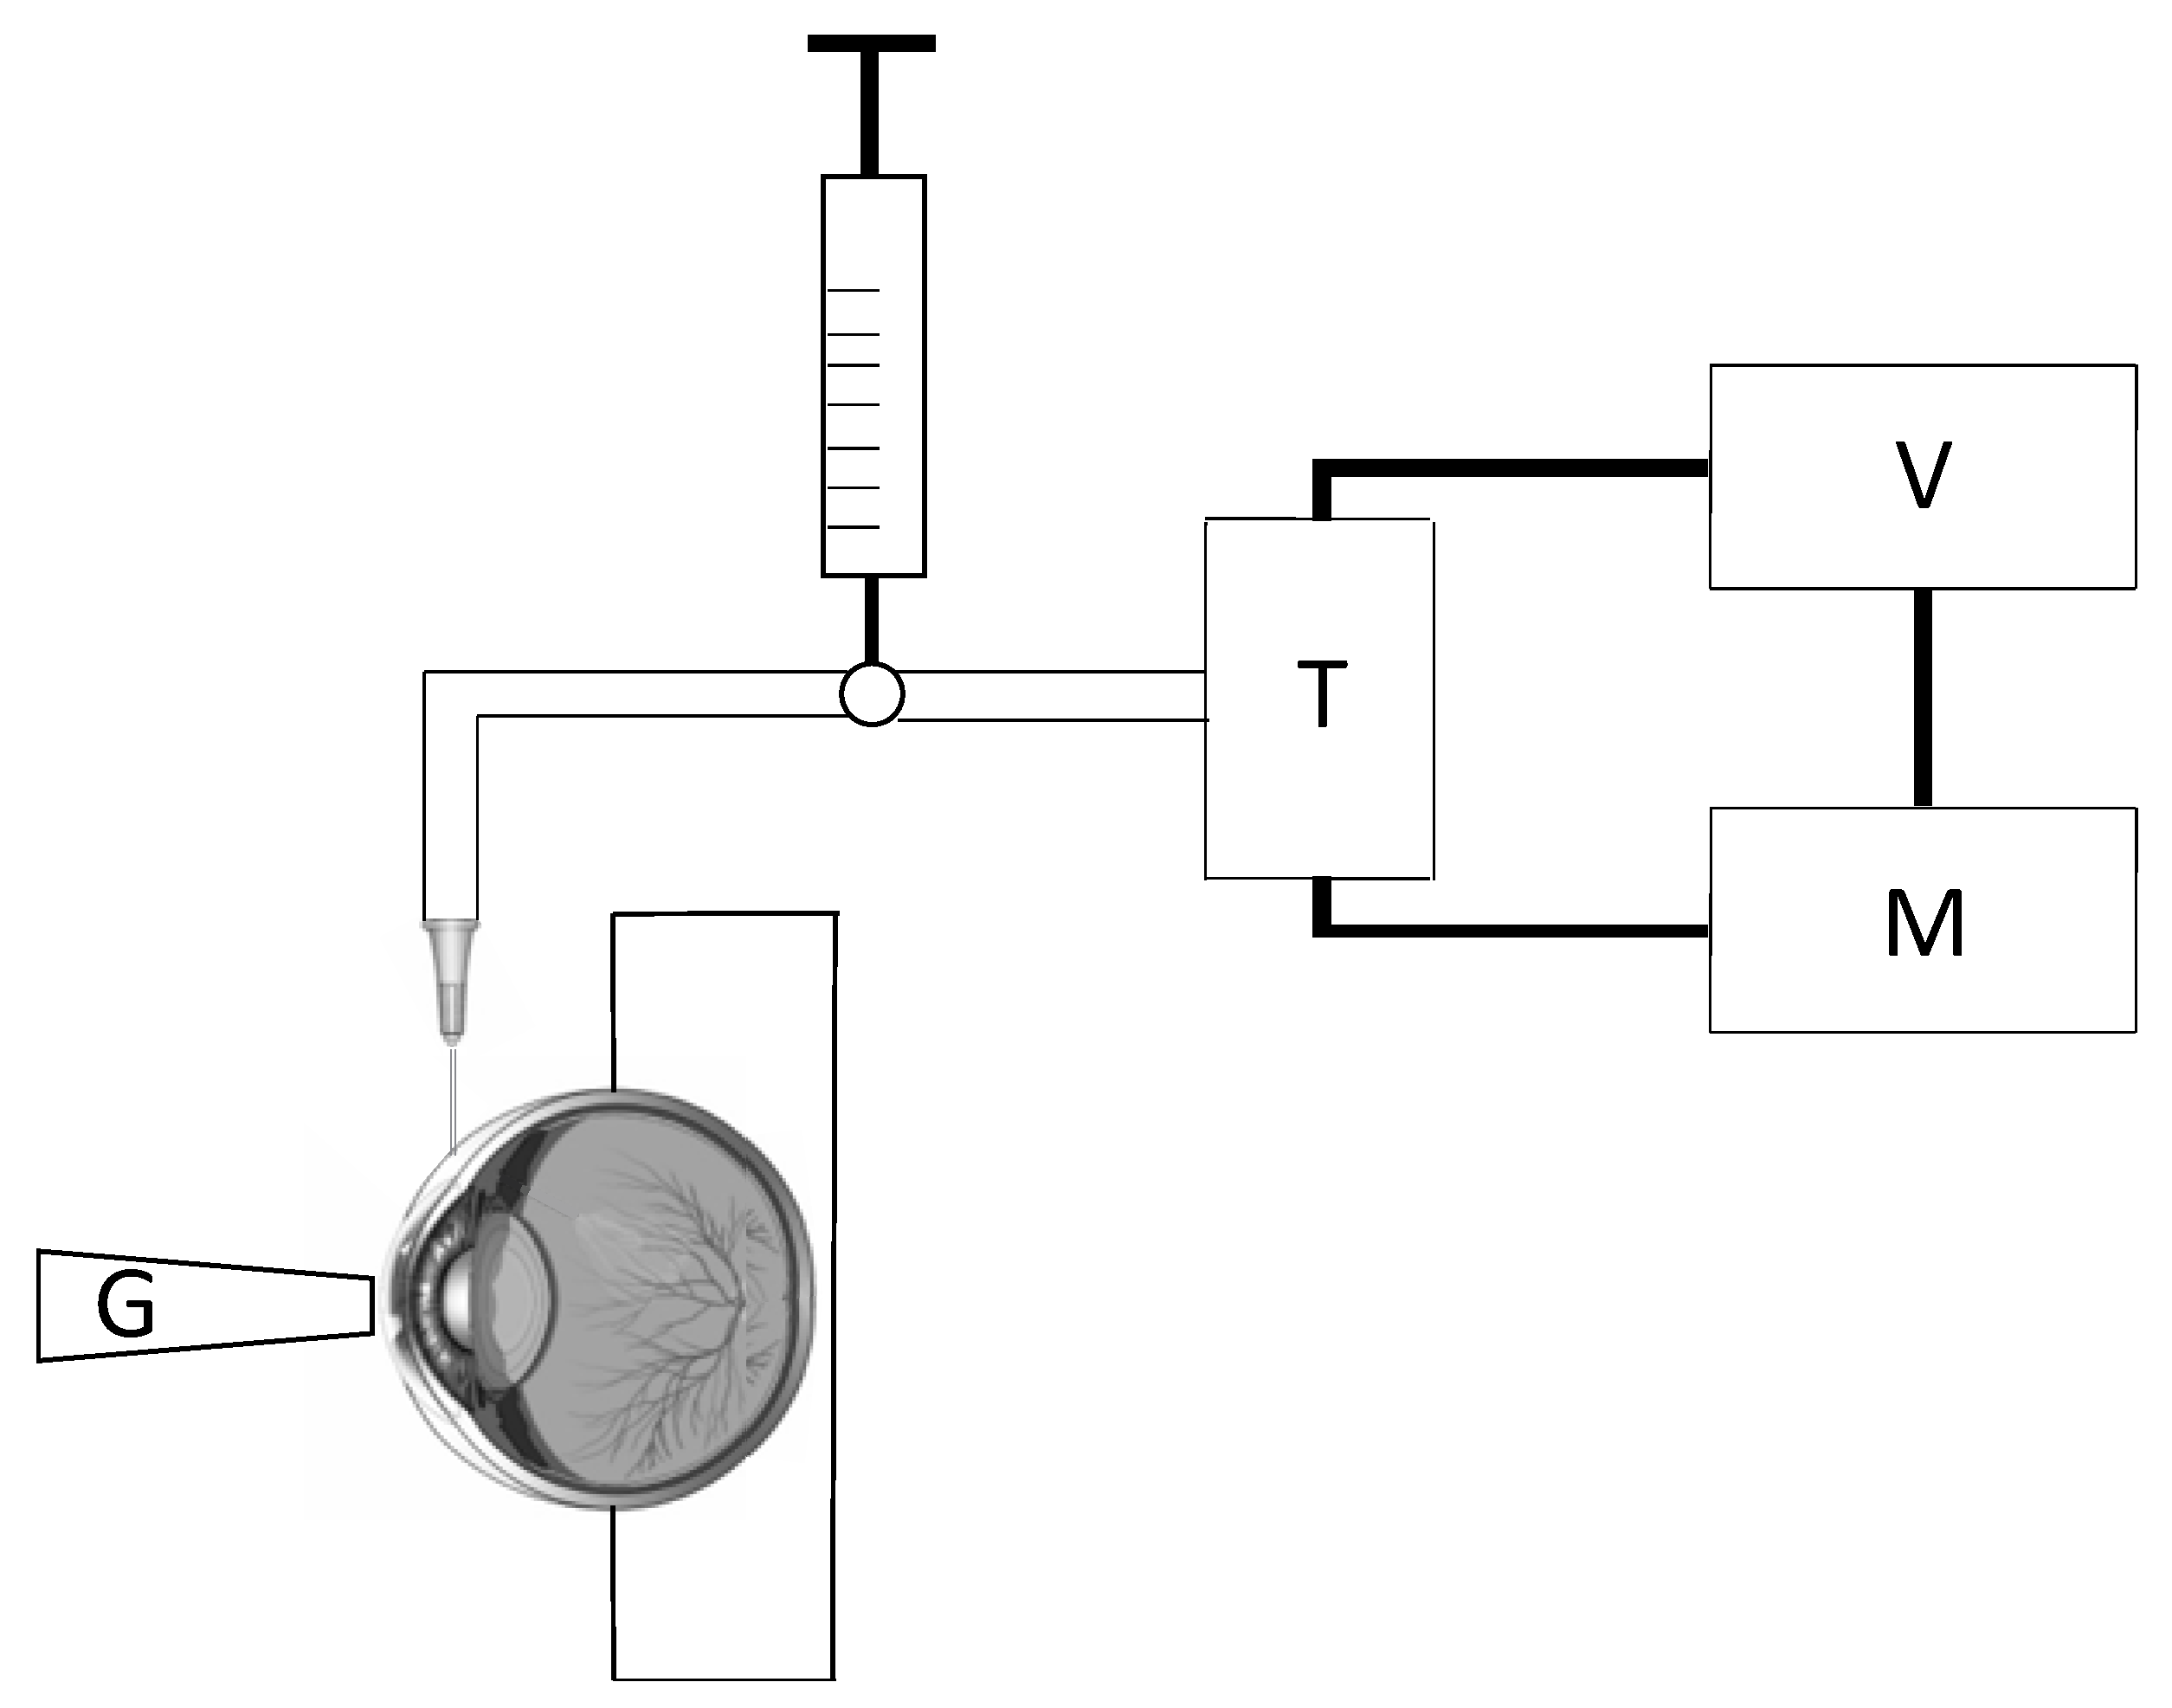
Figure 2.
Scheme of the inflation tests experimental setup used to evaluate corneal stiffness.
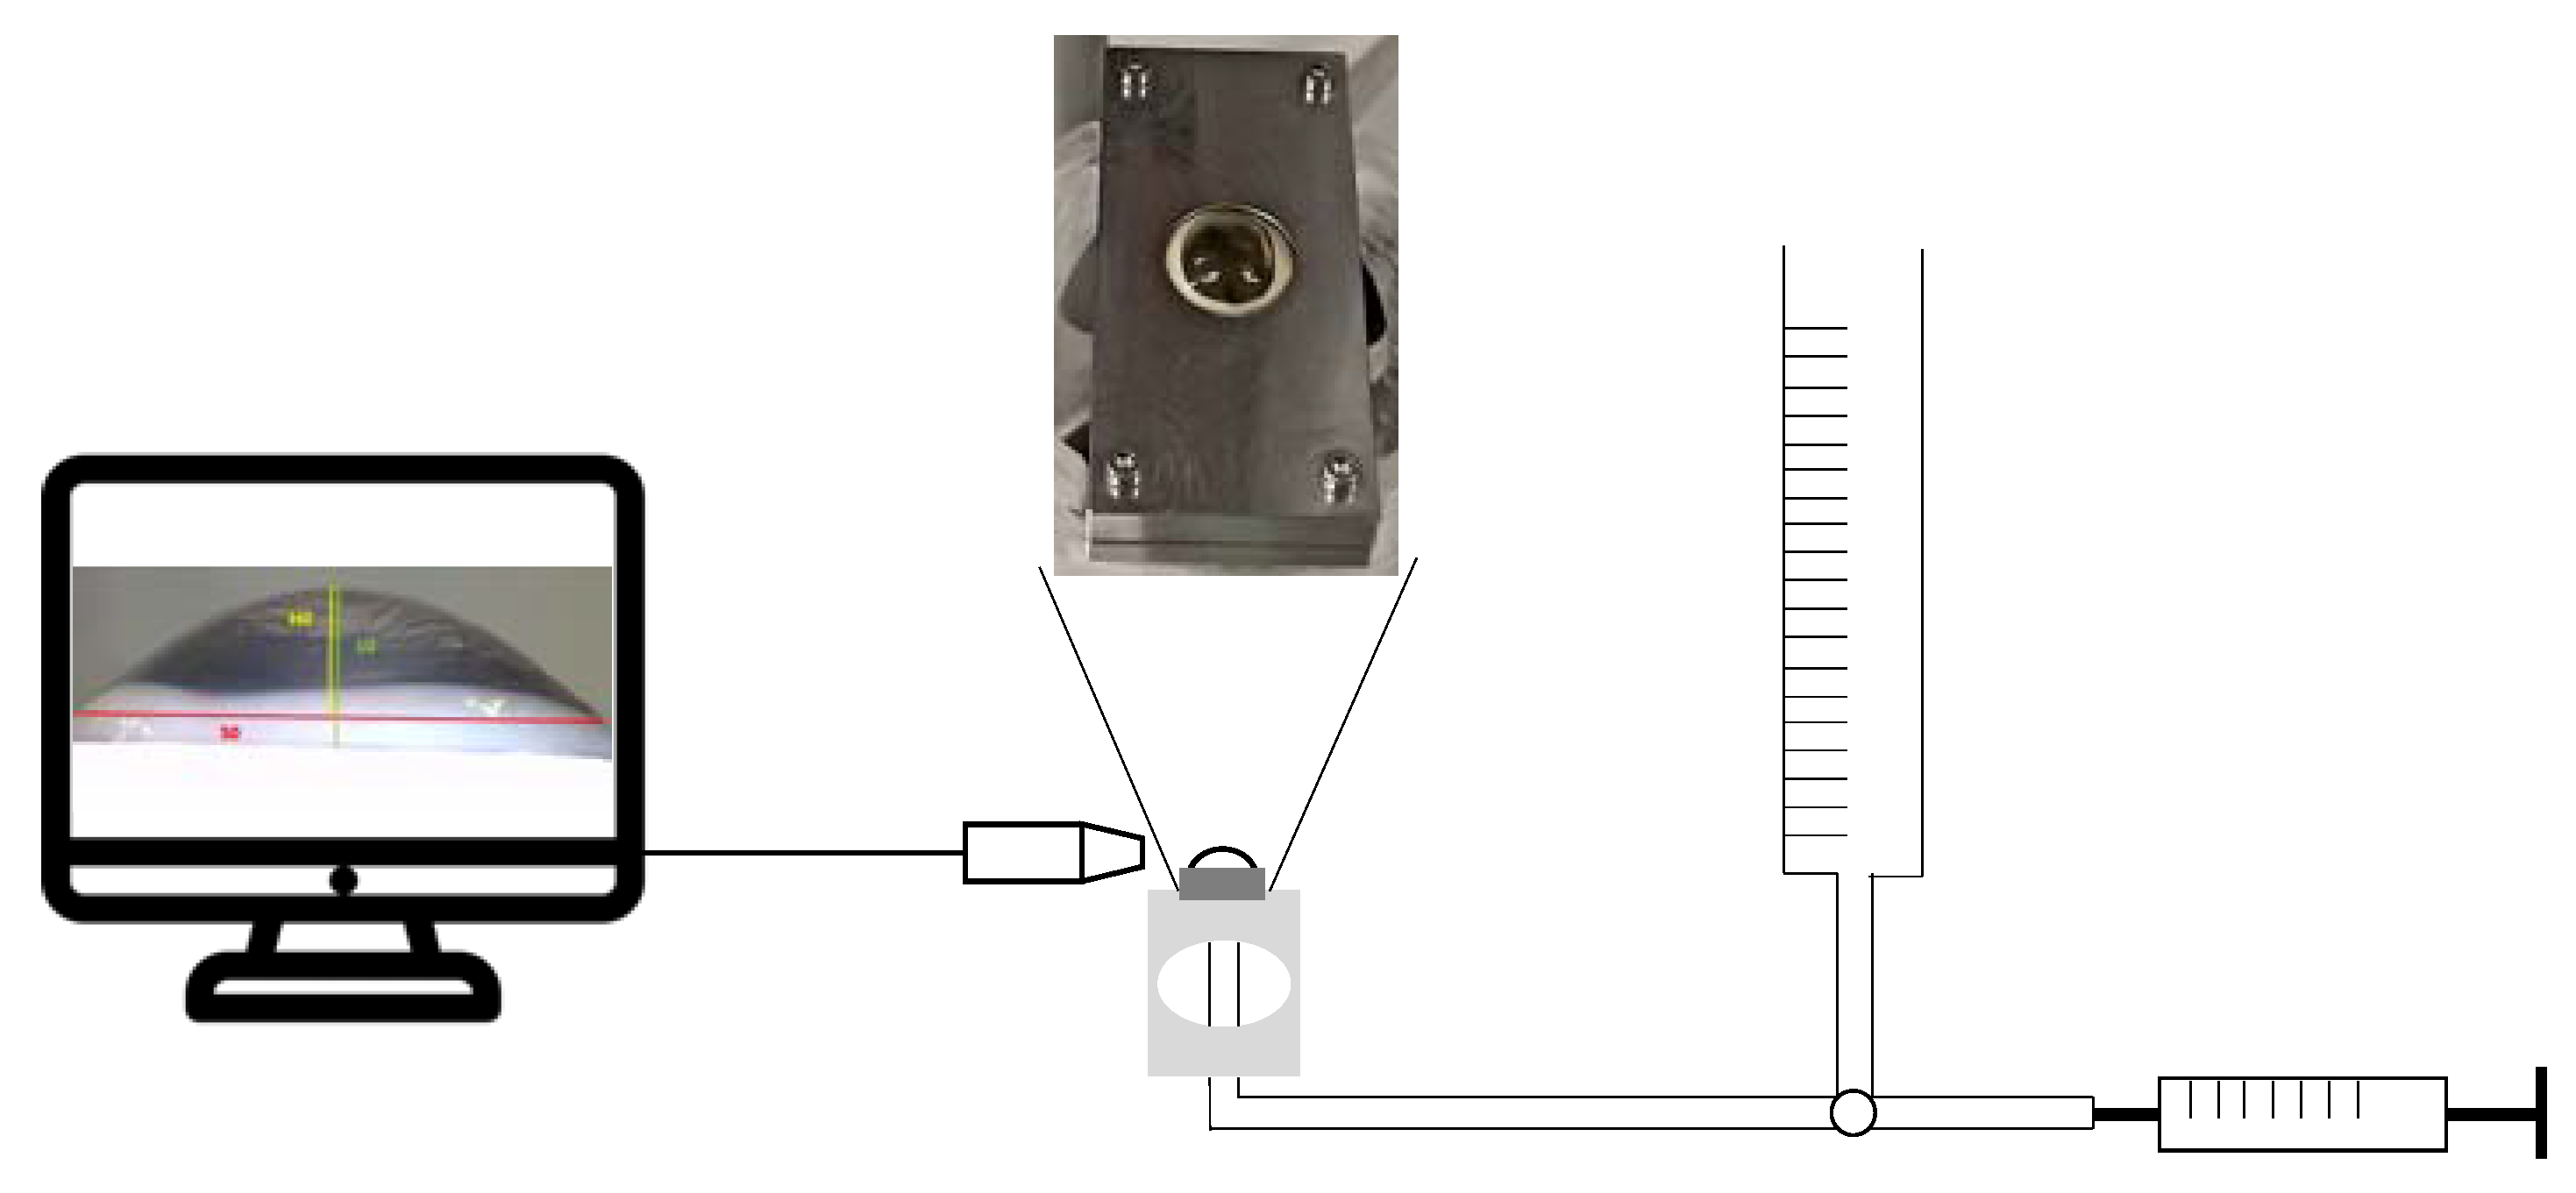
Figure 3.
(a) Intraocular pressure, IOP, resulting from discrete volume infusions of 0, 100, 200, 300, 400, and 550 µL. Filled symbols and continuous line are the transducer intraocular pressure, TIOP, data and TIOP trendline, respectively. Empty symbols and dashed line are Goldmann intraocular pressure data, GIOP, and GIOP trendline, respectively. (b) GIOP as a function of TIOP measured in the same pig eye. The line represents the first quadrant bisector.
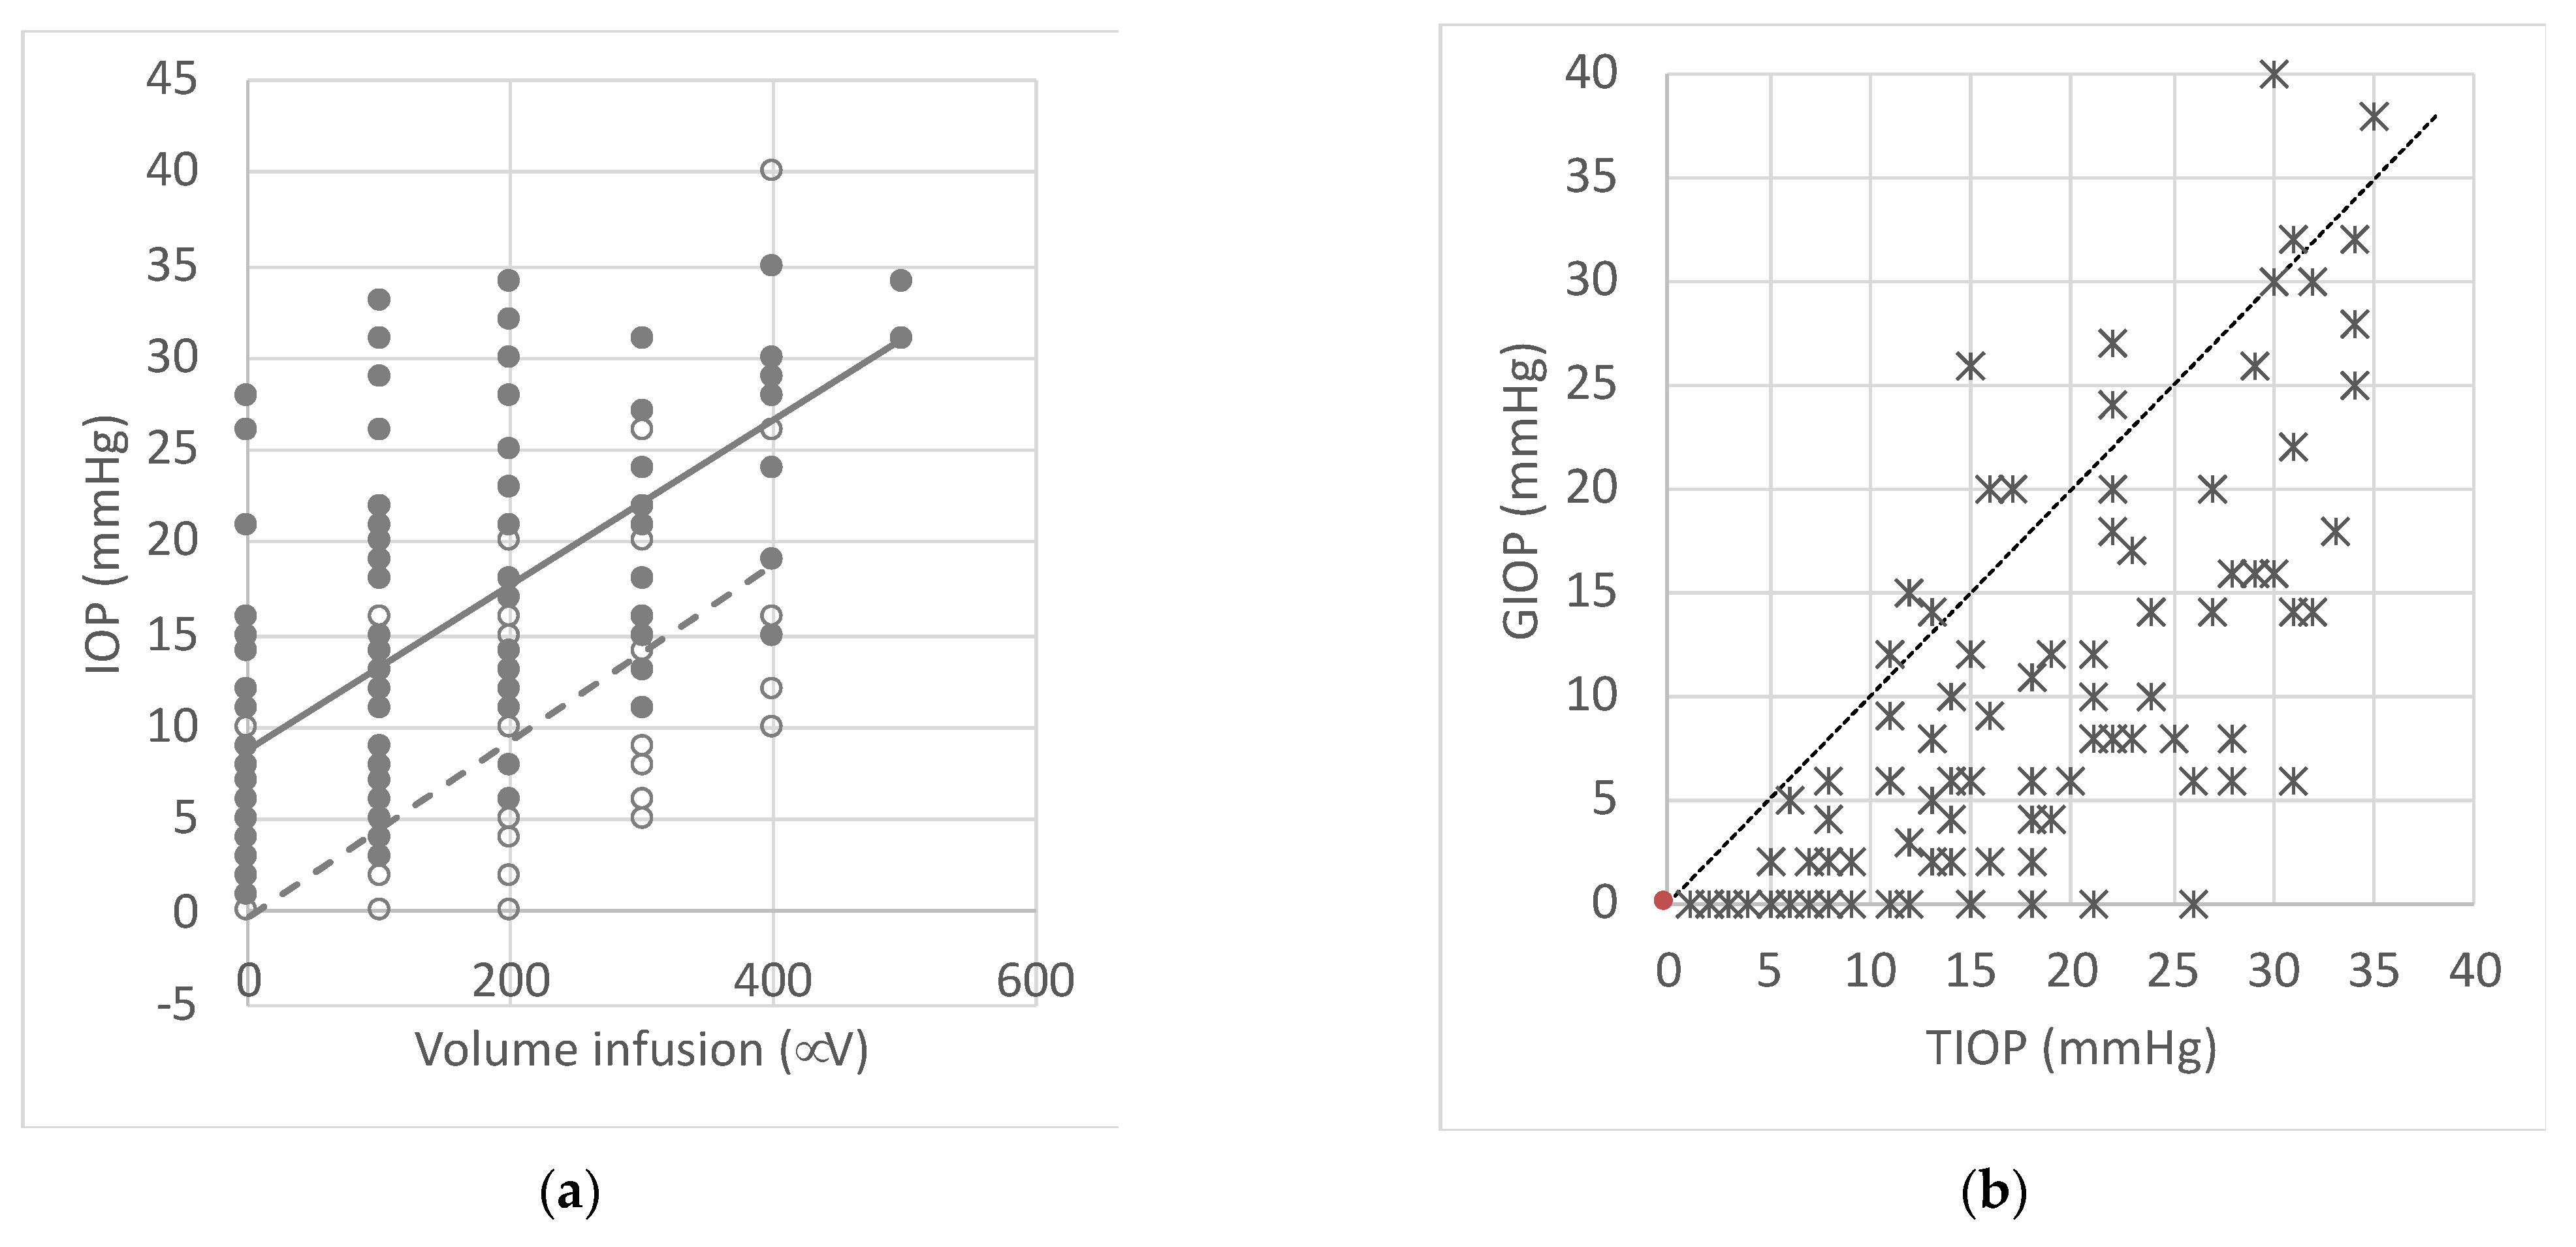
Figure 4.
(a) Distribution of the difference between transducer intraocular pressure and Goldmann intraocular pressure (delta-pressure, TIOP-GIOP) for different intervals of transducer intraocular pressure, TIOP; (b) % frequency distribution of different intervals of delta-pressure. Error bars in (a) are standard errors.

Figure 5.
(a) Bland–Altman plot: the difference in the measurements of intraocular pressure by the two instruments (delta-pressure) as a function of the average of the two measurements (average); (b) Bland–Altman PI plot: Delta-pressure difference is normalized to average and given in percentage.
Figure 5.
(a) Bland–Altman plot: the difference in the measurements of intraocular pressure by the two instruments (delta-pressure) as a function of the average of the two measurements (average); (b) Bland–Altman PI plot: Delta-pressure difference is normalized to average and given in percentage.
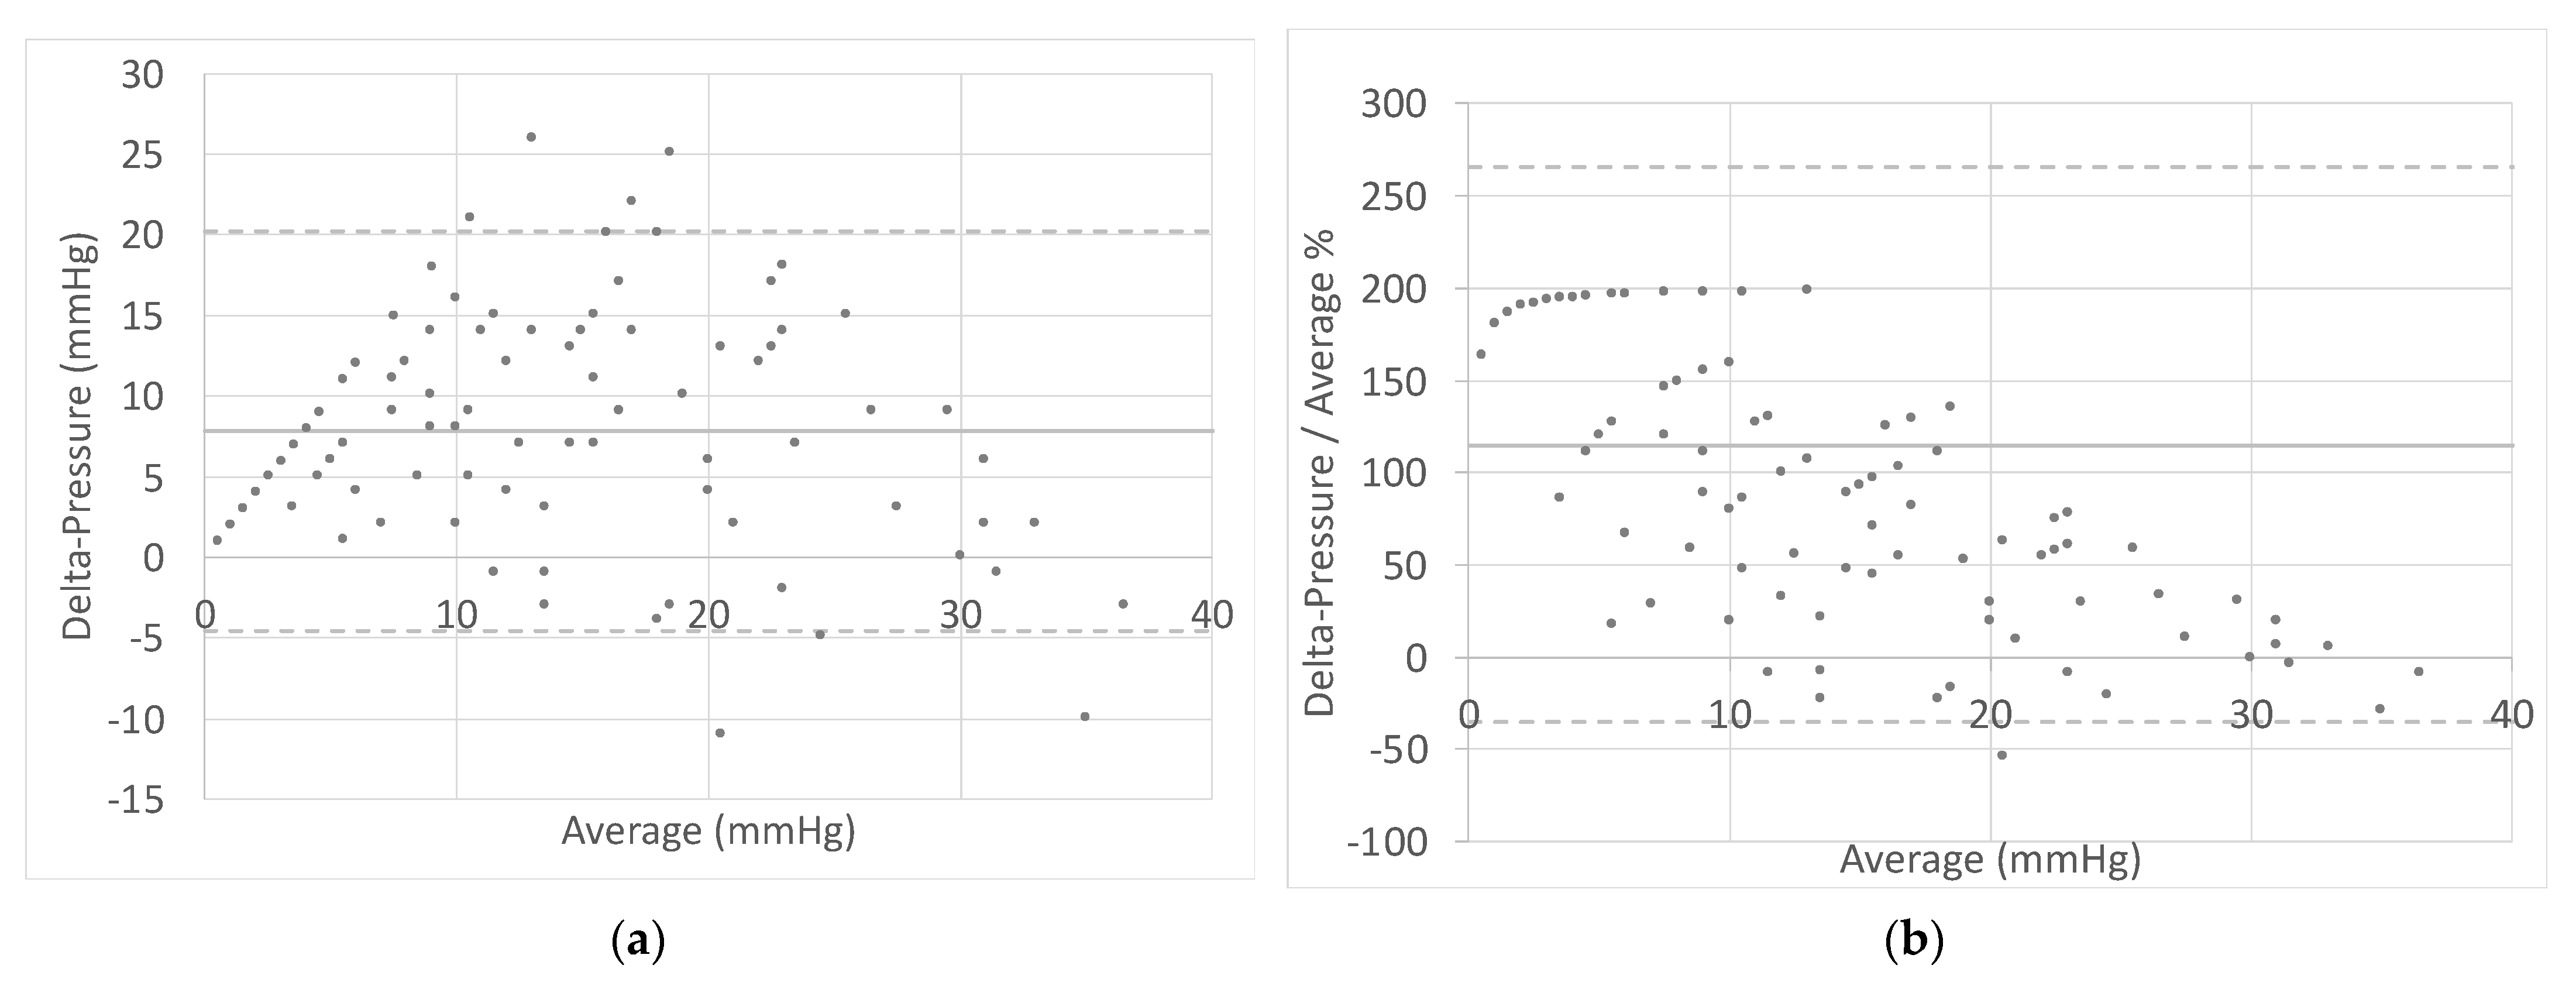
Figure 6.
(a) Stress-strain curves for untreated corneas obtained from the average data in Table 3 using the shell theory; (b) secant elastic modulus, E, for the applied pressures during inflation tests. Error bars in (b) are standard deviations.
Figure 6.
(a) Stress-strain curves for untreated corneas obtained from the average data in Table 3 using the shell theory; (b) secant elastic modulus, E, for the applied pressures during inflation tests. Error bars in (b) are standard deviations.

Table 1.
Shapiro-Wilk test results on the difference between transducer intraocular pressure and Goldmann intraocular pressure (delta-pressure) grouped in five intervals.
Table 1.
Shapiro-Wilk test results on the difference between transducer intraocular pressure and Goldmann intraocular pressure (delta-pressure) grouped in five intervals.
| Delta-Pressure (mmHg) | Normal Distribution | N |
|---|---|---|
| 0–7 | No | 32 |
| 8–14 | No | 37 |
| 15–21 | No | 22 |
| 22–28 | Yes | 18 |
| 29–35 | Yes | 17 |
Table 2.
Significance results between groups of Table 1.
Table 2.
Significance results between groups of Table 1.
| Delta-Pressure (mmHg) | Significance |
|---|---|
| (0–7) vs. (8–14) | p < 0.05 1 |
| (8–14) vs. (15–21) | p < 0.05 1 |
| (15–21) vs. (22–28) | p < 0.05 1 |
| (22–28) vs. (29–35) | n.s. 2 |
1 Mann-Whitney test, 2 t-test. Level of significance α = 0.05.
Table 3.
Average values from image analysis of corneas during inflation tests. R, radius of curvature, D, in-plane diameter, CCT, thickness at the apex, and H0, the elevation of the apex in the unstressed condition.
Table 3.
Average values from image analysis of corneas during inflation tests. R, radius of curvature, D, in-plane diameter, CCT, thickness at the apex, and H0, the elevation of the apex in the unstressed condition.
| Geometrical Parameter | Value (mm) ± SD |
|---|---|
| R | 8.49 ± 0.49 |
| D | 16.98 ± 0.98 |
| CCT | 1.41 ± 0.42 |
| H0 | 3.53 ± 0.65 |
Table 4.
Apex displacement, w (mm) for every applied pressure, P (mmHg).
| P (mmHg) | w (mm) ± SD |
|---|---|
| 3.68 | 0.26 ± 0.25 |
| 7.36 | 0.35 ± 0.29 |
| 11.03 | 0.40 ± 0.32 |
| 14.71 | 0.43 ± 0.32 |
| 18.39 | 0.47 ± 0.33 |
| 22.07 | 0.50 ± 0.34 |
| 25.74 | 0.53 ± 0.34 |
| 29.42 | 0.55 ± 0.31 |
Table 5.
Pearson correlation indexes between delta-pressure and corneal stiffness, E, for different pressure ranges.
Table 5.
Pearson correlation indexes between delta-pressure and corneal stiffness, E, for different pressure ranges.
| IOP Interval (mmHg) | Pearson Correlation |
|---|---|
| 1–35 | −0.10 |
| 1–12 | 0.09 |
| 13–21 | −0.41 |
| 22–35 | −0.29 |
Publisher’s Note: MDPI stays neutral with regard to jurisdictional claims in published maps and institutional affiliations. |
© 2021 by the authors. Licensee MDPI, Basel, Switzerland. This article is an open access article distributed under the terms and conditions of the Creative Commons Attribution (CC BY) license (https://creativecommons.org/licenses/by/4.0/).
Share and Cite
MDPI and ACS Style
Messenio, D.; Ferroni, M.; Boschetti, F. Goldmann Tonometry and Corneal Biomechanics. Appl. Sci. 2021, 11, 4025. https://doi.org/10.3390/app11094025
AMA Style
Messenio D, Ferroni M, Boschetti F. Goldmann Tonometry and Corneal Biomechanics. Applied Sciences. 2021; 11(9):4025. https://doi.org/10.3390/app11094025
Chicago/Turabian StyleMessenio, Dario, Marco Ferroni, and Federica Boschetti. 2021. "Goldmann Tonometry and Corneal Biomechanics" Applied Sciences 11, no. 9: 4025. https://doi.org/10.3390/app11094025
Note that from the first issue of 2016, this journal uses article numbers instead of page numbers. See further details here.