New Roles Assigned to the α1–β1 (and α2–β2) Interface of the Human Hemoglobin Molecule from Physiological to Cellular

Abstract
: Cellular life is reliant upon rapid and efficient responses to internal and external conditions. The basic molecular events associated with these processes are the structural transitions of the proteins (structural protein allostery) involved. From this view, the human hemoglobin (Hb) molecule (α2β2) holds a special position in this field. Hb has two types of αβ interface (i.e., α1β1 [and α2β2] and α1β2 [and α2β1]). The latter α1−β2 (and α2−β1) interface is known to be associated with cooperative O2 binding, and exhibits principal roles if the molecule goes from its deoxy to oxy quaternary structure. However, the role of the former α1−β1 (and α2−β2) interface has been unclear for a long time. In this regard, important and intriguing observations have been accumulating. A new role was attributed first as stabilizing the HbO2 tetramer against acidic autoxidation. That is, the α1−β1 (and α2−β2) interface produces a conformational constraint in the β chain whereby the distal (E7) histidine (His) residue is tilted slightly away from the bound O2 so as to prevent proton-catalyzed displacement of O2− by a solvent water molecule. The β chains thus acquire pH-dependent delayed autoxidation in the HbO2 tetramer. The next role was suggested by our studies searching for similar phenomena in normal human erythrocytes under mild heating. Tilting of the distal (E7) His in turn triggered degradation of the Hb molecule to hemichrome, and subsequent clustering of Heinz bodies within the erythrocyte. As Heinz body-containing red cells become trapped in the spleen, it was demonstrated that the α1−β1 (and α2−β2) interface may exert delicate control of the fate (removal) of its own erythrocyte. Herein we review and summarize the related results and current interpretation of the oxidative behavior of human Hb, emphasizing the correlation between hemichrome emergence and Heinz-body formation, and specifically discuss the new roles assigned to the α1−β1 (and α2−β2) interface. The α1−β1 (and α2−β2) interface seems to adequately differentiate between the two types of function (dual roles) from physiological to cellular.1. Introduction
In erythrocytes in situ, the reaction dynamics of human hemoglobin (Hb) with molecular dioxygen (O2) make them a particularly suitable O2 carrier. Hb can bind O2 in the ferrous form to carry out its physiological functions. During this reversible O2 binding, the oxygenated form of Hb (HbO2) is known to be oxidized by the bound O2 to the ferric met form (metHb), which cannot be oxygenated, and is thus physiologically inactive. However, the content of metHb in normal red cells in situ has been reported to be ≤1% [1,2]. An intra-erythrocytic nicotinamide adenine dinucleotide (NADH)-dependent reducing system can reduce metHb to deoxy-ferrous Hb and prevent the continued accumulation of metHb resulting from oxidation of the bound O2 to the ferrous heme iron(II) [3-5]. Even so, it has been suggested that its oxidation (autoxidation) process can be followed by transformation of the oxidized molecule (high-spin Fe3+) into a species absorbing as a low-spin compound, i.e., hemichrome, the formation of which can result in the accumulation of soluble and insoluble hemichromes and precipitation [6-11]. Despite these findings, direct evidence of hemichrome formation in normal erythrocytes is lacking.
Since the early works of Brooks [12,13], the oxidative process (autoxidation) of human Hb (HbO2) has been investigated by several workers. Among others, Monsouri and Winterhalter [14] and Tomoda et al [15] observed that the rate of autoxidation is strongly dependent upon the pH values of solutions. The study of Monsouri and Winterhalter [14] also showed that autoxidation of human HbO2 exhibited a biphasic nature with a initial fast (kAf) reaction, followed by a second slower (kAs) reaction, when observed in acidic solutions. Following the method of Monsouri and Winterhalter [14], our previous ultraviolet-visible (UV/VIS) spectroscopic study [16] indicated that this biphasic behavior seen in acidic solutions disappeared if the pH of solutions was >8, and became kAf = kAs. This finding leads to certain questions: how does the Hb molecule prompt the range of fast (kAf) and slow (kAs) components in acidic solutions? How does the molecule provoke kAf = kAs if the pH of solutions is >8? Does the biphasic autoxidation seen in acidic pH regions reflect a different rate due to the individual Hb chains or the presence of valency hybrid intermediates such as (α2+β3+)2 and (α3+β2+)2? Through attempts to locate a site integrating these puzzling problems behind the phenomenon, a pH-sensed molecular device was suggested to exist in the HbO2 tetramer. Consequently, it was shown that this mechanism produces a tilting of the distal (E7) histidine (His) residue in the β chains at position 63, thereby preventing the proton-catalyzed displacement of O2− by a solvent water molecule [17,18]. The β chains thus acquire pH-dependent delayed autoxidation in the HbO2 tetramer.
Similar phenomena suggesting participation of an inherent tilting capability of the distal (E7) His residues of the Hb molecule was also very interesting. Following the method of Brunori et al [19], our previous UV/VIS spectroscopic study [20] showed that human HbO2 obtained from healthy donors tended to degrade to produce hemichrome even at close to physiological temperatures and pH because its occurrence was a function of pH, temperature and the progress of autoxidation of ferrous HbO2 to the ferric met form. It is known that Heinz bodies are intra-erythrocytic inclusions of hemichrome formed from oxidized or denatured Hb. They have been found and characterized in drug-induced hemolytic anemia, defects in the intra-erythrocytic reducing system (e.g., glucose 6-phosphate dehydrogenase [G-6-PD] deficiency) and in unstable Hb disease [21,22]. Hemichrome is rarely found in erythrocytes in situ, so little attention has been paid to hemichrome and formation of Heinz bodies in the context of normal Hb or normal erythrocytes. Nevertheless, we carried out a series of experiments concerning normal Hb and normal erythrocytes based on the hypothesis that formation of Heinz bodies is not only a peculiarity of labile Hb in patients, but is also an innate characteristic of physiologically normal Hb molecules [23,24]. As a consequence, it was shown that the inherent tilting capability of the distal (E7) His residue is closely related to the molecular instability (degradation) of Hb, and that this instability can trigger degradation of the molecule to hemichrome, and subsequent clustering of Heinz bodies within the erythrocyte.
In the studies mentioned above [23,24], Heinz bodies were visualized by exposing blood smears to acetylphenylhydrazine and staining with crystal violet. Changes within the erythrocytes were observed using light microscopy under oil immersion. Prior to the Heinz-body formation (acetylphenylhydrazine) test, blood samples were subjected to mild heating in vitro at close to physiological temperatures. The findings indicated that the number of Heinz bodies formed in red cells increased with increasing temperature of the blood sample [23,24]. In vitro evaluation of blood fluidity was also conducted under identical conditions using a micro-channel array flow analyzer to give an index of erythrocyte deformability [24]. The equipment included a characteristic V-shaped groove array with micro flow paths (width, 7 μm; length, 30 μm; depth, 4.5 μm) engraved on a single-crystal silicon substrate in an integral circuit. This equipment made it possible to not only observe red cells passing through individual micro-channel arrays by use of an inverted metallographic microscope, but also enabled evaluation of blood fluidity through the groove array in terms of the transit time of the blood sample for a given transit sample volume. The findings indicated that erythrocyte deformability decreased with increasing temperature of the blood sample at >37 °C [24]. In the spleen, Heinz body-containing red cells become trapped while traversing small apertures in the basement membranes separating the cords from the sinusoids (where the spaces are sufficiently small to require extreme deformation of red cells) [25]. Thus, it was suggested that the Hb molecule controls removal of erythrocytes from the blood circulation via triggering degradation of the Hb molecule to hemichrome, and subsequent clustering of Heinz bodies within the erythrocytes depending on the internal and extraneous conditions of the erythrocyte.
Cellular life is relying on rapid and efficient responses to internal and external conditions. The basic molecular events associated with these processes are the structural transitions of the proteins (structural protein allostery) involved [26]. Therefore, the tetrameric human Hb (α2β2; alternatively, a dimer of αβ protomers) deserves a special position in this field. Hb has two types of αβ interface. One is the α1−β1 (and α2−β2) and the other is the α1−β2 (and α2−β1). The latter “sliding” contact is known to be associated with cooperative O2 binding, and in fact has important roles if the Hb molecule goes from the deoxygenated to oxygenated quaternary structure. However, the role of the former was unclear for a long time. In this regard, important and intriguing observations have been accumulating. Thus, new roles could be attributed for α1β1 (and α2β2). It seems that the α1−β1 (and α2−β2) interface has dual roles. One is for stabilizing the HbO2 tetramer against acidic autoxidation and the other is for controlling the fate (removal) of its own erythrocyte from the blood circulation. It seems that the α1−β1 (and α2−β2) interface produces a conformational constraint in the constructed chains of the Hb molecule via tilting of the distal (E7) His residues. The Hb molecule seems to adequately differentiate between the two types of function (dual roles) responsible for the α1−β1 (and α2−β2) interface from physiological to cellular. In this overview, we present our findings that led to this conclusion and discuss new roles assigned to the α1−β1 (and α2−β2) contact.
2. Biphasic Autoxidation Curves Observed in Human HbO2 in Acidic Solutions
In this section, we focus on the biphasic nature of the autoxidation of human HbO2 seen in acidic solutions. The phenomenon can be described by first-order kinetics containing two rate constants, kAf for the initial fast oxidation and kAs for the second slower oxidation, respectively, on the basis of our previous report [16]. This issue was the starting point that led us to uncover a new function of the α1−β1 (and α2−β2) contact existing in the Hb molecule.
HbO2 was prepared from freshly drawn samples of human blood (total, 50–80 mL) obtained from healthy donors. Samples were centrifuged at 2,400 × g for 10 min to remove supernatant plasma and buffy coats. The erythrocytes obtained were washed five times with ice-cooled 0.9% NaCl solution (saline) by centrifugation and hemolyzed by adding the same volume of ice-cooled distilled water. The hemolysate was then fractionated with ammonium sulfate between 20% saturation and 70% saturation at pH 6.8. After dialysis, this solution was passed through two Sephadex G-50 columns (5 × 90 cm) equilibrated with 10 mM Tris-HCl (pH 8.6). The effluent Hb fraction was further separated using a diethylaminoethyl (DEAE)-cellulose column (3 × 15 cm) equilibrated with 10 mM Tris-HCl (pH 8.6) and washed sequentially with stepwise changing of buffer solutions as follows: (i) 60 mM Tris-HCl (pH 8.0); (ii) 100 mM Tris-HCl (pH 7.5); finally (iii) 100 mM NaCl with 100 mM Tris-HCl (pH 8.0). HbO2 (human adult) was eluted out as the major fraction with 60 mM Tris-HCl (pH 8.0) and used in the experiments after dialyzing against 5 mM Tris-HCl buffer (pH 8.5).
The autoxidation reaction was measured by UV/VIS spectroscopic means in 0.1 M buffer over a wide pH range (5.3–10.5) at 37 °C. Two milliliters of solution containing 0.2 M buffer was placed in a test tube and incubated in a waterbath maintained at 37 ± 0.1 °C using a NESLAB temperature control system (Model RTE-100 or 111 or 210; NESLAB Instruments, Inc., Portsmouth, NH, USA). The reaction was started by adding the same volume of fresh HbO2 solution (50-125 μM in heme contents). The reaction mixture was then quickly transferred to a spectrophotometric cell (Spectrocell, Type Inject-A-Cell; Funakoshi Co., Tokyo, Japan) with a screwcap stopper. Changes in absorption at 450–650 nm were recorded on the same chart at measured time intervals. Spectra were recorded using an UV/VIS spectrophotometer (JASCO, Model Ubest-50 or V-560 or V-570; Japan Spectroscopic Co., Tokyo, Japan), equipped with a thermostatically controlled (within ±0.1 °C) cell holder. At the final state of each run, Hb molecules were all completely converted to the ferric met form by addition of potassium ferricyanide. The buffers used were: acetate for pH 4.5–5.5, 2-(N-morpholino) ethanesulfonic acid monohydrate (MES) for pH 5.0–6.75, N-2-hydroxyethylpiperazine-N′-2-ethanesulfonic acid (HEPES) for pH 6.55–8.3, 2-(cyclohexylamino) ethanesulfonic acid for pH 8.2–10.2, and 3-cyclohexylaminopropanesulfonic acid for pH 10.0–10.5.
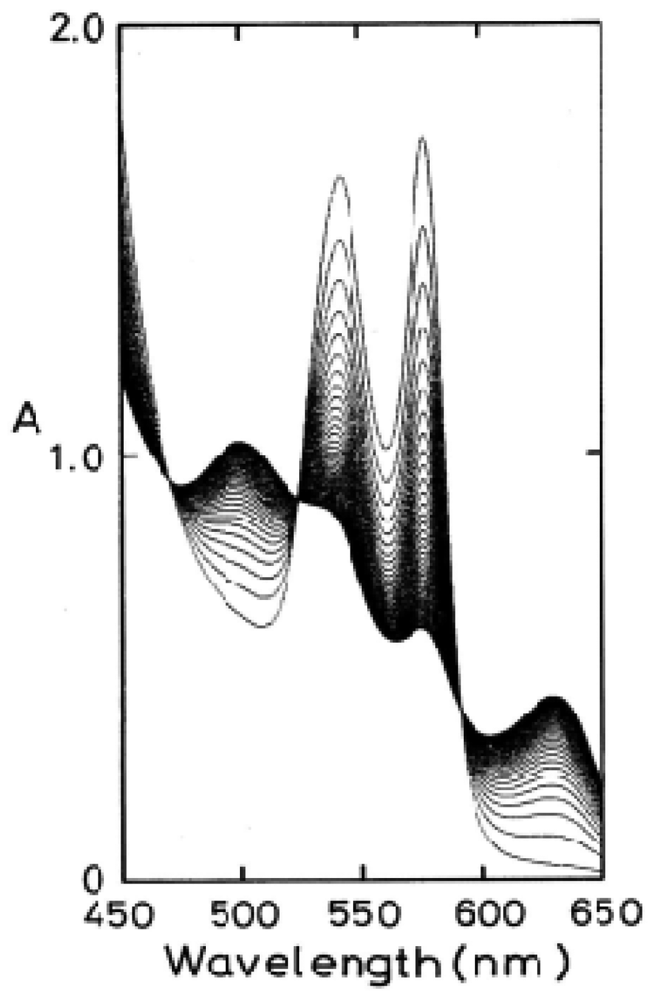
Figure 1 shows an example of the spectrophotometric changes over time from 450 nm to 650 nm for autoxidation of human HbO2 when observed in 0.1 M MES buffer (pH 5.3) at 37 °C. In this reaction process, HbO2 was autoxidized to its ferric met form through the tendency of the bound O2 to oxidize ferrous heme iron (II) with generation of superoxide anions (O2−):
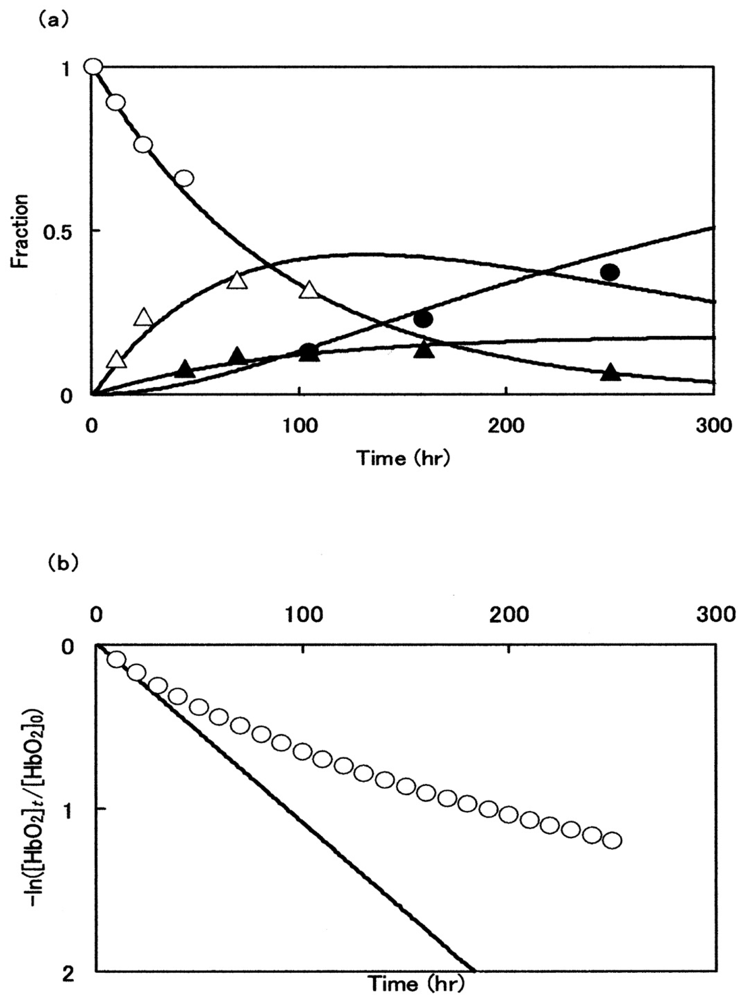
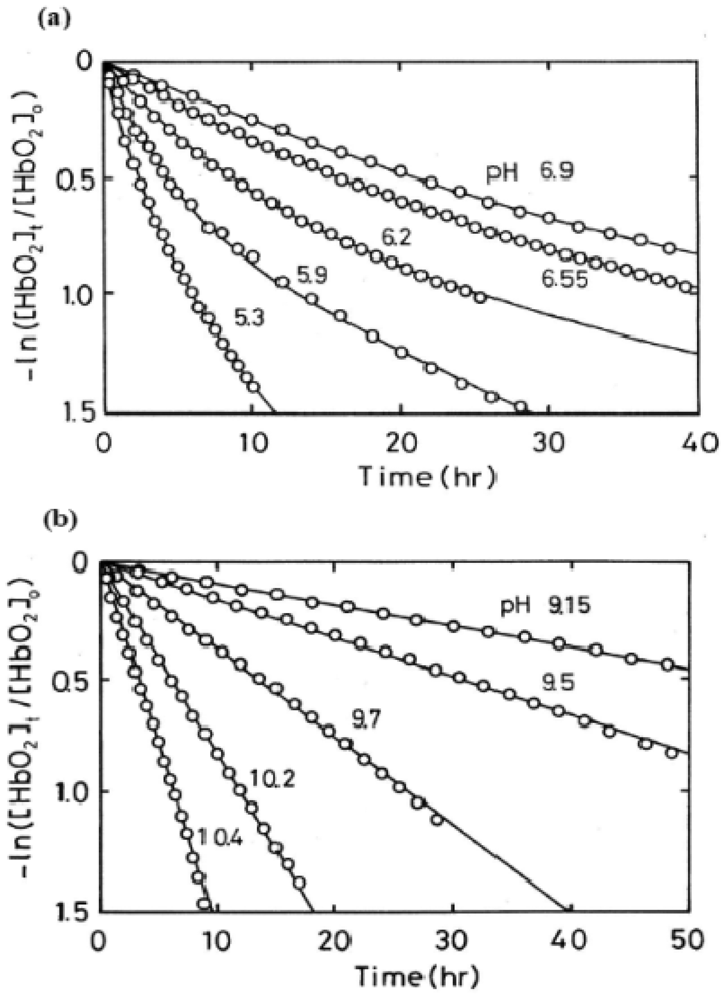
Here kA represents the observed rate constant of the reaction at a given pH and temperature. The reaction process was followed in each experimental run by the ratio ([HbO2]t/[HbO2]0) of HbO2 concentration after time t to that at time t = 0 that was monitored by the absorbance ratio of (At − A∞)/(A0 − A∞) at 576 nm (α-peak of HbO2). The ratio was then plotted against time. Each curve shown in Figure 2 represents the −ln([HbO2]t/[HbO2]0) versus time plot (first-order plot) for this phenomenon. In acidic solutions (Figure 2(a)), the reaction was biphasic and can be described by first-order kinetics containing two rate constants as follows:
This equation was originally proposed by Monsouri and Winterhalter [14], where kAf and kAs represent first-order rate constants for the initial fast oxidation and the second slower oxidation, respectively, and P is the molar fraction of the initial fast component. In Figure 2(a), solid lines represent the best fitting derived by the least-squares method using the equation to each run. However, as shown in Figure 2(b), when the pH of solutions is >8, a plot of −ln([HbO2]t/[HbO2]0) versus time showed a single-phase reaction with a single first-order rate constant, although curve fittings could be made using the same equation under conditions of P = 0.5 and kAf = kAs. Thus, it was shown that the biphasic behavior seen in acidic solutions gradually disappeared with increasing pH of solutions and completely disappeared if the pH of solutions was >8.
In this way, the kinetic parameters and molar fraction of the initial fast component (P) for the biphasic nature of human HbO2 autoxidation were established in each run in 0.1 M buffer at 37 °C (Table 1). It was evident that the values of P varied from 0.47 to 0.53. This means that HbO2 was autoxidized with half of the component via the reaction process with the initial fast reaction with kAf and the other half via the procedure with the second slower rate (kAs). Thus, autoxidation of human HbO2 may be written as follows:
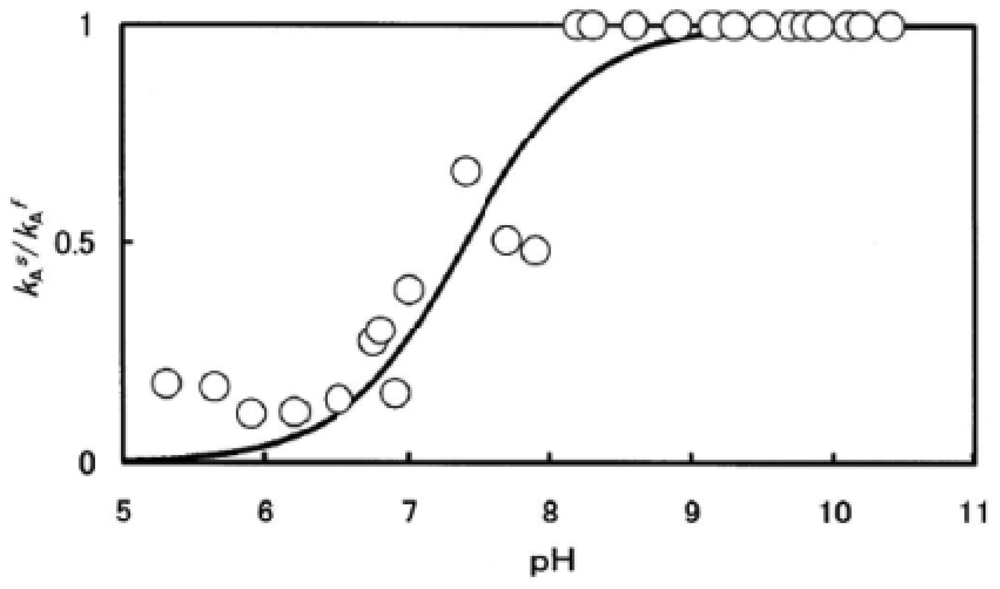
To clarify the processes behind this phenomenon, the obtained values of kAs/kAf were plotted against the pH of solutions (Figure 3). In Figure 3, the solid line shows that the computed curve obtained by the least-squares method fitted the experimental data over the whole range of pH 5–10.5, where a single dissociable group, AH with Ka, was assumed to be involved in the reaction:
For neutral amino acids, acid–base equilibrium is usually given by the dissociation constant: AH ↔ A− + H+ and thus Ka = [A−]·[H+]/[AH]. The best fitting was achieved when pKa = 7.4 (at 37 °C). In this regard, Hermans and Rialdi [27,28] reported microcalorimetric ionization data on amino-acid residues for sperm whale myoglobin (Mb) in which they assigned the His residue with values of pKa = 6.62, the standard Gibbs energy (ΔG0) = 37.7 kJ·mol−1, the enthalpy (ΔH0) = 29.7 kJ·mol−1, and the entropy (ΔS0) = −26.8 J·mol−1·K−1. It is unwise to identify a dissociation group only by its pKa value because of the anomalies often found in proteins. Hence, we confirmed that AH must be a His residue assuming that the primary and tertiary structures of α and β subunits are remarkably similar to each other and to Mb. This fact provides information for the existence of a pH-sensed molecular device that can manifest the biphasic autoxidation of the HbO2 tetramer via participation of a single amino-acid residue with pKa = 7.4 (at 37 °C).
3. Chain Separation and Rate Measurements for the Separated Chains
To not only elucidate the biphasic characteristics of human HbO2 autoxidation but also to clarify how the Hb molecule can prompt the range of fast (kAf) and slow (kAs) components against pH values of the solutions, chain separation of the constituted chains from the parent molecules is essential. In this section, we discuss the results of our study investigating chain separation of α and β chains from the HbO2 tetramer and their rate measurements.
Isolation of α and β chains from the parent molecules was made using sodium p-hydroxymercuribenzoate (p-MB) by a one-column method using carboxymethyl (CM)-cellulose and alternatively by a two-column method. The following procedure was for two-column method; details for the one-column method can be found in Sugawara et al. [20]. One-hundred milligrams of p-MB were dissolved in 2 mL of 0.1 M NaCl and neutralized with 1 M CH3COOH. This was reacted with 10 mL of HbO2 solution in 30 mM phosphate buffer, pH 6.0, in the presence of 0.1 M NaCl. To obtain the αp-MB chains, the mercurated HbO2 solution was adjusted to pH 8.2 by filtration through a Sephadex G-25 column (25 × 40 cm) equilibrated with 15 mM HEPES buffer (pH 8.2). The resultant solution was then passed through a DEAE-cellulose column (3 × 12 cm) equilibrated with the same buffer. Under these chromatographic conditions, the αp-MB chains were readily eluted out because the unreacted HbO2 and mercurated β chains were retained on top of the column at this pH. With respect to separation of the βp-MB chains, the pH of the mercurated HbO2 solution was adjusted to 6.7 using a Sephadex G-25 column (25 × 40 cm) equilibrated with 10 mM phosphate buffer (pH 6.7) and the solution applied on a CM-cellulose column (3 × 12 cm) equilibrated with the same buffer. Under these conditions, only the βp-MB chains were eluted completely. Measurement of the autoxidation rate for the isolated chains was identical to the procedure of rate measurements for HbO2.
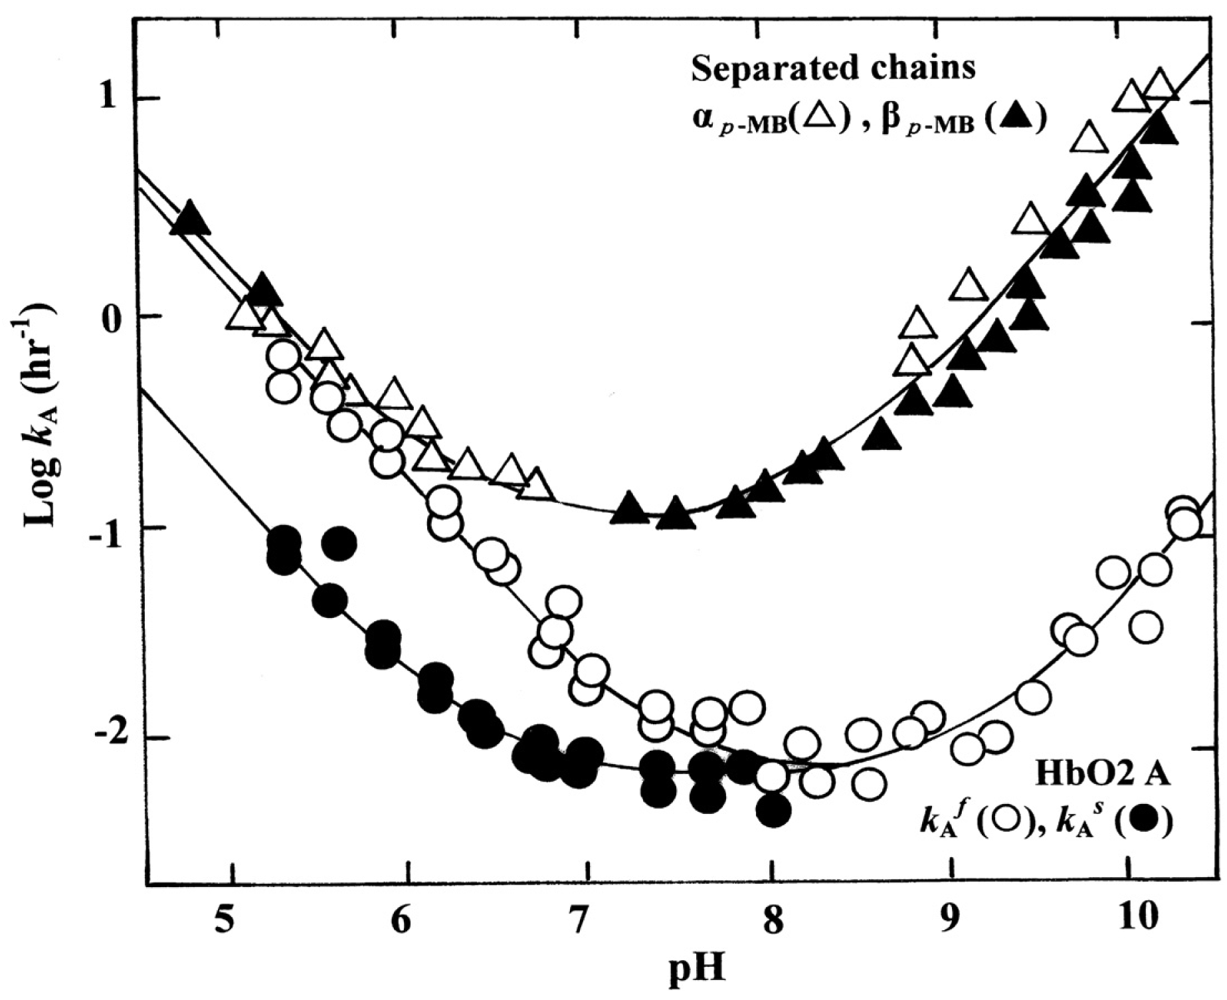
Figure 4 shows the pH profiles for the autoxidation rate of the isolated αp-MB and βp-MB chains. With reference to the rates (k Af and kAs) of the parent molecules calculated from biphasic autoxidation curves, the isolated chains were shown to be oxidized much more rapidly to the ferric met-form over the entire pH range (5–10.5) because the reaction followed simple, first-order kinetics as follows:
Similar pH profiles were obtained for p-MB-removed chains, i.e., the αSH and βSH chains. p-MB can be removed from the αp-MB and βp-MB chains by incubation with 2-mercaptoethanol, as described elsewhere [17]. In separated-chain solutions, the protein is known to exist in equilibrium of α ↔ α2 or β ↔ β4, respectively. Under our experimental conditions, the monomeric form (87%) was present in the separated α chain, whereas the tetrameric form (99%) was predominant in the β chain. This estimation was made on the basis of the results by McDonald et al. [29].
Thus, it became evident that the isolated α and β chains could be oxidized much more readily over the measured pH range (5–10.5) when compared with the respective rates of the parent molecules as a reference. With respect to the difference in the rate between the isolated individual chains, this seemed to be within reasonable experimental errors in the values of αp-MB and βp-MB chains, and the αSH and βSH chains.
4. Innate Instability of the Hb Molecule and Its Degradation to Hemichrome
Autoxidation seems to be inseparably related to the instability of the Hb molecule and its degradation to hemichrome. Our previous UV/VIS spectroscopic study [20] showed that human HbO2 from healthy donors tended to degrade to produce hemichrome even at close to physiological temperatures and pH. In this regard, it has been suggested that the oxidation (autoxidation) process of Hb may be associated with transformation of the oxidized molecule (high-spin Fe3+) into hemichrome, the formation of which can result in the accumulation of soluble and insoluble hemichromes and precipitation [6-11], as mentioned above. Formation of hemichrome is enhanced in separated α and β chains [7,11,19,20,29,30]. In this section, we discuss the innate molecular instability of Hb, which triggers degradation of the molecule to hemichrome. This process is readily detected through UV/VIS spectroscopic observation during the entire process of autoxidation of human HbO2.
Hemichrome formation could be observed spectroscopically in 0.1 M buffer over a wide range of pH (4.5–10.5) and temperature (35–55 °C). Two milliliters of solution containing 0.2 M buffer were placed in a test tube and incubated in a waterbath maintained at each desired temperature (±0.1 °C) using a NESLAB temperature control system (Model RTE-100 or 111 or 210; NESLAB Instruments, Inc.). The reaction was started by adding the same volume of fresh HbO2 solution (125–235 μM in heme contents). The reaction mixture was then quickly transferred to a spectrophotometric cell (Spectrocell, Type Inject-A-Cell) with a screwcap stopper. Changes in absorption at 450–650 nm were recorded on the same chart at measured time intervals. Spectra were recorded using a UV/VIS spectrophotometer (JASCO, Model Ubest-50 or V-560 or V-570), equipped with a thermostatically controlled (within ±0.1 °C) cell holder. At the final state of each run, Hb molecules were all completely converted to the ferric met form by the addition of potassium ferricyanide.
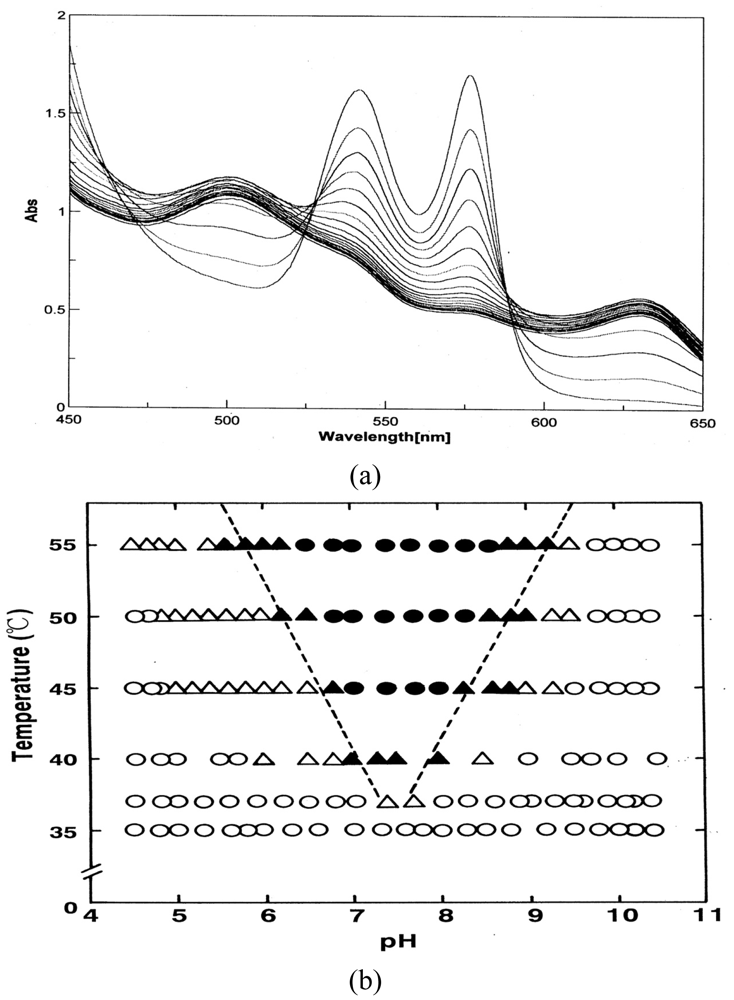
Figure 5 shows how autoxidation is inseparably related to the instability of the Hb molecule and its degradation to hemichrome. Figure 5(a) illustrates the spectrophotometric changes over time from 450 nm to 650 nm for hemichrome formation during autoxidation of HbO2 when HbO2 was incubated in 0.1 M MES buffer (pH 6.5) at 40 °C. HbO2 was autoxidized to its ferric met form. However, sudden disruption of the spectra was observed during the late stage of the reaction whereby hemichrome formation could be detected by elevation of the baseline and a shift in isosbestic points caused by precipitation. Hemichrome formation could be readily detected even in HbO2 at every stage during the course of autoxidation (i.e., during the initial, intermediate, and final stages) while varying the temperature of the solution from 35 °C to 55 °C and the pH from 4.5 to 10.5 (Figure 5(b)). Its occurrence was a function of not only the pH and temperature of the solution, but also of the progress of the autoxidation of HbO2.
We therefore attempted to categorize the phenomenon into the following four cases in terms of [HbO2]t = E.P./[HbO2]0 (Figure 5(b)):
t = 0 or [HbO2]t = E.P./[HbO2]0 = 1 ≤ tE.P. < [HbO2]t = E.P./[HbO2]0 = 0.75;
[HbO2]t = E.P./[HbO2]0 = 0.75 ≤ t E.P. < [HbO2]t = E.P./[HbO2]0 = 0.25;
tE.P. ≤ [HbO2]t = E.P./[HbO2]0 = 0.25;
no hemichrome formation during the entire process.
E.P. is the observed emergence point of hemichrome formation in each run. [HbO2 t = E.P./[HbO2]0 is the ratio of HbO2 concentration after time t = E.P. to that at time t = 0 and can be monitored by the absorbance ratio of (At − A∞)/(A0 − A∞) at 576 nm (α-peak of HbO2). [HbO2]t = E.P./[HbO2]0 = 0.5 represents equal mixtures of HbO2 and metHb, i.e., the midpoint of the autoxidation reaction. Hence, case (1) means that hemichrome formation was noticeable at the initial stage of autoxidation. Accordingly, case (2) indicates its occurrence at the intermediate stage, and case (3) at the final stage. In Figure 5(b), the symbols used correspond to: ● for case (1), ▲ for case (2), △ for case (3) and ○ for case (4). To determine if the phenomenon was represented by case (3) or case (4), the reaction mixture was converted to metHb by the addition of small amounts of ferricyanide and maintained at the given temperature for 2 days to see if hemichrome precipitation occurred.
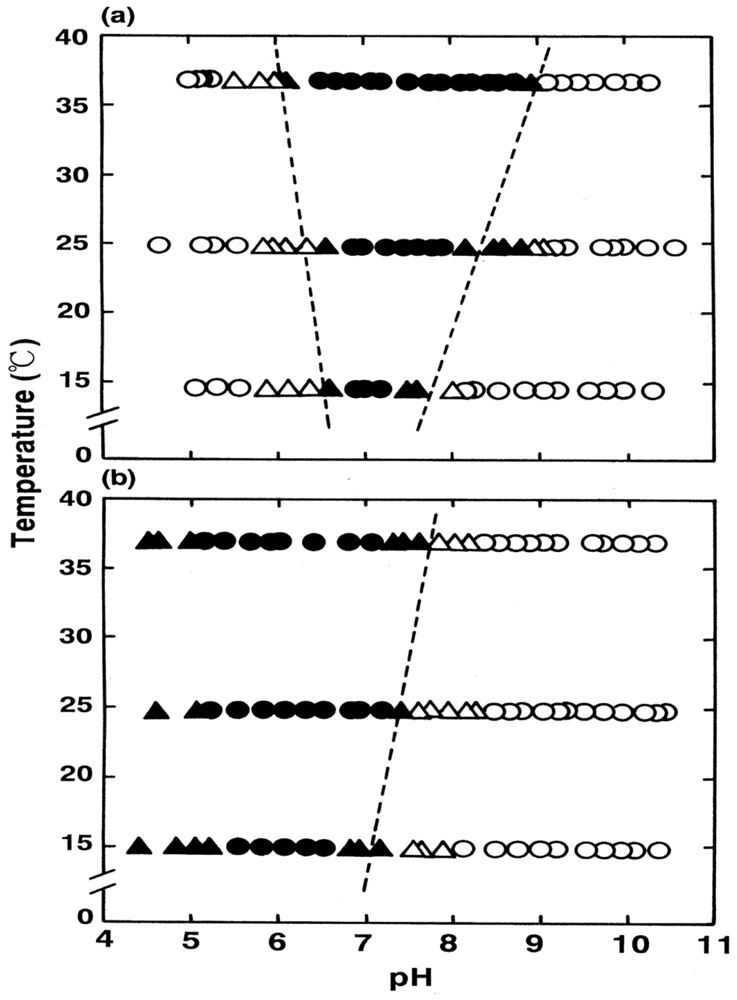
Thus, the findings suggested that HbO2 was highly susceptible to hemichrome formation, even under physiological pH and temperature. The broken lines in Figure 5(b) show that the threshold for this susceptibility in relation to pH and temperature. When compared with the tetrameric parent molecule, the isolated α (αp-MB) and β (βp-MB) chains were found to have much higher susceptibilities to hemichrome formation, and showed individual pH–temperature diagrams (Figure 6). The occurrence of hemichrome can be described as follows:
We must be careful when evaluating the data of the isolated chains shown in Figure 4. Because of the instability of Hb molecules and their relationship to hemichrome, the first-order rate constant for the isolated chains was established in each experimental run using only the initial slope of the −ln([HbsubO2]t/[HbsubO2]0) versus time plot. Once hemichrome precipitation arose, one could not get the endpoint spectrum (the ferric met form) of the reaction, whereby Hb molecules in the reaction mixture should be all completely converted to the ferric met form by addition of potassium ferricyanide. Hence, measurement must be confined within the initial range, in which existence of isosbestic points of the spectra that means non-occurrence of hemichrome formation during the entire reaction process was surely guaranteed.
5. UV/VIS Spectrophotometric, Isoelectric-Focusing Electrophoretic and Polyacrylamide Gel Electrophoretic Studies for the Autoxidation of Human HbO2
In this section, we review our findings resulting from UV/VIS spectrophotometric, isoelectric-focusing electrophoretic and polyacrylamide gel electrophoretic measurements for autoxidation of human HbO2. It has been demonstrated that the reaction process should be reflected by a different oxidation rate due to different Hb chains [14] or the presence of intermediate Hb with valency hybrids such as (α2+β3+)2 and (α3+β2+)2 [15,30-36]. As soon as chain separation was achieved using p-MB, 7.5% polyacrylamide gel electrophoresis was undertaken for a series of samples to detect the oxidized ratio of the constituted chains after time t to that at time t = 0. Simultaneously, isoelectric-focusing electrophoresis was carried out for analyzing valency hybrid intermediates on an ampholine plate gel.
The experiment was carried out in 0.05 M phosphate buffer (pH 5.0) in the presence of 20% (v/v) glycerol at 37 °C after setting the HbO2 concentration to 1.25 mM (heme content). We employed a nearly tenfold higher HbO2 concentration than the usual HbO2 concentration so that the reaction was monitored using a 1-mm photometric cell instead of a conventional 1-cm cell. Glycerol was used as a protein stabilizer to prevent hemichrome formation during the entire time course of the experiment. For these UV/VIS spectrophotometric, isoelectric-focusing electrophoretic and polyacrylamide gel electrophoretic measurements, an appropriate volume of 0.1 M buffer solution was placed in a test tube and incubated in a waterbath maintained at 37 ± 0.1 °C using a NESLAB temperature control system (Model RTE-1111). The reaction was started by adding the same volume of HbO2 solution preincubated in the same waterbath. The reaction mixture was then divided into two. One portion was quickly transferred to a spectrophotometric cell with a 1-mm path length (monitoring cell) and the other to a conventional cell with a 1-cm path length (sampling cell). Both cells were maintained at 37 ± 0.1 °C in a thermostated cell holder equipped with a UV/VIS spectrophotometer (JASCO, Model V-560). While monitoring spectrophotometric changes over time from 450 nm to 650 nm in the monitoring cell, sample collection was made from the sampling cell at given intervals. These samples were then submitted to valency hybrid analyses as well as a measurement study for the detection of the oxidized ratio of the constituted chains.
Isoelectric-focusing electrophoresis was carried out using a flatbed apparatus (Model-LKB-Multiphor II, Pharmacia, Uppsala, Sweden). By use of sample application pieces, each 20 μL of sample was applied to a precast ampholine plate gel (ampholine PAGplate, pH 5.5–8.5, Pharmacia) and thereafter an electrophoresis was carried out within 2.5 h under cooling conditions at 10 °C with constant current of 50 mA and constant voltage of 1,600 V. The ampholine plate gel was then fixed for 30 min with fixing solution containing 0.14 M sulfosalicylic acid, 0.7 M trichloroacetic acid, and 7 M methanol. After fixation, densitometric scanning was undertaken using an image scanner (Model AE-6905C; ATTO Co., Tokyo, Japan) allied with computer software.
Also, 7.5% polyacrylamide gel electrophoresis was carried out simultaneously to detect the oxidized ratio of the constituted chains just after chain separation using p-MB. With respect to chain separation, p-MB (100 mg) was dissolved in 2 mL of 0.1 M NaOH in the presence of 0.1 M NaCl and neutralized with 1 M CH3COOH. Ten microliters of this solution were then mixed with each 100 μL of a series of collected Hb A samples. Chain separation was continued overnight (∼16 h) at 4 °C in 30 mM phosphate buffer (pH 6.0) containing 0.1 M NaCl and 20% (v/v) glycerol. Thereafter, electrophoresis was then carried out for 6 h on a 7.5% polyacrylamide slab gel in Tris-glycine buffer (pH 8.6) at a constant current of 12 mA and constant voltage of 150 V. The buffer contained 25 mM Tris and 192 mM glycine. Fixation and staining were undertaken in 7.5% acetic acid containing 1% Coomassie blue. Densitometry was identical to that described for the ampholine plate gel.
The αSH and βSH chains were prepared by removal of p-MB with 2-mercaptoethanol from the αp-MB and βp-MB chains. According to our specifications as described elsewhere [17], the mixture with 15 mM 2-mercaptoethanol was applied on a CM-cellulose column for isolation of the αSH chains, whereas it was on a DEAE-cellulose column for the βSH chains. Each column was then washed with buffer solution containing 2-mercaptoethanol. Thereafter the mercaptoethanol was removed by washing the column with buffer alone. The buffers used were 10 mM piperazine-N, N′-bis(2-ethanesulfonic acid) (pH 6.5) for the αSH chains and 10 mM HEPES (pH 8.2) for the βSH chains.
Glycerol was unaffected not only with respect to spectrophotometric changes but also with regard to values of kAf and kAs. Similarly, there were no quantitative differences between the resulting isoelectric-focusing profiles in the presence or absence of glycerol, whereas the presence of glycerol had a good effect in preventing hemichrome formation during the time course of the experiment.
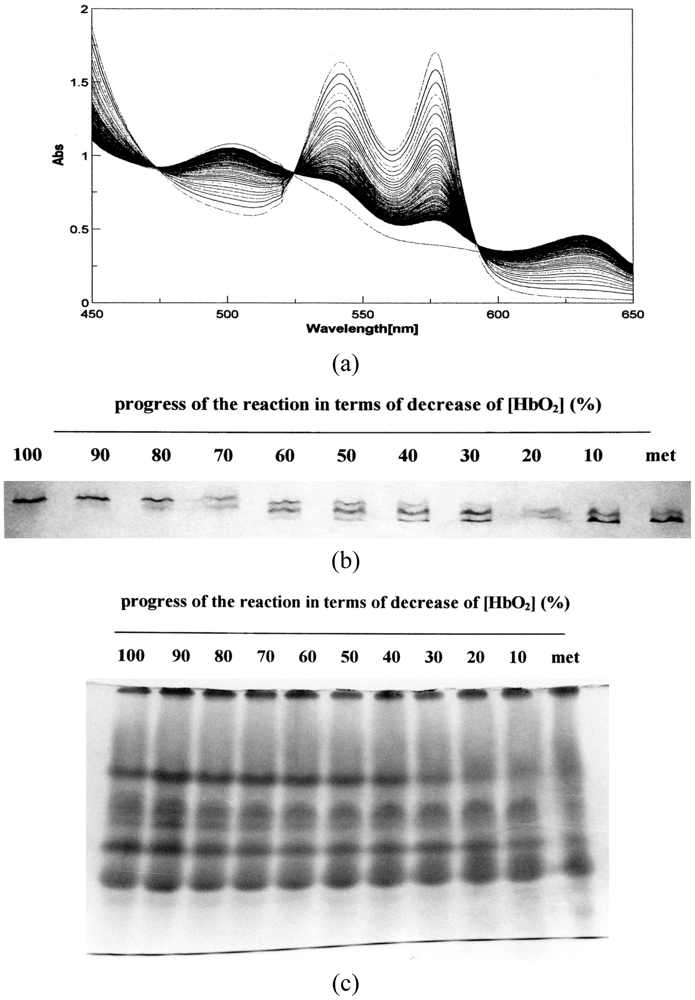
Figure 7 demonstrates UV/VIS spectrophotometric, isoelectric-focusing electrophoretic and polyacrylamide gel electrophoretic measurements in which the reaction proceeded under high HbO2 concentration (1.25 mM in heme content) in 0.05 M phosphate buffer (pH 5.0) at 37 °C in the presence of 20% (v/v) glycerol. Figure 7(a) shows the spectrophotometric changes every 10 min from 450 nm to 650 nm in the monitoring cell. Simultaneously, sample collection was carried out from the sampling cell at 0, 1.2, 2.5, 4.5, 7, 10.5, 16, 25, 42.5, and 76 h. In terms of percentage decrease of HbO2 concentration in the reaction mixture, the sample picked up at time (t) = 0 h corresponded to 100% [HbO2], and that at: t = 1.2 h to 90%; t = 2.5 h to 80%; t = 4.5 h to 70%; t = 7 h to 60%; t = 10.5 h to 50%; t = 16 h to 40%; t = 25 h to 30%; t = 42.5 h to 20%; t = 76 h to 10%. As mentioned above, these were used for valency hybrid analyses (Figure 7(b)) as well as detection of the oxidized ratio of the constituted chains (Figure 7(c)).
Figure 8 describes the densitometric profiles of the ampholine plate gel shown in Figure 7(b). Four components appeared during the entire reaction process. These had satisfactory-to-good consistency with those reported by Tomoda et al. [31-36]. On the basis of the arguments and assignments of Tomoda et al., the first peak must be (α2+ β2+)2, the second can be (α3+β2+)2, the third can be (α2+β3+)2, whereas the fourth must be (α3+β3+)2 as an endpoint. In theory, the following seven species of valency hybrids can be in existence during the entire process: (α2+α2+β3+β2+), (α3+α2+β2+β2+), (α2+β3+)2, (α3+β2+)2, (α2+α3+β2+β3+), (α2+α3+β3+β3+) and (α3+α3+β3+β2+). Among these, however, it was evident that only two valency hybrids, i.e., (α3+β2+)2 and (α2+β3+)2, emerged in the human HbO2 autoxidation as demonstrated by Tomoda et al. [31,32,35,36]. It was also shown that the appearance (or disappearance) of (α3+β2+)2 (the second peak) seemed to be preceded by (α2+β3+)2 (the third peak).
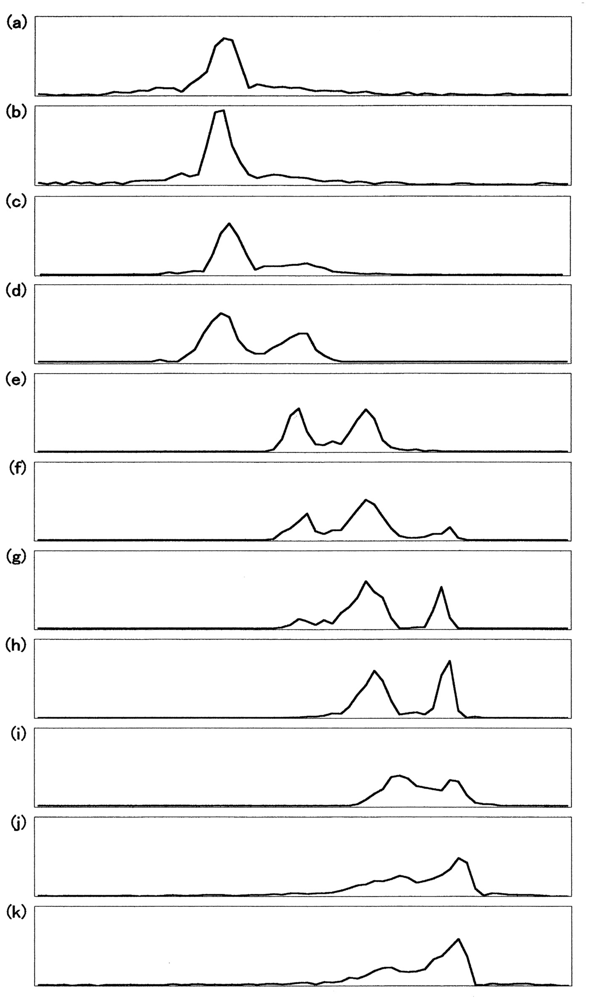
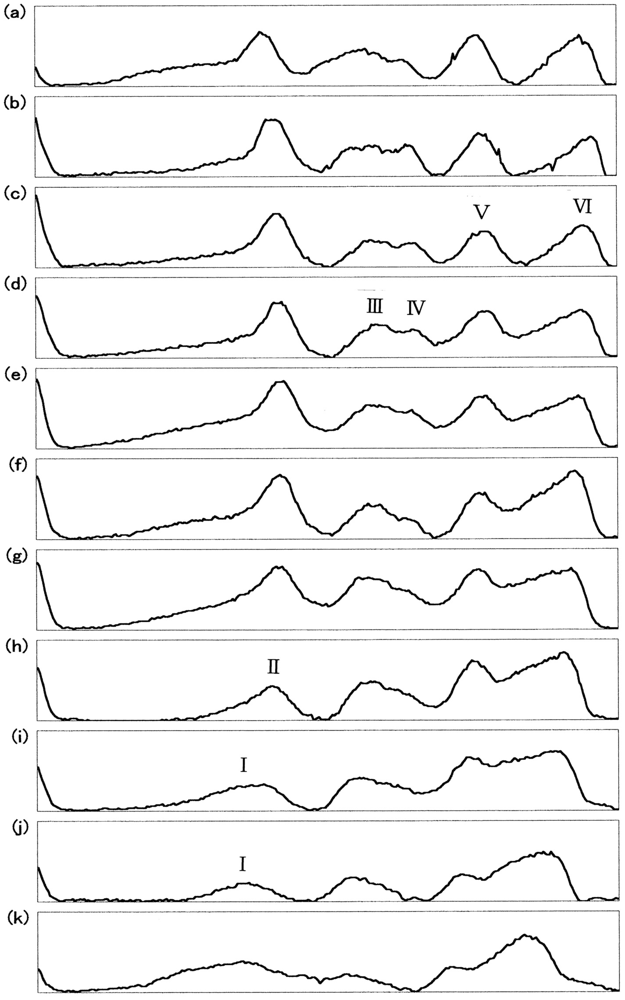
Figure 9 illustrates the densitometric changes of the 7.5% polyacrylamide slab gel (Figure 7(c)) resulting from oxidized ratio analyses of the constituted chains. In contrast to the ampholine plate gel, the obtained electrophoretic migration profiles were complex. Hence, the initial sample (HbO2) and partially (50%) oxidized sample just after the chain separation using p-MB were applied on a 7.5% polyacrylamide slab gel as well as the isolated chains (αSH and βSH) as an endpoint species. These were completely converted to the ferric met form by addition of potassium ferricyanide and thereafter the chain separation procedure was carried out. The resulting densitometric profiles are shown in Figure 10.
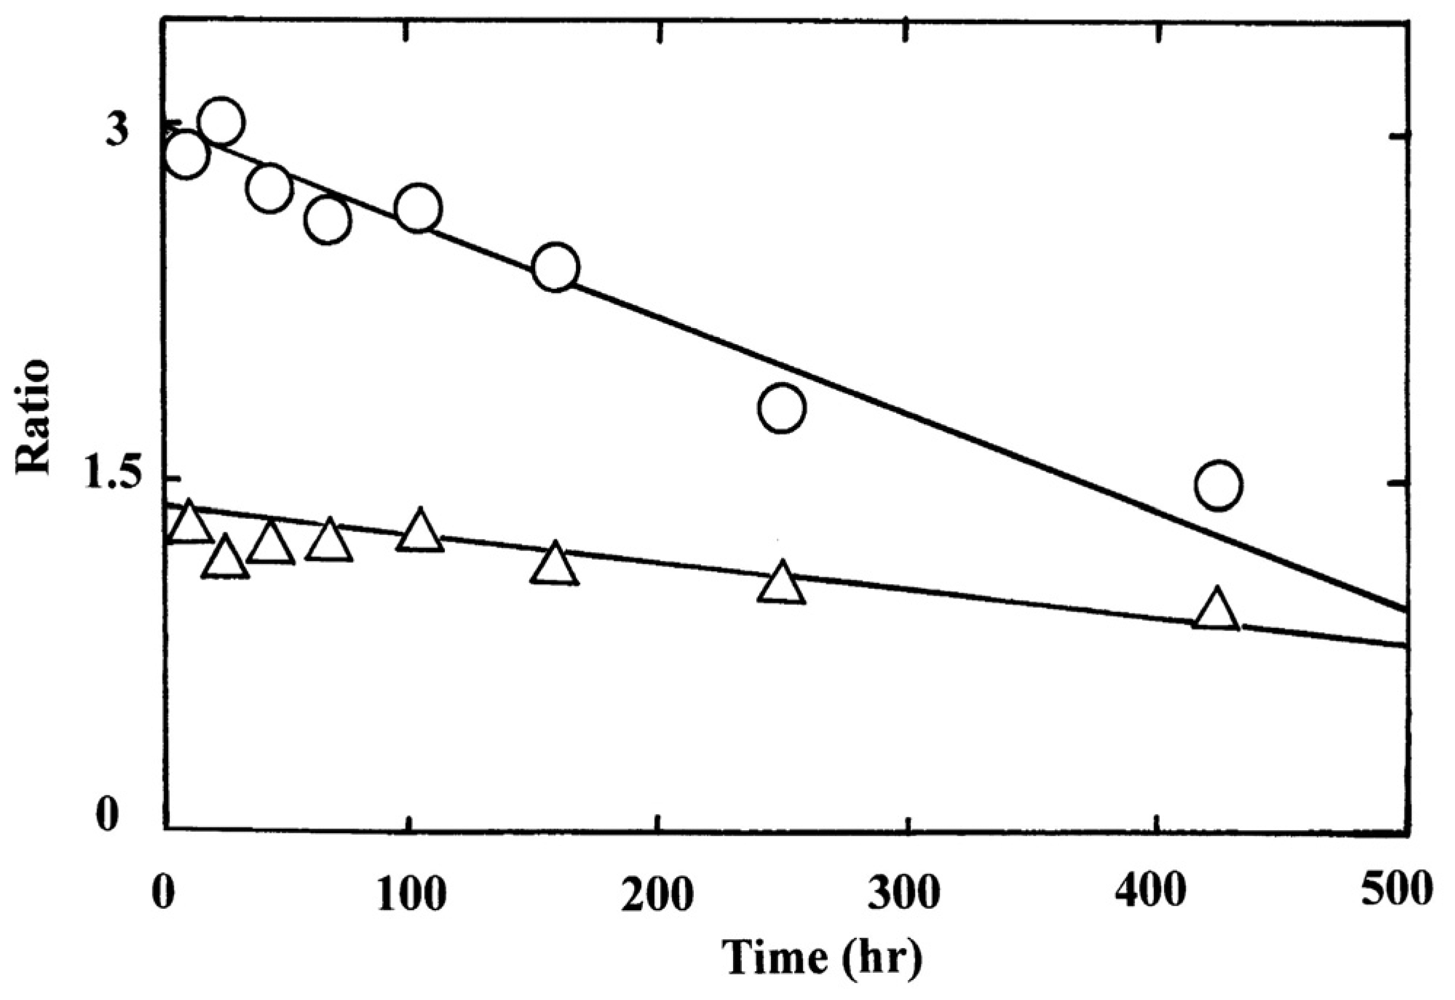
Even under these qualified conditions, the profiles were complex. However, it was shown that two bands reflecting fast mobility could be attributed to the α chain, whereas those with medium mobility seemed to be unreacted Hbs with p-MB. Two bands found to have relatively slower mobility could have originated from the β chain. From this point of view, designation was made in Figures 9 and 10 as follows: I and II originated from the α chains, III and IV were attributed to unreacted Hbs with p-MB, and V and VI derived from the β chains. We could not ascertain which band corresponded to αO2 and αmet or βO2 and βmet. However, we made an attempt by plotting the ratios of II/I and VI/V against time (Figure 11). It was obvious that a decrease in II/I (as a reflection of α-chain oxidation) was much faster than a decrease in VI/V (as a reflection due to β-chain oxidation). On the basis of these findings, the reaction can be written as follows:
6. Mechanistic Details of Autoxidation of Human HbO2: Computer Simulations
To shed light on the mechanistic details of human HbO2 autoxidation, we here propose two tentative models and make a kinetic formulation. Curve fittings were made against the data obtained by UV/VIS spectrophotometric, isoelectric-focusing electrophoretic and polyacrylamide gel electrophoretic measurements. According to our specifications [37] to solve differential equations numerically using the Runge-Kutta method by setting a tentative reaction model, concentration progress curves for species assumed in a given model can be displayed on a personal computer at a given time. The first tentative model can be written as follows:
In this scheme, it is assumed that the reaction can proceed via two valency hybrid intermediates, i.e., (α3+β2+)2 and (α3+β2+)2. According to the differential equations deduced from the reaction model shown below, we formulated possible pathways leading to the oxidation of Hb to metHb via two valency hybrid intermediates and drew up all the concentration progress curves for the species involved in this reaction.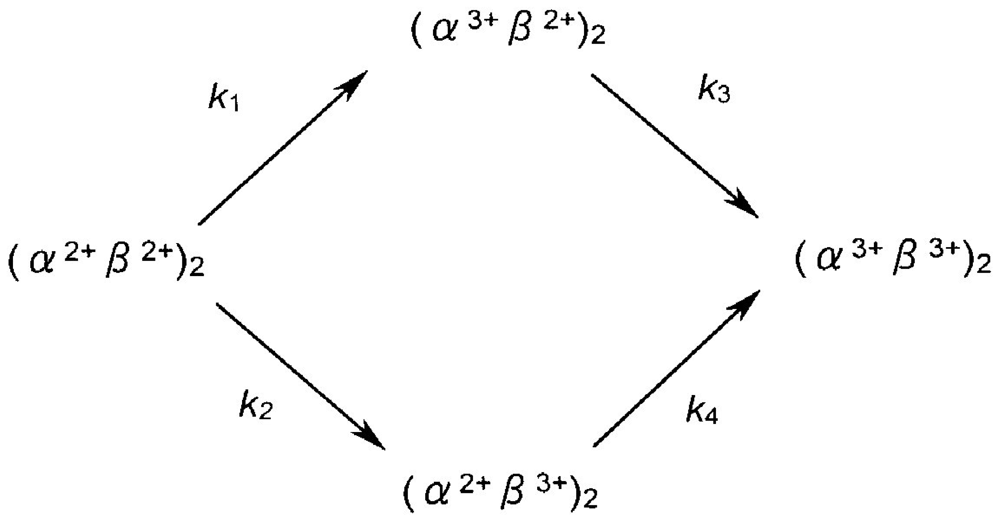
Here the total concentration of Hb (= [(α2+β2+)2]t = 0) is given by the following equation:
The numerical successive approximation was achieved using the Runge-Kutta method by stepping up one-by-one along with the steps shown in the Appendix.
Figure 12(a) illustrates the best-suited fitting for the consecutive changes of the components attained by isoelectric-focusing electrophoresis while setting Δt = 0.1 h. In Figure 12(a), the first (○; [α2+β2+]2), second (△; [α3+β2+]2), third (▲; [α2+β3+]2) and fourth (●; [α3+β3+]2) components were plotted against time in terms of peak area calculated from the diagrams shown in Figure 8. Each solid line was achieved by non-linear least-squares fitting when setting the kinetic constants as follows: k1 = 0.009 (h−1), k2 = 0.002 (h−1), k3 = 0.005 (h−1), and k4 = 0.00008 (h−1). The resulting curve fittings show mutually good consistency for the aspects resulting from the isoelectric-focusing electrophoretic study. However, it was evident that the obtained concentration progress curves derived from this model did not fully explain the aspects of spectrophotometric and polyacrylamide gel electrophoretic profiles. Figure 12(b) shows such an example.
The following second tentative model was thus taken for assessment:
Here kAf and kAs represent the first-order rate constants calculated from the least-squares fittings against −ln([HbO2]t/[HbO2]0) versus time plot that was monitored in 0.05 M phosphate buffer (pH 5.0) at 37 °C in the presence of 20% (v/v) glycerol (Figure 7(a)). By these least-squares fittings, the following kinetic constants and molar fraction of the initial fast component (P) were established: kAf = 0.148 h−1 (t1/2 = 4.7 h), kAs = 0.0208 h−1 (t1/2 = 1.4 d), and P = 0.51. Thus, by setting the values of kAf and kAs at 0.148 h−1 and 0.0208 h−1, respectively, and Δt = 0.1 h, the relevant concentration progress curves were displayed on a personal computer for the possible species assumed in this model. Figure 13 illustrates the outcomes: Figure 13(a) shows aspects of the spectrophotometric changes in terms of the −ln([HbO2]t/[HbO2]0) versus time plot, whereas Figure 13(b,c) describe aspects of the associated isoelectric-focusing electrophoretic profiles (Figure 13(b)) and polyacrylamide gel electrophoretic profiles (Figure 13(c)), respectively. In Figure 13, each computed curve (solid line) showed satisfactory-to-good agreements with the experimental data. These demonstrated that almost all of the reaction aspects could be fully explained by the consecutive changes of the species supposed in this model. Thus, the β chain was seen to carry delayed autoxidation in the tetrameric protein architecture. The rate of the initial rapid phase (kAf) characterized with the HbO2 autoxidation represented the intrinsic α-chain oxidation, whereas the rate of the second slower phase (kAs) reflected the intrinsic β-chain oxidation. These findings led us to conclude that the β chain manifests delayed autoxidation in the human HbO2, which could be much more evident in acidic solutions.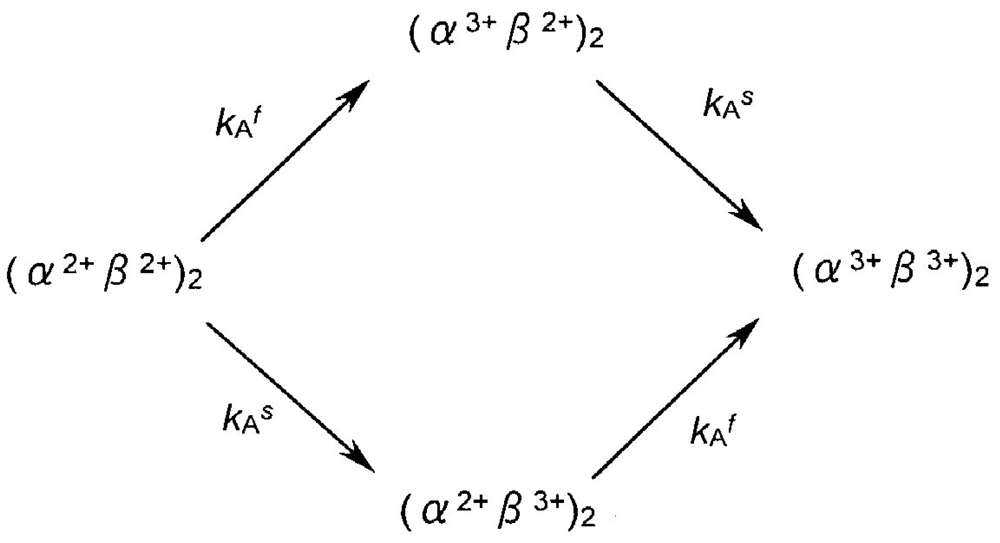
7. Innate Instability of the Hb Molecule, Its Degradation to Hemichrome, and Subsequent Formation of Heinz Bodies in Normal Human Erythrocytes during Mild Heating
In this section, we discuss the results of our previous study investigating the formation of Heinz bodies in normal human erythrocytes [23,24]. Aliquots of freshly drawn venous blood from healthy donors were subjected to mild heating at >37 °C for 30 min to investigate hemichrome formation and subsequent Heinz-body formation in normal human erythrocytes. Heinz bodies were then visualized by exposing blood smears to acetylphenylhydrazine and staining with crystal violet. Changes within the erythrocytes were observed using light microscopy under oil immersion.
Prior to the acetylphenylhydrazine test [38,39], blood samples were subjected to mild heating in vitro. A 2-mL sample was placed in a test tube and incubated in a waterbath maintained at each desired temperature (±0.1 °C) above 37 °C for 30 min using a NESLAB temperature control system (Model RTE-100 or 111 or 210 or 221). In each experimental run, we employed a temperature-untreated reference as a control. The blood sample used as a temperature-untreated reference was kept at a low temperature (0–4 °C) for as long as possible after withdrawal from the donor, and never exposed to temperatures above room temperature.
β-Acetylphenylhydrazine and crystal violet (research grade for pathology) were used (Wako Pure Chemical, Co., Osaka, Japan) for the procedure, as described by Bauer [39]. A 0.1-mL aliquot of blood sample was suspended in 2 mL of acetylphenylhydrazine solution, in which 100 mg of acetylphenylhydrazine and 200 mg of glucose in 100 mL of 0.067 M phosphate buffer were dissolved at pH 7.6. Using a “blowout” pipette, the solution was aerated twice or thrice by drawing it up into the pipette and blowing it out, together with a small quantity of air. This mixture was incubated at 37 °C for 2 h. Aeration was repeated halfway through and immediately after the 2-h incubation. A drop (∼10 μL) of the resulting mixture was placed on a coverslip, which was then inverted onto a microscope slide containing 30 μL of crystal violet solution. The smear was allowed to stand for 20 min in wet preparation at room temperature and subsequently examined under a light microscope (Nikon Model-FXA; Nikon Co., Tokyo, Japan) equipped with a digital camera (Olympus Model-DP-70; Olympus Co., Tokyo, Japan). Photomicrographs were taken under oil immersion at 1,000× magnification. Subsequently, the number of Heinz bodies per cell was counted in 100 red cells per view.
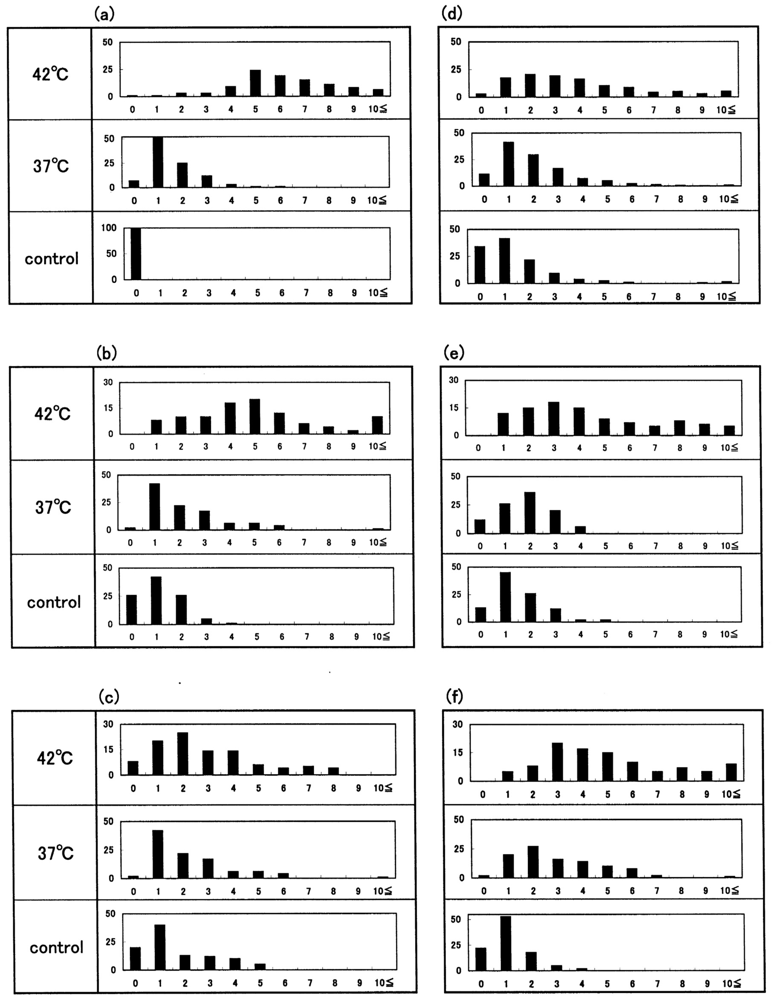
Figure 14 shows representative images of Heinz bodies within normal red corpuscles (obtained from a healthy donor) during mild heating to a given temperature with using a temperature-untreated reference as a control. Heinz bodies were observed in each smear. Some of the changes are shown in Figure 15(a); histograms of samples treated at 37 °C and 42 °C are displayed with a temperature-untreated sample as a reference based on the number of Heinz bodies contained in each of 100 red cells per view. These results confirmed that Heinz-body formation increased with increasing temperature of blood samples at >37 °C. Red cells in blood samples exposed to 48 °C were hemolyzed.
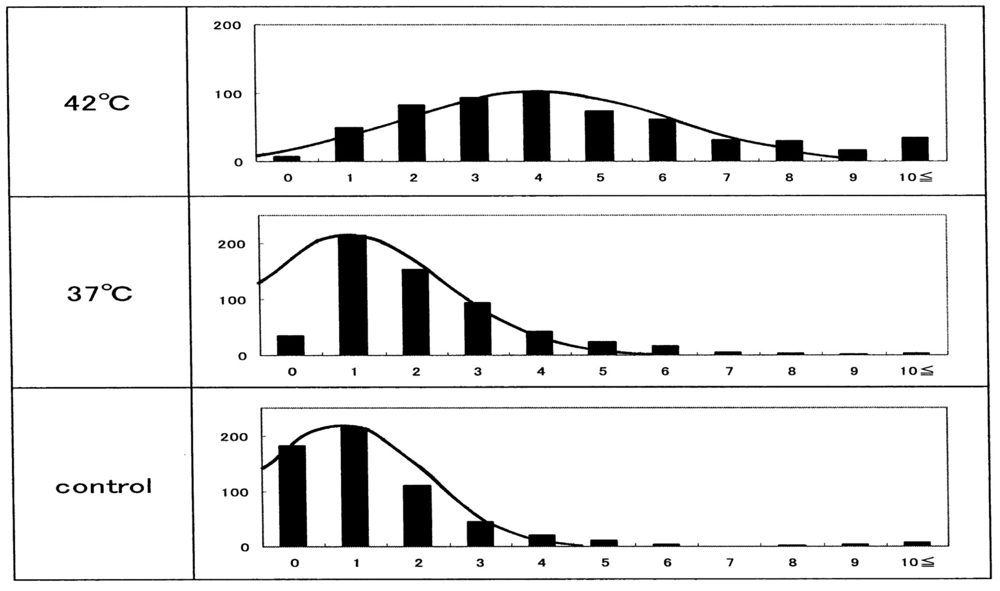
The other histograms shown in Figure 15(b–f) represent the results from another five healthy donors, with a temperature-untreated sample as a reference. Although there was considerable inter-individual variation, temperature-dependent Heinz-body formation was apparent in all preparations. Arithmetic summation was used for all histograms to reduce variability and allow better assessment of temperature-dependent Heinz-body formation. The results of this summation are shown in Figure 16. Solid lines represent the curves derived using the least-squares method using a Gaussian curve. Each computed curve showed satisfactory-to-good agreement with the experimental data over the entire range. The following is a summary of the Gaussian constants resulting from the least-squares fitting: a (peak height) = 101, b (peak width at half of maximum) = 5.0 and c (peak location) = 4.0 for blood samples treated at 42 °C; a = 215, b = 3.5 and c = 1.0 for blood samples treated at 37 °C; and a = 215, b = 3.0 and c = 0.8 for temperature-untreated blood samples.
8. In Vitro Evaluation of Blood Fluidity during Mild Heating Using a Micro-Channel Array Flow Analyzer to Provide an Index of Erythrocyte Deformability
Kikuchi et al. described a tool for measuring the fluidity or rheology of blood [40] in 1992, and this has subsequently been implemented in numerous studies [41-48]. A micro-channel array flow analyzer (MC-FAN) includes a characteristic V-shaped groove array in an integral circuit with 8,736 flow paths (width, 7 μm; length, 30 μm; depth, 4.5 μm) engraved on a 15 × 15 × 0.5-mm single-crystal silicon substrate using an anisotropic etching technique. The array is housed in a cylinder. This equipment makes it possible to not only observe red cells passing through individual micro-channel arrays by use of an inverted metallographic microscope, but also to evaluate blood fluidity through the groove array in terms of the transit time of the blood sample for a given transit sample volume. Flow rate can be determined by timing when the blood sample meniscus crosses graduation marks at 10-μL intervals from 0 μL to 100 μL. The transit sample volume is therefore equivalent to loss of the blood sample within the cylinder. Here we review our in vitro findings on blood fluidity during mild heating using a MC-FAN (type-HR300; Hitachi Haramachi Electronics Co., Ibaraki, Japan) [24].
Donors were male or female student volunteers from the Prefectural University of Hiroshima (Hiroshima, Japan) and were aged 18–22 years. All volunteers were aware of the aims and procedures of the study. They gave their written informed consent to participate. The study protocol was approved by the Ethical Review Board of the Prefectural University of Hiroshima. Nine aliquots of samples of freshly drawn venous blood (10 mL in total) were obtained from healthy donors and mixed with one aliquot of 3.2% sodium citrate (Na3C6H5O7·2H2O) or 3.8% sodium citrate (Na3C6H5O7·5H2O). Blood samples were centrifuged at 400 × g for 10 min at 0–4 °C to eliminate the possibility of interference with blood fluidity measurements caused by platelet aggregation onto micro-channel flow paths. The supernatant (platelet-rich plasma (PRP)) was then discarded using a narrow Teflon-lined capillary connected to a waterjet pump. The remainder (PRP-removed blood) was subjected to mild heating prior to application to the MC-FAN. A 2-mL aliquot was placed in a test tube and incubated in a waterbath maintained at each desired temperature (±0.1 °C) above 37 °C for 30 min using a NESLAB temperature control system (Model RTE-100 or 111 or 210 or 221).
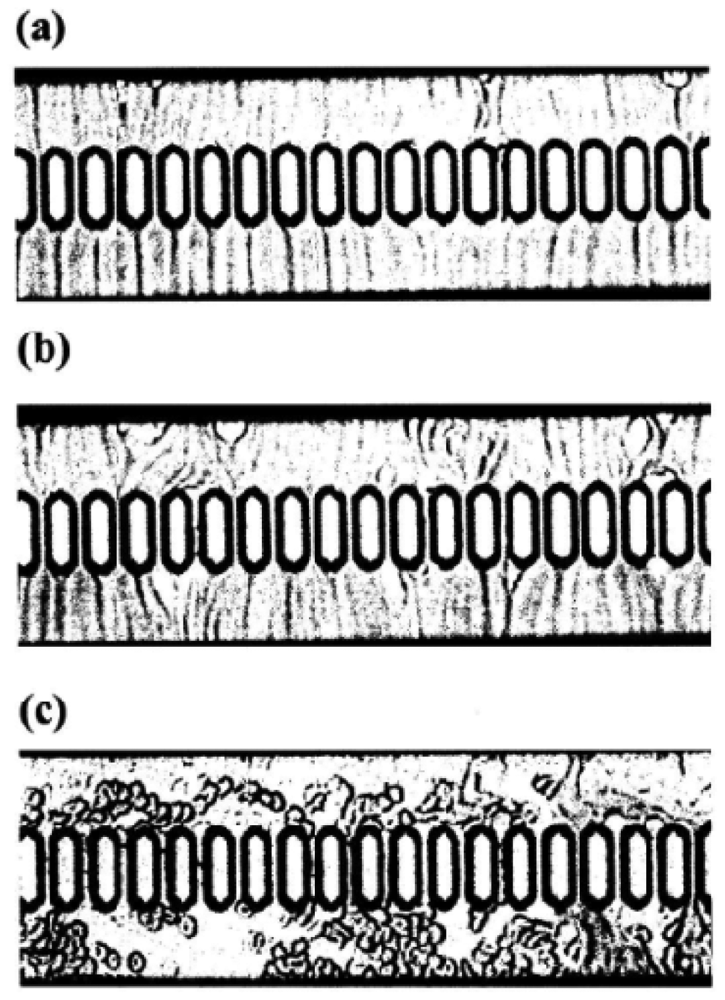
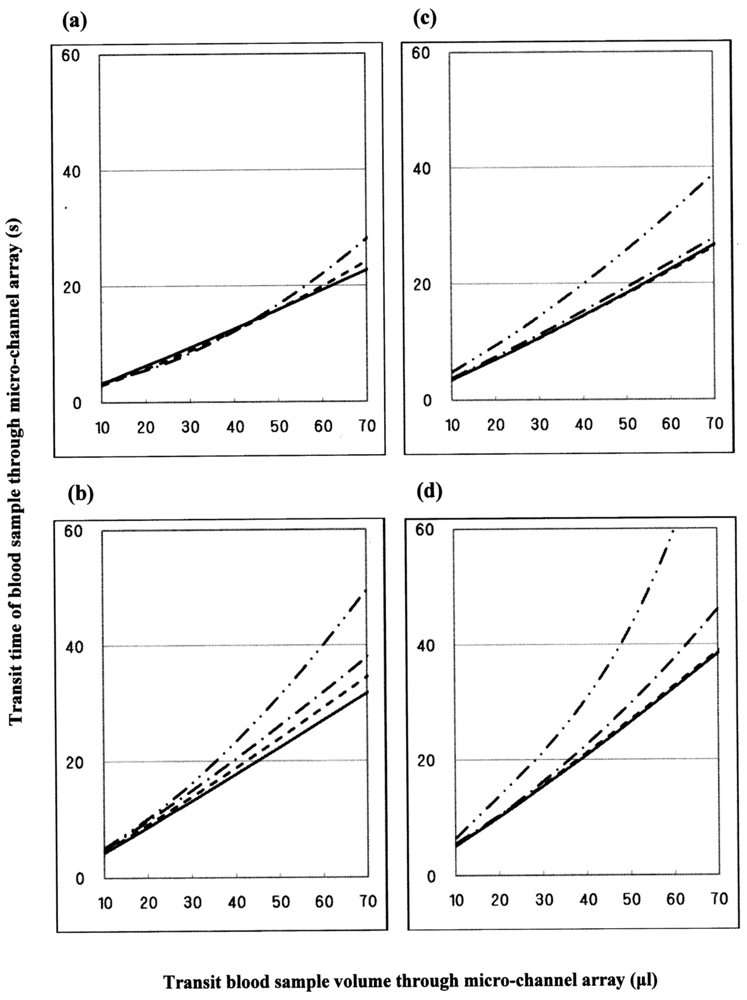
Using a 1-mL disposable syringe and a thin catheter, 200 μL of each temperature-treated blood sample were introduced into a groove array via the cylinder house, which was connected to the inlet hole. The sample was allowed to flow through the cylinder house by applying a pressure difference of 20 cm H2O. Red cells passing through individual micro-channel arrays were monitored using an inverted metallographic microscope, a video camera, and a video-recorder system. As shown in Figure 17(a,b), microscopic images revealed good erythrocyte deformability in temperature-untreated samples subjected to MC-FAN. However, a marked decline in erythrocyte deformability was observed in blood samples treated at temperatures >37 °C for 30 min. An example is shown in Figure 17(c). Temperature-treated samples also demonstrated increased transit time for low transit sample volumes.
Figure 18 illustrates some examples of blood fluidity of temperature-treated samples measured as transit time versus transit sample volume. These graphs show that erythrocyte deformability decreased with increasing temperature at >37 °C, although there was considerable inter-individual variation. Blood was therefore obtained from a further six healthy donors, and temperature-treated samples compared with a temperature-untreated sample as a reference. The results were similar to those in Figure 18. Both sets of results (n = 10) are summarized in Table 2. The temperature-dependent decrease in erythrocyte deformability induced by mild heating was evaluated using the Student's t-test on the total sum of the difference in transit times between a given temperature-treated sample and each temperature-untreated reference, with varying transit sample volumes (20, 40 and 60 μL). Significant differences (p < 0.001) between treated and control samples were evident for all samples treated at 45 °C with transit sample volumes of 20, 40 and 60 μL, and all samples treated at 42 °C with transit sample volumes of 20, 40 and 60 μL. To adequately show the results of Figure 18, significant differences (p < 0.001) of the samples treated at 45 °C (i.e., two-point lines) and 42 °C (i.e., one-point lines) against the control samples (i.e., solid lines) are shown. We therefore concluded that erythrocyte deformability decreased with increasing temperature of blood samples at >37 °C.
9. Discussion
Cellular life is reliant upon rapid and efficient responses to internal and external conditions. The basic molecular events associated with these processes are the structural transitions of the proteins involved. Therefore, a deeper understanding of the structural bases of protein allostery is of paramount importance to characterize these processes [26]. The human Hb molecule (α2β2; alternatively, a dimer of αβ protomers), whose α and β chains contain 141 and 146 amino-acid residues, respectively, hold a special position in this field. This is due to the achievements of Perutz, whose pioneering studies led to the identification of two distinct Hb structures, the T (tense) and the R (relaxed) state, which are associated with the deoxygenated and oxygenated form of the protein, respectively [49-51].
Regarding human HbO2, a representative set of successive O2-binding constants is given in terms of mmHg−1 as follows: K1 = 0.0188, K2 = 0.0566, K3 = 0.407, K4 = 4.28 in 0.1 M buffer (pH 7.4) containing 0.1 M KCl at 25 °C [52]. In this reaction, by comparing their X-ray crystal structures, major differences have been defined between the deoxygenated and oxygenated forms. These include movement of the iron atom into the heme plane with simultaneous change in the orientation of the proximal (F8) His, rotation of the α1β1 dimer relative to the other α2β2 dimer about an axis P by 12–15°, and a translation of one dimer relative to the other along the P axis by ∼1 Å (10−1 nm). These changes are accompanied with sequential breaking of “salt bridges” by C-terminal residues [53-57]. When HbO2 goes from the deoxygenated to the oxygenated quaternary structure, the α1−β2 (and α2−β1) interface undergoes the principal changes associated with the cooperative oxygen binding, so it is named as the “sliding contact” that involves 19 residues, including mainly helices C and H and the FG corner [55,58].
Conversely, negligible changes are found with respect to the crystal structure examined for the α1−β1 (and α2−β2) interface that associates 35 residues including B, G, and H helices as well as the GH corner. As mentioned, understanding of subunit interactions between the four Hb chains (and how these explain cooperative O2 binding) has been the primary focus in Hb research. This has been coupled with a tendency for structural analyses to focus on the changes at the proximal side of the heme and at the α1−β2 (and α2−β1) interface. This is despite the fact that the configuration of the residues lining the distal side of the heme pocket (where molecular O2 binds) are also altered by oxygenation, and are thought to have a role in controlling access of the ligand to the heme pocket [59]. Hence, the possibility of subunit interactions originating from or being transmitted via distal effects has, for the most part, been neglected.
In this overview, we review and summarize the related results and current interpretation of the oxidative behavior of human Hb, emphasizing the correlation between hemichrome emergence and formation of Heinz bodies. Two major subjects discussed and interpreted in terms of the α1−β1 (and α2−β2) interface are the: (i) pH-dependent delayed autoxidation of β (O2) subunits when compared with α (O2) subunits in the tetrameric architecture; (ii) inherent tilting capability of the distal (E7) His residues (i.e., α58His (E7) in the α chain and β63His (E7) in the β chain) to hemichrome formation or Hb degradation.
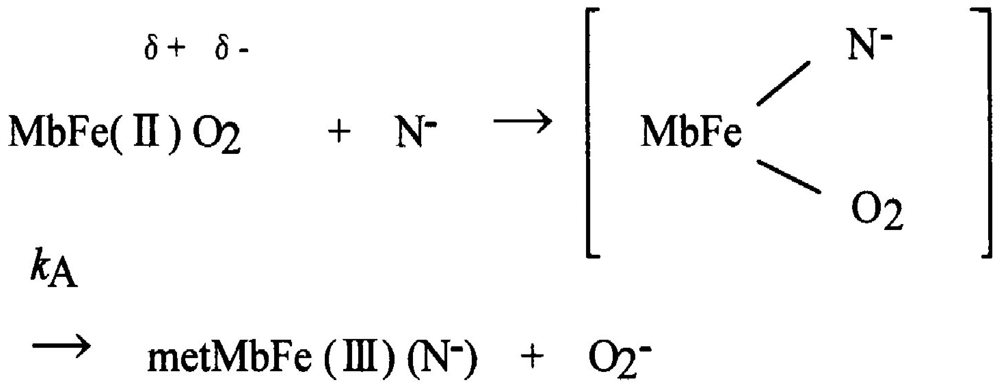
As with autoxidation, it has been customary to deal with the periphery in Hb research, even though autoxidation is inevitable in nature for all O2-binding heme proteins. Shikama [60-64] evaluated various mechanisms proposed for autoxidation involving MbO2 and HbO2. He clearly demonstrated that the autoxidation reaction does not simply involve the dissociative loss of O2− from HbO2, but is instead caused by the nucleophilic displacement of O2− from HbO2 by a water molecule or a hydroxyl ion that enters the heme pocket from the surrounding solvent. The iron is thus converted to the ferric met form, and the water molecule or hydroxyl ion remains bound to Fe(III) at the sixth coordinate position to form the aqua- or hydroxide-met species. A generalized pathway for this SN2 mechanism can be written using Mb (MbO2) as an example:
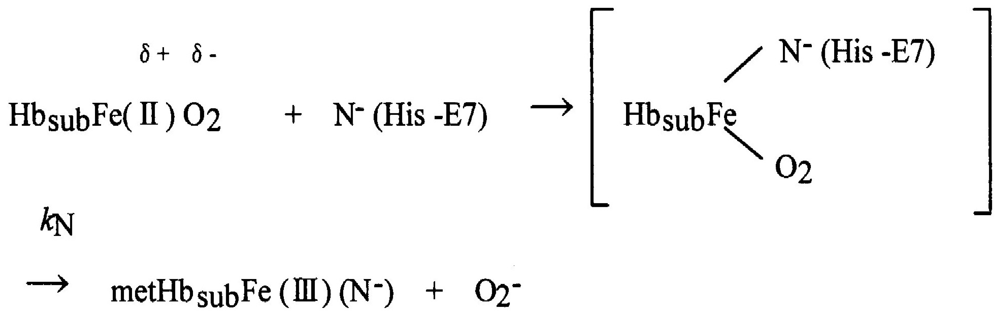
Here kA represents the rate constant of anion-induced autoxidation with nucleophilic anion displacement and N− can be SCN−, F−, OCN−, N3−, or CN− and, in vivo, it can be H2O or OH−. Anion-induced autoxidation with nucleophilic anion displacement of O2 results in an intermediate ferrous heme/anion complex that acts as an electron donor to displace oxygen. Shikama [60,63] also demonstrated that, in vacua, oxyheme is inherently stable and unlikely to dissociate O2− spontaneously. Because O2 is a rather poor one-electron acceptor, a considerable thermodynamic barrier exists for such an electron transfer. In aqueous media (i.e., in contrast to in vacua), oxyheme is always subject to the nucleophilic attack of an entering water molecule (with or without proton catalysis) and to the attack of an entering hydroxide anion. These can cause irreversible oxidation of oxyheme to met-species with generation of O2−. Mb and Hb have therefore evolved with a globin moiety that can protect the Fe(II) O2 center from the easy access of a water molecule, including its conjugate ions OH− and H+. In an aqueous protein-free system, Kao and Wang [65] reported the oxidation of dipyridine-ferrohemochrome by O2 using a stopped-flow technique. The main pathway was interpreted to involve one O2 molecule replacing one of the pyridine molecules in dipyridine-ferrohemochrome to form an oxyheme and then undergoing decomposition to ferrihemochrome and O2−. Unfortunately, the rate constant for this oxidation reaction could not be obtained because the concentration term of pyridine was always involved in its rate equation in a complicated manner. By numerical calculations, however, it follows that oxyheme autoxidation can proceed with a rate constant that is much higher than 1 s−1 in 0.1 M buffer, pH 8.5, at 25 °C (Figure 19). If such an oxyheme is placed in a protein matrix, it would be protected against the nucleophilic attack of the solvent water molecule or hydroxyl ion so as to reduce its autoxidation by a factor of >103. This was the case in our study with denatured MbO2 in 8 M urea (the details of which can be referred to in Sugawara et al. [37]). A globin moiety can act as a “breakwater” in aqueous media even in denatured conditions with 8 M urea. Furthermore, if an oxyheme is embedded in the native Mb architecture, MbO2 acquires remarkable stability against oxyheme autoxidation by a factor of ∼106 (Figure 19). With regard to oxyheme stability in human HbO2, the half-life (t1/2) was only 1.5 d in 0.1 M buffer and at physiological pH and temperature [16] even though the content of metHb in normal red cells in situ [1,2] has been maintained to be ≤1% as a consequence of a NADH-dependent reducing system that can reduce the ferric-metHb resulting from autoxidation to deoxy-ferrous Hb [3-5]. However, as compared with the rates of monomeric mammalian Mbs, human HbO2 seemed to be 2.2–3.6 times more stable against autoxidation (probably due to its tetrameric architecture). Even though the autoxidation rate is a function of pH and temperature, the observed first-order rate constant was 0.0023 h−1 (t1/2 = 12.6 d) for the human HbO2 autoxidation under the conditions of 0.1 M buffer at pH 7.2 and 25 °C in our study [10], because this value was calculated from the first rapid phase. Conversely, the relevant values of the monomeric mammalian Mbs were 0.0082 h−1 (t1/2 = 3.5 d) for human MbO2, 0.0072 h−1 (t1/2 = 4.0 d) for bovine MbO2, and 0.0050 h−1 (t1/2 = 5.8 d) for sperm whale MbO2 under the same conditions of human HbO2. As mentioned above, the tetrameric human HbO2 showed biphasic autoxidation curve in acidic solutions in terms of the −ln([HbO2]t/[HbO2]0) versus time plot; an initial rapid reaction (kAf) could be followed with the slower second phase (kAs). The difference in the rates between kAf and kAs decreased with increasing pH value of solutions, and finally disappeared (i.e., kAf = kAs) if the pH of the solutions was >8. A plot for the obtained values of kAf/kAs versus pH indicated that the reaction involves a single dissociation group of amino-acid residue with pKa = 7.4 (at 37 °C), probably a His residue. In addition, study of rate measurement for the isolated αp-MB and βp-MB chains (and αSH and βSH chains) disclosed that once the constituted chains were isolated from the parent molecule, both separated chains could be oxidized much more rapidly to the ferric met-form over the measured pH range (5–10) when compared with the respective rates (kAf and kAs) of the parent molecules calculated from biphasic autoxidation curves as a reference, and that there could be no practical differences regarding the rate between the isolated individual chains. These findings may mean that the individual chains have acquired considerable resistance to oxyheme autoxidation in their tetrameric protein architecture. It was also suggested that human HbO2 seems to have acquired a pH-sensitive molecular device as a consequence of development of the tetrameric protein architecture. Hence, the molecule shows remarkable stability against oxyheme autoxidation more than in cases of isolated individual chains from the parent molecules and monomeric mammalian Mbs. Moreover, it was evident that only two valency hybrids, i.e., (α3+β2+)2 and (α2+β3+)2, emerged in the tetrameric HbO2 autoxidation even though, in theory, seven species of valency hybrids can be in existence in theory during the reaction time course: (α2+α2+β3+β2+), (α3+α2+β2+β2+), (α2+β3+)2, (α3+β2+)2, (α2+α3+β2+β3+), (α2+α3+β3+β3+) and (α3+α3+β3+β2+). Computer simulations on the basis of spectrophotometric, isoelectric-focusing electrophoretic and polyacrylamide gel electrophoretic measurements indicated that kAf represents intrinsic α-chain oxidation and kAs reflects intrinsic β-chain oxidation. These findings led us to conclude that the β chain manifests delayed autoxidation in human HbO2, which could be much more evident in acidic solutions. Figure 20 shows our proposal with respect to this issue as reported in 1998 [17] and 2002 [18] in which we suggested a new function to the α1−β1 (and α2−β2) interface for stabilizing the HbO2 tetramer against acidic autoxidation. That is, the α1−β1 (and α2−β2) interface produces a conformational constraint in the β chain whereby the distal (E7) His at position 63 is tilted slightly away from the bound O2 so as to prevent the proton-catalyzed displacement of O2 from the Fe(II)O2 center by entrance of a water molecule. The β chain thus acquires a remarkably delayed oxidation rate in the HbO2 tetramer, and this is the origin of the chain heterogeneity seen in acidic solutions of HbO2 autoxidation. In fact, the most recent refinement of the crystallographic structure of human HbO2 (where the O2 molecule is clearly visible in the high-resolution electron density maps) not only demonstrated that the hydrogen bond made by His E7p (i.e., β63His) is much weaker than that made by His E7a (i.e., α58His), but also substantiated that the geometry of the ligand and distal histidine is slightly different in the two subunits, with the O2 atom lying 2.7 ± 0.1 Å (10−1 nm) from the Nε atom of the distal histidine in the α subunits, and 3.0 Å away in the β subunits [66]. However, it is an unavoidable fact that negligible changes are found for the α1−β1 (and α2−β2) interface with respect to examination of the crystal structure. Similar phenomena suggesting participation of the α1−β1 (and α2−β2) interface (i.e., participation of the inherent tilting capability of the distal (E7) His residues of the Hb molecule) garnered our interest. As shown in Figures 5 and 6, our UV/VIS spectroscopic study suggested that human HbO2 was highly susceptible to hemichrome formation even under physiological pH and temperature and, once isolated from the tetrameric parent molecule, the α (αp-MB) and β (βp-MB) chains showed much higher susceptibilities to hemichrome when compared with the parent molecule. Heinz bodies are intra-erythrocytic inclusions of hemichrome formed as a result of Hb oxidation. They have been detected and characterized in drug-induced hemolytic anemia, defects in the intra-erythrocytic reducing system (e.g., G-6-PD deficiency) and in unstable Hb disease [21,22]. Using unstable Hb disease as an example, quite a large number of unstable Hbs have been reported. Regarding the molecular pathogenesis of unstable Hbs, it is known that the instability of labile Hb variants in patients can be attributed to amino-acid substitutions (or deletions), which disrupt and perturb the Hb structure via interference with α-helix formation, disruption of heme binding, or altered α1−β1 (and α2−β2) or α1−β2 (and α2−β1) contacts [21]. The consequent changes in circulating red cells in patients with unstable Hb disease include: an inherent tendency towards irreversible denaturation of Hb or globin due to a defect in the amino-acid composition of labile Hb molecules; a continuous tendency toward hemichrome formation; precipitation or aggregation of Hb molecules resulting in buildup of the molecules to form Heinz bodies; and hemolysis. Exposure of red cells to acetylphenylhydrazine and subsequent staining with crystal violet also revealed a greater abundance of Heinz bodies within G-6-PD-deficient cells compared with that in normal cells [67,68]. In addition, Sear et al. [69] and Campwala and Desforges [70] reported that Heinz bodies often appeared in normal-aging red cells, and that this age-related appearance of Heinz bodies was particularly pronounced in splenectomized individuals [71]. According to several authors [72-74], aged or damaged red cells affected by drugs may be “filtered off” by the spleen irrespective of whether or not they contain Heinz bodies in a similar manner to the filtering off of red blood cells in patients with unstable Hb caused by unstable Hb hemolytic anemia. Using freshly drawn venous blood from healthy donors, we found that the number of Heinz bodies formed in red cells increased with increasing temperature when blood samples were subjected to mild heating at >37 °C for 30 min [23,24]. Under identical conditions of mild heating, we measured blood fluidity using a MC-FAN [24] because it involves a characteristic V-shaped groove array with micro flow paths (width, 7 μm; length, 30 μm; depth, 4.5 μm) engraved on a single-crystal silicon substrate in an integral circuit. When red cells passing through individual micro-channel arrays were monitored using an inverted metallographic microscope, images revealed good erythrocyte deformability when temperature-untreated samples were subjected to MC-FAN. Conversely, a marked decline in erythrocyte deformability was observed in blood samples treated at temperatures >37 °C for 30 min. Temperature-treated samples also demonstrated an increased transit time for low transit sample volumes. We therefore concluded that erythrocyte deformability decreased with increasing temperature of blood samples at >37 °C. The combination of our experimental findings and in situ observations suggests that instability leading to hemichrome formation is not only a peculiarity of labile Hb variants, but is also an innate characteristic of physiologically normal Hb molecules. In this regard, one must note that monomeric bovine heart MbO2 did not show a propensity for hemichrome formation over a wide range of pH (4.5–10.5) and temperature from physiological to temperatures just before thermal unfolding [20]. In our experiments, the occurrence of hemichrome can be described as follows:
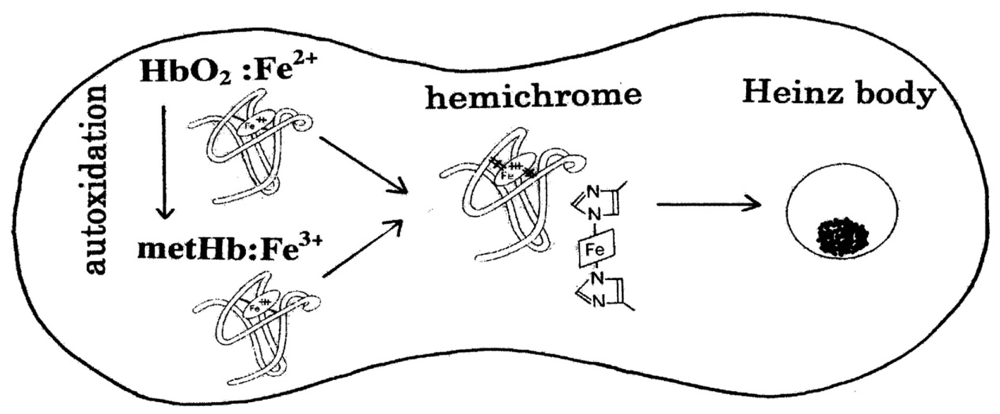
Taking into account the accepted framework of the SN2 mechanism for autoxidation [59-63] and the accepted framework for hemichrome formation [11] in physiologically conditions, hemichrome can form as follows:
In this scheme, Hbsub represents each subunit of the Hb molecule. Nucleophilic displacement of O2− by entry of a water molecule or a hydroxyl ion should be the rate-limiting step, and the subsequent conversion of the met form into hemichrome by a heme ligand (N−) endogenous to the protein must proceed very quickly with the kinetic relationship kN ≫ kA. The most probable candidate for N− in the HbA molecule is the Nε-nitrogen of the distal His (E7) (the only amino-acid side chain in the ligand pocket) of each subunit because Nε-nitrogen is located >4 Å (10−1 nm) from the iron in Hb, and is therefore not expected to coordinate in native Hb [11,75]. The content of metHb in normal erythrocytes [1,2] has been reported to be ≤1% by a NADH-dependent enzyme system [3-5]. This fact poses the question of how erythrocytes can elicit the range of responses to hemichrome with such a small amount of metHb. We suggest that this can be achieved by intramolecular anion-induced nucleophilic displacement of molecular dioxygen via an intermediate ferrous heme/anion complex (a low-spin hemichrome) [20]. Such a reaction would follow the scheme: In this reaction, nucleophilic displacement can be caused within the heme pocket by the Nε-nitrogen of the distal His (E7) instead of nucleophilic incursion of the water molecule or the hydroxyl ion from outside the molecule. As indicated above, hemichrome formation occurs at every stage during the autoxidation reaction of HbO2 (i.e., at the initial, intermediate, and final stages) as a function of the pH and temperature of the solution. While the reaction proceeds along this scheme, hemichromes may be derived not only from HbO2 species, but also from deoxyHb and metHb (Figure 21). Vital hemichromes in erythrocytes in situ might arise from this intramolecular anion-induced nucleophilic displacement of O2 via an intermediate ferrous heme/anion complex. Our electron paramagnetic resonance (EPR) measurement study [17] showed a low-spin spectrum for the resulting oxidation products of isolated β chains with values of g1 = 2.77, g2 = 2.27, and g3 = 1.68, in addition to the usual aquo-met species with g values of 5.86 and 1.99 under a magnetic field of 0–500 mT at 8.0 K in 10 mM maleate buffer (pH 6.2) and in the presence of 50% (v/v) glycerol. According to Rifkind et al. [11], such low-spin complexes characterized by the highest g values in the range 2.83–2.75 and the lowest g values in the range 1.69–1.63 have been designated as “complex B”, indicating the crystal field parameters of the reversible hemichrome (i.e., a water-retained bis-histidine complex). The molar fraction of the hemichrome (complex B) in the oxidized β chains was estimated to be 85% at pH 6.2 because a low-spin species was in equilibrium with a high-spin species corresponding to the usual aquo-met species. Interestingly, recent crystallographic and EPR spectroscopic studies concerning tetrameric Hbs isolated from the Antarctic fish species Trematomus bernacchii, Trematomus newnesi, and Gymnodraco acuticep show that endogenous coordination at the sixth coordination site of the heme iron could be the bis-histidyl adducts in the ferric state in the solid and solution state [26,76-78]. In Antarctic fish, isolated Hbs are readily oxidized at room temperature to a partial hemichrome state in which only the iron of the β chain is bonded to the distal His. Such bis-histidyl coordination was also discovered in the crystals of horse metHb exposed to acidic pH (where the proximal His [His87(F8)α] and a water molecule are the axial heme ligands) to the hemichrome (bis-histidine) form (in which the proximal His and the distal His [His58(E7)α] are the axial heme ligands) [79]. In the case of horse metHb, the bis-histidyl coordination was seen in α chains, and not in β chains. These crystal structures suggest a different binding state of α and β chains as well as a different pathway to hemichrome. As described above, the α1−β1 (and α2−β2) interface seemed to have dual faces. One is for stabilizing the HbO2 tetramer against the acidic autoxidation and the other is for controlling the fate (removal) of its own erythrocyte from the blood circulation. The α1−β1 (and α2−β2) interface produces a conformational constraint in the constructed chains of the Hb molecule via tilting of the distal (E7) His residues, i.e., α58His (E7) in the α chain and β63His (E7) in the β chain. It was also shown that the α1−β1 (and α2−β2) interface appears to have a pH-sensor and a temperature-sensor. By virtue of these endowments, it seemed that Hb molecules can accomplish their roles not only as particularly suitable O2 carriers between the lungs and tissues but also as equipped “molecular sensors” within the erythrocyte to control the fate (removal) of their own erythrocytes from the blood circulation depending on internal and extraneous circumstances, including pH and temperature (Figure 21). Regarding the latter issue, normal erythrocytes develop Heinz bodies late in their lifespan. A wide variety of biochemical changes have been reported to accompany the aging of red cells [80]. These include carboxymethylation of proteins, activation of proteases, glycosylation of proteins, loss of membrane area, decline in changes in the ratio of bands 4.1a to 4.1b, increases in oxidized lipids and proteins, changes in the rheology and fragility of cells, changes in the exposure of cell-surface sugars, and gradual accumulation of Ca2+ Low [81] demonstrated that band-3 clustering might warrant closer scrutiny as a possible transducer of distress signals from the cytoplasm to the external surface of the cell because it can be caused by hemichrome binding, ATP depletion, malondialdehyde formation, Ca2+ accumulation, oxidative crosslinking, or weakening of the skeletal membrane. It is known that hemichromes formed within erythrocytes bind to the cytoplasmic portion of band 3 in the membrane, then rapidly copolymerize with the soluble cytoplasmic domain of membrane band 3, forming an insoluble copolymer, followed by other changes involved in the pathogenesis of red-cell destruction [82-86]. The dominant role of band-3 clustering suggests that hemichrome formation-induced band-3 clustering could also provide a key to the control of the fate of senescent and damaged red cells in the blood circulation. Figure 21 also shed light on some clinical aspects of hemoglobinopathies and hemolytic anemia and its associated acute blood loss. Quite a large number of unstable Hbs have been reported [21,22]. Among these, many of the mutants which occur at the α1−β2 (and α2−β1) interface have altered oxygen affinity, but the bulk of evidence suggests that the α1−β1 (and α2−β2) interface is much more important in maintaining the molecular stability of Hb than the α1−β2 (and α2−β1) interface. Hemolytic anemia results from substitutions affecting the α1−β1 (and α2−β2) interface or the heme pocket. If such mutations occur, the heme iron will be more readily oxidized, and a sequence of events leads to hemichrome formation and subsequent Heinz-body clustering in red cells that causes hemolytic anemia. Typical examples of such variants are shown in Table 3. Surprisingly, almost all of these pathological mutations are found on the β chain, especially in the α1−β1 (and α2−β2) contact region. The situation in patients with G-6-PD deficiency [21,22] can also serve as an example. Red cells are known to be vulnerable to injury by endogenous and exogenous oxidants. Oxidants can be inactivated by reduced glutathione in erythrocytes with normal G-6-PD activity because the pentose phosphate shunt supplies NADPH (which is required for glutathione recycling). In G-6-PD-deficient erythrocytes, however, the reduced glutathione cannot be restored, and the cells sustain irreversible oxidative damage. However, G-6-PD deficiency produces symptoms only if the patient is exposed to an environmental factor that results in increased oxidative stress, including drugs such as antimalarials (e.g., primaquine, pamaquine, dapsone), sulfonamides, nitrofurantoin and phenacetin. The resulting crisis can lead to hemolysis of up to 25–30% of red cells within hours. However, the crisis is self-limited, and only the older population of red blood cells is destroyed. The mechanisms responsible for such an acute hemolytic crisis in patients taking these drugs cannot be explained on the basis of conventional views. However, Figure 21 suggests that this crisis could be triggered by fluctuations in endogenous and exogenous oxidative stress under the fragile pentose phosphate shunt. Malaria provides another example. This is a protozoal disease transmitted by the bite of female Anopheles mosquitoes (Plasmodium falciparum, P. malariae, P. vivax, and P. ovale). Blackwater fever syndrome is caused by infection with P. falciparum, and is characterized by repeated bouts of chills and fevers, severe intravascular hemolysis and anemia, jaundice, hemoglobinuria (black urine) and splenic enlargement [87-89]. Patients often develop fevers >40 °C. A feature of this disease is that symptoms can be exacerbated in patients with G-6-PD deficiency as a result of taking quinine. In these patients, massive destruction of red cells infected by the parasite occurs, but similar numbers of normal erythrocytes are also ruptured, resulting in characteristic hemoglobinuria. The reason for the massive hemolysis of non-infected red cells is unclear. However, the possibility of a relationship between quinine ingestion and the associated massive hemolysis, as well as the relevance of G-6-PD deficiency, is addressed in Figure 21. Fever >40 °C, endogenous G-6-PD deficiency, and exogenous quinine ingestion represent conditions that induce acute hemolysis, thereby leading to massive blood loss and hemoglobinuria.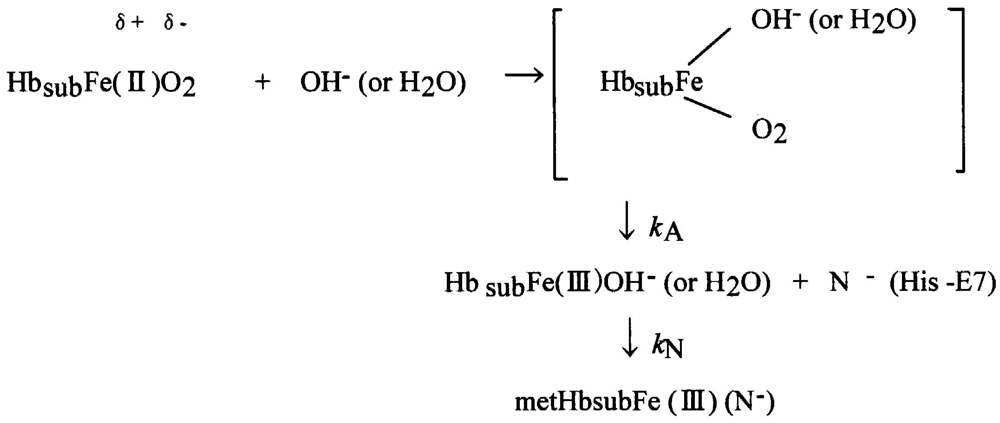
10. Conclusions
In the Hb molecule (α2β2), there are two types of αβ interface (i.e., the α1β1 [and α2β2] and the α1β2 [and α2β1]). In this overview, we made an attempt to assign new functions to the former contact. In contrast to the latter sliding contact that is known to associate with cooperative O2 binding, and to exhibit principal roles when the Hb molecule goes from its deoxygenated form to oxygenated form, the α1−β1 (and α2−β2) interface seemed to have dual roles: one for stabilizing the HbO2 tetramer against acidic autoxidation; the other for controlling the fate (removal) of its own erythrocyte from the blood circulation. The α1−β1 interface produces a conformational constraint in the constructed chains of the molecule via tilting of the distal (E7) His residues, i.e., α58His (E7) in the α chain and β63His (E7) in the β chain. In the latter role, it was shown that the α1−β1 (and α2−β2) interface may exert delicate control of the tilting capability of the distal (E7) His residues to lead to degradation of the Hb molecule to hemichrome, and subsequent Heinz-body clustering within the erythrocyte. In the spleen (which is responsible for the removal of aged and damaged red cells from the blood circulation), rigid intra-erythrocytic hemichrome inclusions (Heinz bodies) are known to act as “sticking points”, hence Heinz body-containing red cells become trapped and undergo hemolysis. The Hb molecule seems to differentiate between the two types of function responsible for the α1−β1 (and α2−β2) interface. By virtue of these endowments, it was demonstrated that Hb molecules accomplish their roles not only as particularly suitable O2 carriers between the lungs and tissues, but also as equipped molecular sensors within erythrocytes to control the fate of the own erythrocytes from the blood circulation depending on internal and extraneous circumstances, including pH and temperature.


| pH | P | kAf (h−1) | kAs (h−1) | kAs/kAf |
|---|---|---|---|---|
| 5.3 | 0.47 | 0.438 | 0.078 | 0.178 |
| 5.9 | 0.48 | 0.270 | 0.030 | 0.111 |
| 6.2 | 0.48 | 0.134 | 0.0154 | 0.115 |
| 6.55 | 0.49 | 0.070 | 0.010 | 0.142 |
| 6.9 | 0.53 | 0.0465 | 0.0073 | 0.157 |
| 9.15 | 0.50 | 0.0095 | 0.0095 | 1.0 |
| 9.5 | 0.50 | 0.0184 | 0.0184 | 1.0 |
| 9.7 | 0.50 | 0.0381 | 0.0381 | 1.0 |
| 10.2 | 0.50 | 0.080 | 0.080 | 1.0 |
| 10.4 | 0.50 | 0.157 | 0.157 | 1.0 |
| The mean ± standard deviation of transit time of blood samples (s) for a given transit sample volume (μL) | |||
|---|---|---|---|
| Transit blood sample volume (μL) | |||
| 20 μL | 40 μL | 60 μL | |
| Temperature-untreated reference | 8.0 ± 1.08 | 16.3 ± 2.24 | 25.1 ± 3.50 |
| Temperature-treated at 37 °C | 7.8 ± 1.35 | 16.4 ± 2.57 | 26.4 ± 3.42 |
| Temperature-treated at 42 °C | 8.5 ± 1.38 ** | 18.3 ± 2.94 ** | 36.3 ± 6.32 ** |
| Temperature-treated at 45 °C | 9.3 ± 2.46 ** | 21.2 ± 5.99 ** | 41.8 ± 13.23 ** |
|
Appendix
The numerical successive approximation corresponding to Equations (8–11) as described in the section “Mechanistic Details of Autoxidation of Human HbO2 A: Computer Simulations” was achieved using the Runge–Kutta method by proceeding one-by-one along with the following steps:
Step 1:
Step 2:
Step 3:
Step 4:
Step 5:
References
- Paul, W.D.; Kemp, C.R. Methemoglobin: A normal constituent of blood. Proc. Soc. Exp. Biol. Med. 1944, 56, 55–56. [Google Scholar]
- Bodansky, O. Methemoglobinemia and methemoglobin-producing compounds. Pharmacol. Rev. 1951, 3, 144–196. [Google Scholar]
- Scott, E.M.; Duncan, I.W.; Ekstrand, V. The reduced pyridine nucleotide dehydrogenases of human erythrocytes. J. Biol. Chem. 1965, 240, 481–485. [Google Scholar]
- Hultquist, D.E.; Passon, P.G. Catalysis of methemoglobin reduction by erythrocyte cytochrome b5 and cytochrome b5 reductase. Nature 1971, 229, 252–254. [Google Scholar]
- Sugita, Y.; Nomura, S.; Yoneyama, Y. Purification of reduced pyridine nucleotide dehydrogenase from human erythrocytes and methemoglobin reduction by the enzyme. J. Biol. Chem. 1971, 246, 6072–6078. [Google Scholar]
- Rachmilewitz, E.A.; Peisach, J.; Bradley, T.B.; Blumberg, W.E. Role of haemichromes in the formation of inclusion bodies in haemoglobin H disease. Nature 1969, 222, 248–250. [Google Scholar]
- Rachmilewitz, E.A.; Peisach, J.; Blumberg, W.E. Studies on the stability of oxyhemoglobin A and its constituent chains and their derivatives. J. Biol. Chem. 1971, 246, 3356–3366. [Google Scholar]
- Rachmilewitz, E.A. Denaturation of the normal and abnormal hemoglobin molecule. Semin. Hematol. 1974, 11, 441–462. [Google Scholar]
- Winterboun, C.C.; Carrell, R.W. Studies of hemoglobin denaturation and Heinz body formation in the unstable hemoglobin. J. Clin. Invest. 1974, 54, 678–689. [Google Scholar]
- Macdonald, V.W. Measuring relative rates of hemoglobin oxidation and denaturation. Methods Enzymol. 1994, 231, 480–490. [Google Scholar]
- Rifkind, J.M.; Abugo, O.; Levy, A.; Heim, J. Detection, formation, and relevance of hemichromes and hemochromes. Methods Enzymol. 1994, 231, 449–480. [Google Scholar]
- Brooks, J. The oxidation of haemoglobin to methaemoglobin by oxygen. Proc. Roy. Soc. London Ser. B 1931, 109, 35–50. [Google Scholar]
- Brooks, J. The oxidation of haemoglobin to methaemoglobin by oxygen II—The relation between the rate of oxidation and the partial pressure of oxygen. Proc. Roy. Soc. London Ser. B 1935, 118, 560–570. [Google Scholar]
- Mansouri, A.; Winterhalter, K.H. Nonequivalence of chains in hemoglobin oxidation. Biochemistry 1973, 12, 4946–4949. [Google Scholar]
- Tomoda, A.; Yoneyama, Y.; Tsuji, A. Changes in intermediate haemoglobins during autoxidation of haemoglobin. Biochem. J. 1981, 195, 485–492. [Google Scholar]
- Sugawara, Y.; Sakoda, M.; Shibata, N.; Sakamoto, H. Autoxidation of human hemoglobin: Kinetic analysis of the pH-profile. Jpn. J. Phys. 1993, 43, 21–34. [Google Scholar]
- Tsuruga, M.; Matsuoka, A.; Hachimori, A.; Sugawara, Y.; Shikama, K. The molecular mechanism of autoxidation for human oxyhemoglobin: Tilting of the distal histidine causes nonequivalent oxidation in the β chain. J. Biol. Chem. 1998, 273, 8607–8615. [Google Scholar]
- Yasuda, J.-P.; Ichikawa, T.; Tsuruga, M.; Matuoka, A.; Sugawara, Y.; Shikama, K. The α1β1 contact of human hemoglobin plays a key role in stabilizing the bound dioxygen: Further evidence from the iron valency hybrids. Eur. J. Biochem. 2002, 269, 202–211. [Google Scholar]
- Brunori, M.; Falcioni, G.; Fioretti, E.; Giardina, B.; Rotilio, G. Formation of superoxide in the autoxidation of the isolated α and β chains of human hemoglobin and its involvement in hemichrome precipitation. Eur. J. Biochem. 1975, 53, 99–104. [Google Scholar]
- Sugawara, Y.; Kadono, E.; Suzuki, A.; Yukuta, Y.; Shibasaki, Y.; Nishimura, N.; Kameyama, Y.; Hirota, M.; Ishida, C.; Higuchi, N.; Haramoto, K.; Sakai, Y.; Soda, H. Hemichrome formation observed in human haemoglobin A under various buffer conditions. Acta. Physiol. Scand. 2003, 179, 49–59. [Google Scholar]
- Winslow, R.M.; Anderson, W.F. The Hemoglobinopathies. In The Metabolic Basis of Inherited Disease; Stanbury, J.B., Wyngaarden, J.B., Fredricks, D.S., Eds.; McGraw-Hill Book Company: New York, NY, USA, 1978; pp. 1465–1507. [Google Scholar]
- Weatherall, D.J.; Clegg, J.B.; Higgs, D.R.; Wood, W.G. The Hemoglobinopathies. In The Metabolic and Molecular Basis of Inherited Disease; Scriver, C.R., Beaudet, A.L., William, S.S., Valle, D., Eds.; McGraw-Hill Inc.: New York, NY, USA, 1995; Volume III, pp. 3413–3484. [Google Scholar]
- Sugawara, Y.; Abe, Y.; Ohgushi, I.; Ueno, E.; Shimamoto, F. Roles of innate instability characteristic of hemoglobin molecule to hemichrome and subsequent Heinz body formation within normal human erythrocytes. Res. Rev. Biosci. 2009, 3, 204–215. [Google Scholar]
- Sugawara, Y.; Hayashi, Y.; Shigemasa, Y.; Abe, Y.; Ohgushi, I.; Ueno, E.; Shimamoto, F. Molecular biosensing mechanisms in the spleen for the removal of aged and damaged red cells from the blood circulation. Sensors 2010, 3, 7099–7121. [Google Scholar]
- Jacob, H.S. Mechanisms of Heinz body formation and attachment red cell membrane. Semin. Hematol. 1970, 7, 341–353. [Google Scholar]
- Vitagliano, L.; Vergara, A.; Bonomi, G.; Merlino, A.; Verde, C.; Prisco, G.D.; Howes, B.D.; Smulevich, G.; Mazzarella, L. Spectroscopic and crystallographic characterization of a tetrameric hemoglobin oxidation reveals structural features of the functional intermediate relaxed/tense state. J. Am. Chem. Soc. 2008, 130, 10527–10535. [Google Scholar]
- Hermans, J., Jr.; Rialdi, G. Heat of ionization and denaturation of sperm-whale myoglobin determined with a microcalorimeter. Biochemistry 1965, 4, 1277–1281. [Google Scholar]
- Fasman, G.D. Physical and chemical data. In Handbook of Biochemistry and Molecular Biology, 3rd ed.; CRC Press: Cleveland, OH, USA, 1976; p. 220. [Google Scholar]
- McDonald, M.J.; Turci, S.M.; Mrabet, N.T.; Himelstein, B.P.; Bunn, H.F. The kinetics of assembly of normal and variant human oxyhemoglobin. J. Biol. Chem. 1987, 262, 5951–5956. [Google Scholar]
- Tomoda, A.; Sugimoto, K.; Suhara, M.; Takeshita, M.; Yoneyama, Y. Haemichrome formation from haemoglobin subunits by hydrogen peroxide. Biochem. J. 1978, 171, 329–335. [Google Scholar]
- Tomoda, A.; Takeshita, M.; Yoneyama, Y. Characterization of intermediate hemoglobin produced during methemoglobin reduction by ascorbic acid. J. Biol. Chem. 1978, 253, 7415–7419. [Google Scholar]
- Tomoda, A.; Tsuji, A.; Matsukawa, S.; Takeshita, M.; Yoneyama, Y. Mechanism of methemoglobin reduction by ascorbic acid under anaerobic conditions. J. Biol. Chem. 1978, 253, 7420–7423. [Google Scholar]
- Tomoda, A.; Yubisui, T.; Tsuji, A.; Yoneyama, Y. Kinetic studies on methemoglobin reduction by human red cell NADH cytochrome b5 reductase. J. Biol. Chem. 1979, 254, 3119–3123. [Google Scholar]
- Tomoda, A.; Yubisui, T.; Tsuji, A.; Yoneyama, Y. Analysis of met-form haemoglobin in human erythrocytes of normal adults and of a patient with hereditary methaemoglobinaemia due to deficiency of NADH-cytochrome b5 reductase. Biochem. J. 1979, 181, 505–507. [Google Scholar]
- Tomoda, A.; Tsuji, A.; Yoneyama, Y. Mechanism of hemoglobin oxidation by ferricytochrome c under aerobic and anaerobic conditions. J. Biol. Chem. 1980, 255, 7978–7983. [Google Scholar]
- Tomoda, A.; Ida, M.; Tsuji, A.; Yoneyama, Y. Mechanism of methemoglobin reduction by human erythrocytes. Biochem. J. 1980, 188, 535–540. [Google Scholar]
- Sugawara, Y.; Matsuoka, A.; Kaino, A.; Shikama, K. Roles of globin moiety in the autoxidation reaction of oxymyoglobin: Effect of 8 M urea. Biophys. J. 1995, 69, 583–592. [Google Scholar]
- Demetriou, J.A.; Drewes, P.A.; Gin, J.B. Enzymes. In Clinical Chemistry, 2nd ed.; Henry, R.J., Cannon, D.C., Winkelmann, J.W., Eds.; Harper & Row Publishers: New York, NY, USA, 1974; pp. 815–1001. [Google Scholar]
- Bauer, J.D. Laboratory investigation of hemoglobin. In Gradwohl's Clinical Laboratory Methods and Diagnosis; Sonnenwirtyh, A.C., Jarett, L., Eds.; The C V Mosby Company: ST Louis, MO, USA, 1980; pp. 809–901. [Google Scholar]
- Kikuchi, Y.; Sato, K.; Ohki, H.; Kaneko, T. Optically accessible microchannels formed in a single-crystal silicon substrate for studies of blood rheology. Microvasc. Res. 1992, 44, 226–240. [Google Scholar]
- Suganuma, H.; Inakuma, T.; Kikuchi, Y. Amelioratory effect of barley tea drinking on blood fluidity. J. Nutr. Sci. Vitaminol. 2002, 48, 165–182. [Google Scholar]
- Begum, A.N.; Terao, J. Protective effect of quercetin against cigarette tar extract-induced impairment of erythrocyte deformability. J. Nutri. Biochem. 2002, 13, 265–272. [Google Scholar]
- Kamada, H.; Hattori, K.; Hayashi, T.; Suzuki, K. In vitro evaluation of blood coagulation activation and microthrombus formation by a microchannel array flow analyzer. Thromb. Res. 2004, 114, 195–203. [Google Scholar]
- Sumino, H.; Nara, M.; Seki, K.; Takahashi, T.; Kanda, T.; Ichikawa, S.; Goto-Onozato, K.; Koya, S.; Murakami, M.; Kurabayashi, M. Effect of antihypertensive therapy on blood rheology in patients with essential hypertension. J. Int. Med. Res. 2005, 33, 170–177. [Google Scholar]
- Watanabe, N.; Kimura, F.; Kojima, F.; Endo, Y.; Fujimoto, K.; Kikuchi, Y. Effect of sterols in dietary fats on whole blood viscosity of stroke-prone spontaneously hypertensive rats (SHRSP). J. Oleo. Sci 2005, 54, 1–6. [Google Scholar]
- Muranaka, Y.; Kunimoto, F.; Takita, J.; Sumino, H.; Nara, M.; Kuwano, H.; Murakami, M. Impaired blood rheology in critically ill patients in an intensive care unit. J. Int. Med. Res. 2006, 34, 419–427. [Google Scholar]
- Seki, K.; Sumino, H.; Nara, M.; Ishiyama, N.; Nishino, M.; Murakami, M. Relationships between blood rheology and age, body mass index, blood cell count, fibrinogen, and lipids in healthy subjects. Clin. Hemorheol. Microcirc. 2006, 34, 401–410. [Google Scholar]
- Watanabe, N.; Watanabe, Y.; Kumagai, M.; Fujimoto, K. Administration of dietary fish oil capsules in healthy middle-aged Japanese men with a high level of fish consumption. Int. J. Food Sci. Nutr. 2009, 60, 136–142. [Google Scholar]
- Perutz, M.F. Stereochemistry of cooperative effects in haemoglobin. Nature 1970, 228, 726–739. [Google Scholar]
- Perutz, M.F. Nature of haem-haem interaction. Nature 1972, 237, 495–499. [Google Scholar]
- Perutz, M.F; Fermi, G.; Abraham, D.J.; Poyart, C.; Bursaux, E. Hemoglobin as a receptor of drugs and peptides: X-ray studies of the stereochemistry of binding. J. Am. Chem. Soc. 1986, 108, 1064–1078. [Google Scholar]
- Imai, K. Adair fitting to oxygen equilibrium curves of hemoglobin. Methods Enzymol. 1994, 232, 559–576. [Google Scholar]
- Baldwin, J.; Chothia, C. Haemoglobin: The structural changes related to ligand binding and its allosteric mechanism. J. Mol. Biol. 1979, 129, 175–220. [Google Scholar]
- Fermi, G.; Perutz, M.F. Haemoglobin and Myoglobin. In Atlas of Molecular Structure in Biology; Phillips, D.C., Richards, F.M., Eds.; Clarendon Press: Oxford, UK, 1981; Volume 2. [Google Scholar]
- Dickerson, R.E.; Geis, I. Hemoglobin: Structure, Function, Evolution and Pathology; The Benjamin/Cummings Publishing Co., Inc.: Menlo Park, CA, USA, 1983. [Google Scholar]
- Perutz, M.F. Mechanisms of Cooperativity and Allosteric Regulation in Proteins; Cambridge University Press: Cambridge, UK, 1990. [Google Scholar]
- Perutz, M.F.; Wilkinson, A.J.; Paoli, M.; Dodson, G.G. The stereochemical mechanism of the cooperative effects in hemoglobin revisited. Annu. Rev. Biophys. Biomol. Struct. 1998, 27, 1–34. [Google Scholar]
- Borgstahl, G.E.O.; Rogers, P.H.; Arnone, A. The 1.8 Å structure of carbonmonoxy-β4 hemoglobin. J. Mol. Biol. 1994, 236, 817–830. [Google Scholar]
- Levy, A.; Sharma, V.S.; Zhang, L.; Rifkind, J.M. A new mode for heme-heme interaction in hemoglobin associated with distal perturbations. Biophys. J. 1992, 61, 750–755. [Google Scholar]
- Shikama, K. Nature of the FeO2 bonding in myoglobin: An overview from physical to clinical. Experientia 1985, 41, 701–706. [Google Scholar]
- Shikama, K. Stability properties of dioxygen-iron (II) porphyrins: An overview from simple complexes to myoglobin. Coord. Chem. Rev. 1988, 83, 73–91. [Google Scholar]
- Shikama, K. Autoxidation of oxymyoglobin: A meeting point of the stabilixation and the activation of molecular oxygen. Biol. Rev. 1990, 65, 517–527. [Google Scholar]
- Shikama, K. The molecular mechanism of autoxidation for myoglobin and hemoglobin: A venerable puzzle. Chem. Rev. 1998, 98, 1357–1373. [Google Scholar]
- Shikama, K. Nature of the FeO2 bonding in myoglobin and hemoglobin: A new molecular paradigm. Prog. Biophys. Mol. Biol. 2006, 91, 83–162. [Google Scholar]
- Kao, O.H.W.; Wang, J.H. Kinetic study of the oxidation of ferrohemochrome by molecular oxygen. Biochemistry 1965, 4, 342–347. [Google Scholar]
- Park, S.-Y.; Yokoyama, T.; Shibayama, N.; Shiro, Y.; Tame, J.R.H. 1.25 Å resolution crystal structure of human haemoglobin in the oxy, deoxy and carbonmonooxy forms. J. Mol. Biol. 2006, 360, 690–701. [Google Scholar]
- Jandel, J.H.; Engle, L.K.; Allen, D.W. Oxidative hemolysis and precipitation of hemoglobin. I. Heinz body anemias as an acceleration of red cell aging. J. Clin. Invest. 1960, 39, 1818–1836. [Google Scholar]
- Peisach, J.; Blumberg, W.E.; Rachmilewitz, E.A. Detection of formation, and relevance of hemichromes and hemochromes. Biochim. Biophys. Acta 1975, 393, 404–418. [Google Scholar]
- Sears, D.A.; Friedman, J.M.; White, D.R. Binding of intracellular protein to the erythrocyte membrane during incubation: The production of Heinz bodies. J. Lab. Clin. Med. 1975, 86, 722–732. [Google Scholar]
- Campwala, H.Q.; Desforges, J.F. Membrane-bound hemichrome in density-separated cohorts of normal (AA) and sickled (SS) cells. J. Lab. Clin. Med. 1982, 99, 25–28. [Google Scholar]
- Selwyn, J.G. Heinz bodies in red cells after splenectomy and after phenacetin administration. Br. J. Hematol. 1955, 1, 173–183. [Google Scholar]
- Weiss, L. The structure of fine splenic arterial vessels in relation to hemoconcentration and red cell destruction. Am. J. Anat. 1962, 111, 131–179. [Google Scholar]
- Weiss, L. The structure of intermediate vascular pathways in the spleen of rabbits. Am. J. Anat. 1963, 113, 51–59. [Google Scholar]
- Wennberg, E.; Weiss, L. Splenic erythroclasia: An electron microscopic study of hemoglobin H disease. Blood 1968, 31, 778–790. [Google Scholar]
- Phillips, S.E.V. Structure of oxymyoglobin. Nature 1978, 273, 247–248. [Google Scholar]
- Vitagliano, L.; Bonomi, G.; Riccio, A.; Prisco, G.D.; Smulevich, G.; Mazzarella, L. The oxidation process of Antarctic fish hemoglobins. Eur. J. Biochem. 2004, 271, 1651–1659. [Google Scholar]
- Vergara, A.; Franzese, M.; Merlino, A.; Vitagliano, L.; Verde, C.; Prisco, G.D.; Lee, H.C.; Peisach, J.; Mazzarella, L. Structural characterization of ferric hemoglobins from three Antarctic fish species of the suborder notothenioidei. Biophys. J. 2007, 93, 2822–2829. [Google Scholar]
- Vergara, A.; Franzese, M.; Merlino, A.; Bonomi, G.; Verde, C.; Giordano, D.; Prisco, G.D.; Lee, H.C.; Peisach, J.; Mazzarella, L. Correlation between hemichrome stability and the root effect in tetrameric hemoglobins. Biophys. J. 2009, 97, 866–874. [Google Scholar]
- Robinson, V.L.; Smith, B.B.; Arnone, A. A pH-dependent aquomet-to-hemichrome transition in crystalline horse methemoglobin. Biochemistry 2003, 42, 10113–10125. [Google Scholar]
- Clark, M.R. Senescence of red blood cells: Progress and problems. Physiol. Rev. 1988, 68, 503–554. [Google Scholar]
- Low, P.S. Role of Hemoglobin Denaturation and Band 3 Clustering in Initiating Red Cell Removal. In Red Blood Cell Aging; Magnani, M., De Flora, A., Eds.; Plenum Press: New York, NY, USA, 1991; pp. 173–183. [Google Scholar]
- Walder, J.A.; Chatterjee, R.; Steck, T.L.; Low, P.S.; Musso, G.F.; Kaiser, E.T.; Rogers, P.H.; Arnone, A. The interaction of hemoglobin with the cytoplasmic domain of band 3 of the human erythrocyte membrane. J. Biol. Chem. 1984, 259, 10238–10246. [Google Scholar]
- Waugh, S.M.; Low, P. S Hemichrome binding to band 3: Nucleation of Heinz bodies on the erythrocyte membrane. Biochemistry 1985, 24, 34–39. [Google Scholar]
- Low, P.S.; Waugh, S.M. The role of hemoglobin denaturation and band 3 clustering in red blood cell aging. Science 1985, 227, 531–533. [Google Scholar]
- Schlueter, K.; Drenckhahn, D. Co-clustering of denatured hemoglobin with band 3: Its role in binding of autoantibodies against band 3 to abnormal and aged erythrocytes. Proc. Natl. Acad. Sci. USA 1986, 83, 6137–6141. [Google Scholar]
- Waugh, S.M.; Walder, J.A.; Low, P.S. Partial characterization of the copolymerization reaction of erythrocyte membrane band 3 with hemichromes. Biochemistry 1987, 26, 1777–1783. [Google Scholar]
- Ende, J.V.D.; Coppena, G.; Verstraeten, T.; Haegenborgh, T.V.; Depraetere, K.; Gompel, A.V.; Enden, E.V.D.; Clerinx, J.; Colebunders, R.; Peetermans, W.E.; et al. Recurrence of blackwater fever: triggering relapses by different antimararials. Trop. Med. Inter. Health. 1998, 3, 632–639. [Google Scholar]
- White, J.M. Mararia. In Manson's Tropical Diseases; Cook, G.C., Zumura, A.I., Eds.; W.B. Saunders: Philadelphia, PA, USA, 2003; pp. 1205–1295. [Google Scholar]
- Hue, N.T.; Charlieu, J.P.; Chau, T.T.H.; Day, N.; Farra, J.J.; Hien, T.T.; Dunstan, S.J. Glucose-6-phosphate dehydrogenase (G6PD) mutations and Haemoglobinuria syndrome in the Vietnamese population. Malaria J. 2009, 8, 152–160. [Google Scholar]
© 2011 by the authors; licensee MDPI, Basel, Switzerland. This article is an open access article distributed under the terms and conditions of the Creative Commons Attribution license (http://creativecommons.org/licenses/by/3.0/).
Share and Cite
Sugawara, Y.; Yamada, M.; Ueno, E.; Okazaki, M.; Okamoto, A.; Miyake, M.; Fukami, F.; Yano, A. New Roles Assigned to the α1–β1 (and α2–β2) Interface of the Human Hemoglobin Molecule from Physiological to Cellular. Appl. Sci. 2011, 1, 13-55. https://doi.org/10.3390/app1010013
Sugawara Y, Yamada M, Ueno E, Okazaki M, Okamoto A, Miyake M, Fukami F, Yano A. New Roles Assigned to the α1–β1 (and α2–β2) Interface of the Human Hemoglobin Molecule from Physiological to Cellular. Applied Sciences. 2011; 1(1):13-55. https://doi.org/10.3390/app1010013
Chicago/Turabian StyleSugawara, Yoshiaki, Mai Yamada, Eriko Ueno, Mai Okazaki, Aya Okamoto, Mariko Miyake, Fusako Fukami, and Ai Yano. 2011. "New Roles Assigned to the α1–β1 (and α2–β2) Interface of the Human Hemoglobin Molecule from Physiological to Cellular" Applied Sciences 1, no. 1: 13-55. https://doi.org/10.3390/app1010013