1. Introduction
Great concern exists over the spread of infectious diseases in hospitals from many perspectives, including patient care, healthcare worker safety and intra-organizational functioning. Healthcare-associated infections affect about two million patients in U.S. hospitals each year [
1]. Additionally, there are growing fears that hospitals can become breeding grounds for new strains of infectious disease. As an example, the SARS epidemic in Toronto began as the disease spread widely in a local hospital [
2]. Additionally, healthcare workers are at a particularly high risk of contracting influenza. One study of healthcare workers with a low rate of influenza vaccination demonstrated that 23% of healthcare workers had evidence of influenza infection during a single influenza season [
3]. Despite CDC recommendations for influenza vaccinations, only 36% of workers who have direct patient contact are immunized against influenza annually in the United States [
4].
Further, because of the heterogeneous job responsibilities of healthcare workers in major medical centers, which result in heterogeneous contact patterns, the risk of infection and the number of additional infections generated once an individual is infected vary widely across healthcare worker categories [
5]. Because of these issues, there is great interest in understanding the vaccine decisions of healthcare workers and the effects of these decisions [
6].
In this paper, we develop and explore a game theoretic model of vaccine choice in conjunction with contact data from a large university hospital. The model includes the traditional effects of vaccine choice, where individuals weigh the benefits versus the costs of vaccination. The individuals also consider strategic elements of choice related to the vaccine. As an example, as more individuals become vaccinated, the probability that a non-vaccinated person is infected decreases, making it less beneficial for this individual to be vaccinated. Thus, some agents are able to “free-ride” on the vaccination choices of others. Moreover, as more (fewer) individuals choose to be vaccinated, a self-enforcing social norm may develop that induces even more (fewer) vaccinations; we consider these peer-effects in our model, as well. These issues create a complex modeling environment, where individuals must take account of the various benefits and costs of a vaccine choice, as well as take account of their risk of infection, which depends on the other individuals who they come in contact with and their vaccine choices, as well as the overall structure of contacts in the organization. Because of these complexities, we use a computational model and simulations to calculate the probability of infection for individual agents depending on the vaccine choices of all other agents in the intra-organizational population. We then use these probabilities of infection to calculate Nash equilibrium vaccine choices in a variety of settings.
In addition to the interest in this work from an organizational perspective, the work in this paper fits into a burgeoning field in the infectious diseases literature. Recently, there has been great interest in the spread of infectious disease in heterogeneous networks [
7,
8]. There also has been an increase in collecting more precise data related to social contacts and the spread of infectious disease [
9,
10,
11]. In addition, further calls have been made to incorporate the use of agent-based modeling into the confrontation of large-scale pandemics, such as the recent H1N1 outbreak [
12]. Despite this proliferation of research, little work has been done until very recently to incorporate endogenous behavior into the heterogeneous network modeling paradigm [
13,
14]. In this work, we attempt to merge two strands of literature. The first is the epidemiology on heterogeneous networks literature mentioned above. The second is the game theoretic epidemiology literature [
15,
16,
17,
18]. In addition, there is a long history of studying strategic vaccination decisions in the context of public policy, in economics andelsewhere [
19,
20,
21,
22,
23,
24,
25,
26,
27,
28].
Here, we model a vaccination decision as a game, where agents recognize the strategic nature of their decision. Because the benefits of an agent being vaccinated decrease as more vaccinations in the population are performed, an agent may choose to free ride on the vaccination choices of others. We develop a simple model of vaccination choice that incorporates these elements in a heterogeneous healthcare worker population at the University of Iowa Hospitals and Clinics. We then discuss how peer effects may change the resulting equilibria of this game.
2. Example: A Simple Vaccination Game
We begin with an example two-player vaccination game in order to develop intuition. Following the example, we generalize to a multi-player game and present the results of the generalized multi-player game for the remainder of the paper. There are multiple incentives and effects in choosing to be vaccinated for an infectious disease. There is a direct benefit to the individual vaccinated, because the vaccination offers some protection against getting infected to the individual who is vaccinated. In addition, there are also public goods and externality elements of vaccine decisions that may lead to free-riding behavior.
To formalize this discussion, consider the following two-person symmetric game, with payoffs written for agent
i only:
| | Agent j |
| | Vac | No Vac |
| Agent i | Vac | −cvac | −cvac |
| No Vac | 0 | −πjαcinf |
is the cost of being vaccinated. We assume that a vaccination takes place prior to the beginning of an epidemic. is the probability that your game rival becomes infected over the course of the epidemic. α is the probability that if infected, the rival transmits the infection to agent i, if i chooses not to be vaccinated. is the cost of infection, which is assumed to be identical across agents.
To describe this game, consider a population arranged on a network, where a connection between two individuals implies a contact that could lead to the transmission of an infectious disease if one of the individuals is infected and the other is susceptible. We assume that all connections are non-directed (sometimes referred to as symmetric). In this game, each individual plays with all other individuals to which she is connected. Therefore, if individual i has connections in the network, she plays this game times, once with each of her connections. However, the agent is restricted to choose just one strategy that must be played in all of these games. Thus, she cannot choose to be vaccinated against one agent and not vaccinated against another. (Note that if the disease of interest were something like HIV, then one could model condom use in a similar manner. However, in that case, one may want to consider that different strategies, using a condom or not, could be varied across partners. This is not the case with something like influenza, where a single vaccination would apply to all interactions or games.)
We assume that all vaccinations are fully effective and that all individuals are susceptible to infection at the beginning of the model. Note that it is a simple extension to weight the efficacy of the vaccination with an additional parameter, but this does not significantly add to the general interest of the results that follow. If an individual chooses to be vaccinated, her payoff is the cost of the vaccination , regardless of the number of connections . This is true whether she is matched with a vaccinated or non-vaccinated connection, because if she is vaccinated, it does not matter what strategy her connection chooses. If she chooses not to be vaccinated, her payoff depends on the other agents to whom she is connected and the choices of all other agents in the population (because the choices of everyone jointly determine the size of an epidemic and the probability of being infected). For the moment, suppose that individual i only has one connection, to an agent labeled j. Then, the specific payoffs for the game when the individual chooses not to be vaccinated are: If individual j has chosen to be vaccinated, the payoff to individual i is zero. If j is vaccinated, she cannot be infected and, therefore, cannot infect individual i. In the other case, if individual j has not chosen to be vaccinated, she has some probability of being infective, , and this infection is passed to individual i with transmission probability α. If i is infected, she pays a cost of . Now, note that the probability of individual j being infective depends on the choices of all other agents in the network, either directly or indirectly.
Later in the paper, we generalize this simple model to include many players, but to provide the basic intuition for those not familiar with the vaccination literature, we begin with only two individuals, i and j. We now need to find the best response of each individual. To begin, suppose that individual j is vaccinated. Then, the best response of i, for any positive cost of vaccination, is to choose not to be vaccinated as . Conversely, if j does not choose to be vaccinated, the best response of i depends on the risk of infection and the costs of infection and the vaccine. Specifically, if , individual i will choose to be vaccinated, which implies that i should choose to be vaccinated if , not to be vaccinated if the inequality goes in the other direction and is indifferent if the left- and right-hand sides are equal.
We suppose that this game will be symmetric (meaning there is no difference in
i and
j, other than the labeling). We now look at the Nash equilibrium of this game. In this case, the best responses of
j will follow the analysis described above for
i with the labels
i and
j exchanged. We can then look for possible strategy combinations for a Nash equilibrium. Let us begin with a symmetric Nash equilibrium, where each agent plays the same strategy. Both agents choosing to be vaccinated will never be a Nash equilibrium. Intuitively, this makes sense. Like the concept of herd immunity [
29], if everyone else you come in contact with is protected, you are protected, as well, even without being vaccinated. The next equilibrium candidate is for both agents to choose not to be vaccinated. This would leave each player with a payoff of
. As we discussed above, this is the best response when
. If this inequality holds, then choosing no vaccination by each player is a Nash equilibrium. What this equilibrium implies is that the cost of the vaccination is too high relative to the product of the risk of infection and the cost of the infection. In essence, the danger of infection and the cost of the vaccination do not warrant the choice to be vaccinated.
Next, consider a non-symmetric Nash equilibrium, where one individual chooses to be vaccinated and the other does not. Suppose that i is the individual to be vaccinated. If i is vaccinated, then not being vaccinated is the best response for j. The question then is, when is being vaccinated the best response of i to j choosing not to be vaccinated? For this to be the best response, as written above, , . Note that we could reverse the labels and also have a Nash equilibrium where i is not vaccinated and j is. With payoffs that fit these conditions, the game becomes a coordination game, where each agent choosing the opposite strategy of the other is a Nash equilibrium. When we have a coordination game of this structure, there is also a mixed strategy Nash equilibrium.
The mixed strategy Nash equilibrium occurs when each individual chooses to be vaccinated with a probability that makes the other individual indifferent between her available strategies. Let the probability of individual i choosing to be vaccinated be . In the mixed strategy (symmetric) Nash equilibrium, we will have the expected payoff of vaccinating equal to the expected payoff of not vaccinating. Write this equality as: ; which implies: . Recognizing that is simply the probability that agent i is infected, , we can write in the mixed strategy Nash equilibrium. The same relationship holds for agent j. Note that is a function of and . Thus, the mixed strategy Nash equilibrium with two players is a pair of vaccination probabilities.
Next, we generalize this game to many homogeneous individuals. Let Γ define a network of contacts across a set of agents, where two agents that are connected can transmit an infection to each other if one agent is infected and the other is susceptible. Further, write a set of parameters of the model, including the transmission and recovery rates as η. Write the probability of infection for an agent i as , where p−i is the vector of vaccination probabilities for all agents in the population, except i. The no vaccination Nash equilibrium has a simple structure, even with many players; if the cost of the vaccine is too large relative to the probability of infection and the cost of infection, no one chooses to be vaccinated: for all i, where indicates the probability of infection when agent i and all other agents in the population choose a vaccination probability of zero.
The mixed strategy Nash equilibrium is equally easy to write following the discussion above. Setting the expected payoff of each strategy equal to each other yields: for all i. The mixed strategy Nash equilibrium is a vector of vaccination probabilities , where each agent is indifferent to being vaccinating or not. Note that the Nash equilibrium is intuitive in that as the probability of vaccination increases, the probability of infection falls. Thus, if increases or decreases, the agents must decrease their vaccination probability in order to remain indifferent. For notational simplicity, we will write for the remainder of the paper.
3. Heterogeneous Contacts
In what follows, we consider a more fully-developed multi-player model of heterogeneous contacts vaccine choice and connect the model to data on hospital contact patterns. Adding heterogeneous players clearly complicates the analysis [
30]. In developing the model and connecting it to data, there are several modeling issues to consider and also several several simplifying assumptions that we make. We begin this section by laying out these issues. The first issue considers the timing of vaccine choice and the relationship of this choice to the contact network. In our model, we assume that agents make a vaccine choice prior to the beginning of infections and prior to the realization of a contact network. In addition, we assume that individuals use a linear estimation of the marginal effects of a vaccination in estimating their probability of infection. We assume that they are able to make this estimation prior to making their vaccination decision. None of these are innocuous assumptions, and we discuss each in turn.
First, many (perhaps most) vaccine choices occur in a dynamic environment. For endemic infectious disease, such as, say, chickenpox, vaccine choice occurs at various ages. For other seasonal infectious disease, such as influenza, vaccine choice may be made prior to the beginning of an epidemic for some individuals (for instance, some people get their yearly influenza vaccine early in the fall prior to a widespread outbreak). However, some individuals may wait until gathering some knowledge of the seriousness of the yearly outbreak and only get their vaccine if they view the likelihood of infection as being large or if the infection is particularly serious. Still further, some may use past history with seasonal vaccinations in their decision. Past years of frequent (infrequent) illness when vaccinations were not received may increase (decrease) the probability that an individual chooses to be vaccinated. There are interesting interactions between this type of behavior and the network structure [
11]. Similarly, correct or incorrect perceptions of vaccine effectiveness (lack of effectiveness) may increase (decrease) the probability of vaccinations. Thus, there may be a dynamic pattern in vaccine choice, both with respect to a specific epidemic (perhaps waiting until a large outbreak occurs) and with respect to the past history of vaccinations. Our assumption that vaccine choice occurs prior to the beginning of infections limits some elements of our model, particularly in relation to these dynamic choices. However, it allows us to simplify our analysis and consider a simultaneous move game in conjunction with our data in the model. Further, this assumption has been made elsewhere in prominent research, and the benefits and criticisms of the assumption have been discussed elsewhere, as well [
20,
22,
26]. We expect future models developed in conjunction with our data to consider more general and dynamic individual vaccine choice. We discuss potential extensions and future models in the conclusion of this paper.
Second, in order to make a vaccination decision in a game theoretic framework, an individual needs to estimate the probability of infection. This is difficult for a variety of reasons. The spread of an infectious disease depends crucially on the pattern of contacts, or the contact network, over which the infections occur [
7,
8]. This is true, both with respect to global patterns of infection and local probabilities of infection. Most important for this paper, an individual’s probability of infection depends not only on her specific contacts, but also the contacts of her contacts, the contacts of those contacts,
etc. Thus, it is nota trivial task for an individual to estimate the probability of infection in a heterogeneous contact network. In order to limit the complexity in terms of the heterogeneity of contacts, we assume that individuals make a vaccination decision prior to the realization of a contact network. Specifically, we assume that agents in the model know their expected contacts with members of other groups in the population. However, they do not know which particular individuals they will come in contact with nor do they know their exact number of realized contacts nor their specific position in the contact network. As an example, if a floor nurse makes her influenza vaccination decision in the fall, she has an expectation of the number of patients that she will see over the course of a winter’s influenza season, but she does not yet know the realization of the actual number of contacts. With this assumption,
ex ante, we may treat all members of a particular group in the population as homogeneous when a vaccination choice is made. In turn, this simplifies the analysis of a mixed strategy Nash equilibrium at the group level. Each member of each group plays a mixed strategy that is identical within a group, but that may vary across groups (if the groups have different contact distributions). As an example, each floor nurse will have the same expectations with respect to contacts as all other floor nurses and will therefore choose the same mixed strategy in equilibrium. However, each floor nurse may expect to have more contacts than a food service worker. Thus, the floor nurse may choose a higher probability of vaccination than the food service worker in the mixed strategy.
Third, in addition to depending on the contact structure, the spread of an infectious disease also depends on who in the population chooses to be vaccinated (assuming a vaccine is available, as we do in this paper) and the location of these individuals in the contact structure. As an example, if someone in a central place within the contact structure chooses to be vaccinated, this effects the entire population (on average) more than if a person on the periphery of the contact structure is vaccinated. The probability of infection for individuals in the population depends upon very specific patterns of vaccination in the population (not only who is vaccinated, but where they are located in the contact structure within the population). With this issue in mind, it is very difficult for an individual to forecast his probability of infection precisely. Thus, there are several modeling choices that we could make regarding an individual’s forecast of her probability of infection. At one extreme, one could assume an extreme level of rationality and have agents solve for their probability of infection given a distribution of contacts. For our data, this is not feasible, as the data distribution that we work with is too complex (a closed form solution for infection probability does not exist for the data with which we work). At the other extreme is an approach perhaps more representing reality in that agents may use a limited amount of individual history or experience in their decision making [
11]. In this paper, we choose an intermediate approach that allows for individuals to be fairly sophisticated, but not perfectly knowledgeable, in forecasting their infection probabilities. We simulate an epidemic over a probabilistic contact network that matches the distribution of contacts in our data. When doing so, we vary the vaccination probabilities for groups in a population (specified more fully below). Individuals then estimate their infection probability using a simple linear regression that takes into account the vaccine probabilities of the various groups in the population and an expectation of their location in the contact network structure (which, again, has yet to be realized). In doing so, the individuals linearly estimate the marginal effect of a change in vaccine probability for each group on the other groups in the population. We then use these estimated marginal effects to calculate the mixed strategy Nash equilibrium of vaccine choice across the groups. The decision to include linear marginal effects has some limitations, and we discuss these more fully below.
We next specify a model of the contact structure in the population and the decision making of agents. We then describe our data on hospital contact structures and how we use this data in conjunction with the model.
3.1. A Model of Heterogeneous Contacts
Suppose that there are a set of groups within a population that all have the same probabilistic contact structure among group members. We consider a special case of this as follows: Let there be G groups within a population. Define the number of agents in group k to be . Each individual within a group has a set of contact probabilities, , with each group (their own, as well as the other groups). In our data, this contact probability defines the probability of a contact between a hospital worker from group k and a hospital worker from group l over the course of one day within the hospital. Therefore, each member of group k has an expected number of daily contacts with group l of . is the probability that a given member of group k is connected to a given member of group l. Let M be the matrix with elements . This matrix in turn can be used to create a contact network Γ. Note, again, that we assume that this contact structure has not yet been realized when individuals make a vaccination choice. Each individual in the population simply has an expected number of contacts within each population group at the time of vaccine choice. Thus, when making a vaccination choice, each member within a group is homogeneous in terms of their decision making.
Now, we need to consider the Nash equilibrium vaccination choices. Because it is the most interesting, we concentrate on the mixed strategy Nash equilibrium. Let
be the probability that a member of group
g is vaccinated. Again, we can alternatively think of this as the mixed strategy of all members of group
g. A Nash equilibrium will now be
for each group
g. In order to use the linear regression estimate of infection probability mentioned above, we decompose the infection probability into the marginal effects of vaccinations by each group. Write the marginal effect of a change in vaccination rate for group
g on the group
h infection probability as
. Further, write the base infection rate for group
h as
. This is the probability of infection for group
h that would result if no vaccinations were performed in the population. One can then rewrite the Nash equilibrium condition as:
. Writing the equilibrium condition in this manner assumes that the marginal effects between groups are separable. Rearranging and isolating the group
h vaccination probability yields:
If this equation holds for all
h, the vaccination strategy vector is a Nash equilibrium. Note that
should be a negative term; the effect of an increase in
is a decrease in infection probability for group
h. Further, the cross group effects should be non-positive,
for all
. Rewrite the Nash equilibrium condition as:
Note that this condition is intuitive. First, is positively related to the base infection level (with no vaccinations). This is the direct effect of the risk of infection. Second, is negatively related to the marginal effects of other groups (g) on group h (recall that is negative) and the level of vaccinations of other groups, . Essentially, this term measures the ability of group h to free-ride on the vaccination choices of other groups. Third, is negatively related to the ratio of vaccination and infection costs. As vaccinations become more expensive or as the cost of infection decreases, decreases. Fourth, each of these terms is normalized by the effect of group h on itself. If is large (in absolute value), each of these effects decreases. Perhaps most importantly, the equilibrium level of free-riding depends on the strength of the marginal effects of other groups on h relative to the effect of group h on itself. Finally, note that if , then agents are simply choosing a vaccination rate that pushes the probability of infection to zero. This probability is determined by the base infection rate of the group, the effect of a vaccination on itself and the effect of other groups’ vaccination levels on the group.
Before moving on, we want to be careful to clarify one issue. In our model, we are assuming that individuals make a vaccination decision when they have not yet realized a specific contact structure. They have an expectation of a contact structure from matrix M, but they do not yet know the specific realization of the network Γ. Thus, at the point in time when individuals make their vaccination decisions, they are homogeneous within groups. If individuals made the vaccination decision after a specific contact structure had been realized, then there would be heterogeneity within the groups, and a more complex Nash Equilibrium (allowing for heterogeneity within a group and between the groups) would result even for a simultaneous move game. As an example, individuals who realized a larger than average number of contacts would choose a larger probability of vaccination in the equilibrium mixed strategy. Even further, the mixed strategy also would depend on the location in the contact network. Two individuals with the same number of contacts may choose different strategies if one occupies a more central position within the contact structure and the other occupies a position on the periphery. These complexities are one reason that we employ an expected contact structure in this paper. We expect to generalize this model in order to begin considering issues such as these in future work.
4. An Example Vaccination Game in a Heterogeneous Population
We now consider an example of the heterogeneous case with contact data from a large university hospital.
4.1. Data
Observational data on contacts between healthcare workers and other members of the hospital population (other healthcare workers and patients) were collected during the winter and early spring of 2006–2007 (the “flu season”) at the University of Iowa Hospitals and Clinics (UIHC). The UIHC is a 700-bed comprehensive academic medical center and regional referral center in Iowa City. Data were collected by randomly selecting UIHC employees from each of 15 job classifications (specified below) and then using research assistants to “shadow” the 140 selected employees. The research assistants manually recorded every human contact of the subjects over an observed work shift. For the data collection, we define a contact as any two individuals being within approximately three feet of each other. An observed “work shift” in our data varies from between four to ten hours, and the time interval was dependent on the availability of both the shadowed subjects and our research assistants. We normalize these data to daily contact rates, as described below. Additionally, the RA recorded the worker or patient group category for each observed contact (patient or category of healthcare worker) in our dataset and the location in the hospital where the contact occurred. The data collection was approved by the Institutional Review Board at the University of Iowa.
The job categories and number of observed subjects in the dataset are as follows: floor nurse (eight), food service (11), housekeeper (eight), intensive care nurse (eight), nurse assistant (10), pharmacist (eight), phlebotomist (10), physical/occupational therapist (nine), resident/fellow/medical student (eight), respiratory therapist (11), social worker (eight), staff physician (11), transporter (seven), unit clerk (nine) and X-ray technician (14). The numbers of employees in each worker group at the hospital are listed in
Table 1. The data for each group contain approximately 40 h of shadowing. The data were summarized into tallies of contacts over 30-min intervals and then aggregated into average contacts per 8 h per person by the authors. These contacts per 8 h are reported in
Table 2. The contacts in the table are rounded to the nearest integer to facilitate presentation. This normalized contact number in our data is meant to represent the average daily contacts for individuals in a worker group (assuming an average individual works for eight hours per day). We note that we were not allowed to shadow patients directly as subjects in the data collection. However, patients appear in the data as contacts of the shadowed employees. Thus, patients appear as a “column” in the table, but not as a “row”.
Table 1.
The number of employees at the hospital.
Table 1.
The number of employees at the hospital.
| Category | Number of Employees |
|---|
| Floor Nurse | 804 |
| Food Service | 456 |
| Housekeeper | 356 |
| IC Nurse | 190 |
| Nurse Asst | 386 |
| Patient | 482 |
| Pharmacist | 276 |
| Phlebotomist | 74 |
| Physical/Occupational Therapist | 90 |
| Residents/Fellows/Med Students | 666 |
| Respiratory Therapist | 108 |
| Social Worker | 114 |
| Staff Physician | 760 |
| Transporter | 108 |
| Unit Clerk | 126 |
| X-Ray Technician | 236 |
| Total | 5,232 |
For the purposes of this paper, we aggregate these groups into four main categories due to the complexity involved in calculating the equilibrium. Two of the groups are chosen because of direct interest in the categories: patients and direct care workers (those that have frequent direct contact with patients for purposes of healthcare). These direct care workers consist of the following groups: floor nurse, intensive care nurse, nurse assistant, phlebotomist, physical and occupational therapist, residents/fellows, respiratory therapist and staff physician. In addition, it has been shown elsewhere that social workers and unit clerks occupy a prominently central position in hospital worker networks [
5]. Finally, the fourth group that we employ contains all other groups not yet mentioned, which we label “remaining”. We aggregate the observed average contact rates with these groups along with the number of workers (or patients) in each category employed at the hospital. We then calculate the average number of contacts between each of the four aggregate groups. We divide these average contacts by the number of employees in the aggregate groups to arrive at a contact probability, which is used to simulate the spread of an infectious disease within the hospital. This contact probability is
. Again, this contact probability defines the probability of a contact between a hospital worker from group
k and a hospital worker from group
l over the course of one day within the hospital.
Table 2.
Average contacts between worker categories per eight hours.
Table 2.
Average contacts between worker categories per eight hours.
| F N | Food | HK | IC N | N Asst | Pat | Pharm | Phleb | P Ther | Res | R Ther | SW | Stf Phys | Trans | UC | X-Ray |
|---|
| F N | 21 | 0 | 1 | 1 | 10 | 36 | 1 | 0 | 3 | 3 | 1 | 1 | 2 | 1 | 7 | 1 |
| Food | 3 | 6 | 1 | 2 | 2 | 14 | 1 | 1 | 0 | 1 | 0 | 1 | 1 | 0 | 4 | 0 |
| HK | 4 | 0 | 4 | 1 | 2 | 2 | 0 | 0 | 1 | 1 | 0 | 0 | 1 | 0 | 1 | 0 |
| IC N | 1 | 0 | 1 | 21 | 1 | 23 | 1 | 0 | 1 | 3 | 3 | 1 | 4 | 0 | 1 | 1 |
| N Asst | 11 | 1 | 1 | 5 | 4 | 25 | 0 | 0 | 1 | 1 | 1 | 1 | 0 | 1 | 5 | 0 |
| Pharm | 7 | 0 | 0 | 2 | 1 | 3 | 2 | 0 | 0 | 6 | 0 | 1 | 3 | 0 | 2 | 0 |
| Phleb | 3 | 0 | 0 | 0 | 1 | 40 | 1 | 2 | 0 | 1 | 1 | 0 | 0 | 0 | 1 | 0 |
| P Ther | 9 | 1 | 1 | 4 | 3 | 15 | 1 | 1 | 4 | 1 | 1 | 1 | 1 | 1 | 3 | 0 |
| Res | 5 | 1 | 0 | 9 | 1 | 11 | 1 | 0 | 0 | 21 | 2 | 1 | 8 | 0 | 1 | 1 |
| R Ther | 5 | 1 | 1 | 16 | 1 | 12 | 1 | 0 | 1 | 6 | 16 | 0 | 2 | 0 | 2 | 2 |
| SW | 17 | 0 | 1 | 1 | 1 | 4 | 1 | 0 | 2 | 6 | 1 | 2 | 3 | 0 | 3 | 0 |
| Stf Phys | 3 | 0 | 0 | 3 | 1 | 11 | 1 | 0 | 1 | 26 | 0 | 1 | 3 | 0 | 1 | 1 |
| Trans | 3 | 0 | 1 | 0 | 1 | 14 | 0 | 1 | 1 | 1 | 1 | 0 | 1 | 4 | 1 | 0 |
| UC | 32 | 1 | 1 | 8 | 9 | 3 | 1 | 0 | 3 | 10 | 1 | 2 | 3 | 1 | 2 | 1 |
| X-Ray | 4 | 0 | 1 | 4 | 1 | 19 | 0 | 0 | 0 | 1 | 1 | 0 | 1 | 1 | 1 | 18 |
4.2. Simulating an Epidemic
The contact probabilities stated above are used to create a set of hospital contact networks at 1/4 scale, which we use in simulating an SIR epidemic across the hospital. As an overview, we create a large number of realized contact networks using the contact probabilities from our data. We then vary the vaccination rates across the four aggregate groups and measure the probability of infection for each group across many replications of each contact network and each permutation of vaccination rate. Agents then use this simulated infection probability to estimate a linear model of the effect of group-level vaccination rates on their probability of infection. We then use these estimations to calculate the Nash equilibrium vaccination strategies of each group. We now specify the details of this process.
For every four employees listed in the hospital records, we create an agent. We then create a contact network in the hospital that matches the data on observed contacts. Specifically, we consider each pair of agents in the population in turn and create a contact between them with probability . If a contact is created between two agents, each of these contacts occurs each day in the simulation. We then vaccinate a set of agents in the population. We vary the vaccination rates for each group by a process described below. We then simulate an SIR model across this contact network. We initialize the epidemic process by infecting each agent with a one-percent probability (on average, one out of every 100 agents in the model are seed infections). This results in approximately 13 seeded infections per replication of the simulation. If an infected agent contacts a susceptible agent, the susceptible agent transitions to the infected state with a 10-percent probability (per day) over the duration of the infection. Once infected, an agent remains in the infected state for five periods (days), then moves to the recovered state and remains there for the duration of the simulation. The simulation is run, until no agents remain in the infected state. We repeat this process of network creation, vaccination and epidemic, 200 times for each vector of vaccination rates that we consider.
As some examples of the epidemic created, if low vaccination levels of 5% are performed in the population, the group level infection rates for the hospital workers are approximately 43% (direct care), 48% (social workers and clerks) and 25% (for the remaining group). If intermediate vaccination levels of 35% are performed in the population, the group level infection rates for the hospital workers are approximately 20 percent (direct care), 19%(social workers and clerks) and11% (for the remaining group). If high vaccination levels of 65% are performed in the population, the group level infection rates for the hospital workers are approximately four percent (direct care), three percent (social workers and clerks) and two percent (for the remaining group). Note that the transmission and recovery rates were chosen to yield a large, but reasonably-sized, epidemic. These levels of transmission and recovery were not calibrated to mimic a specific infectious disease.
We vary the vaccination probabilities for each group with the following parameter sweep. To simplify the analysis, we set the vaccination rate for patients to be 40%, which is about the national average for influenza vaccinations in the United States. That leaves three groups to consider. Denote a probability of vaccination for group
G as
, where
g indexes one of the three non-patient groups from above. We then vary each of these vaccination rates from 5% to 80% at 5% intervals for each of the three groups. For instance, for the first set of simulations, we set each of the three non-patient vaccination levels to 5%,
We then iterate to another set where
. We continue in this manner, until we consider all combinations of
between 0.05 and 0.80 at intervals of 0.05. For each of these vaccination probability combinations, we run 200 replications of the stochastic SIR model described above and measure the average infection probability for each group. When completed, we have a table where each row of the table lists:
, where
is the level of vaccinations for group
i and
is the resulting average percentage of group
i infected over the 200 replications. This computational method of using agent-based simulations to allow agents to forecast a distribution is similar to that of Pape
et al. [
31].
With this set of simulated data, we then regress the vaccination probabilities on the resulting levels of infection, such that we have the following equation for each of the four groups:
where Groups 1, 2 and 3 indicate one of the three hospital worker groups. We allow agents to use these regression coefficients as the marginal effects of each group’s vaccination level on their own group and the other groups. These regression coefficients are used in order to solve for the Nash equilibrium given in Equation (
2). The regression coefficients for each of the regressions are given in
Table 3.
Table 3.
Regression coefficients. The values reported in the table are the regression coefficients of the OLS regression with the percentage infected of the group in the row as the dependent variable and the percentage vaccinated of the group listed in the column as independent variables. The first column represents the intercept coefficient from the specified regression.
| | Direct Care () | SocWrk/Clrk() | Remaining () |
|---|
| Direct Care | 0.434 | −0.542 | −0.022 | −0.047 |
| SocWrk/Clrk | 0.422 | −0.308 | −0.305 | −0.045 |
| Remaining | 0.225 | −0.146 | −0.012 | −0.175 |
In the table, there are several things to note. First, there is a clear difference in the expected probability of infection across the groups. Specifically, if no vaccinations were performed, the “remaining” group would have a much lower infection rate than the other two groups (see the first column of the table,
). Thus, one would expect them to have the lowest level of vaccinations. Second, as expected, all of the regression coefficients associated with vaccination probability are negative. An increase in the vaccination rate for any group decreases the probability of infection for each of the groups. Third, the effects in
Table 3 are stated in percentage terms. Because direct care personnel have the largest number of workers, this overstates their effect relative to the other groups (particularly social workers and clerks whose group size is an order of magnitude smaller). We transform these coefficients from percentages to individual vaccinations in
Table 4. In this table, we list the decrease in the number of individuals infected of the row group from vaccinating one additional individual from the column group. One can interpret the values in the table as the marginal effect of one additional vaccination.
Table 4.
The decrease in the number of individuals infected of the row group from vaccinating one additional individual from the column group.
Table 4.
The decrease in the number of individuals infected of the row group from vaccinating one additional individual from the column group.
| Direct Care | SocWrk/Clrk | Remaining |
|---|
| Direct Care | 0.542 | 0.282 | 0.101 |
| SocWrk/Clrk | 0.024 | 0.305 | 0.008 |
| Remaining | 0.068 | 0.072 | 0.175 |
In this table, note that the effect of an additional vaccination in one’s own group is larger than the effect of a vaccination in any other group. As one would likely anticipate, the effect of a member of one’s own group being vaccinated has the largest effect on that group’s infection probability. Furthermore, note that the effect of a vaccination is less than 1.0 in all cases. One might initially think that a vaccination should result in a decrease of at least one infection. However, because not everyone becomes infected if they are not vaccinated, a vaccination does not necessarily create a decrease of larger than 1.0. As an example, if an individual is vaccinated who has a 50% chance of being infected, that vaccination only prevents 0.5 infections directly plus a number of secondary infections. Therefore, unless the number of secondary infections is sufficiently large and the infection probability is sufficiently high, the effect of a vaccination is less than one infection prevented. Finally, note that the effects of a vaccination, in terms of an infection prevented, are largest for the direct care group. From this, we can infer that vaccinations of the direct care group will have the largest effect on overall infection rates and that direct care vaccinations provide the greatest opportunity for free-riding behavior.
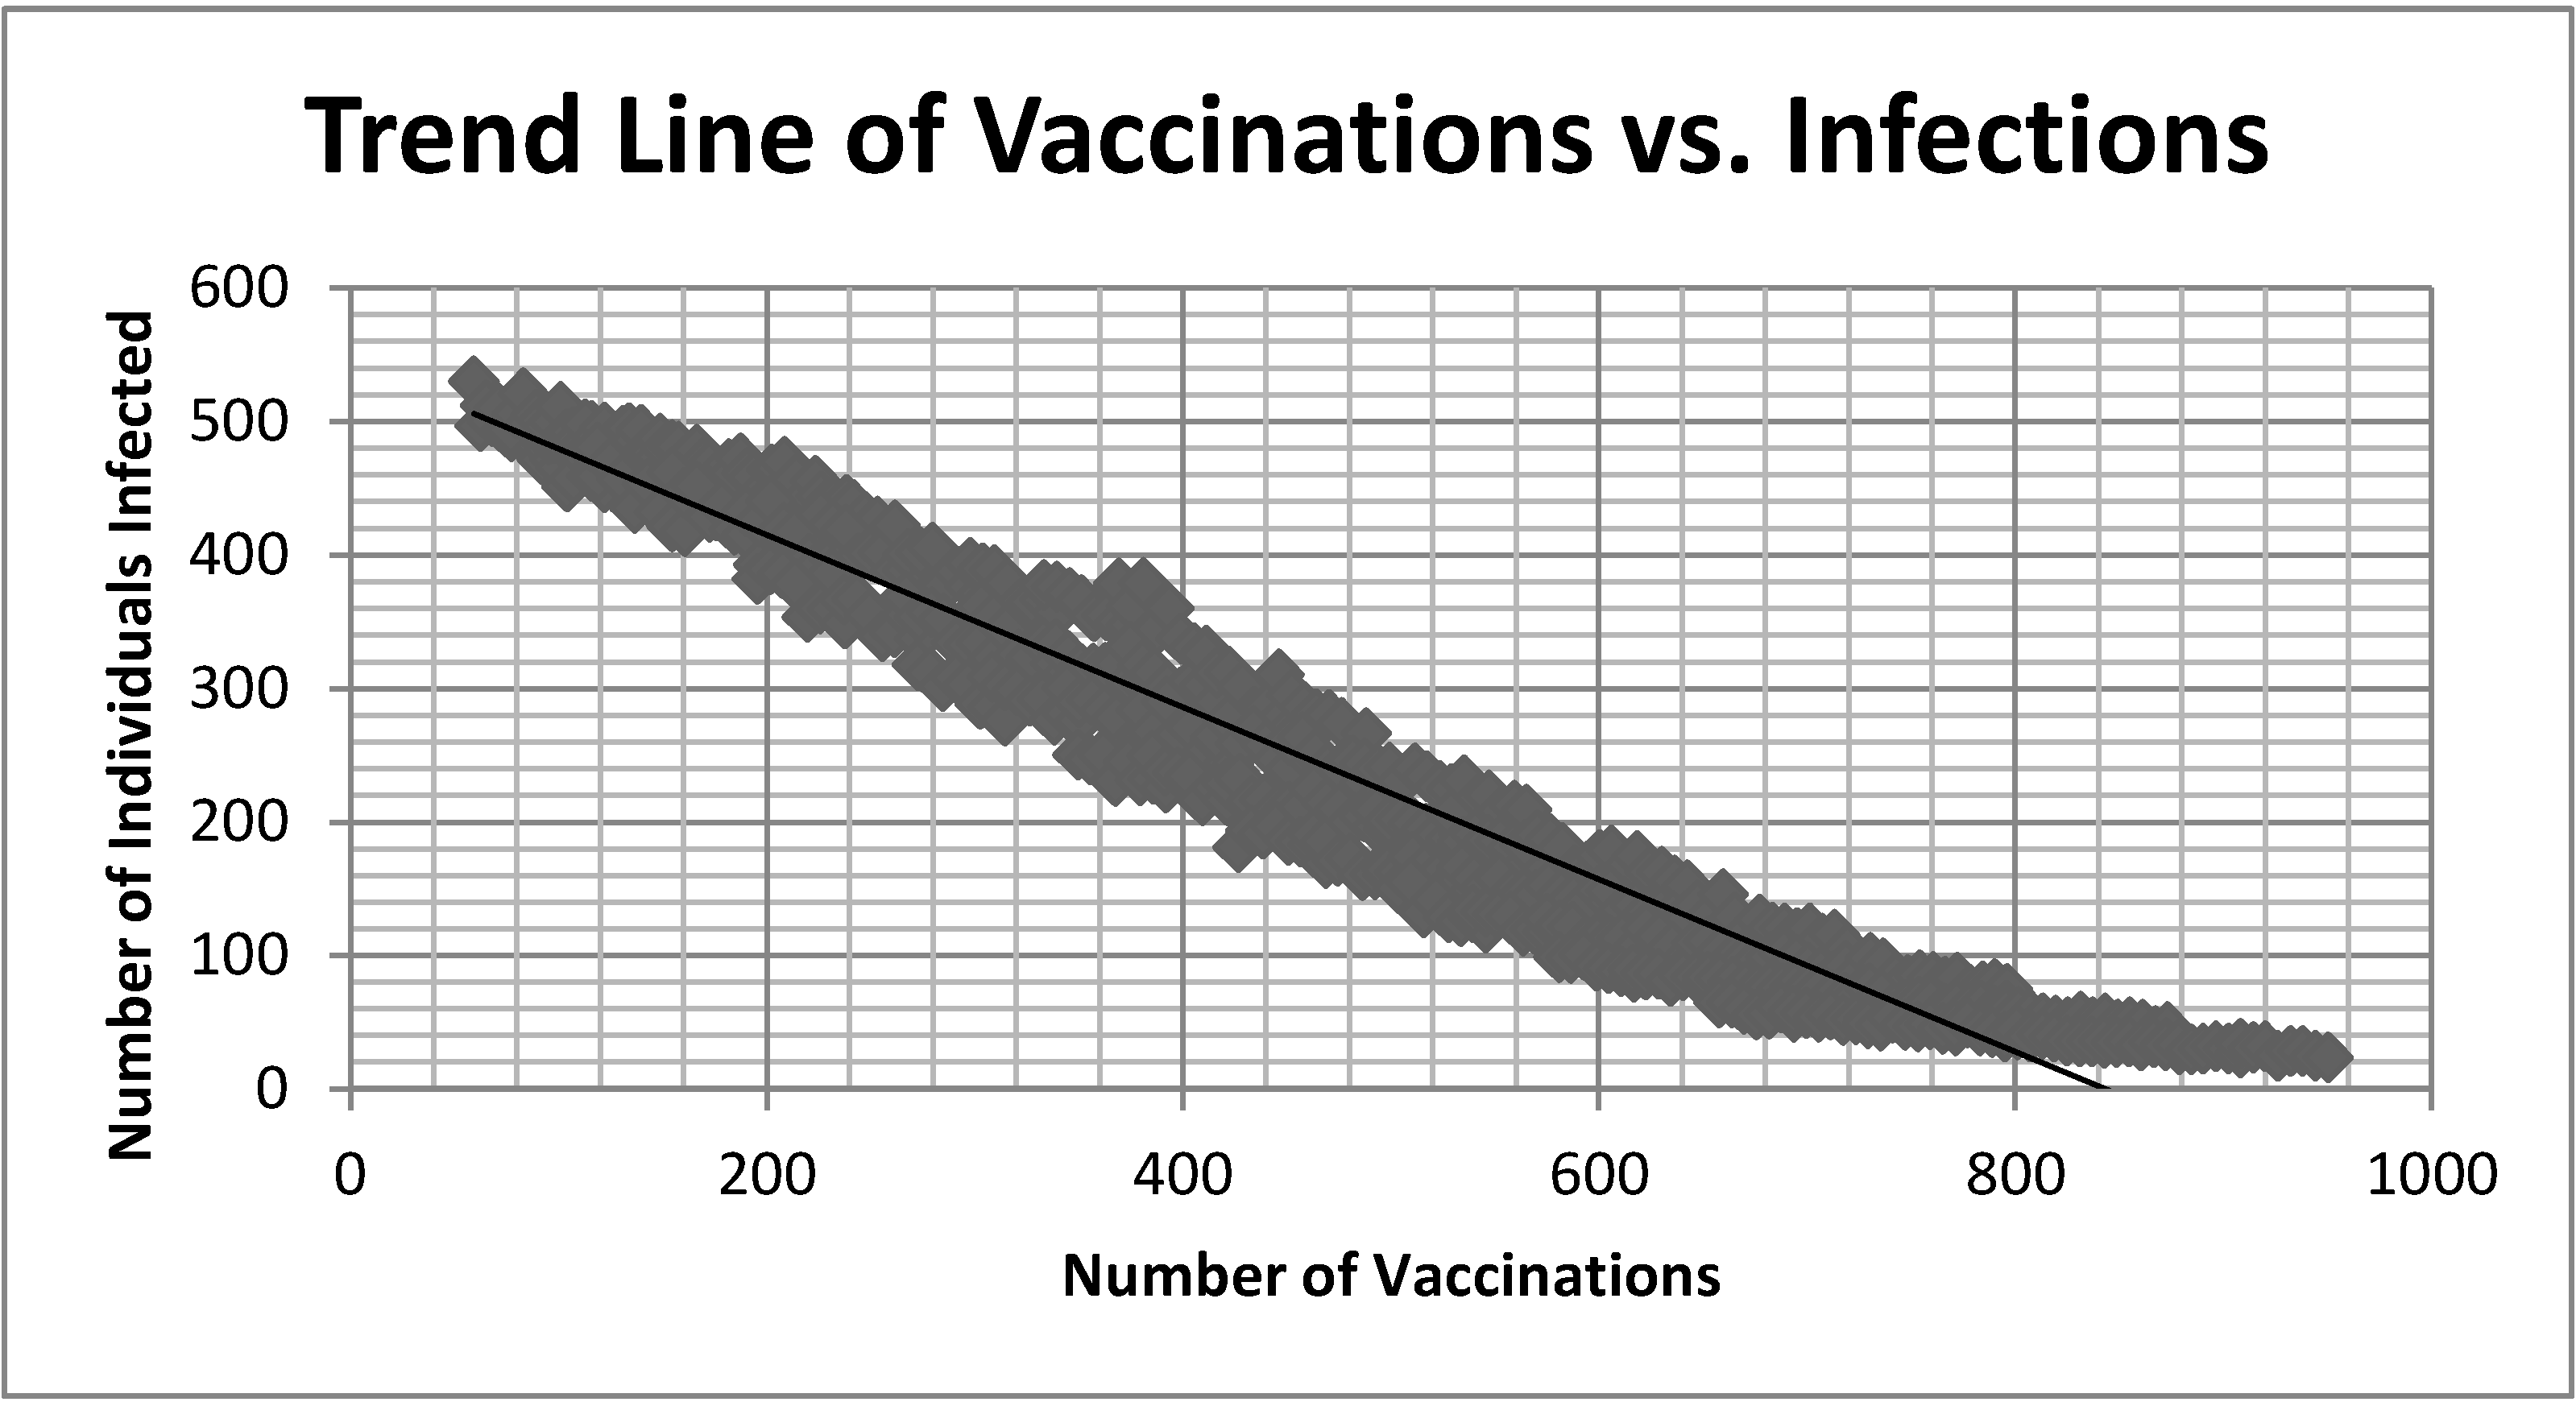
One concern with our model relates to our assumption of a linear model of the marginal effects of a vaccination. The marginal effect of vaccinations is known to be non-linear and non-monotonic [
28]. In the context of our data, however, we find that the decrease in the number of infected individuals is nearly linear in the number of individuals vaccinated.
Figure 1 plots the number of vaccinations performed in our simulations
versus the number of individuals infected (along with a trend line) for all of our replications. For the majority of the simulated data, a linear model fits the data relatively well. However, it does poorly near the right tail of the data, when vaccination percentages are very large. This occurs partly because of the seeding of infections in the population. On average, 1% of the non-vaccinated population will be infected in any given replication. Thus, it is very difficult to push the number of infected individuals to zero without vaccinating the entire population. Thus, when viewing this plot, we feel that our assumption of individuals using a linear model to predict the likelihood of infection is reasonable at vaccination levels that do not approach 1.0. If we were primarily concerned with predicting infection probability for very large vaccination levels, the linear model would provide a poor fit.
As an additional concern, we assume that all members of the population enter the initial phase of the epidemic as susceptible. This is a reasonable assumption if the infectious disease is new and novel. However, if one is considering a seasonal infectious disease, such as influenza, some members of the population typically have immunity from past experience with related infections [
32]. In turn, this decrease in the susceptible population at the onset of the epidemic would lower the marginal effect of vaccinations, because the number of additional infections and the overall incidence of the disease will be smaller [
33]. In our example population, we reran the simulation above, but with 30% of the population immune to infection at the start of the epidemic.
Table 5 displays the decrease in the number of individuals infected per vaccination performed in the various groups.
Figure 1.
Plot of the number of individuals infected as a function of the total number of vaccinations performed in all groups. A trend line is plotted vs. the data.
Figure 1.
Plot of the number of individuals infected as a function of the total number of vaccinations performed in all groups. A trend line is plotted vs. the data.
Table 5.
The decrease in the number of individuals infected of the row group from vaccinating one additional individual from the column group. Thirty percent of the population is immune at the start of the epidemic, resulting in a lower marginal effect of vaccinations for all groups.
Table 5.
The decrease in the number of individuals infected of the row group from vaccinating one additional individual from the column group. Thirty percent of the population is immune at the start of the epidemic, resulting in a lower marginal effect of vaccinations for all groups.
| Direct Care | SocWrk/Clrk | Remaining |
|---|
| Direct Care | 0.123 | 0.051 | 0.032 |
| SocWrk/Clrk | 0.005 | 0.070 | 0.002 |
| Remaining | 0.012 | 0.000 | 0.046 |
As can be seen in the table, all of the marginal effects are smaller. Partly, this lower marginal effect of a vaccination occurs because of lower levels of overall infections; vaccinations prevent fewer infections, because the epidemic is smaller. This effect suggests that lower levels of vaccinations should be performed in equilibrium. In addition, these lower marginal effects decrease the ability of agents to free-ride on the vaccination decisions of other agents. This effect suggests that higher levels of vaccinations should be performed in equilibrium. Additional research examining the magnitude of these relationships between levels of initial immunity and equilibrium vaccination levels would be valuable.
4.3. An Example Equilibrium
Using the estimated linear effects reported above in
Table 3 and Equation (
2), one can calculate the mixed strategy Nash equilibrium as a function of λ for our model. These are shown in
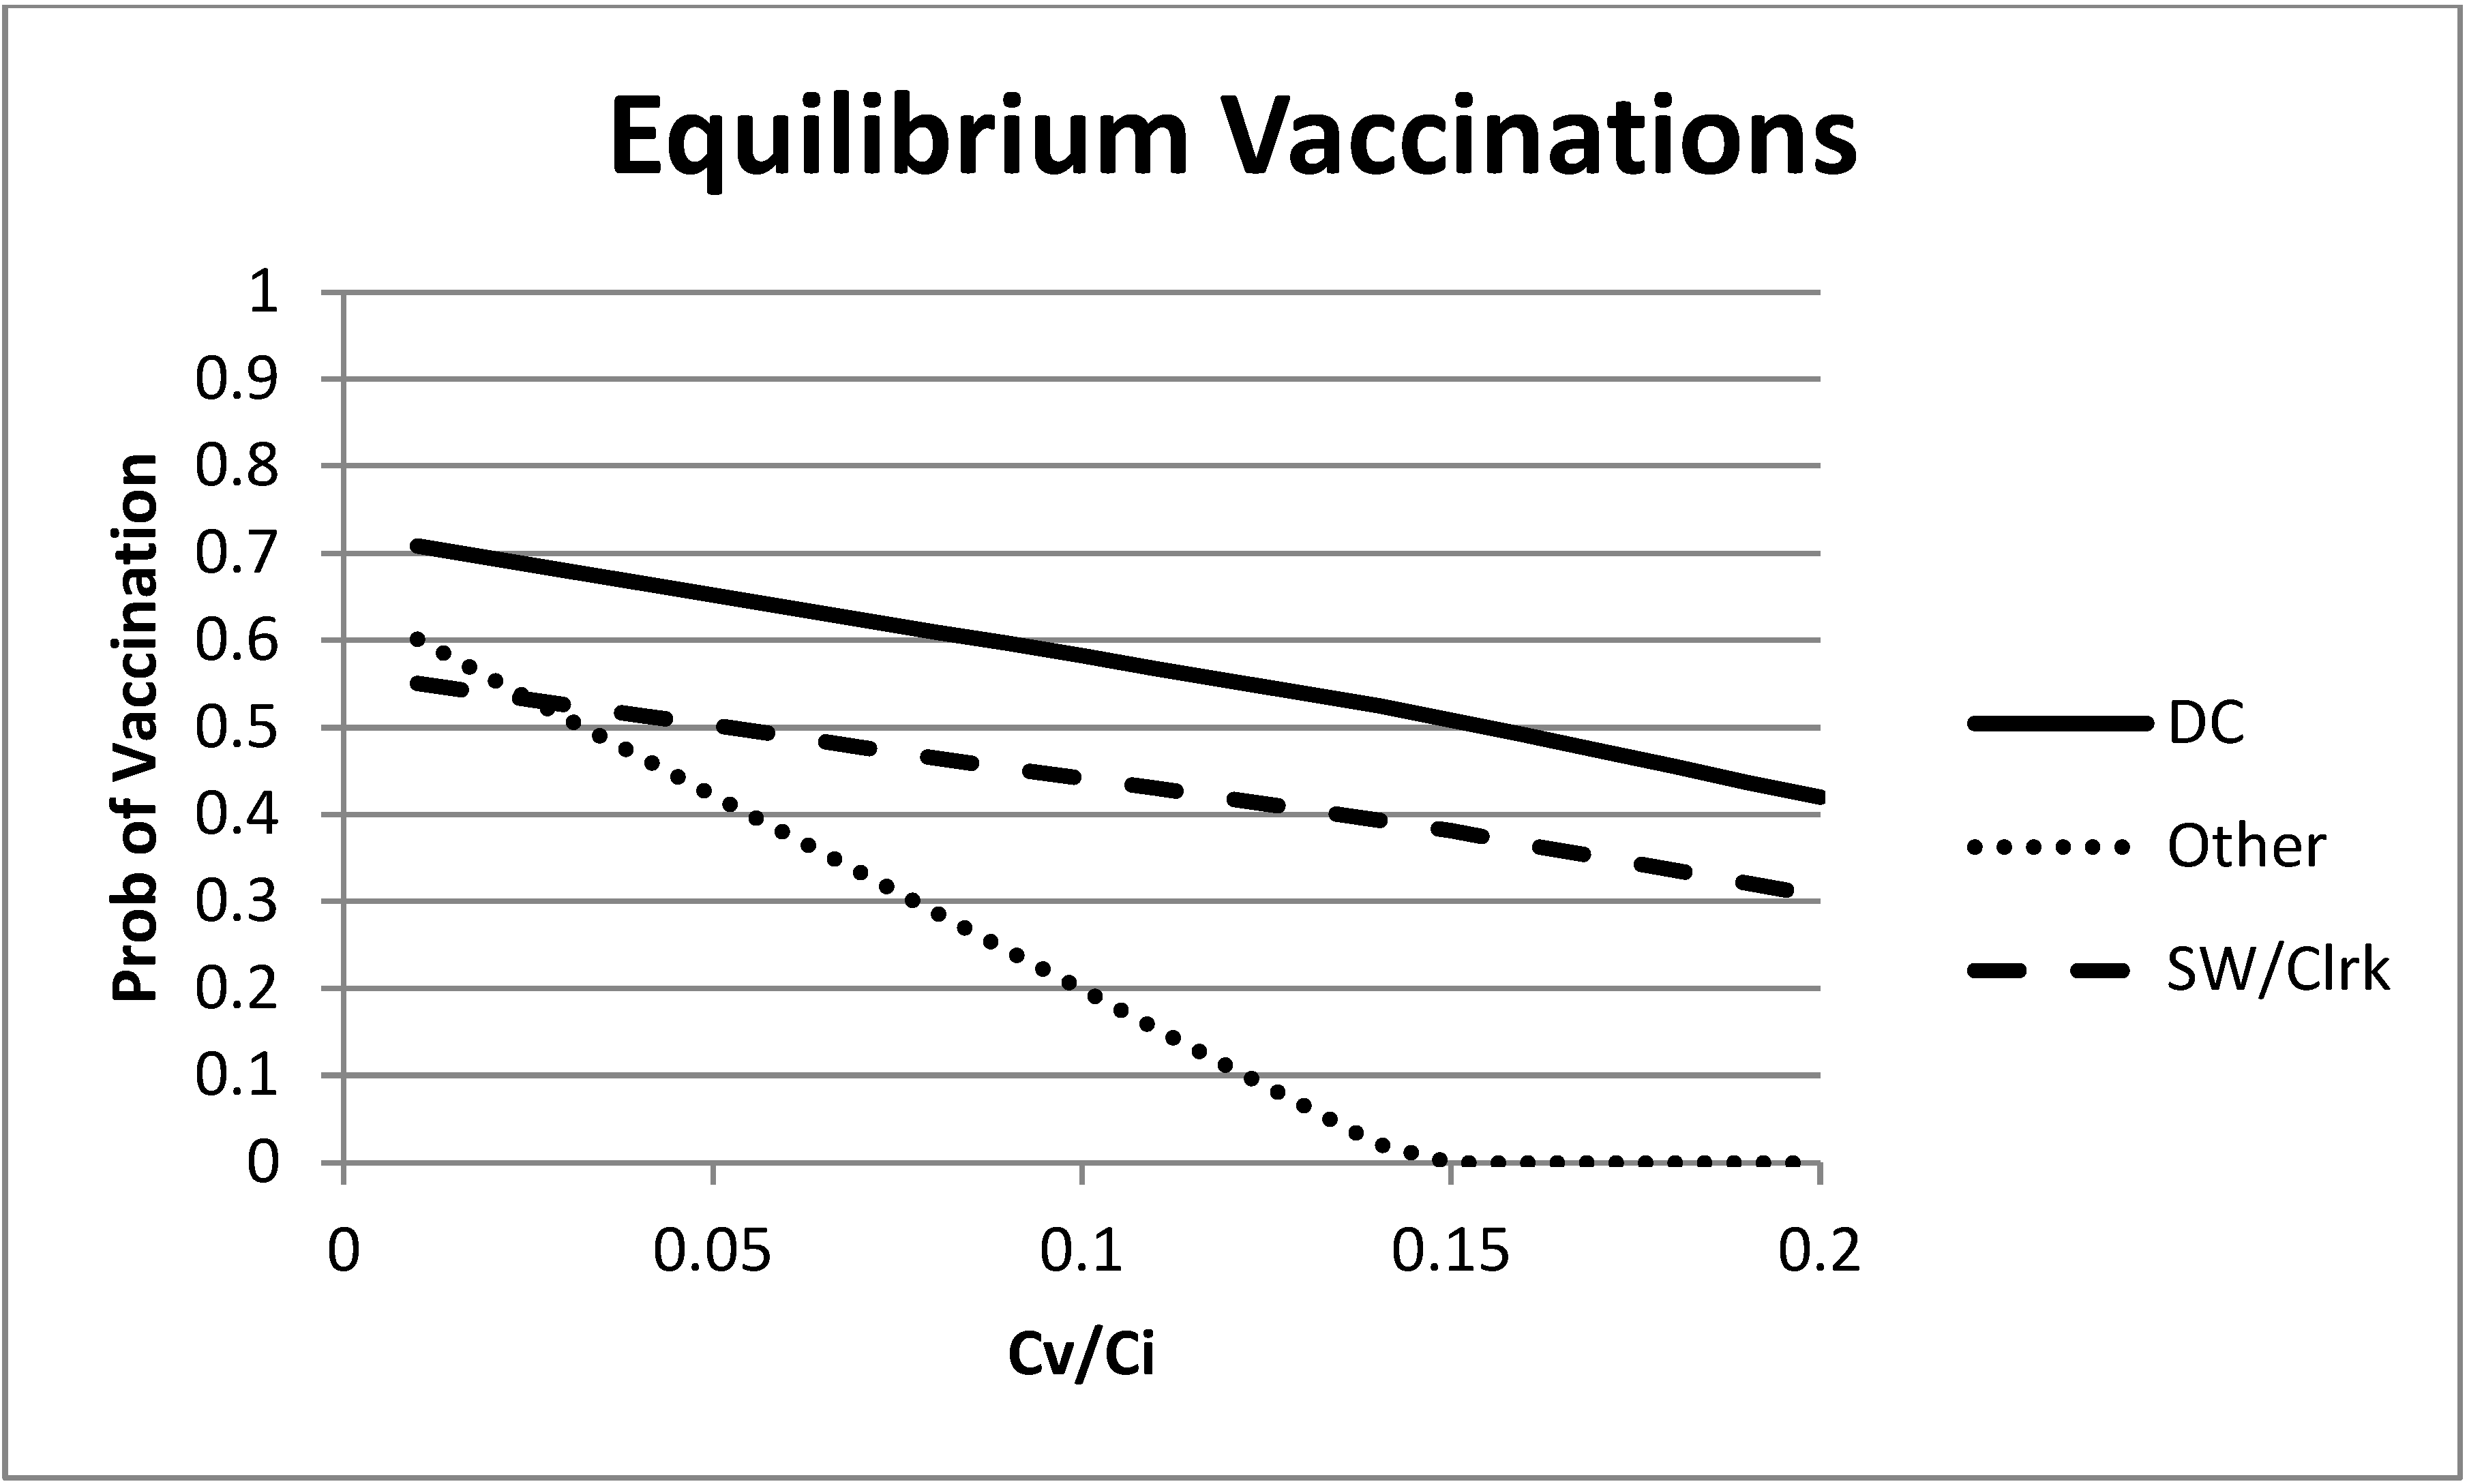
Figure 2. What is most interesting is the varying slopes of the change in equilibrium vaccination rates. For high levels of λ (a high cost of vaccination or a low cost of infection), the “remaining” group has a much lower equilibrium vaccination rate, as expected, due to their lower rate of infection in the absence of vaccinations. As the cost of vaccination increases, the “remaining” group responds much more strongly than the first two groups. This largely occurs because of the low probability of infection for the “remaining” group, as well as the relatively large (in comparison to their base infection rate) marginal effect of direct care workers on the “remaining” group. However, as λ decreases, the differences largely vanish. We also note that we bound the calculation of equilibrium vaccination probability between zero and one.
Figure 2.
Mixed strategy equilibrium vaccination choices as a function of the ratio of vaccination and infection costs.
Figure 2.
Mixed strategy equilibrium vaccination choices as a function of the ratio of vaccination and infection costs.
5. Peer Effects
One additional behavioral feature can easily be added to the above model, that of peer effects. The model above suggests that some individuals would like to free-ride on the vaccine choices of others. If you get a vaccine, I have less of an incentive to be vaccinated myself. Potentially tempering these selfish motives are peer effects. I may feel guilty or be shunned by friends and contacts if it is known that I am free riding on their costly choices to be vaccinated. Or, for reasons of social pressure, I may be more predisposed to make the same vaccination choices as my interaction partners.
Peer effects such as these can easily be incorporated into a game theoretic model in the following manner. Suppose that individual
i receives a bonus to her payoff if she matches the vaccine decision of her interaction partner
j. Let this bonus be
τ. Now, rewrite the payoff matrix for the two-person game as:
| | Agent j |
| | Vac | No Vac |
| Agent i | Vac | −cvac + τ | −cvac |
| No Vac | 0 | −πjαcinf + τ |
We assume that the peer effects are positive, . Obviously, if , the analysis is identical to that above. Thus, we concentrate on the case where τ is strictly positive. Depending on the size of τ, new Nash equilibria may occur in the game. For instance, it is easy to see that if the peer effect, τ, is larger than the cost of vaccination, , then both individuals choosing to be vaccinated is now a Nash equilibrium. Each agent choosing no vaccination is also a possible equilibrium here. Note that when we move to the multiple player game, we will use the average peer effect bonus. In other words, the peer effect bonus for player i will be τ multiplied by the fraction of game partners whose strategy matches player i.
5.1. Nash Equilibrium with Peer Effects in a Two-Person Game
We consider each possible set of Nash equilibria in the two-person game in turn. We begin with the possibility of a unique pure strategy Nash equilibrium. As mentioned above, both players choosing to vaccinate is a Nash equilibrium if . Further, it will be the only Nash equilibrium if, in addition, or . Thus, when the cost of a vaccination is low enough, peer effects can increase the vaccination rate in the population, as long as they are not large enough to create a second Nash equilibrium, where both players choose to not be vaccinated.
The next unique pure strategy Nash equilibrium occurs when and . Here, each player choosing not to vaccinate is the best response to either strategy of the other player. Thus, both players choosing not to vaccinate is a Nash equilibrium. This is equivalent to and . We again see that peer effects being large enough, but not too large, can lead to a unique pure strategy Nash equilibrium. There are two items of note here. First, peer effects can be good in that they may create an equilibrium where everyone chooses to be vaccinated, which did not previously exist. However, peer effects may also be bad in that they reinforce an equilibrium where everyone chooses not to be vaccinated. The key for policy is to attempt to encourage peer effects only when they lead to socially beneficial outcomes.
There is also the possibility of a mixed strategy Nash equilibrium with peer effects. Again, write the expected payoff of each strategy for player
i using
as the probability the other player chooses to be vaccinated:
and:
Setting the expectations equal and solving for
yields:
This is the probability of player j choosing to be vaccinated that makes player i indifferent between a vaccination and no vaccination. Additionally, recall that for identical player payoffs, the same equation (with reversed player subscripts) defines the probability of player i being vaccinated that makes player j indifferent. If both play with these probabilities, it is a Nash equilibrium.
The equation also helps us to define the regions of the parameter space where each of the equilibria previously discussed exist. In order for the mixed strategy Nash equilibrium to be well defined, it must be the case that ; otherwise, it is not a proper probability. Now, let us consider two cases where this mixed strategy Nash equilibrium may occur.
First, suppose that the numerator is positive, . This is equivalent to , which means that no vaccination is the best response to no vaccination. Further, if , then vaccinate is the best response to vaccinate and , because the denominator is larger than the numerator. This is the case of a coordination game with two pure strategy Nash equilibria (<vaccinate, vaccinate> and <not vaccinate, not vaccinate>) and a mixed strategy Nash equilibrium given by the equation above. In a game such as this, the mixed strategy Nash equilibrium is usually unstable. Thus, most attention should be paid to the two pure strategy Nash equilibria in this case.
Second, suppose instead that , which is equivalent to . This means that choosing to be vaccinated is the best response to the other player not being vaccinated. Further, if , then not being vaccinated is the best response to the other player being vaccinated. Thus, there is no pure strategy Nash equilibrium, and the only Nash equilibrium will be in mixed strategies. Further, both the numerator and denominator of the mixed strategy equation will be negative in this case, and the ratio will be less than one, because . Thus, again, . In a game with a unique mixed strategy Nash equilibrium such as this, the equilibrium is usually stable.
5.2. Peer Effects in a Multi-Player Heterogeneous Contact Game
We now move to a multi-player game with peer effects. Define the fraction of the group
h contacts that connect to group
g as
. One can then write the expected payoff to each strategy as:
where, again,
is the probability of a group
g member being vaccinated.
If we set these two expectations equal to each other, we get:
which can be simplified to:
Again, if we use linear and separable terms to represent
,
, we have:
From this, one can isolate the term to arrive at the following equilibrium equation that must hold for all groups h.
Note that the carries through all of the terms of the equation. This term is balancing out the cost of a potential infection relative to the potential benefit of matching for a peer effect bonus, τ. This equation is balancing out the marginal effect of vaccinations from each group on the probability of infection and the peer effects if matching with agents who make the same vaccination decision.
5.3. Peer Effects Example
We again use the hospital worker dataset as an example to study equilibrium vaccination decisions, but this time, also adding in the peer effects. With the peer effects introduced, there are now three free parameters, and . To simplify, we normalize to one and vary τ and (which is now equal to λ given ).
Using the contacts in
Table 2, one can calculate the contact shares for each group,
, given in
Table 6. In the table, note that both the direct care group and the social worker/clerk group has a majority of contacts with the direct care group (social workers and clerks have 66% of their contacts with the direct care group and only 29% with their own group). Both of these groups have only a small share of their contacts with the “remaining” group. Alternatively, the contacts of the “remaining” group are spread out relatively evenly over all three groups (34% with direct care, 27% with social worker/clerk and 39% with themselves).
Table 6.
Observed hospital worker contact shares. The values in the table represent the fraction of contacts of the row group that come from the column group.
Table 6.
Observed hospital worker contact shares. The values in the table represent the fraction of contacts of the row group that come from the column group.
| Direct Care | SocWrk/Clrk | Remaining |
|---|
| Direct Care | 0.68 | 0.27 | 0.05 |
| SocWrk/Clrk | 0.66 | 0.29 | 0.05 |
| Remaining | 0.34 | 0.27 | 0.39 |
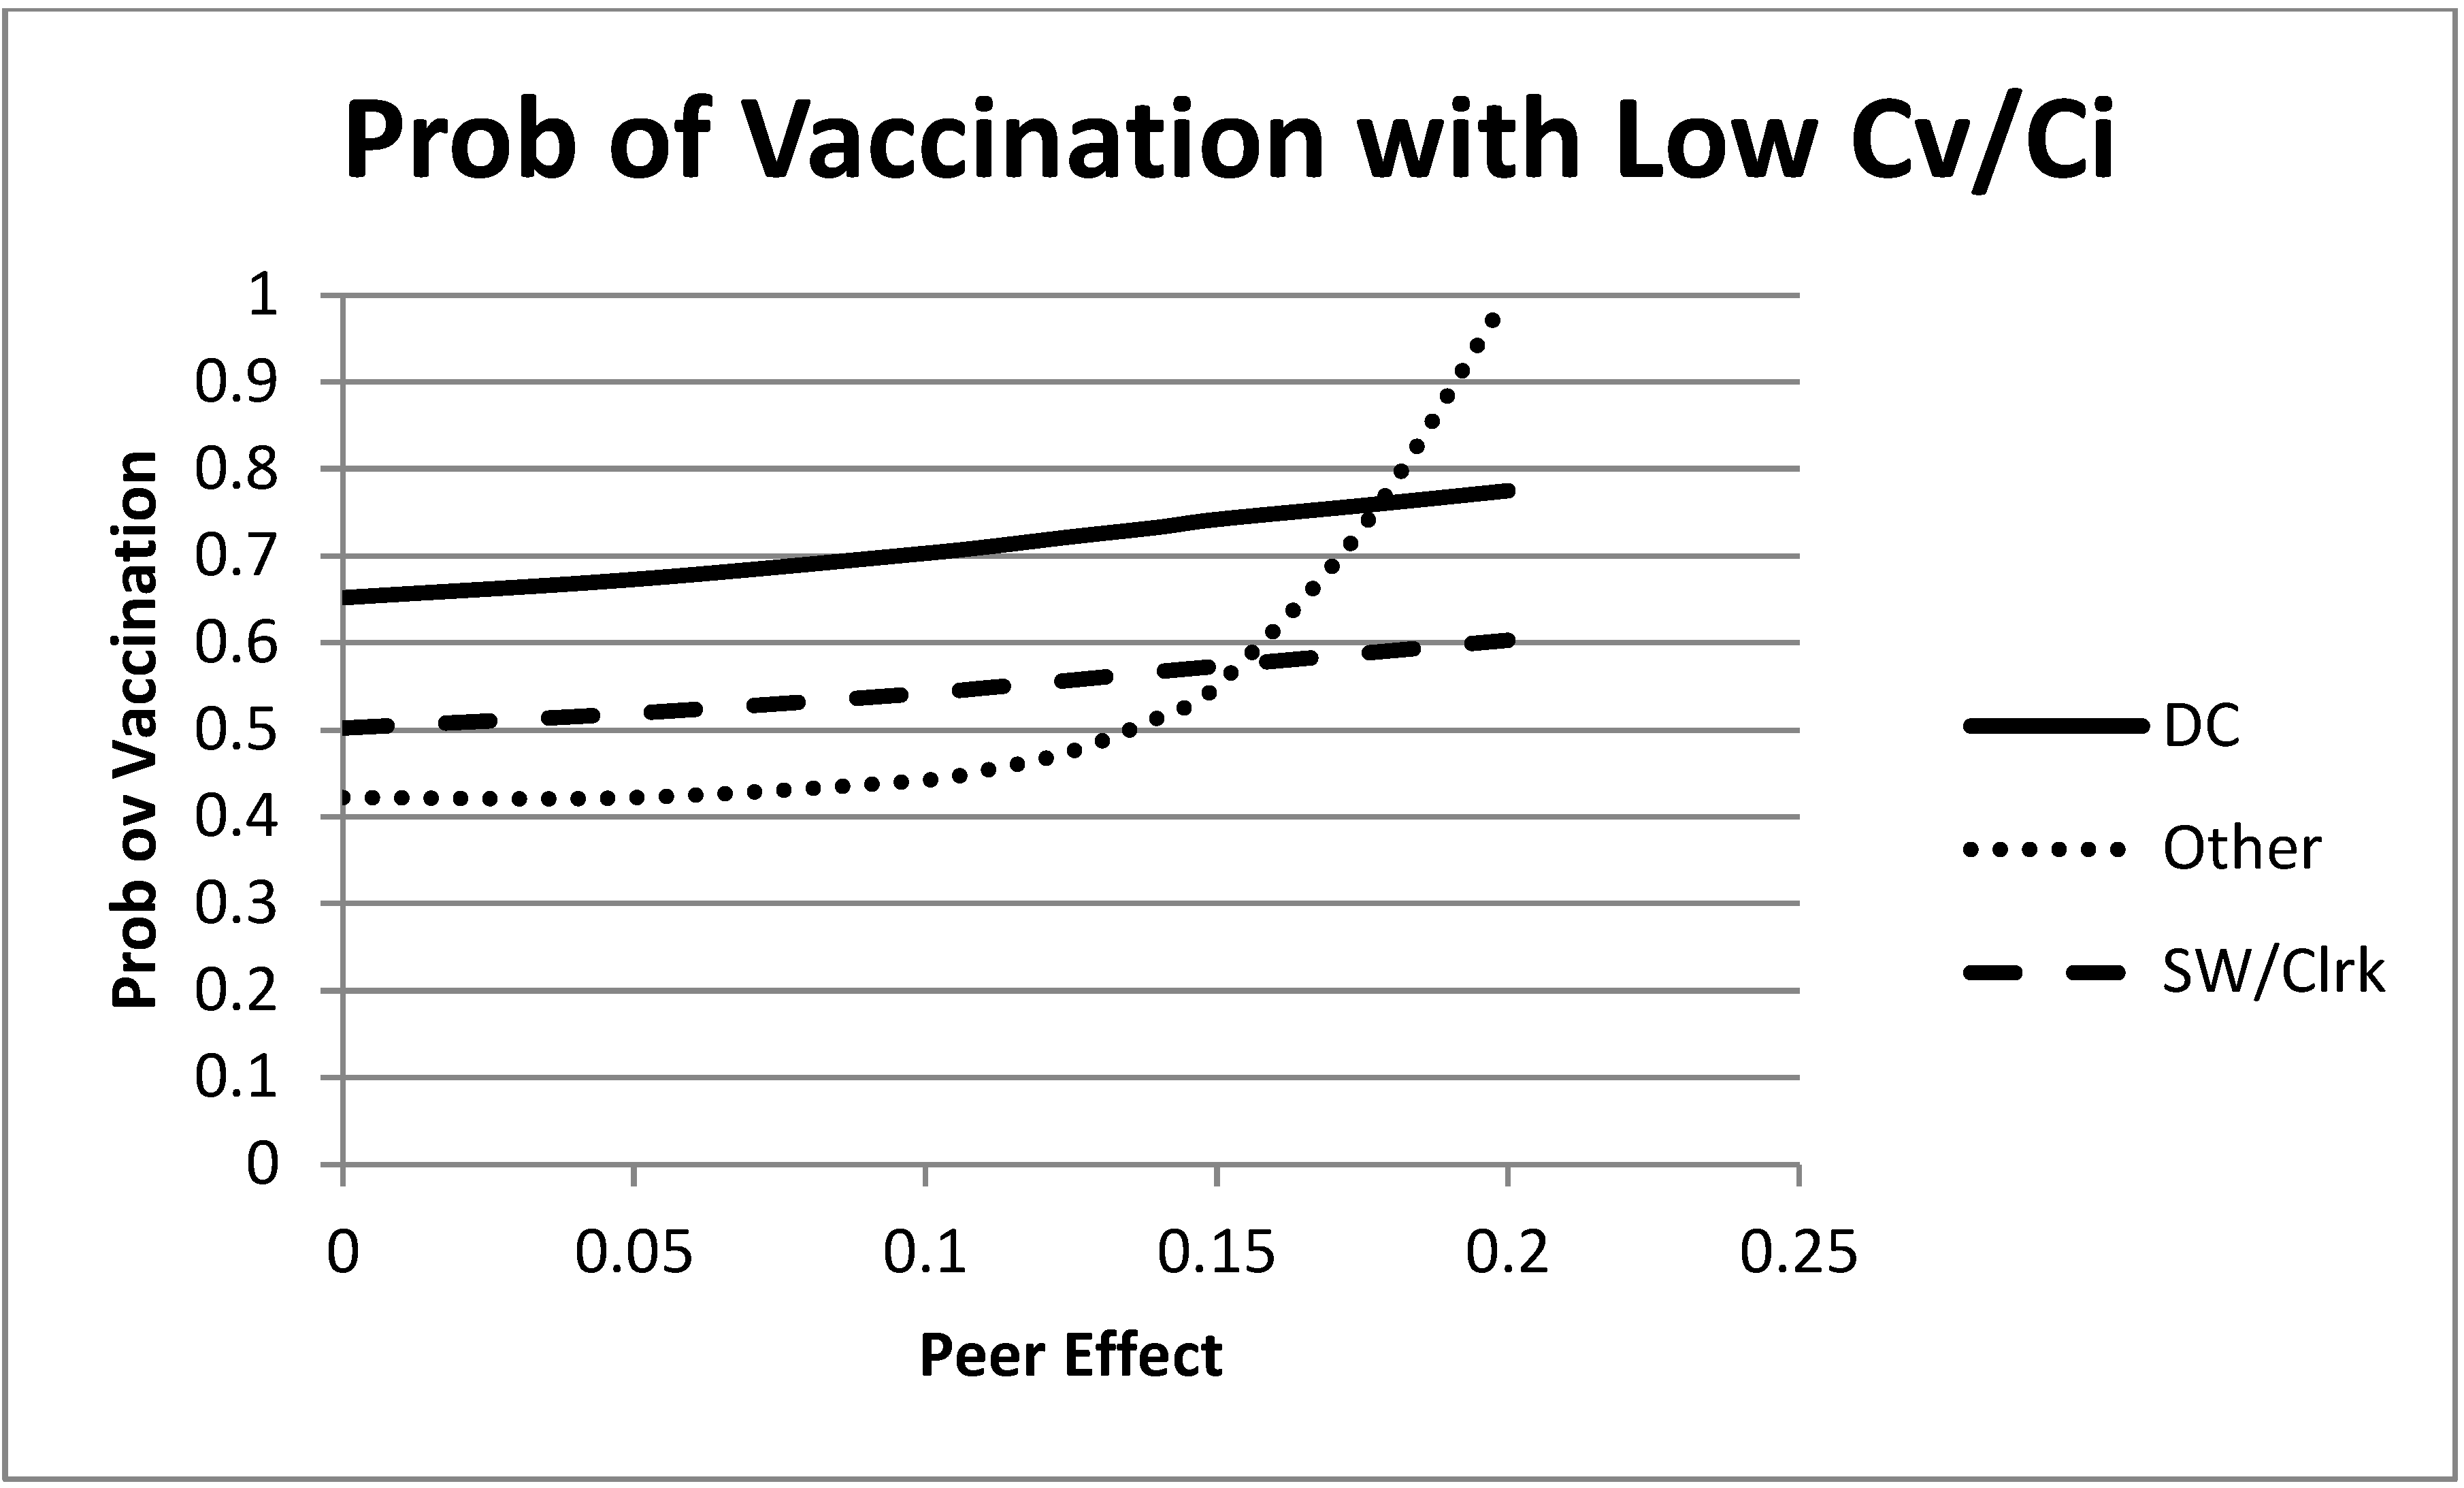
We begin the analysis with a low value of
in
Figure 3. Without peer effects, this value yielded intermediate vaccination levels for each of the groups (the intercept with the vertical axis of the figure). When the peer effects are introduced, we see an increase in the vaccination rate for each group. Most interesting in this example is the large effect on the equilibrium vaccination rate of the “remaining” group as
τ grows. As the peer effects become more important, the “remaining” group sees a large increase in the equilibrium vaccination level. This is partly due to the marginal effects of vaccinations, but also due to the mixing patterns. Recall that the “remaining” group had a relatively low base infection rate. This is giving the “remaining” group more latitude to take advantage of matching the decisions of others and capturing the peer effect bonus. Furthermore, note that peer effects and the mixing patterns may lead this group to have the highest vaccination rate, even though they have the lowest probability of infection (in the absence of vaccinations). This example largely follows the intuition of the first paragraph given in
Section 5.1. When the cost of vaccination is sufficiently low relative to the cost of infection, peer effects can increase vaccination rates.
Figure 3.
Mixed strategy equilibrium vaccination choices as a function of the size of the peer effects. In this figure, λ is small, . All groups increase their equilibrium vaccination rate as peer effects increase.
Figure 3.
Mixed strategy equilibrium vaccination choices as a function of the size of the peer effects. In this figure, λ is small, . All groups increase their equilibrium vaccination rate as peer effects increase.
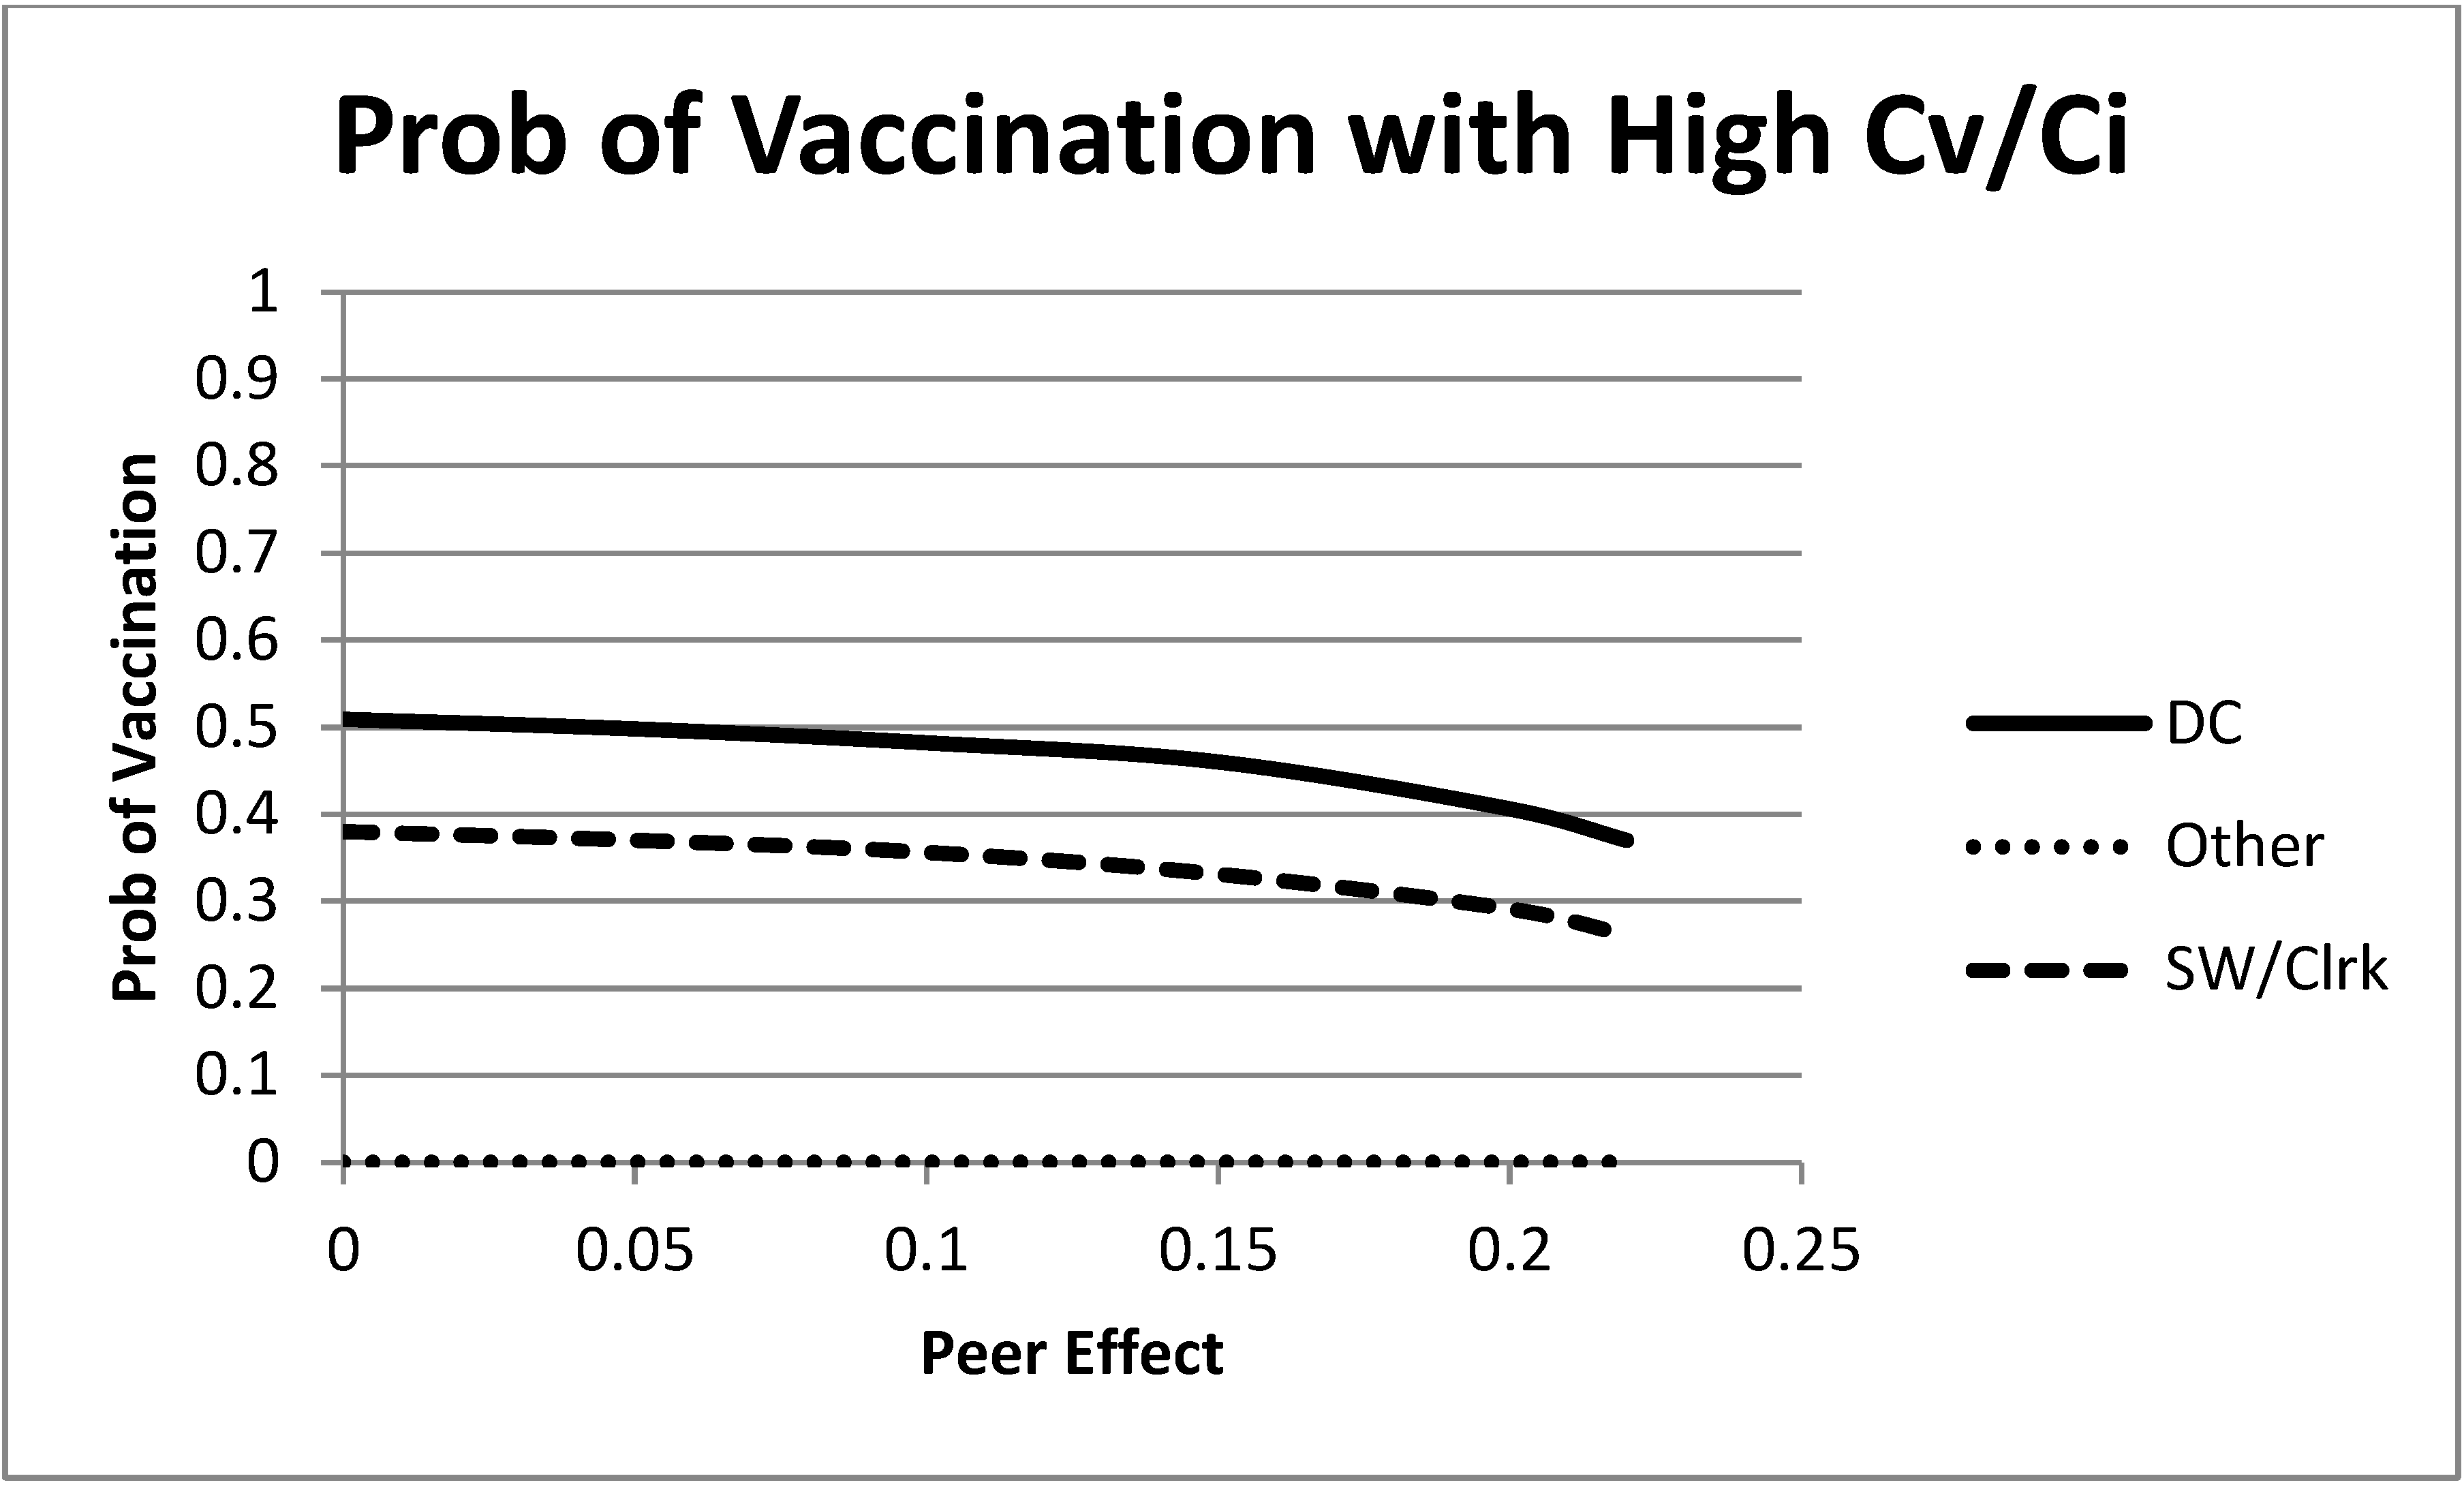
Now, move to a larger cost of vaccination,
. The equilibrium choices are shown for this case in
Figure 4. In this case, each of the groups is starting with a relatively low probability of vaccination (the “remaining” group is already at zero for this level of vaccination cost) Then, as the peer effects increase, the groups decrease their equilibrium vaccination probability in order to match more frequently and take advantage of the peer effect bonus. The peer effect benefits of matching others causes decreases in the equilibrium vaccination behavior when the cost of vaccination is large enough.
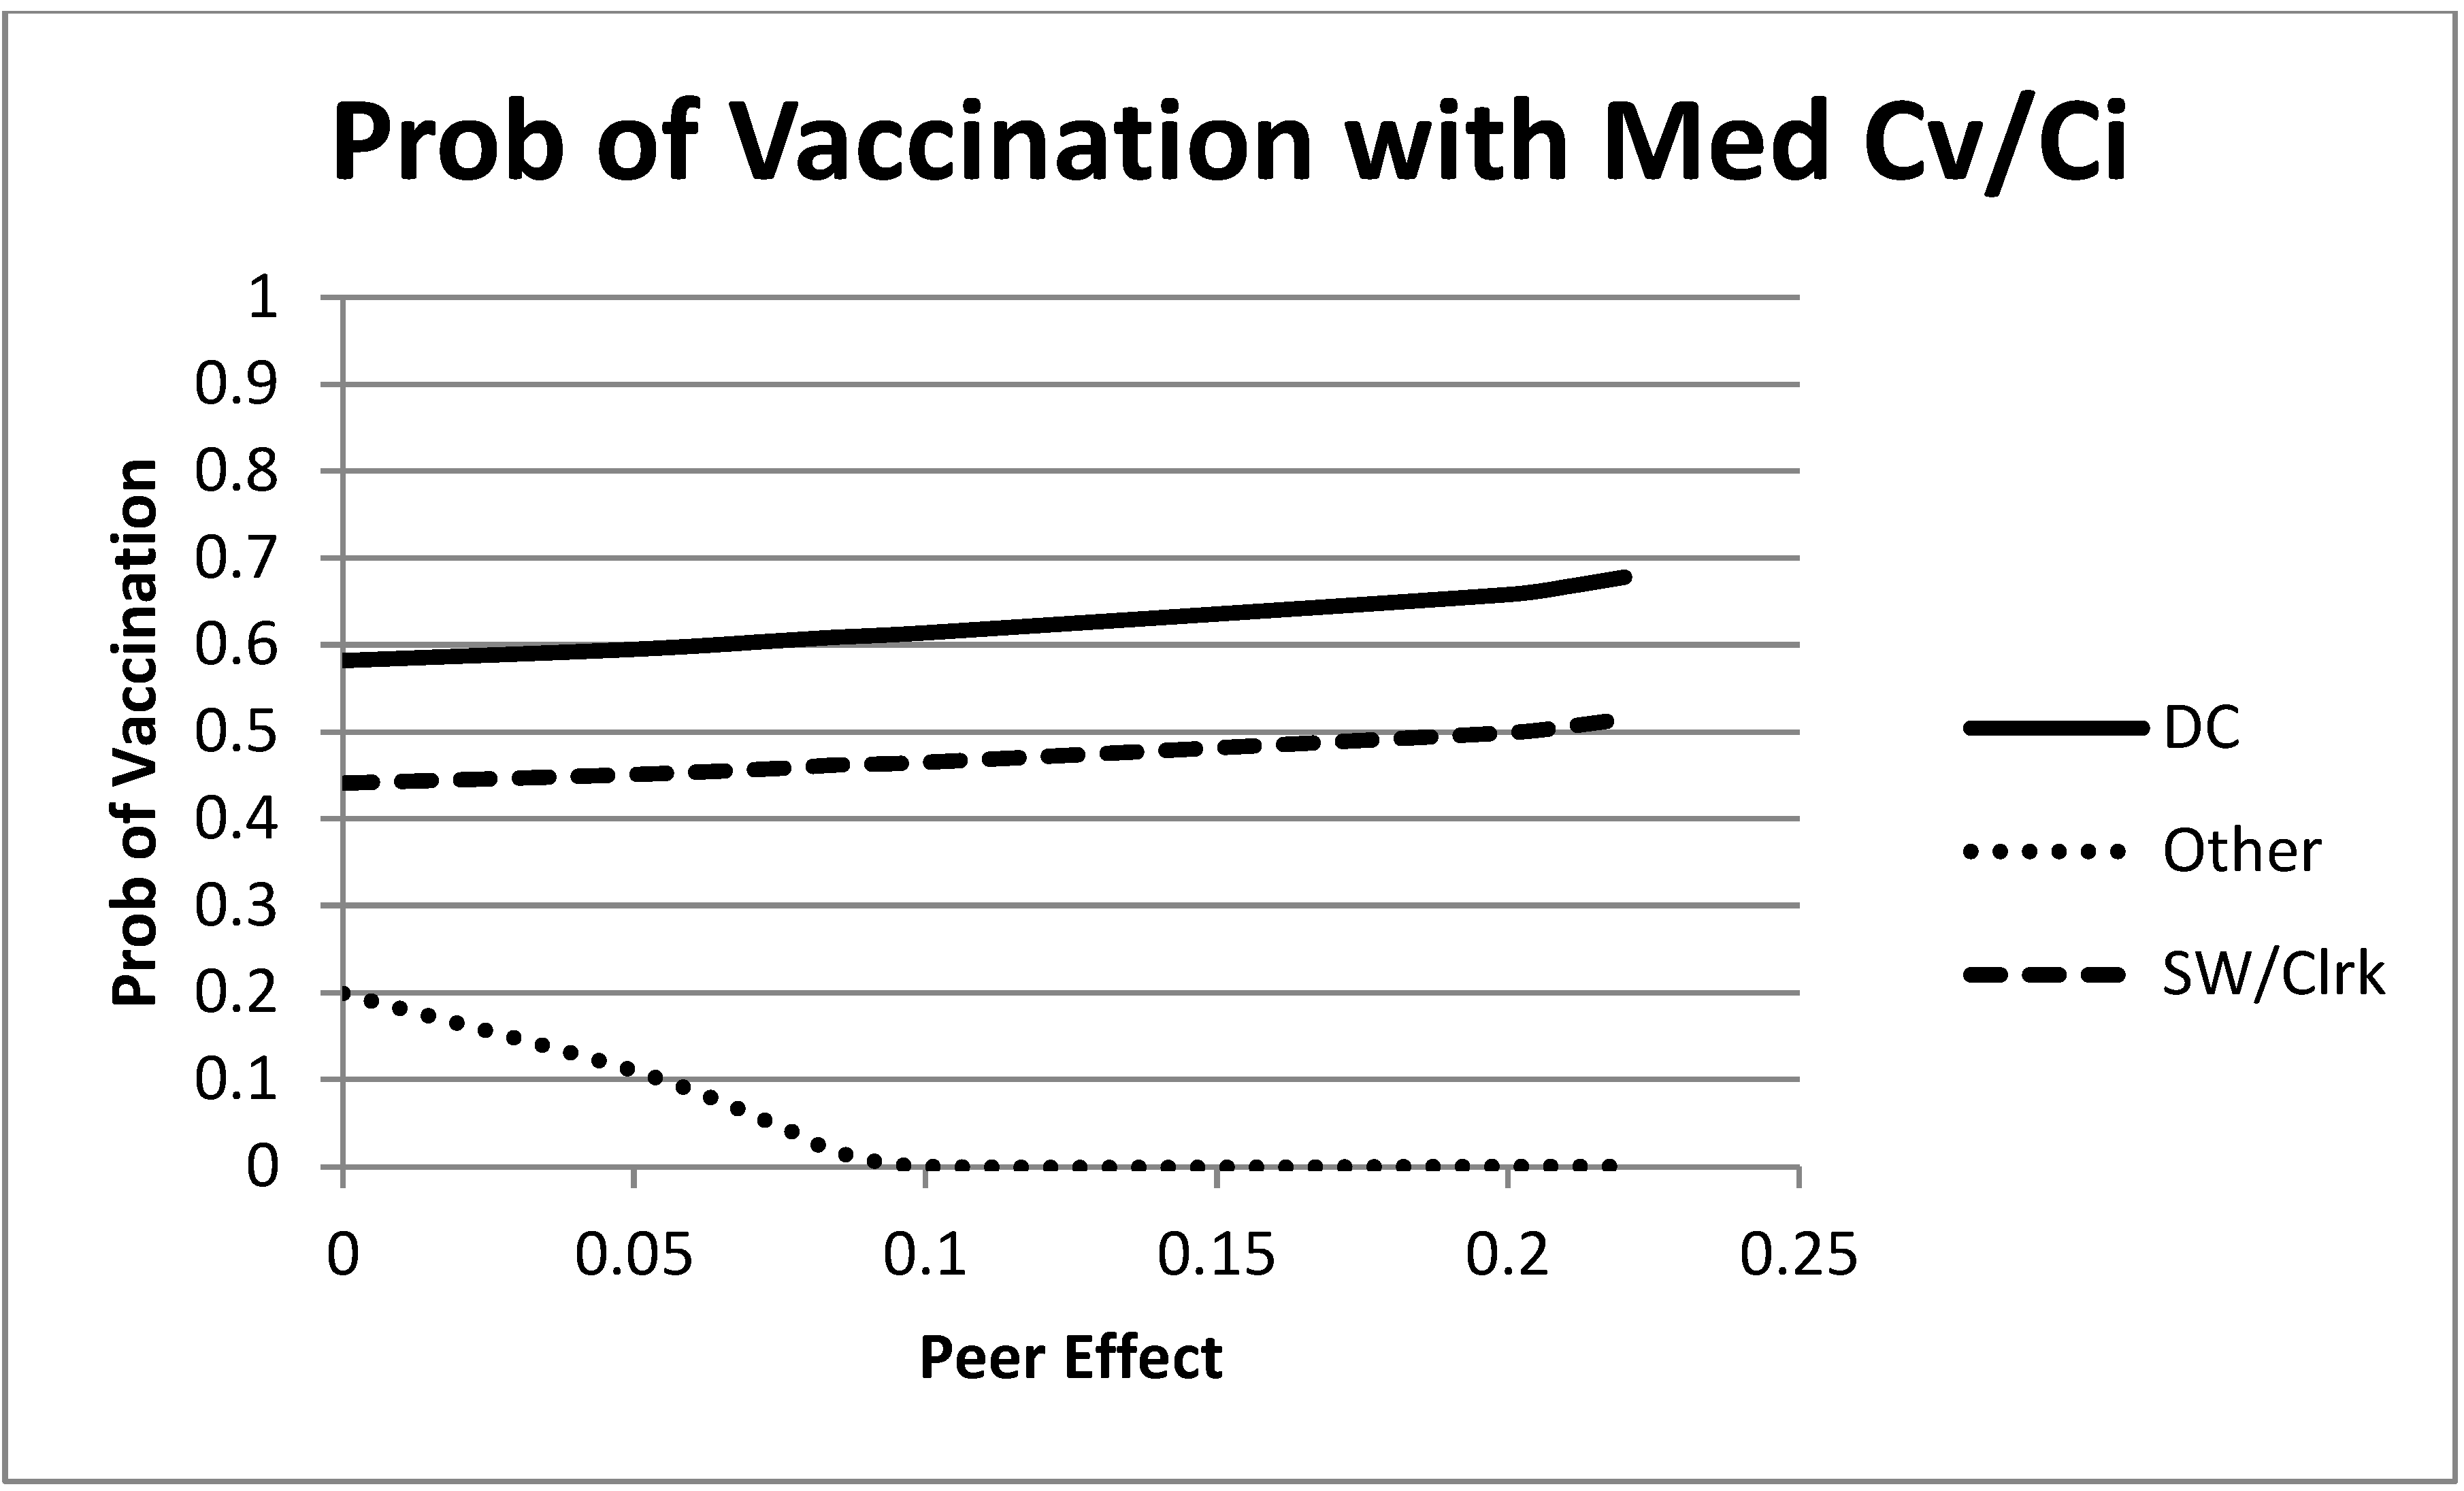
An interesting intermediate vaccination cost case is shown in
Figure 5,
. At this level of λ and no peer effects, two of the groups have a relatively high probability of vaccination, and the “remaining” group has a low probability. As the peer effects increase, the “remaining” group decreases its probability of vaccination and the direct care and social worker/clerk group increase theirs. To better understand this result, recall that the majority of contacts of each of the direct care and social worker/clerk groups are with the direct care group. Thus, when the direct care group begins with a high probability of vaccination, this pulls these two groups upward. On the other hand, the “remaining” group has its largest share of contacts with itself (which has an initial low probability of vaccination). Thus, the peer effects lead to a decrease in the “remaining” group probability of vaccination.
Figure 4.
Mixed strategy equilibrium vaccination choices as a function of the size of the peer effects. In this figure, λ is large, . All groups decrease their equilibrium vaccination rate as peer effects increase.
Figure 4.
Mixed strategy equilibrium vaccination choices as a function of the size of the peer effects. In this figure, λ is large, . All groups decrease their equilibrium vaccination rate as peer effects increase.
Figure 5.
Mixed strategy equilibrium vaccination choices as a function of the size of the peer effects. In this figure, λ is an intermediate value, . At this level of λ, the direct care and social worker/clerk groups increase their equilibrium vaccination rate, and the “remaining” group decreases their equilibrium vaccination rate as peer effects increase.
6. Conclusions
In this paper, we have used a simple game theoretic model of vaccine choice to analyze equilibrium outcomes of vaccine decisions. The model is applied in a unique and detailed hospital contact dataset. The most interesting results concern the influence of peer effects on strategic vaccination decisions. Although game theoretic models have been used to study vaccination decisions before, the analysis has not widely considered the peer effects that we do here. We see from the preliminary analysis that peer effects can lead to important and potentially unexpected outcomes in vaccination rates.
This paper is one demonstration of why computational models of infectious disease are needed. In most cases, a researcher or an individual cannot observe the transmission of an infectious disease. If someone is infected with influenza, for example, in a hospital setting, there are myriad ways in which the transmission could have occurred. Additionally, it is likely impossible to uncover detailed knowledge of transmissions using traditional statistical methods. However, with computational techniques, like those used in this paper, one can track the potential path of transmissions in a rigorous way once one knows the pattern of contacts. Thus, the field of computational epidemiology is extremely important for better understanding patterns of disease transmission, both within specified organizations and globally.
In carrying out the analysis in this paper, several simplifying assumptions were employed. We mention two particularly important ones here. First, in our model, we assume that individuals make vaccination decisions simultaneously and prior to the beginning of an epidemic. Because of the complexity involved in connecting a game theoretic model to our data, we feel that this was a good first step to take. However, there exists a rich and important area of research in connecting models and data such as ours with dynamic vaccination decisions as an epidemic unfolds. Second, we have assumed that agents in our model use a linear approximation for the effect of vaccinations on infection probabilities. This approach yields agents that are fairly sophisticated, but not fully rational, as these effects are known to be nonlinear. We expect that comparison of our model to others that consider both more rational agents and less rational agents who, perhaps, use rule of thumb behavior would be fruitful. In addition, we should also be careful to restrict attention to the results in this paper where vaccination rates are not too large. For large vaccination rates, the linear marginal effects used in this paper are not a good approximation.
While the focus of this paper is on vaccine choices of individuals in a specific organizational setting, the methods used in this paper could be applied to many other workplaces or organizations. While vaccine decisions are of specific interest here, the methods that we employ could be easily extended to other behaviors. For example, the potential for free-riding behavior associated with vaccine choice is similar to shirking in many group-based workplace environments. Further, the equilibrium vaccine choices are partially driven by the interaction patterns within the hospital. Therefore, a role exists for considering the effects of organizational structure on the behavior of individuals within the organization. Structure not only impacts efficiency and functionality directly, it may also have an impact indirectly by influencing the behavior of individuals within the organization.


