Using PS-InSAR with Sentinel-1 Images for Deformation Monitoring in Northeast Algeria


1
State Key Laboratory of Information Engineering in Surveying, Mapping, and Remote Sensing, Wuhan University, Wuhan 430079, China
2
Ecole Normale Supérieure Constantine, Constantine 25000, Algeria
*
Author to whom correspondence should be addressed.
Geosciences 2019, 9(7), 315; https://doi.org/10.3390/geosciences9070315
Submission received: 5 June 2019
/
Revised: 27 June 2019
/
Accepted: 28 June 2019
/
Published: 17 July 2019
(This article belongs to the Special Issue SAR Applications in Engineering Geology and Structural Engineering)
Abstract
:Constantine city, Algeria, and its surroundings have always been affected by natural and human-induced slope instability and subsidence. Neogene clay-conglomeratic formations, which form the largest part of Constantine city, are extremely sensitive to the presence of water, which makes them susceptible to landslides. Fast and accurate identification and monitoring of the main areas facing existing or potential hazardous risks at a regional scale, as well as measuring the amount of displacement is essential for the conservation and sustainable development of Constantine. In the last three decades, the application of radar interferometry techniques for the measurement of millimeter-level terrain motions has become one of the most powerful tools for ground deformation monitoring due to its large coverage and low costs. Persistent scatterer interferometry (PS-InSAR) has a demonstrated potential for monitoring a range of hazard event scenarios and tracking their spatiotemporal evolution. We demonstrate the efficiency of Sentinel-1 data for deformation monitoring in Constantine located in the northeast of Algeria, and how an array of information such as geological maps and ground-measurements are integrated for deformation mapping. We conclude this article with a discussion of the potential of advanced differential radar interferometry approaches and their applicability for structural and ground deformation monitoring, including the advantages and challenges of these approaches in the north of Algeria.
1. Introduction
With the development of differential Synthetic Aperture Radar interferometry (D-InSAR) and persistent scatterer interferometry (PS-InSAR), wide area monitoring of ground motion from space became a reality. D-InSAR is used for monitoring ground motion and measuring displacement at millimeter accuracy and large surface coverage. It allows us to study various hazards such as earthquakes [1], fault fissures, volcanoes [2], landslides, and subsidence [3,4,5,6,7,8].
D-InSAR has been successfully used over the last three decades to generate high spatial density displacement maps in centimeter/millimeter accuracy across wide areas; however, the interferogram quality is largely affected by temporal decorrelation and atmospheric disturbances. To reduce these limitations reliable deformation measurements can be obtained in a multi-image framework analyzing the spatio-temporal development of permanent scatterers (PS) [3]. PS-InSAR is used in many applications for hazard mapping and monitoring. Applications include studies of displacements from seismic events [4,5], subsidence [6,7,8], uplift, swelling, and buckling around fault streams [9]. Other applications extend to regional and local scale landslides [10,11], pre-volcanic swelling [2,12], deformation related to ground-water extraction [13], subsidence in urban areas [4], as well as subsidence due to underground activities i.e., mining and tunnels [14], ground motion subsidence, and uplift in temperate oceanic climate areas characterized by high temporal and geometric decorrelation [15].
With the launch of the Sentinel-1 constellation from the European Space Agency (ESA), global coverage with short temporal baselines became a reality, making the Sentinel-1 constellation an ideal sensor for the surface motion estimation in our test area. Sentinel-1 normally acquires data in TOPS (terrain observation by progressive scans) mode, which offers wide coverage. It has improved the data acquisition throughput and, compared to previous sensors, has increased considerably the D-InSAR and PS-InSAR deformation monitoring potential allowing long-term geohazards monitoring on a regional scale [16]. Sentinel-1 data is often used to generate regional-scale deformation activity maps for geohazards management and to prevent the potential impact of geohazards (volcanic activity, landslides, and subsidence) on urban areas [17].
Among the most frequent natural disasters in Constantine, located in the northeastern part of Algeria, are landslides. Especially eastern Algeria suffers from very dangerous landslides in its large urban area [13,14,15,16,17,18,19]. Due to increasing urbanization pressure, the construction activities around Constantine moved toward unstable land, outside of the historic old town, which was built on stable ground called “The Rock of Constantine”. In that expanding urban agglomeration, the population is living with the risk of catastrophic natural hazards through a perceived safety net of building codes and engineering solutions. Unfortunately, all concern for these hazards is often focused on their immediate impact to everyday lives and does not account for the imperceptible processes that may become significant in future [20]. Previous studies conducted in this area, had insufficient means of landslides investigation and the obtained results were partial and local. Therefore, we used PS-InSAR for monitoring the Constantine city and its surrounding, while taking into account the result of previous works.
The main objective of this study is to increase the potential of detecting active landslides and ground subsidence, to monitor and analyze the temporal evolution of detected deformations by providing time-series deformation and velocity maps. This study supports a better understanding of the distribution of deformations and their geomorphological and geological causes.
This paper is organized as follows. In Section 2, we describe the geomorphological and geological context of the study area and the main characteristics of the Constantine landslides. In Section 3, the data and methods are outlined. The results from the PS-InSAR analysis are presented in Section 4. We discuss the relationship between ground deformation and the local geomorphology. An analysis of the correlation between geology and deformation in the study area shows the potential and limits of the PS-InSAR for generating deformation maps. These results suggest future research directions.
2. Study Area Description
2.1. Geography of the Study Area
Algeria is the largest country in Africa (see Figure 1). It borders on the Mediterranean Sea with a coastline stretching close to 998 km between Morocco and Tunisia. The geography is diverse and can be divided into three zones:
- The Tellian and Saharan Atlas mountain ranges, which cross the country from the east to west;
- The fertile coastal plain in the north, where the most populated cities are, e.g., Constantine;
- The Haut Plateau region and the desert.
Nearly 80% of the country is comprised of desert, steppes, wasteland, and mountains. The Tellian Atlas stretches for nearly 1622 km along the Mediterranean coastline. It is formed by mountain ranges along the coastline and away from the coastline to the south (e.g., the mountains of Constantine in the eastern part). These mountains are often separated by valleys, sheltering rivers like the valley of the wadi Rhummel crossing Constantine.
Constantine, located in northeastern Algeria, is selected as the study area. It is the third most populated city in Algeria with 938,475 inhabitants (ONS 2008) and is one of the most ancient cities in Algeria (Cirta about 2300 years ago). It is also famous for its cultural heritage buildings, including constructions of architectural value, located at the Tellian Atlas. This is one of the regions most affected by earthquakes and slope deformations [21,22,23,24,25,26], which are the most important geohazards in the country.
The climate of the Constantine region is semi-arid, characterized by high temperatures and low humidity, with mainly two distinctive rainy and dry seasons. The dry season is from June to August with an average temperature of 28 °C, and the rainy season lasts from December to February, with about 60% of the annual rainfall amount. The frequency and intensity of the rainfall is concentrated over a short period during which rainstorms and flash floods represent the major landslides hazard factors. The hydrological network of Constantine is comprised of the Rhummel and Boumerzoug rivers (permanent flow). The tributaries of these rivers are Mellah and Megharouel in the west, and the Chaabet Ersas and Chaabet El Klab in the east flowing occasionally. The distance to the river network has influence on the landslide occurrence in the region i.e., about 30% of historic landslides were recorded along the east side of the Rhummel river.
This area shows landslides at least from October 1993, for example near the Kitouni avenue. During the night, deformations of the slope reached a speed of up to several centimeters and even decimeters per hour. Later in 2003, the depth of surfaces of the ground of each slipping block was estimated between 12–16 m using inclinometer measurements, where the general velocity of displacements rises to 4 cm/yr [27]. The main elements (head slump blocks) of the landslide occurred at the bottom of Coudiat Aty. The main body of the slip extends to the left bank of the Rhumel valley, the unstable mass was in a channel of almost 1100 m length and 300 m width, from where approximately two million tons of soil and materials was moving [28].
2.2. Geology of the Study Area
From a geological point of view the Constantine region belongs to the external domain of the Tell Atlas chain, a part of the North African Alps (Maghrebides), built during the main paroxysmal compressed phases of the Eocene and Miocene epochs [29,30] and the Quaternary period. Its variations, structure, and properties are the most important factors influencing the occurrence of landslides. Most of Constantine landslides occur in Miocene sediments and sometimes in Cretaceous materials of the Tellian sheet thrust with a large heterogeneity, stronger permeability, very sensitive water presence, and average-to-high plasticity [29,31,32].
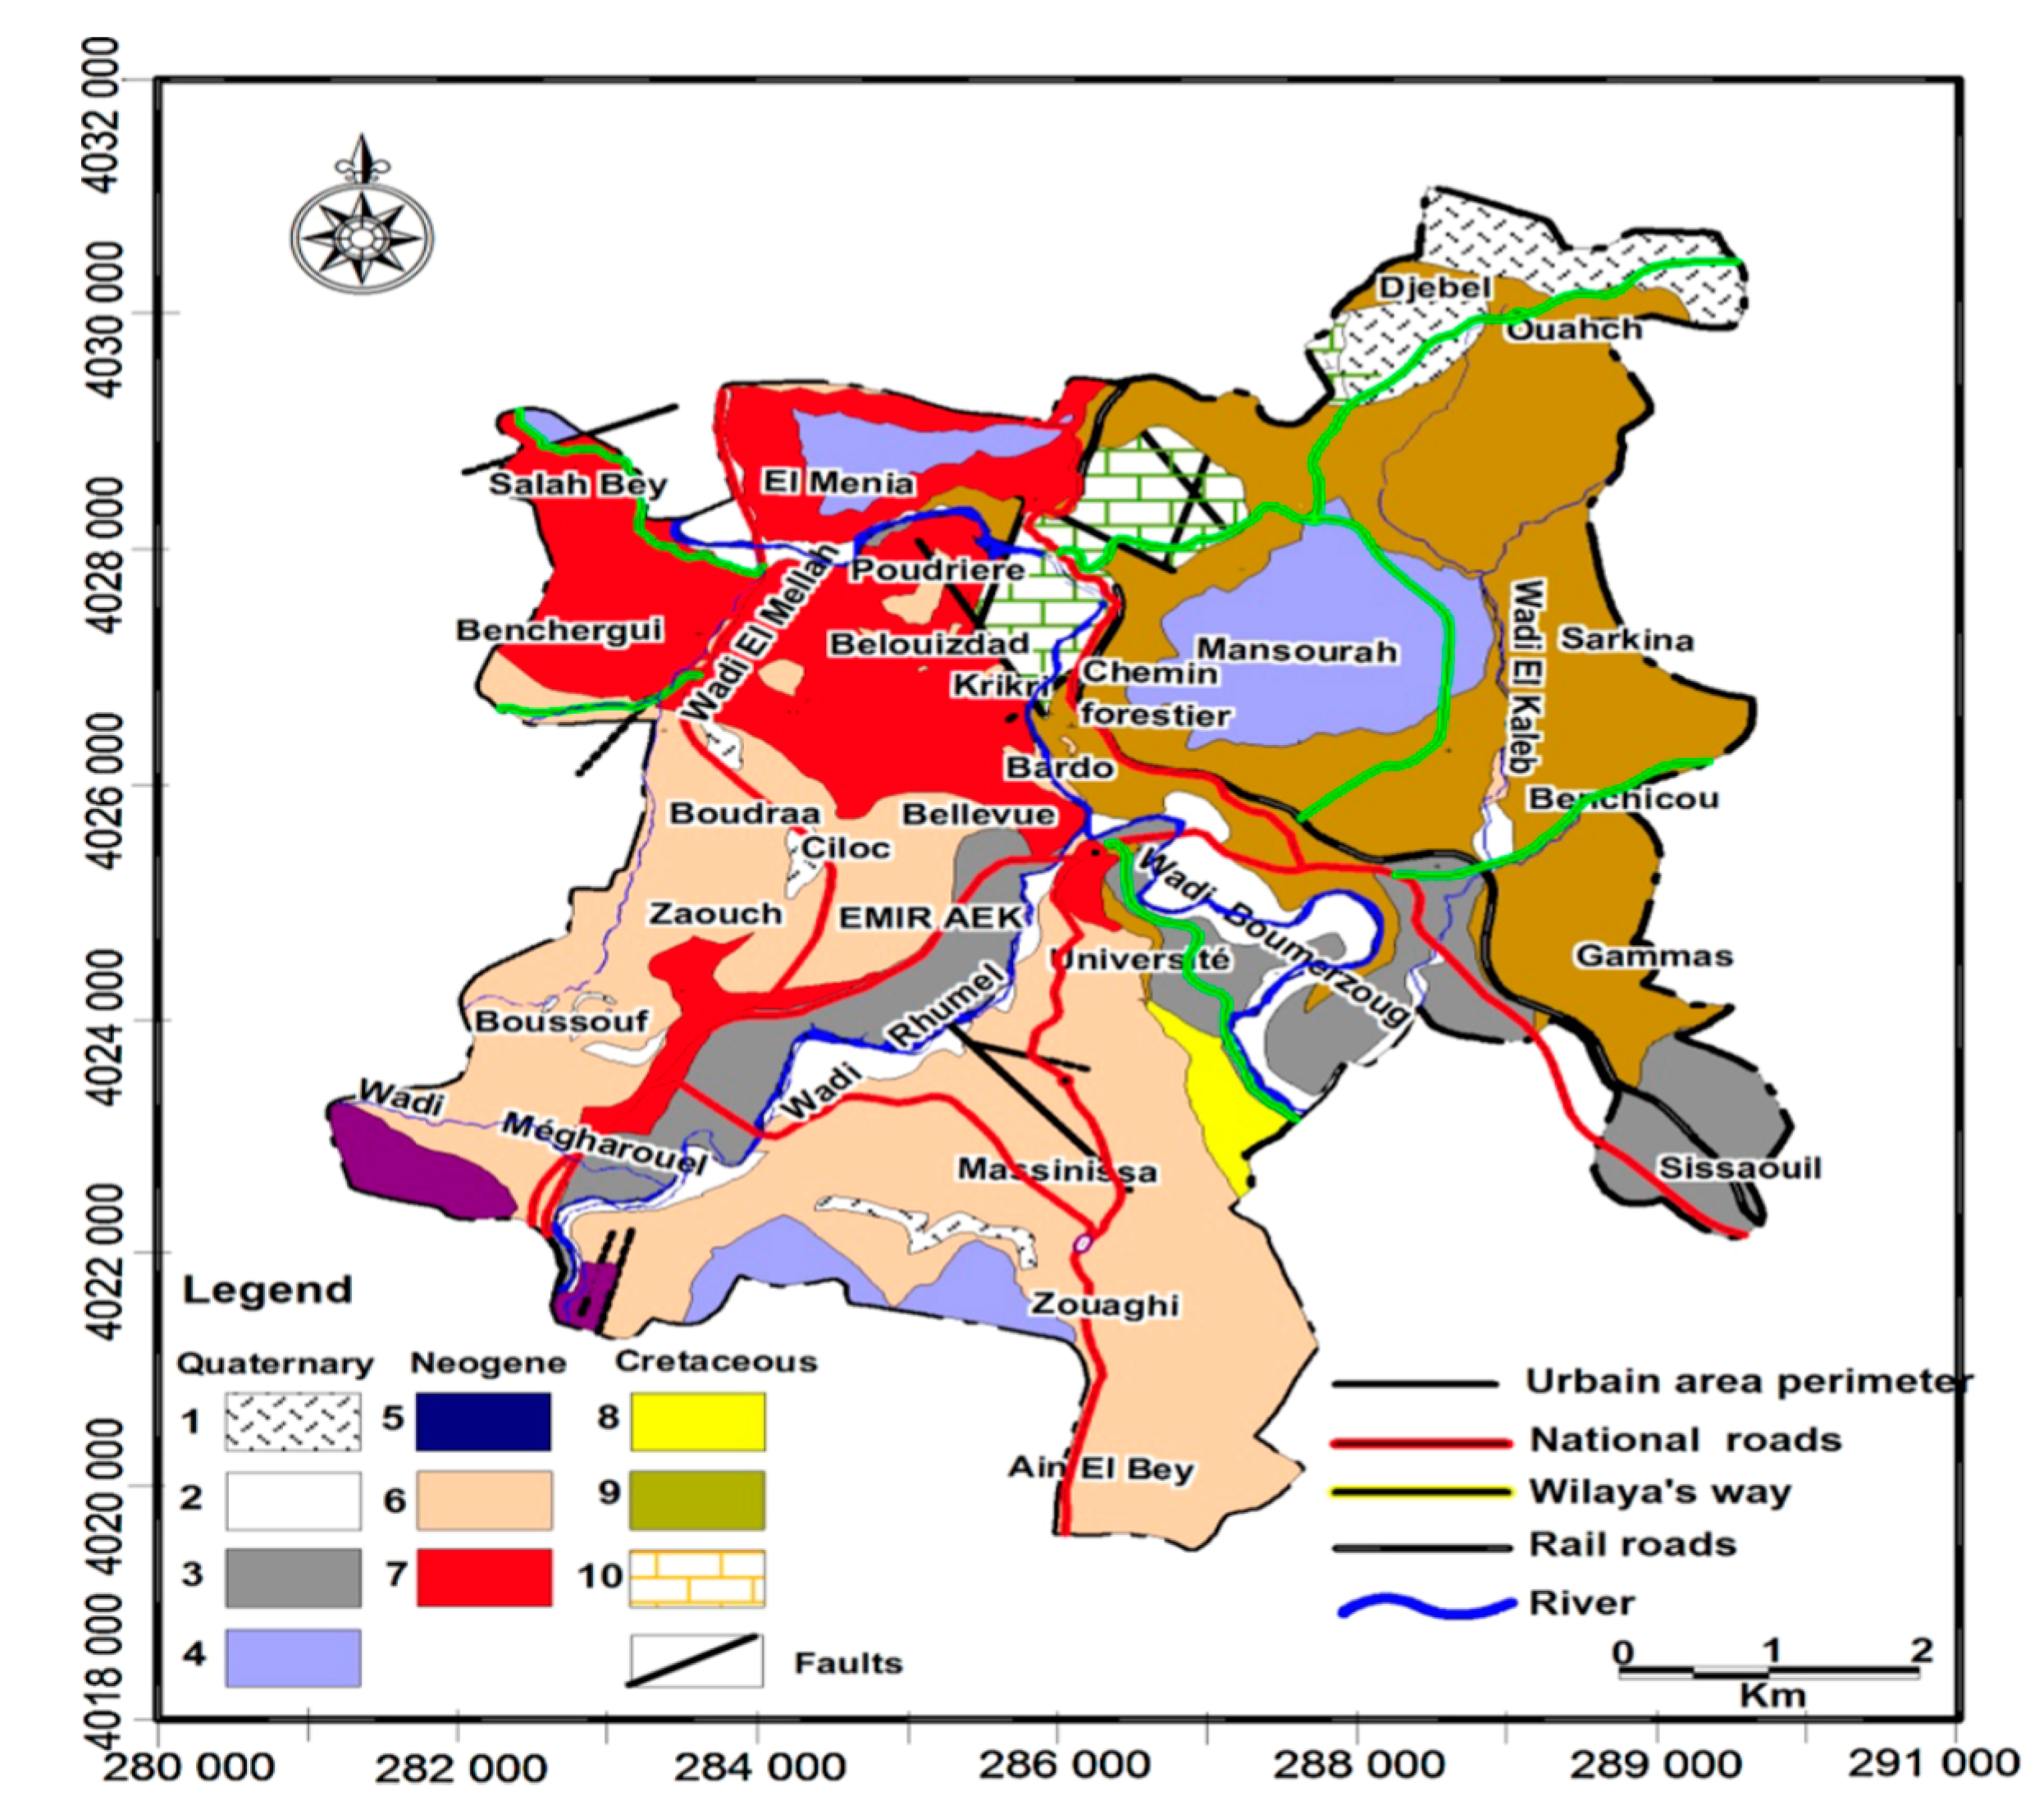
Constantine exhibits four main lithostratigraphical formations, as shown in Figure 2:
- The Cretaceous limestone and marls bed rock that belong to the Constantine neritic formation, e.g., the rock of Constantine and in d’El Ménia–Djebbas;
- The Cretaceous–Eocene marls and calcareous marls of the Tellian thrust sheet unit;
- The Mio–Pliocene sandy clays and conglomerates; this is the most widespread lithology and represents half of the area. The clayey-marl group contains local sand and gravel horizons of varying thickness. Frequent landslides take place in conglomerate interspersed with marly sediments layers [31];
- The Quaternary alluvial terraces and lacustrine calcareous formations.
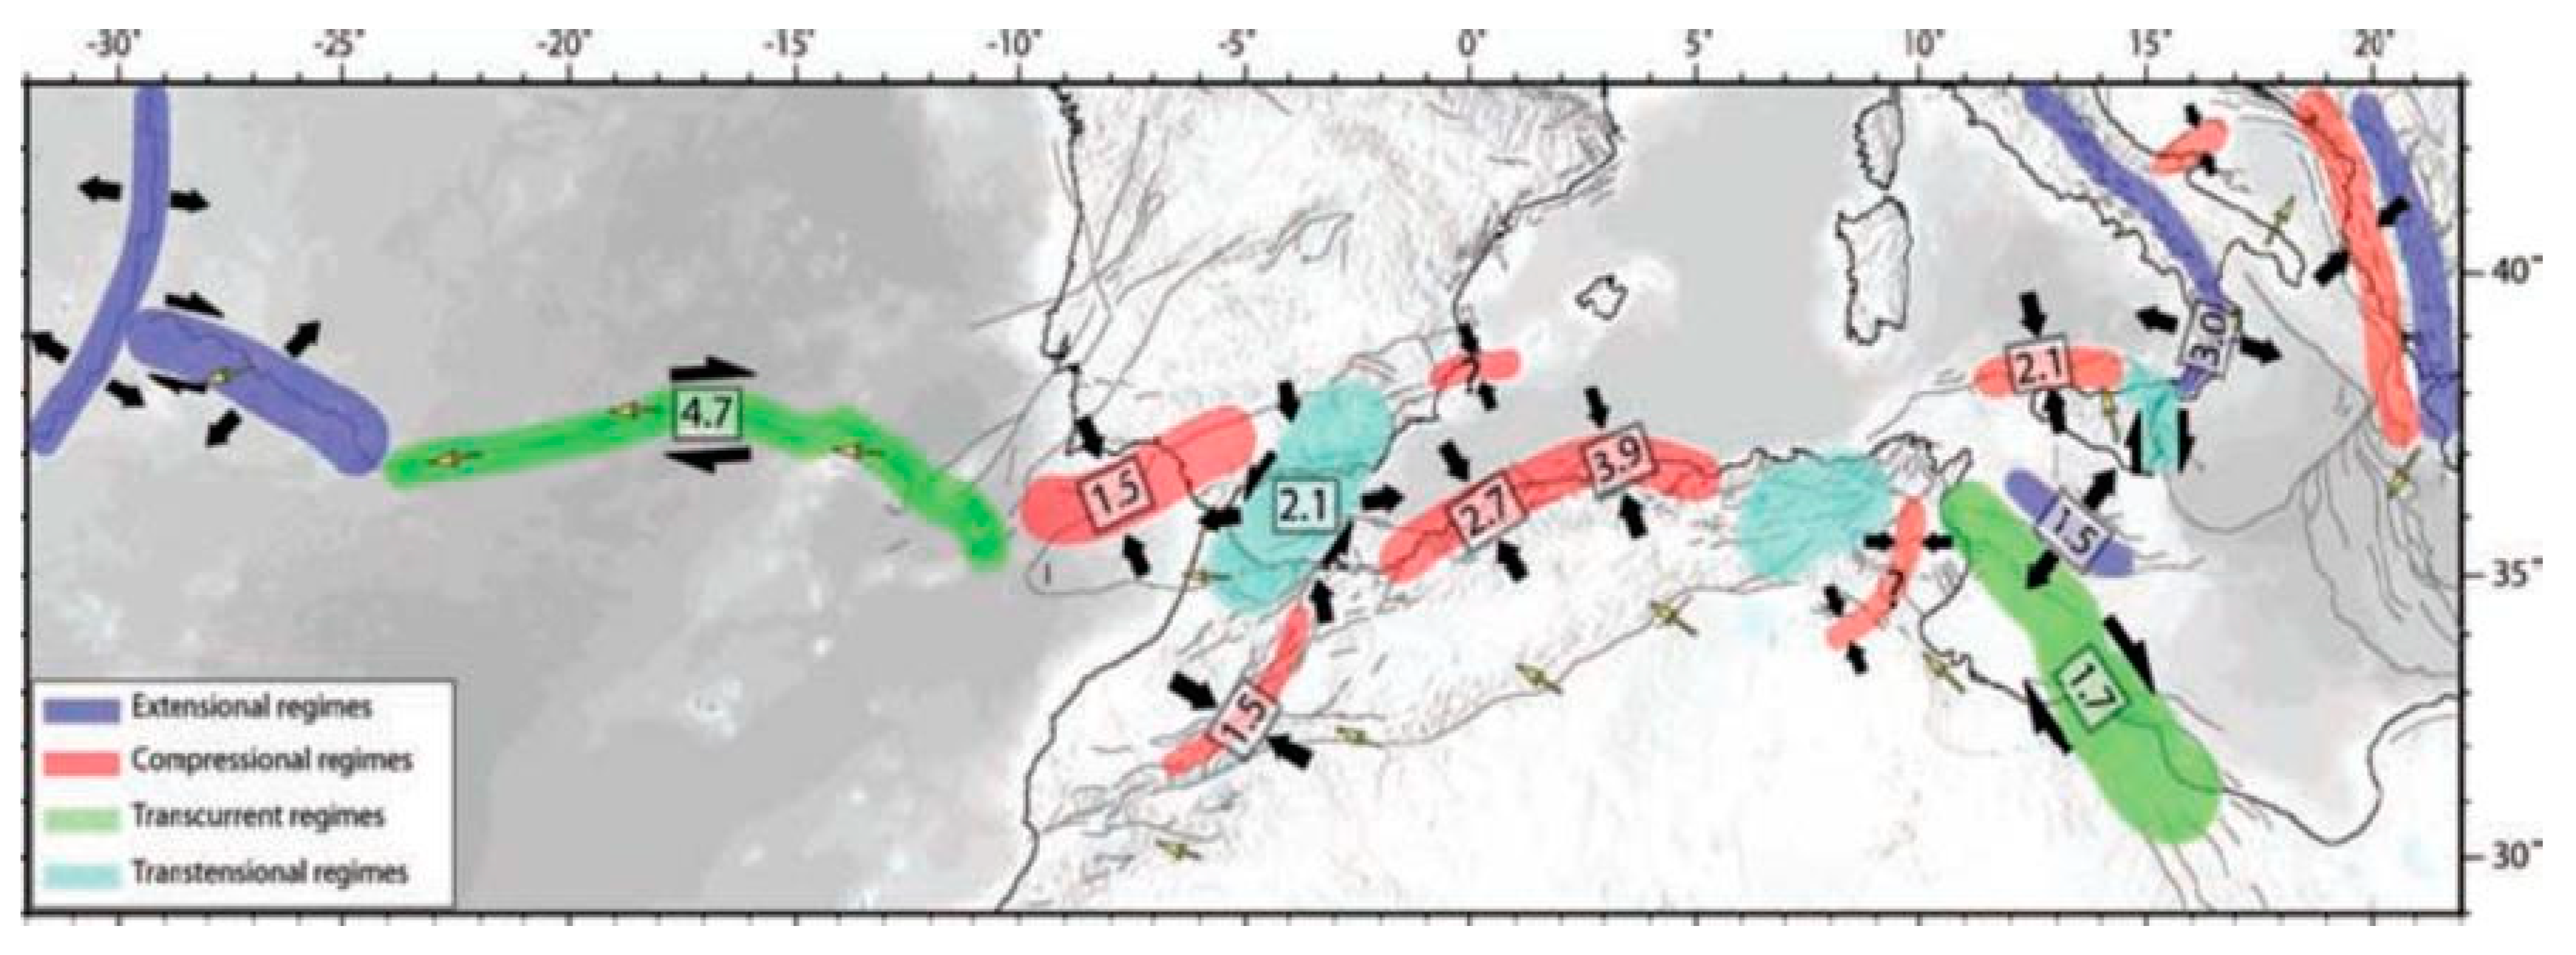
As shown in Figure 3, the area of Constantine is characterized by a zone of detachment regimes. The tectonic context of the Constantine region results from the convergence of the Eurasian and African plates [21,22,23,24,25]. As a result, this region is one of the most seismically active regions of the Mediterranean [33,34], characterized by intense seismic activity. The city is exposed to a complex of moderate to strong seismic hazards.
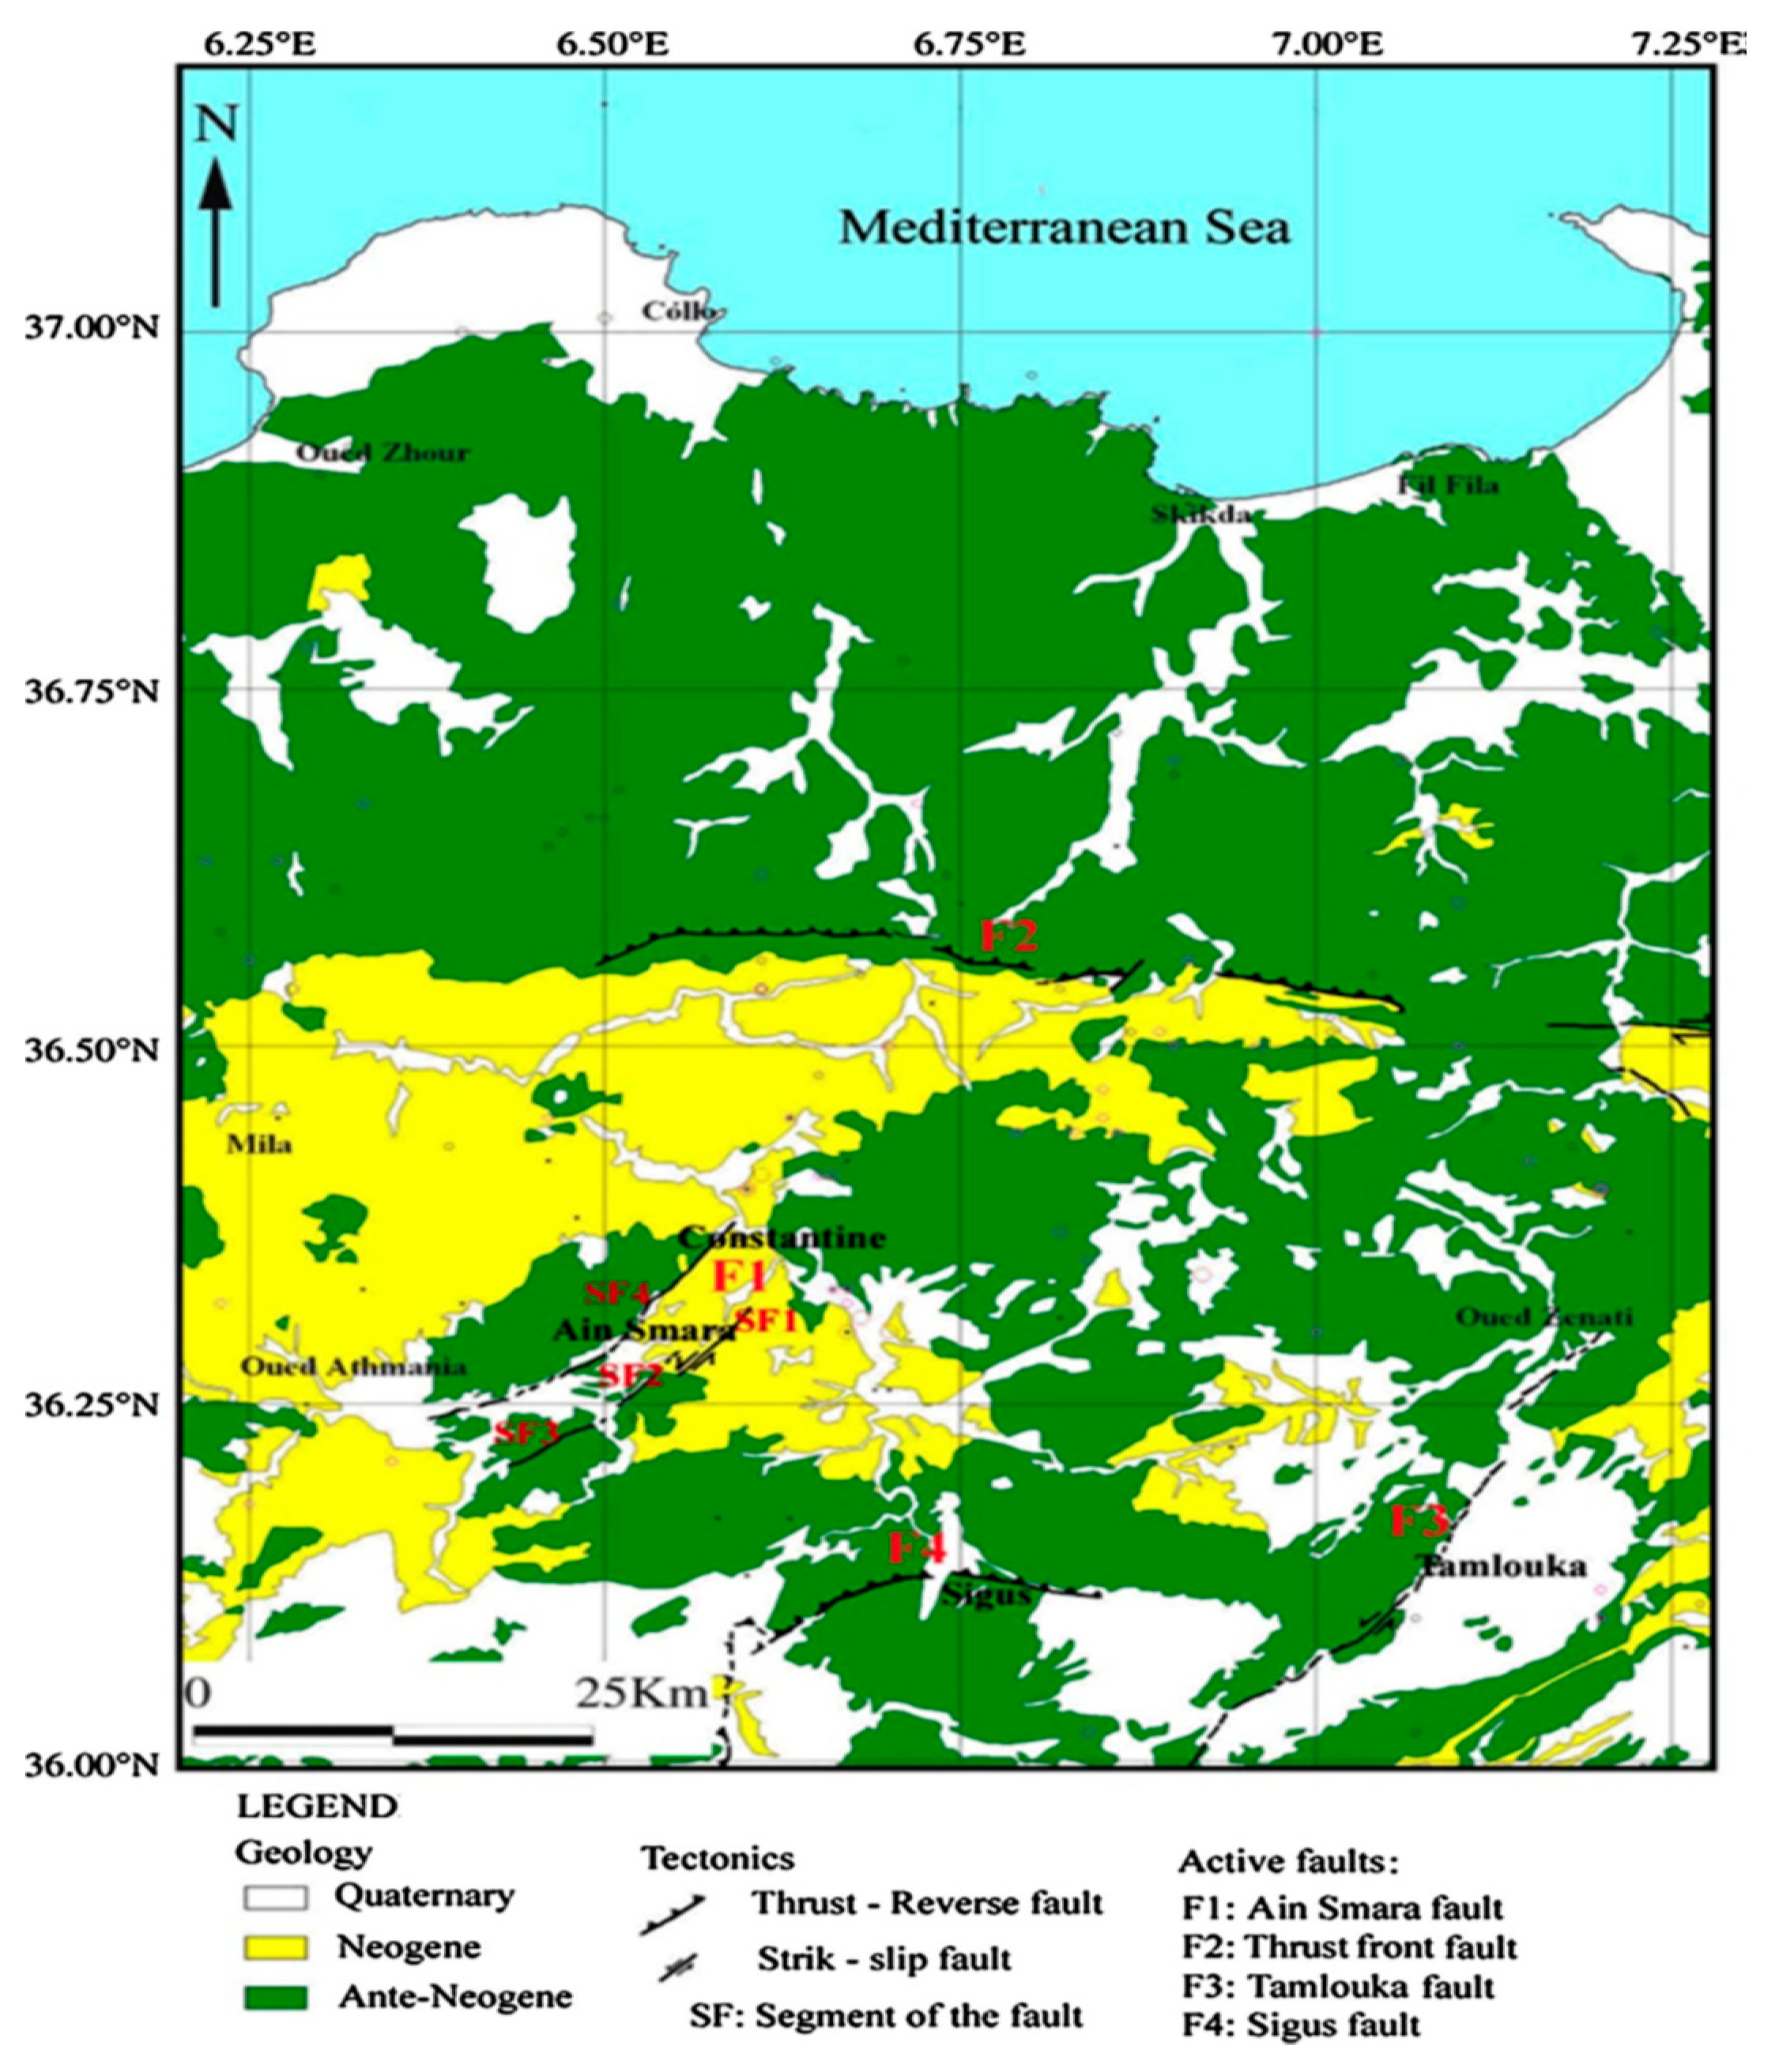
The regional geodynamic context, presented earlier, shows a set of tectonic structures (folds, faults) with a general direction perpendicular to the direction of convergence (NNW-SSE) of the tectonic plates. These active tectonic structures are thus responsible for the spatial distribution of the seismicity of this region. The Ain Smara Fault, shown in Figure 4, situated southeast of Constantine, is a major active fault and a primary source of earthquakes affecting Constantine confirmed by surface ruptures observed after the 1985 earthquake [35]. This fault can be considered as an important potential source of seismic activity according to the probabilistic seismic hazard study of Algeria [25]. It generated the strongest earthquakes in 1908, 1947, and in 1985, the latest corresponding to the strongest event recorded since the implementation of instrumental seismology in Algeria [35], causing significant damage in Constantine (Ms = 5.9, October 27, 1985). These past earthquakes are responsible for triggering landslides in the Constantine area by affecting the geologic structure, slope angle, and water saturation.
3. Materials and Methods
3.1. Data
SAR images, acquired by Sentinel-1, are used to derive ground displacement maps and deformation scenarios for Constantine city. The ground resolution of the sensor, in IW mode, is about 5 m in range direction and 20 m in azimuth direction. In comparison to other acquisitions modes, IW uses TOPS, which requires extra data processing for image co-registration that needs to be very accurate, to about 0.001 of pixel [36,37,38,39].
After the launch of Sentinel-1B, it became possible to use the two Sentinel-1 satellites (A and B), changing the revisit time on the area of interest to six days. This high temporal sampling allowed us to reduce the temporal decorrelation of the interferometric pairs and increase the number of coherent points [40].
3.2. PS-InSAR Processing
SAR images, spanning the period between 13 February, 2015 and 17 December, 2017, were analyzed by means of the PS-InSAR technique [3] and divided into two image stacks.
The first stack consists of 72 images from the period 6 August, 2015 to 17 December, 2017 acquired in a descending orbit (number 66). The image from 11 October, 2016 was chosen as the master for the second stack (see Figure 5).
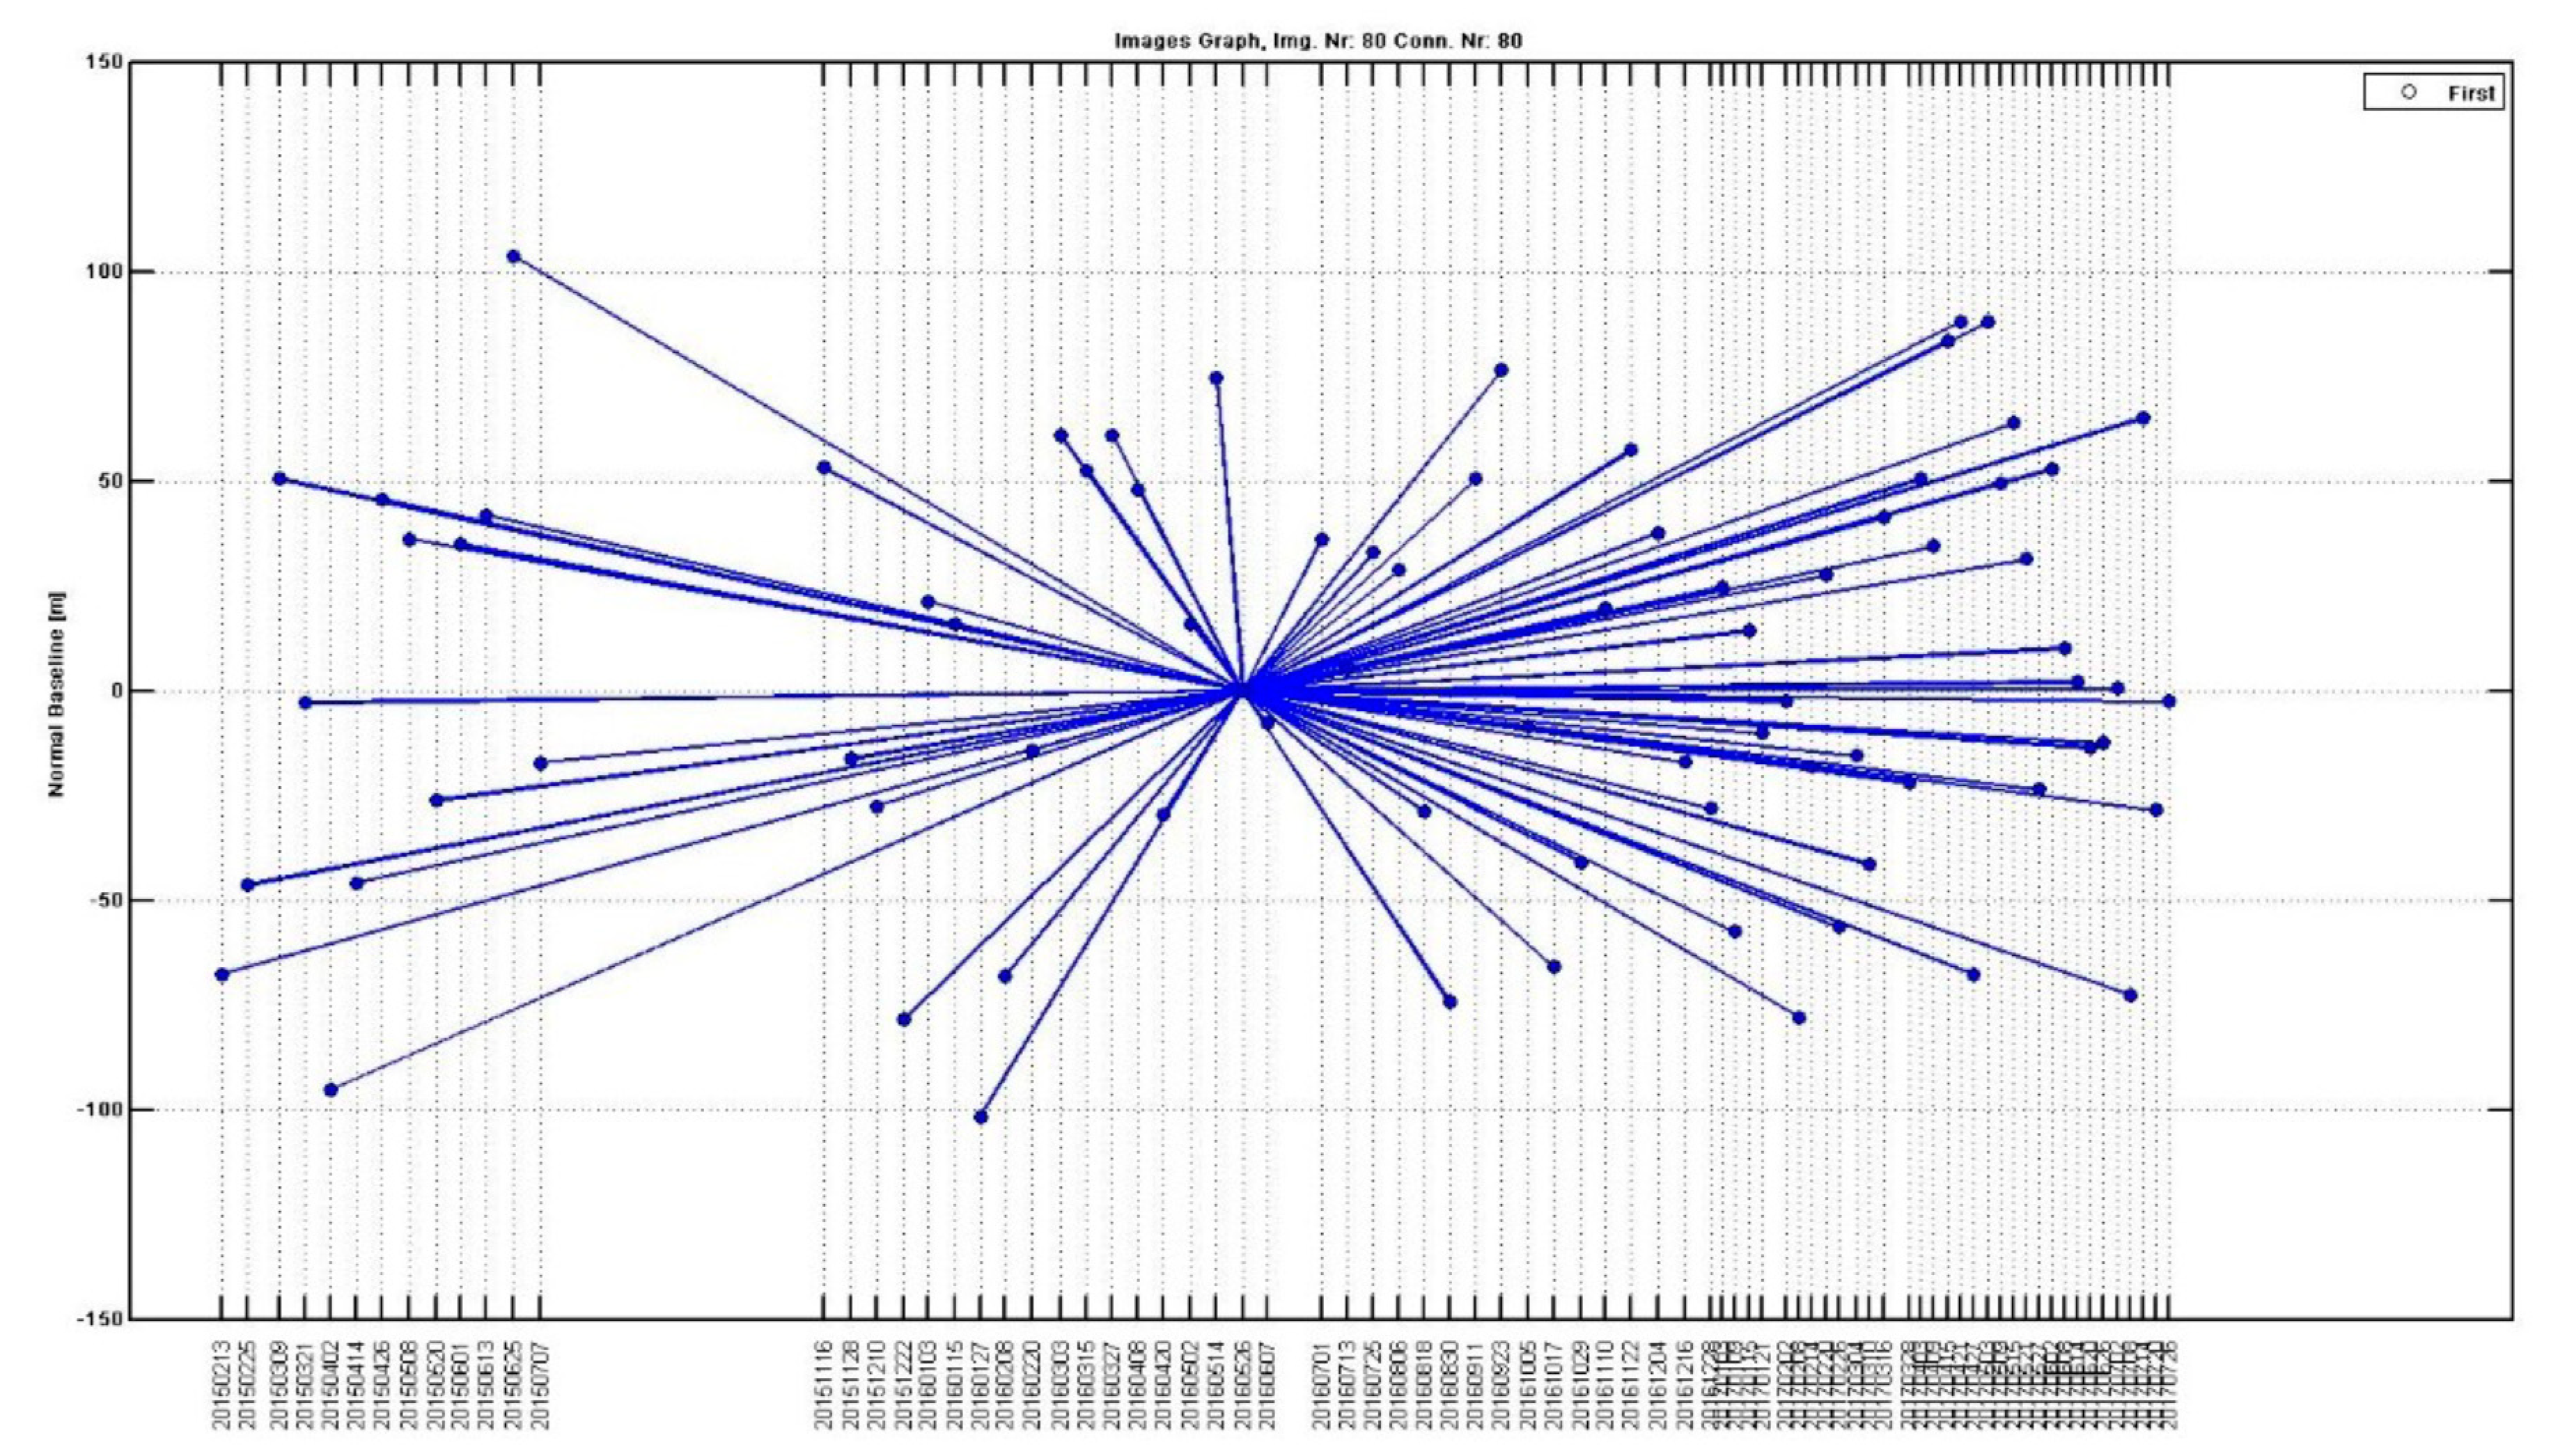
For the second stack of 80 images, acquired from an ascending orbit (number 161) during the period 13 February, 2015 to 27 July, 2017, the image from 26 May, 2016, was chosen as the master image (see Figure 6).
In PS-InSAR, SAR data time-series are analyzed. The method focuses on stable, point-like scatterers that are not suffering from speckle and provide a deterministic signal. These are the so-called persistent scatterers (PS) that provide stable phase history over the acquisition time span [3,41,42].
The PS phases are stable over time and do not suffer from temporal decorrelation, they allow long-time observation and deformation monitoring. The interferometric phase of a SAR signal of wavelength between two different images can be expressed as:
where is the change in phase because of height errors, is the component caused by the displacement of the terrain in the line-of-sight direction between the two SAR acquisitions, and is the phase error induced by orbit estimation errors. is the phase component due to atmospheric phase delay differences. Finally, is the phase noise including thermal noise and other error components not included in the other terms.
There are several multi-baseline InSAR approaches for measuring surface motion available and the choice between these different techniques depends on many factors, like the radar sensor characteristics, the target of the study, or the characteristics of the test site (geology, land use, topography, etc.). Here we used the classical permanent scatterer interferometry, described in [3,41], as it is implemented in SarProZ [7]. The analysis of the images was carried out with the following steps: The first step consists of image co-registration; afterward follows the selection of PS candidates (PSC) based on the amplitude stability index [2]; next is the estimation and removal of the atmospheric phase screen (APS) and; finally the generation of the velocities and time-series deformation maps. We used the SRTM DEM with a resolution of 1 arc-second (30 m) as external Digital Elevation Model (DEM) in this study to remove the topographic phase from the differential interferograms [43].
3.2.1. Interferogram Network Generation
Starting from the stacks of complex SAR images (Single-Look Complex - SLC), we generated a network of interferograms. The master image was selected with respect to the geometric and temporal baselines at the barycenter of the distribution of normal and temporal baselines. In the selection of the master images we made sure that no rain was reported at the time of acquisition. Interferograms are then analyzed, both spatially and temporally, with the aim of detecting areas affected by deformation. A visual inspection of the single interferograms permits the identification of the spatial patterns associated with the potential deformation areas, flagging of bad interferograms with fringe jumps in the azimuth direction, and facilitates correction of crude error by enhancing the co-registration strategies.
3.2.2. Point Selection
Even if a single S-1 frame contains millions of pixels, only a small portion of them is exploitable for deformation measurements. There are different statistical criteria used to discriminate the noisier pixels from those with low level of noise. However, the use of very restrictive thresholds can result in a critical loss of spatial coverage. The general purpose of this step is to make a compromise between the quality of the selected points (little affected by noise) and the spatial coverage. Hence, for each case, different criteria are evaluated in order to make the best trade-off. For example, in our study area, the selection of points was based on an amplitude index stability set to a threshold of 0.3. Thus, only points with an index value lower or equal to 0.3 were selected. The following least squares estimation is limited to the topographic height error between −50 m and 60 m and for the linear velocity between −100 mm/year and 100 mm/year.
3.2.3. APS (Atmospheric Phase Screen) Estimation and Removal
SAR acquisitions are affected by different atmospheric conditions at the acquisition time. Water vapor delays the radar signals. The spatially varying distribution of the water vapor also leads to differences in the path delay throughout a SAR image. The APS is estimated using spatial temporal filters [44]. The estimated APS was removed from the results. The remaining phases are then used to estimate the topographic height error and the linear deformation velocity.
3.2.4. Deformation Velocity Estimation
This is the last step in the deformation map generation. This block consists of an estimation of the deformation velocity from the obtained time series. The obtained time-series deformation maps are composed of thousands of PS (persistent scatterer). Each PS is associated with the value of the annual linear velocity (mm/yr), estimated over the analyzed period and the displacement accumulated at each sensor acquisition date. The measured PS points are estimated to the movement of the ground point along the satellite line-of-sight (LOS) direction. Movements toward the sensor are positive (represented in blue in the deformation maps) and movements away from the sensor are negative (represented in red). The stable points, within a stability threshold of −5/+5 mm/yr, are represented in green. We selected a stable reference point in the center of Constantine city (Rocher de Constantine). The reference point was in an area that is consistently stable with high spatial coherence throughout the time series, but the measured signal in all PSs inherently includes background temporal variability, because InSAR measures the relative movement to the reference point.
3.3. Post-Processing
The potential deformation areas identified in the previous steps were analyzed addressing the following concerns:
- Detecting the errors occurring during the processing step;
- Assessing the temporal behavior of each detected deformation phenomenon and to pair it with the collected information about the field; and
- Confirmation or modification of the shape of the detected deformation areas through a comparison of our results with previous work.
The detected deformation areas were transformed to an external reference system, i.e., to geographic or cartographic coordinates.
After the PS-InSAR processing, we used a Geographical Information System (GIS) analysis in order to process and analyze the time series deformation (TS) data, using three inputs:
- PSI-derived ground deformation map;
- Inventory map of the landslide;
- A geological map.
The GIS analysis consists of the integration of the PS-InSAR derived data with geological and geomorphological data in order to interpret and validate the detected areas of deformation. This information can then be used to update the preexisting landslide inventory maps. The information from the previous steps is then combined with different information layers: a digital elevation model; aspect and slope; geo-lithological maps; existing landslide inventory maps, etc. These layers are used to carry out a geological and geomorphological interpretation that will allow us to confirm, reject, or modify the PS-InSAR estimations.
4. Experimental Result
We used PS-InSAR, as described and implemented in SARProZ [7,44], which permitted us to locate the main deformations in Constantine city. Figure 7A shows the deformation map obtained for stack one, descending orbit number 66, spanning from 6 August 2015 to 17 December 2017. Figure 7B shows the deformation map obtained for stack two, ascending orbit number 161, covering the period from 13 February 2015 to 26 July 2017.
All figures show an acceptable coverage of PS points over the area of interest. For track 161 39,655 PS points are found, and 21,714 in track 66. In all tracks, a connection between the urban areas of Didouche Mourad, Hamma Bouziane district in the northern part, the center of the city Constantine, as well as Ain Smara and Ali Mendjli districts to the south was established.
The results for the two stacks indicate that most of the area is stable (in green) and it can be seen that the deformation pattern is well defined where zones of ground deformations are identified at various locations in and around Constantine. From the overview in Figure 7, we can see motion in the center, near St. Jean, at El-Amel, and at the airport.
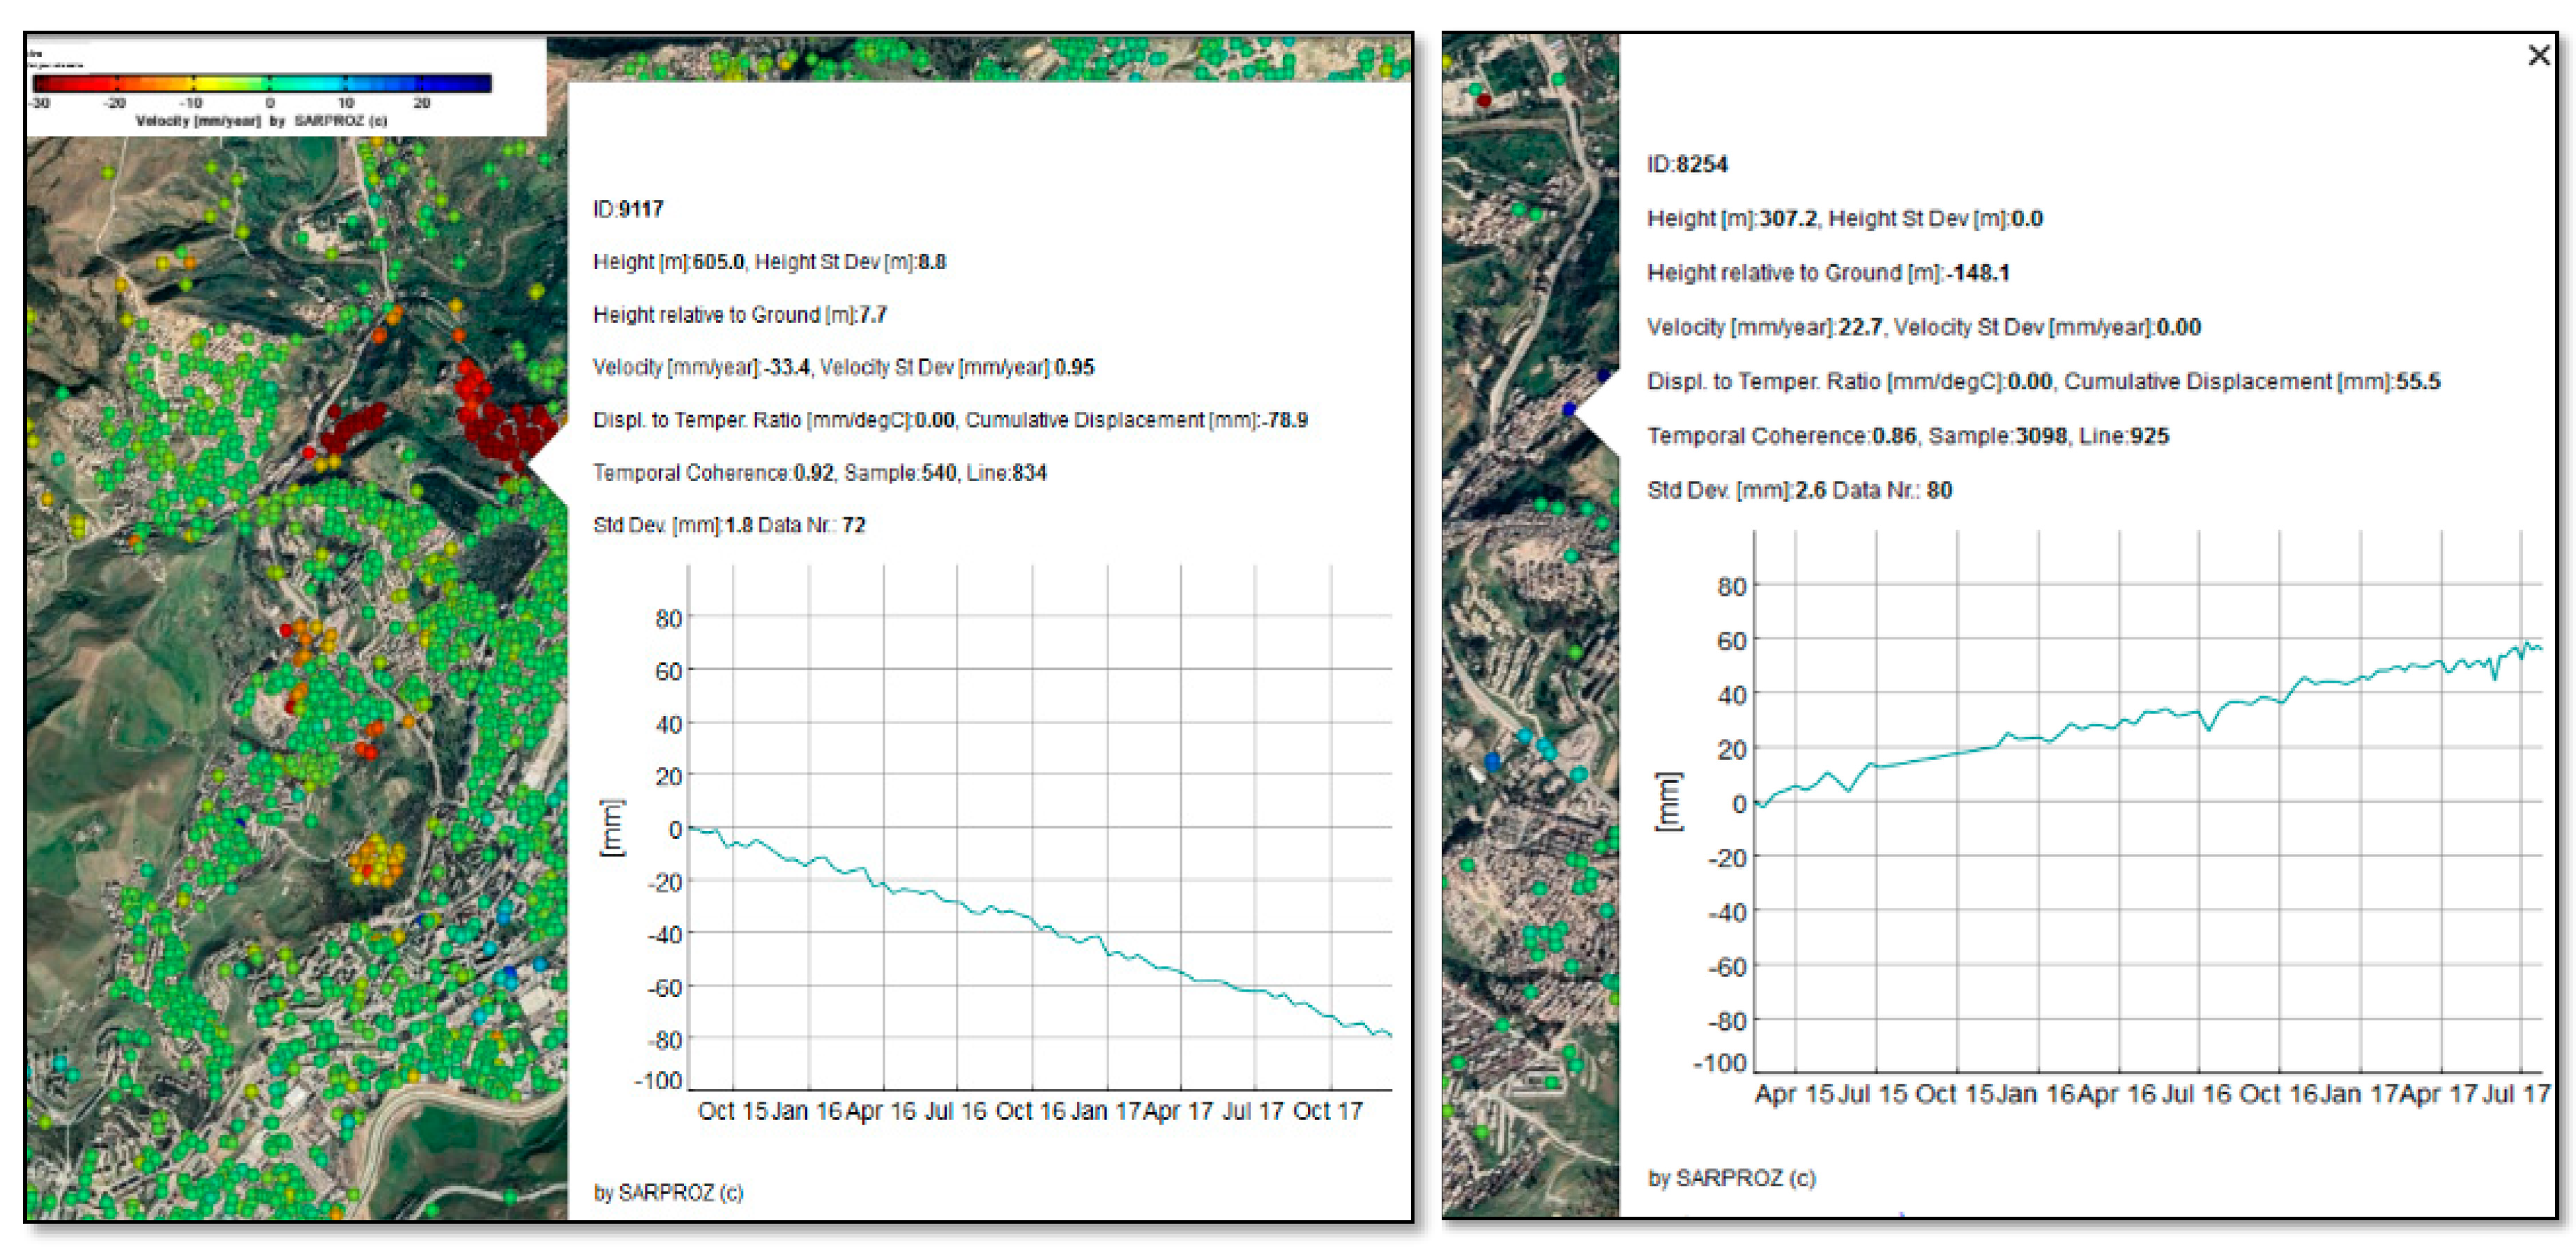
The largest deformations are found near St. Jean, with values ranging from −20 to −35 mm/yr from the descending orbit (track 66) and 15 to 30 mm/yr from the ascending orbit (track 161), as shown in Figure 8. It can be seen that the motion shows strong linearity and therefore a good fit into the basic assumption of a linear deformation pattern.
The negative motion, i.e., motion away from the sensor, shown in the data from the descending orbit and the positive motion, i.e., motion toward the sensor, shown in the ascending orbit, indicates horizontal motion roughly toward west.
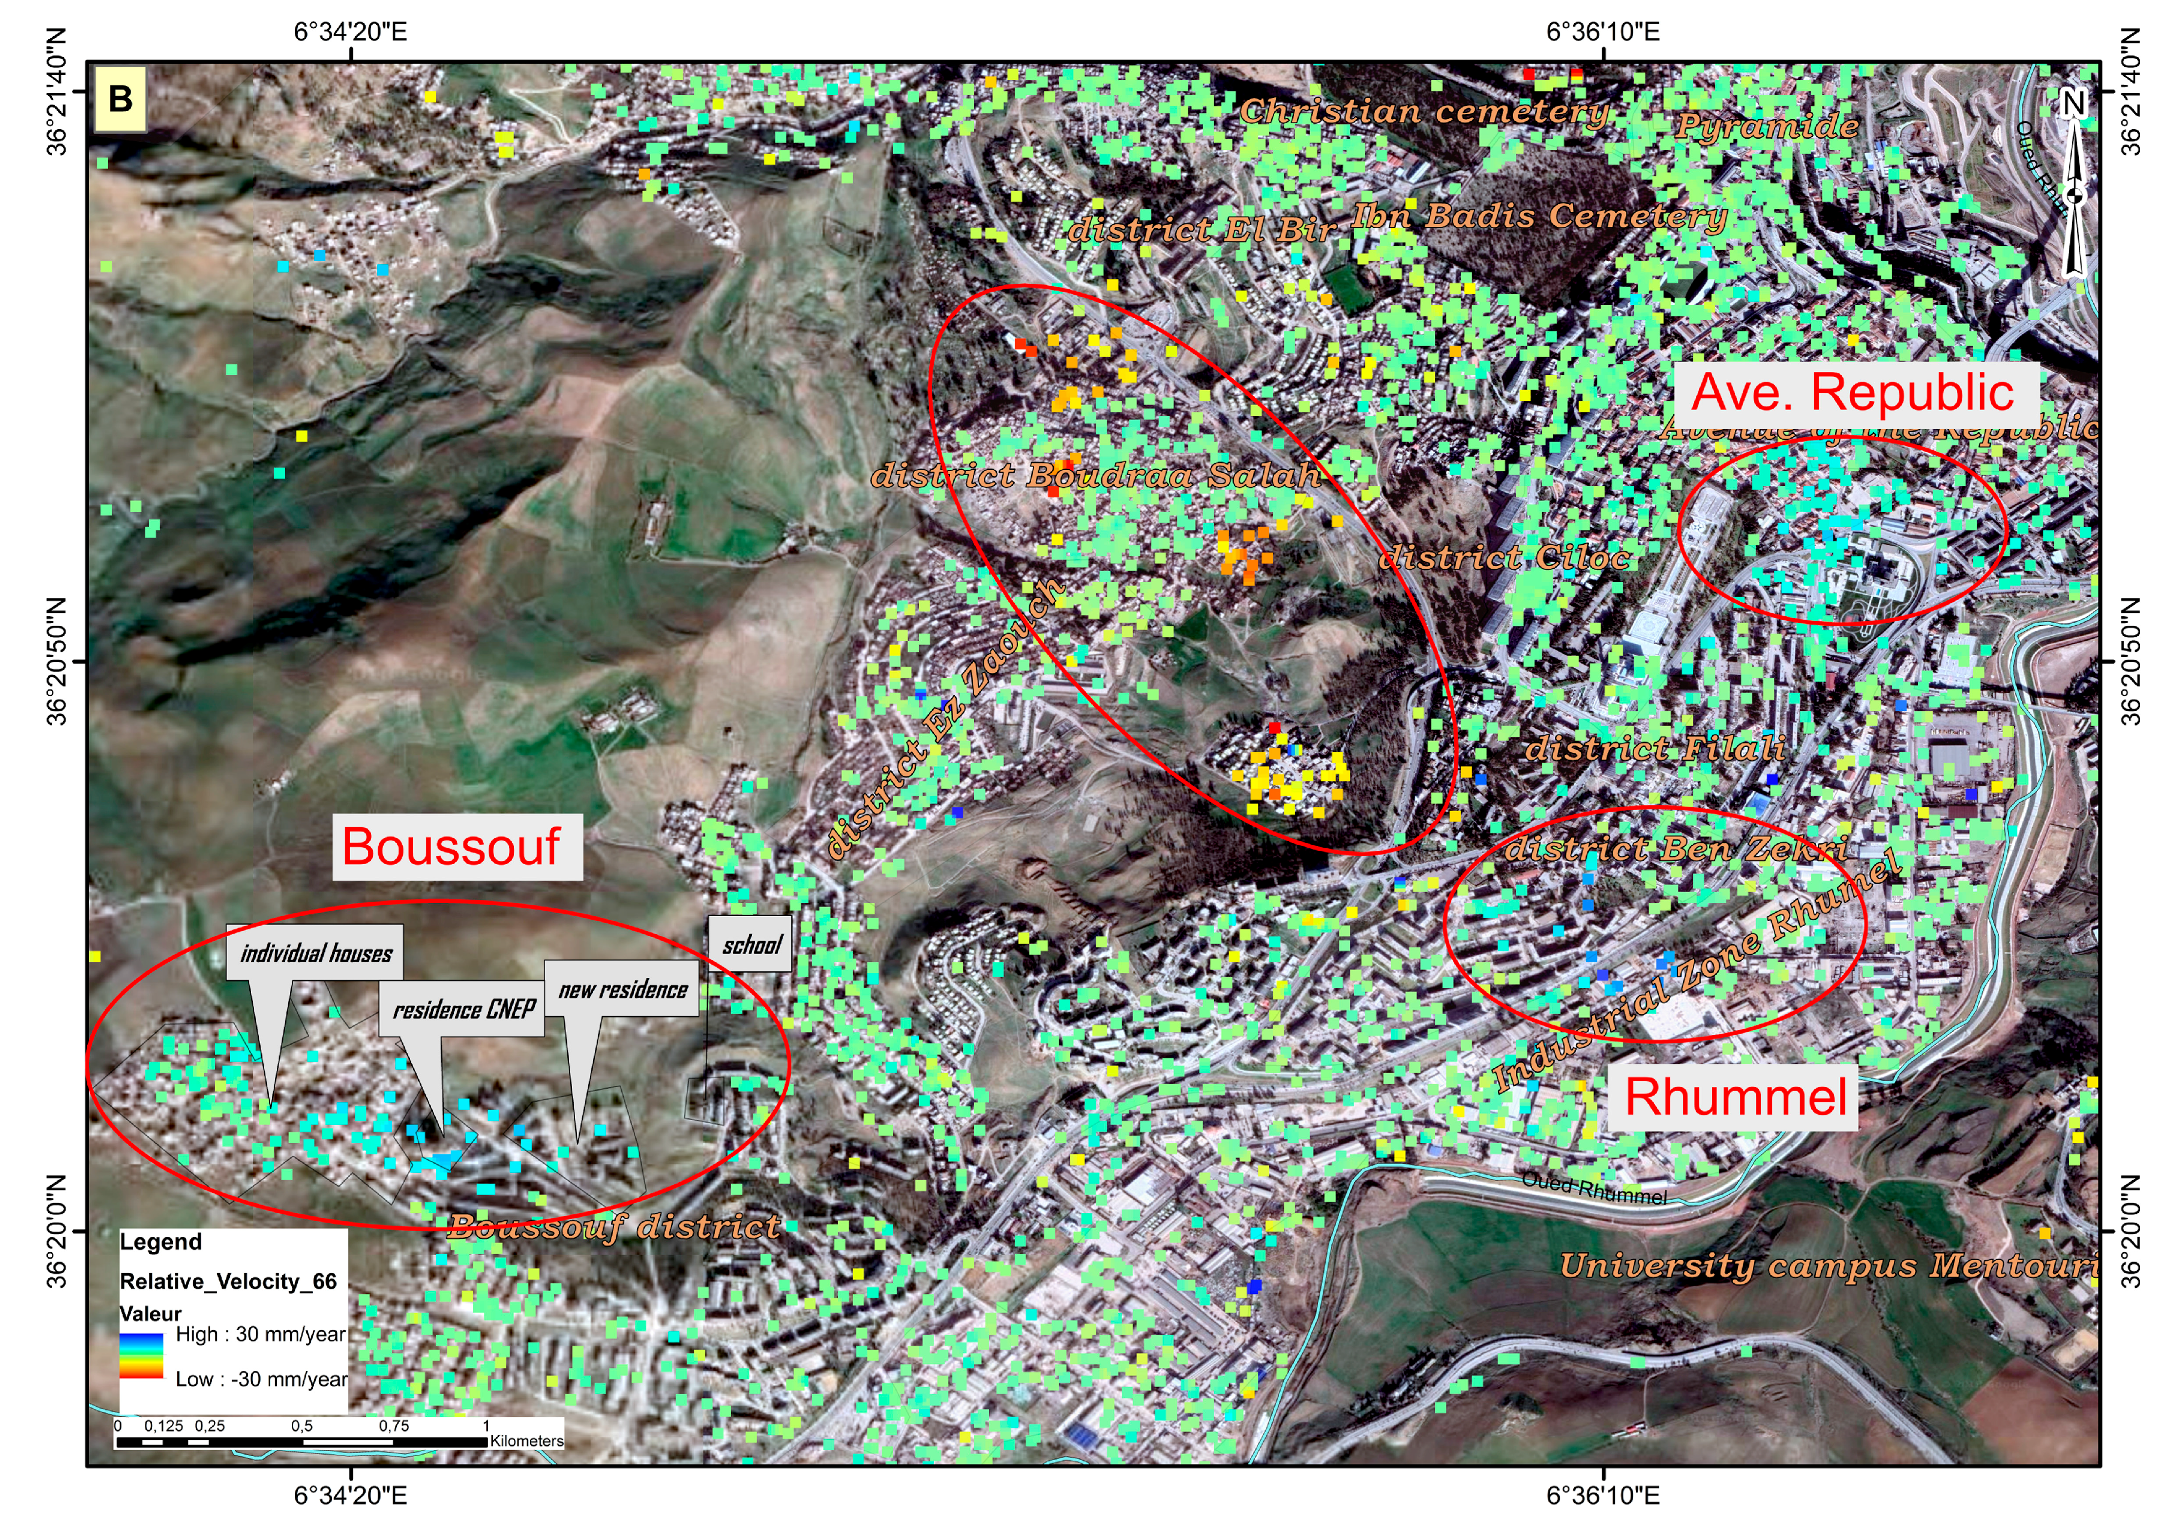
Strong deformations are observed in the center of the city at two locations, which are around the Avenue of the Republic and the Boussouf district. In the Boussouf district, we found motion between −7 to −12.7 mm/yr from the ascending orbit (track 161) and 7 to 10 mm/yr from the descending orbit (track 66). Again, we found mostly horizontal motion in the center area as shown in Figure 9.
The surface motion around the area of El-Amal (see Figure 10), is less clear in some areas, due to temporal decorrelation in the rural areas and the sub-urban areas. South of Bekira, Hay la City, Hay Barkat, Ouelad Ziyad, and Hey Elcharikatare surface motion is visible in Figure 10. Again, the motion direction is different from ascending and descending orbits, with 17 to 23 mm/yr motion from the ascending orbit and −22 to −33 mm/yr motion from the descending orbit. This indicates a relatively strong horizontal motion.
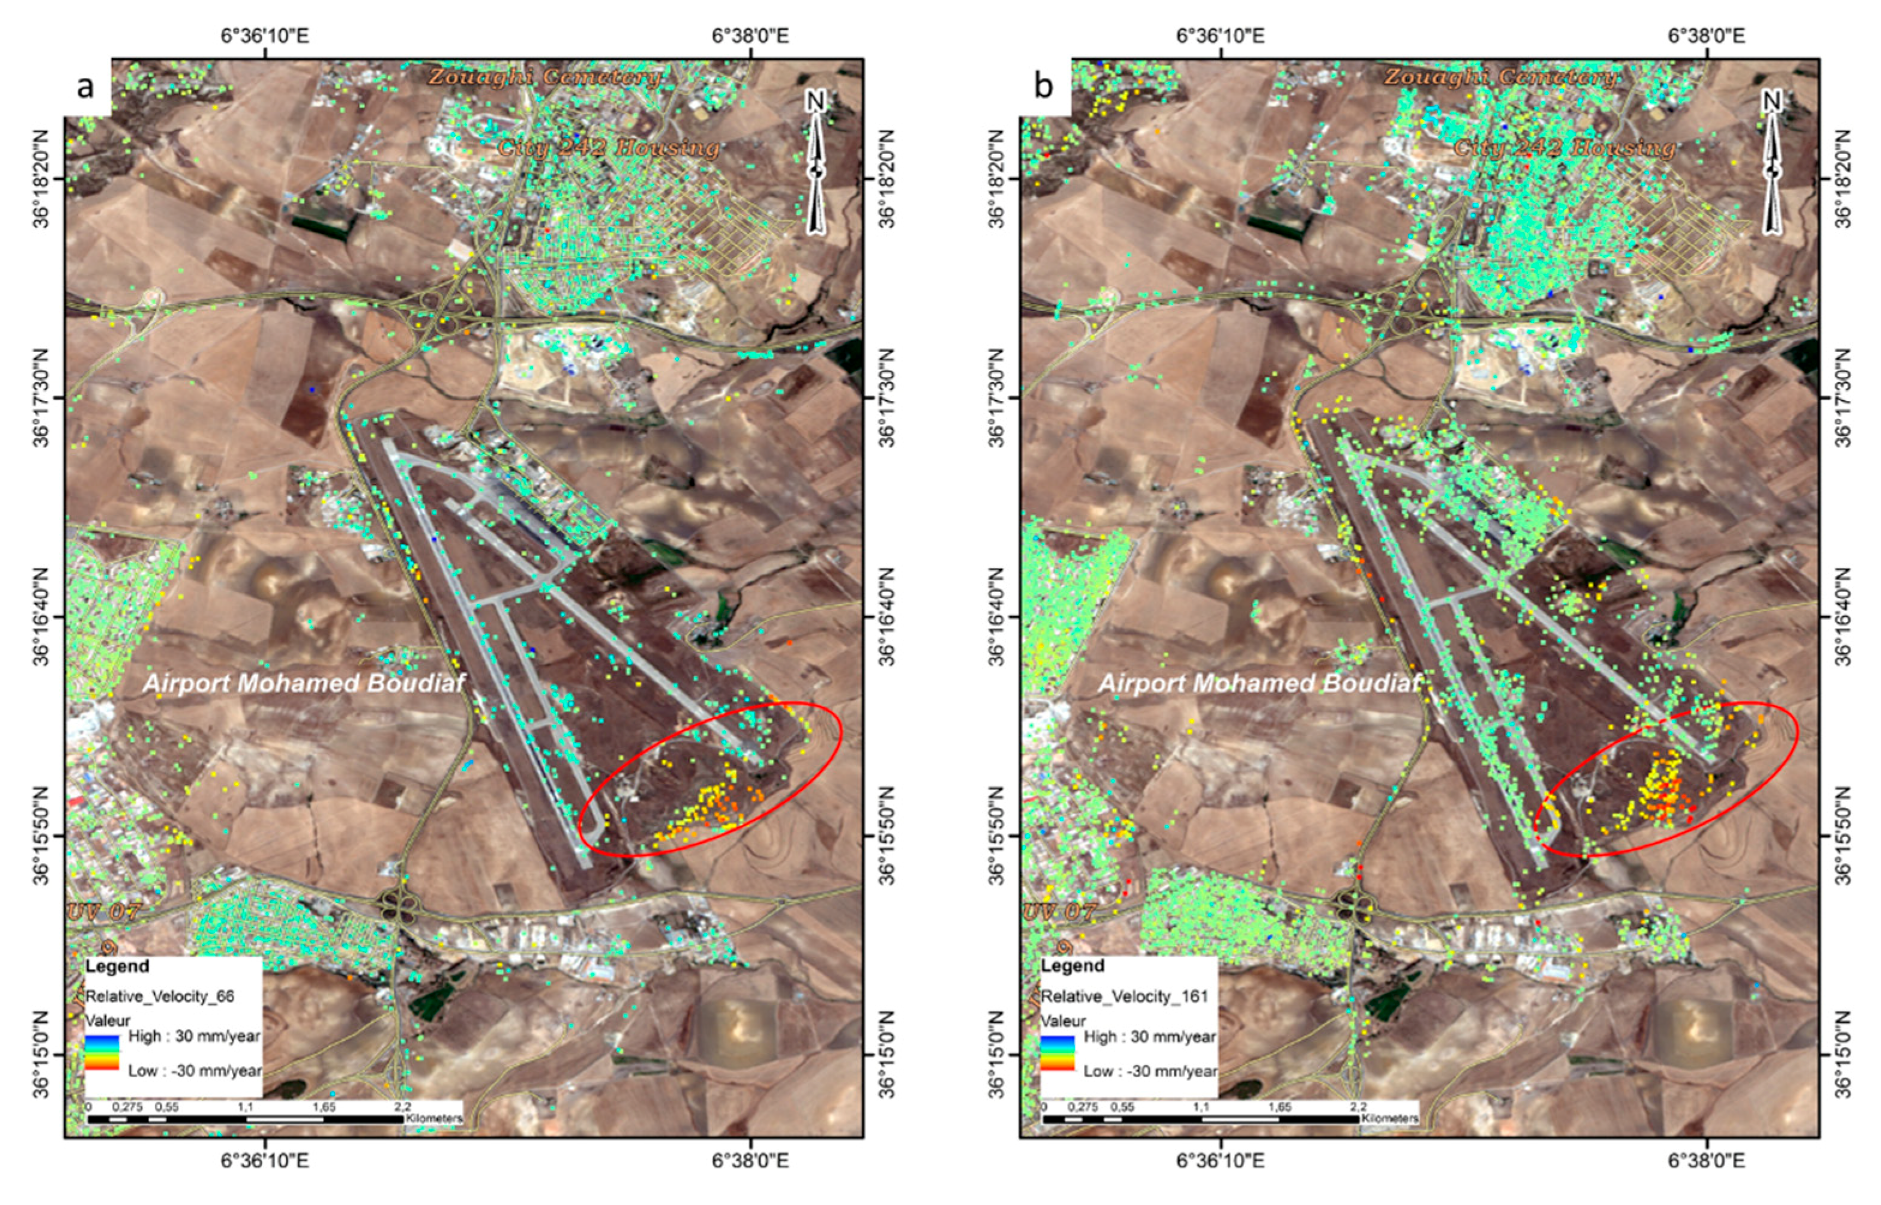
Subsidence can be found in the southern part of Constantine. Especially at the southern end of the airport, we found negative velocities from the ascending orbit between −14 to −25 mm/yr and negative velocities from the descending orbit ranging from −13 to −19 mm/yr (see Figure 11). This shows a relative strong subsidence at the southern end of the airport, which may affect the runways in the near future.
5. Discussion
The application of PS-InSAR over Constantine revealed a number of previously known sites showing deformation and ground motion (e.g., Boussouf and Saint Jean), where the comparison of previous studies and field surveys with our results demonstrates a good overlap. Other areas, like Hay El Amel near Sidi Arab in Figure 10 as well as the airport Figure 11, shows motion, which was not documented previously.
As it is shown in the geologic map of Constantine, we found the superposition of geologic formations where the rheological contrast between them is high, at the bottom the hard-thick limestone formation called “néritique constantinois” attributed to the Early Jurassic and Cretaceous ages, covered by a highly plastic material constituted of clays and sandstone. All these formations are affected by a fault network, which acts as a potential detachment horizon.
Landslides in Constantine and the slope map explain this relationship, as most of Constantinian landslides occur where slopes are above 10%. However, not only natural factors cause landslides, anthropic activities can also stimulate land mass displacements.
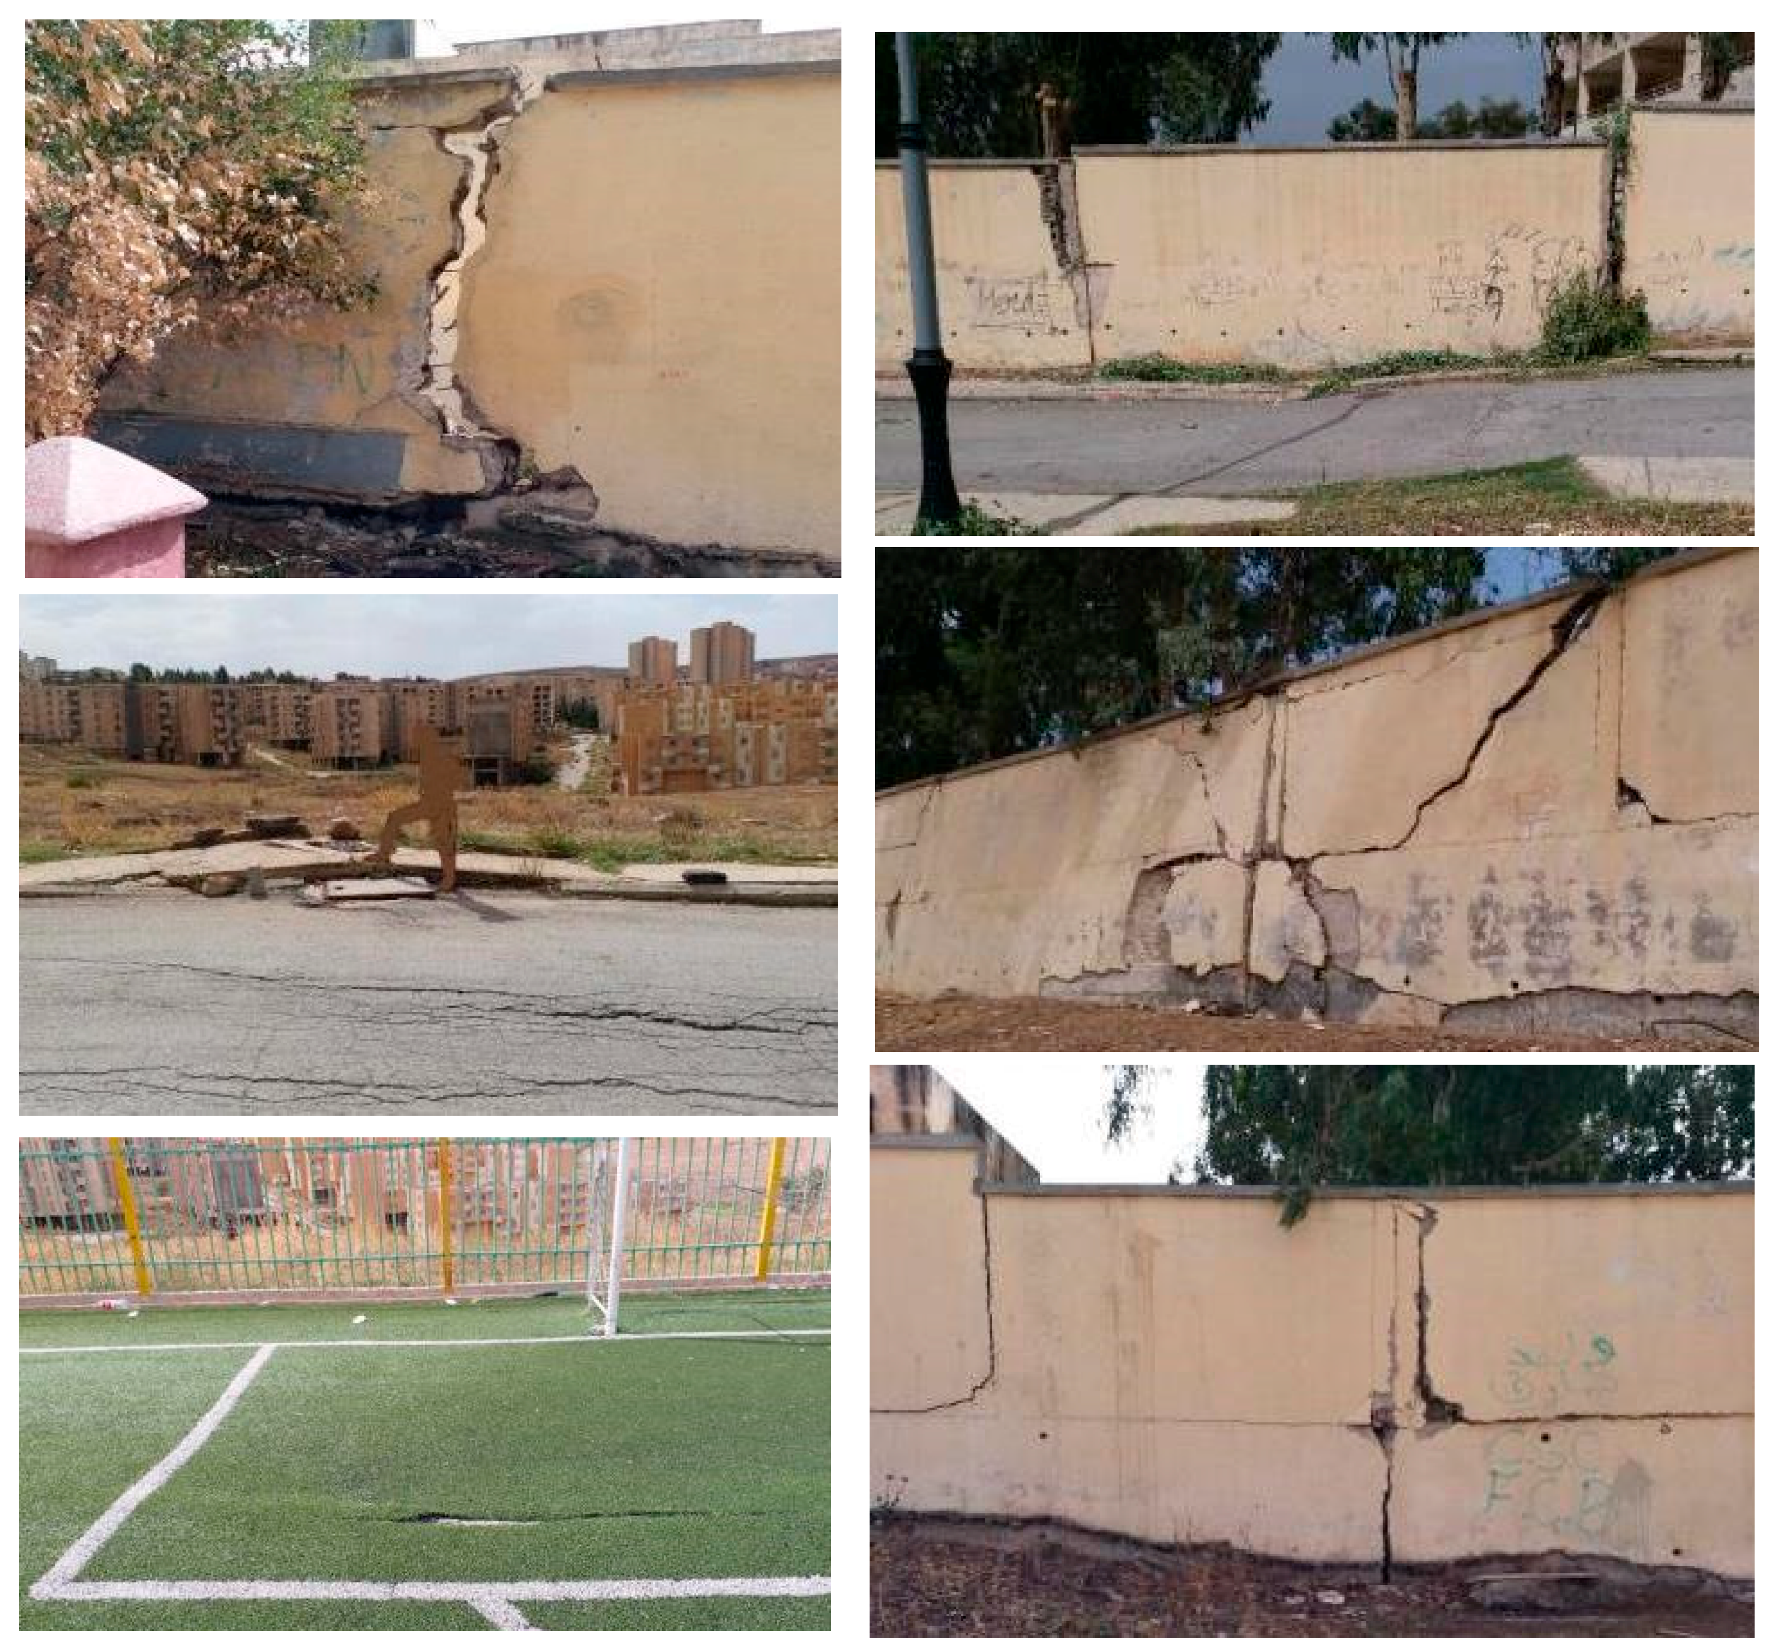
One example of such phenomena in Constantine can be observed in the northern part of the city, as shown in Figure 10 and Figure 12. No landslides were reported in Sidi Arab, the South Didouche Mourad district, until 2001. Since then, the area of Sidi Arab began to move toward the west after the opening of an open pit to extract clay for a ceramic factory newly installed in the Didouche Mourad industrial zone. The loss of material in the front of the slope and the perturbation of the hydrographic network caused the formation of little swamps, leading to water reacting with the clay formation. In our fieldwork, we recorded damages caused by the Didouche Mourad landslide. The most remarkable damage was seen in a school that never opened, because of the surface motion. Unfortunately, no PS point was detected on the school. We assume this might be due to the construction activities during the date acquisition period. Nevertheless, we can extrapolate the surface motion from more coherent areas to the area where the school is located.
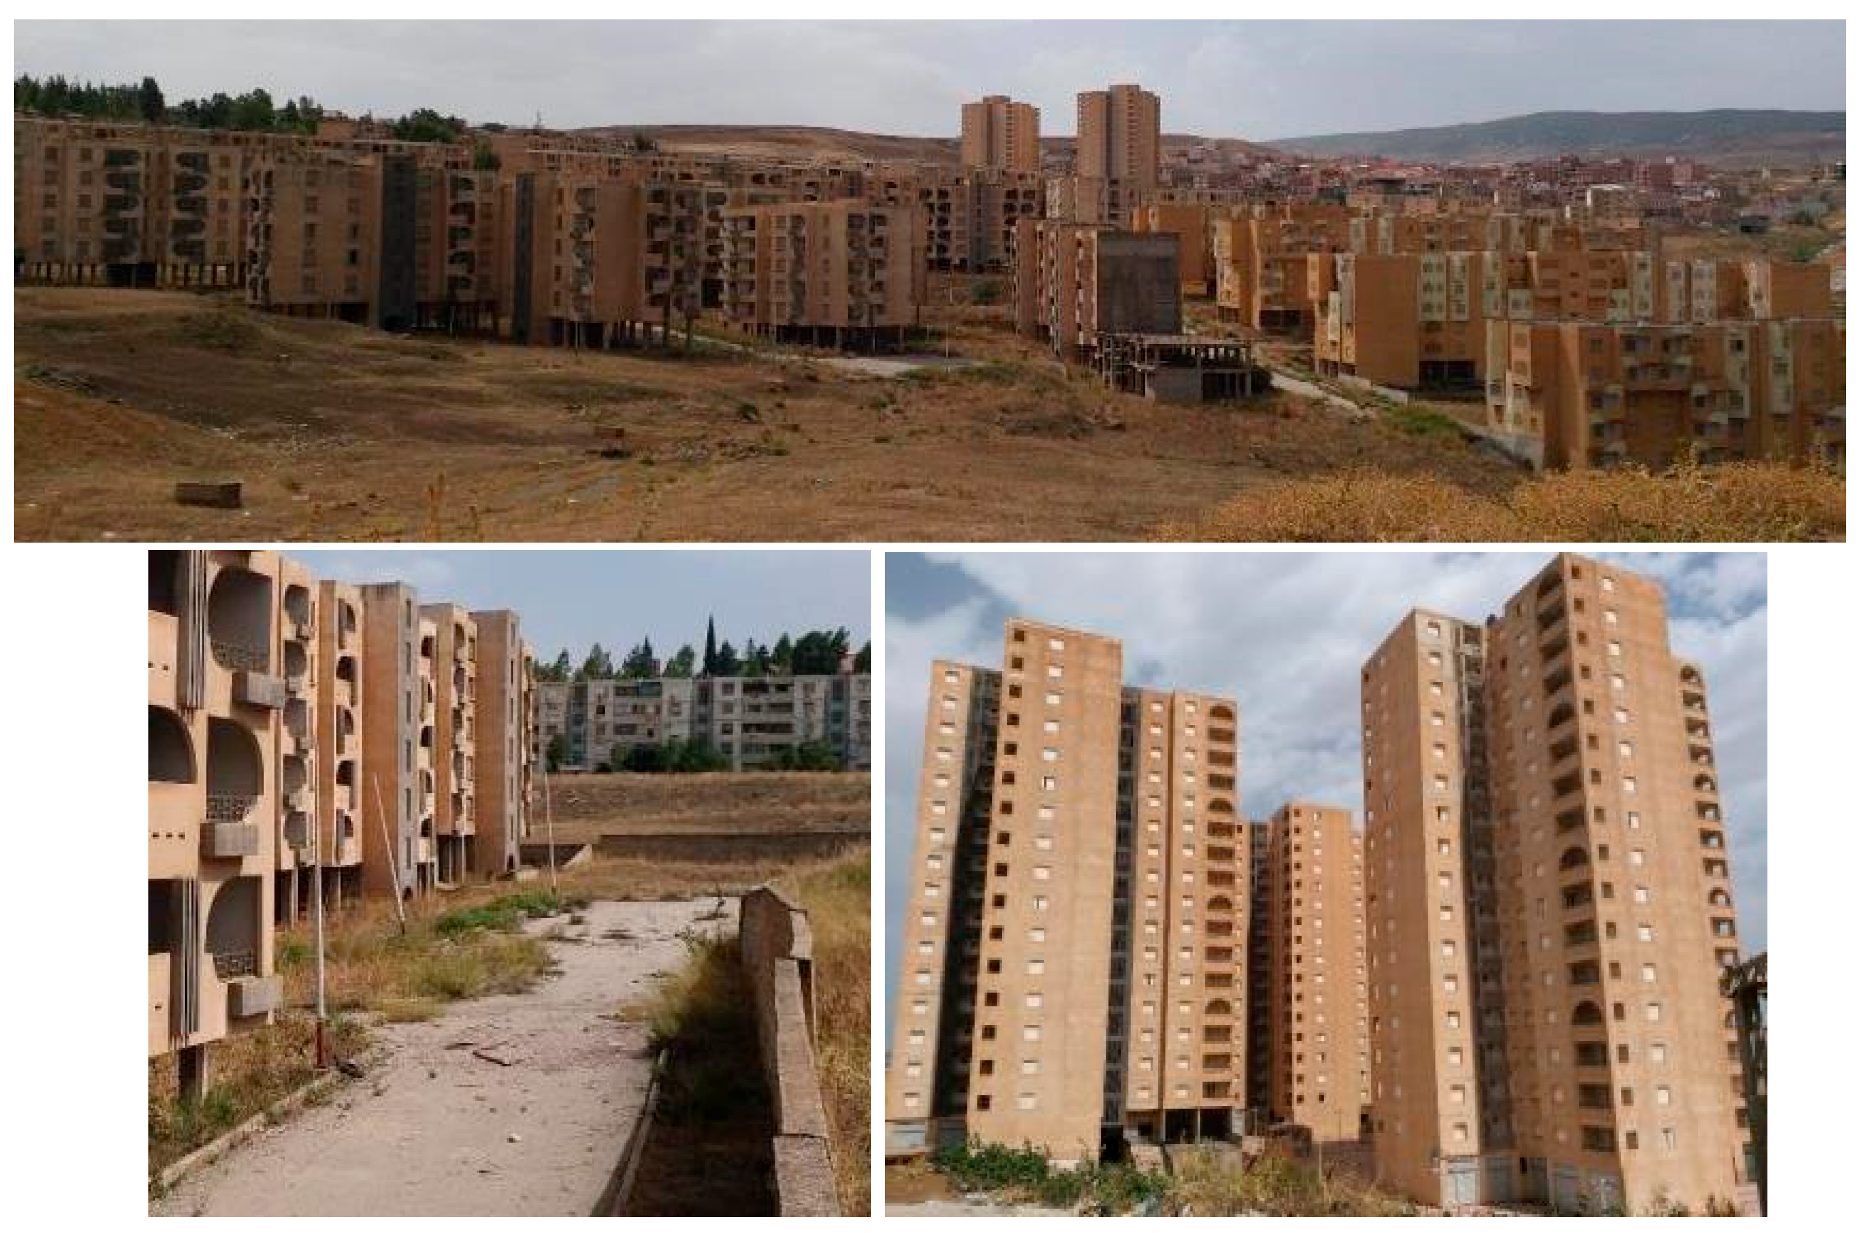
Another problem appears to the south of the detected landslide, where new buildings of five floors (R + 5) are being built. The local authorities ignored the surface motion, and after completing around 70 percent of the project the company begun to have issues with the surface motion. To deal with it, they changed the height and the number of levels of the buildings into one level (R + 1); however, the land is still moving according to the PS-InSAR results and it remains highly questionable if this is a sustainable strategy.
Constantine faces challenges from its growth, due to landslides affecting the city center (e.g., Saint Jean) and neighboring areas (e.g., Boussouf). The local authorities estimate that more than 120 hectares are affected by surface motion, leading to more than 15,000 houses, with about 100,000 inhabitants, threatened.
Metric escarpments (scarp) appear at the head of the landslide are clearly visible on deformed slopes of the Belouizded-Kitouni Boulevard and in the foot by a corrugated morphology characteristic of the unstable argillaceous slopes. The slipping mass is composed of several blocks moving differently in space and time [27].
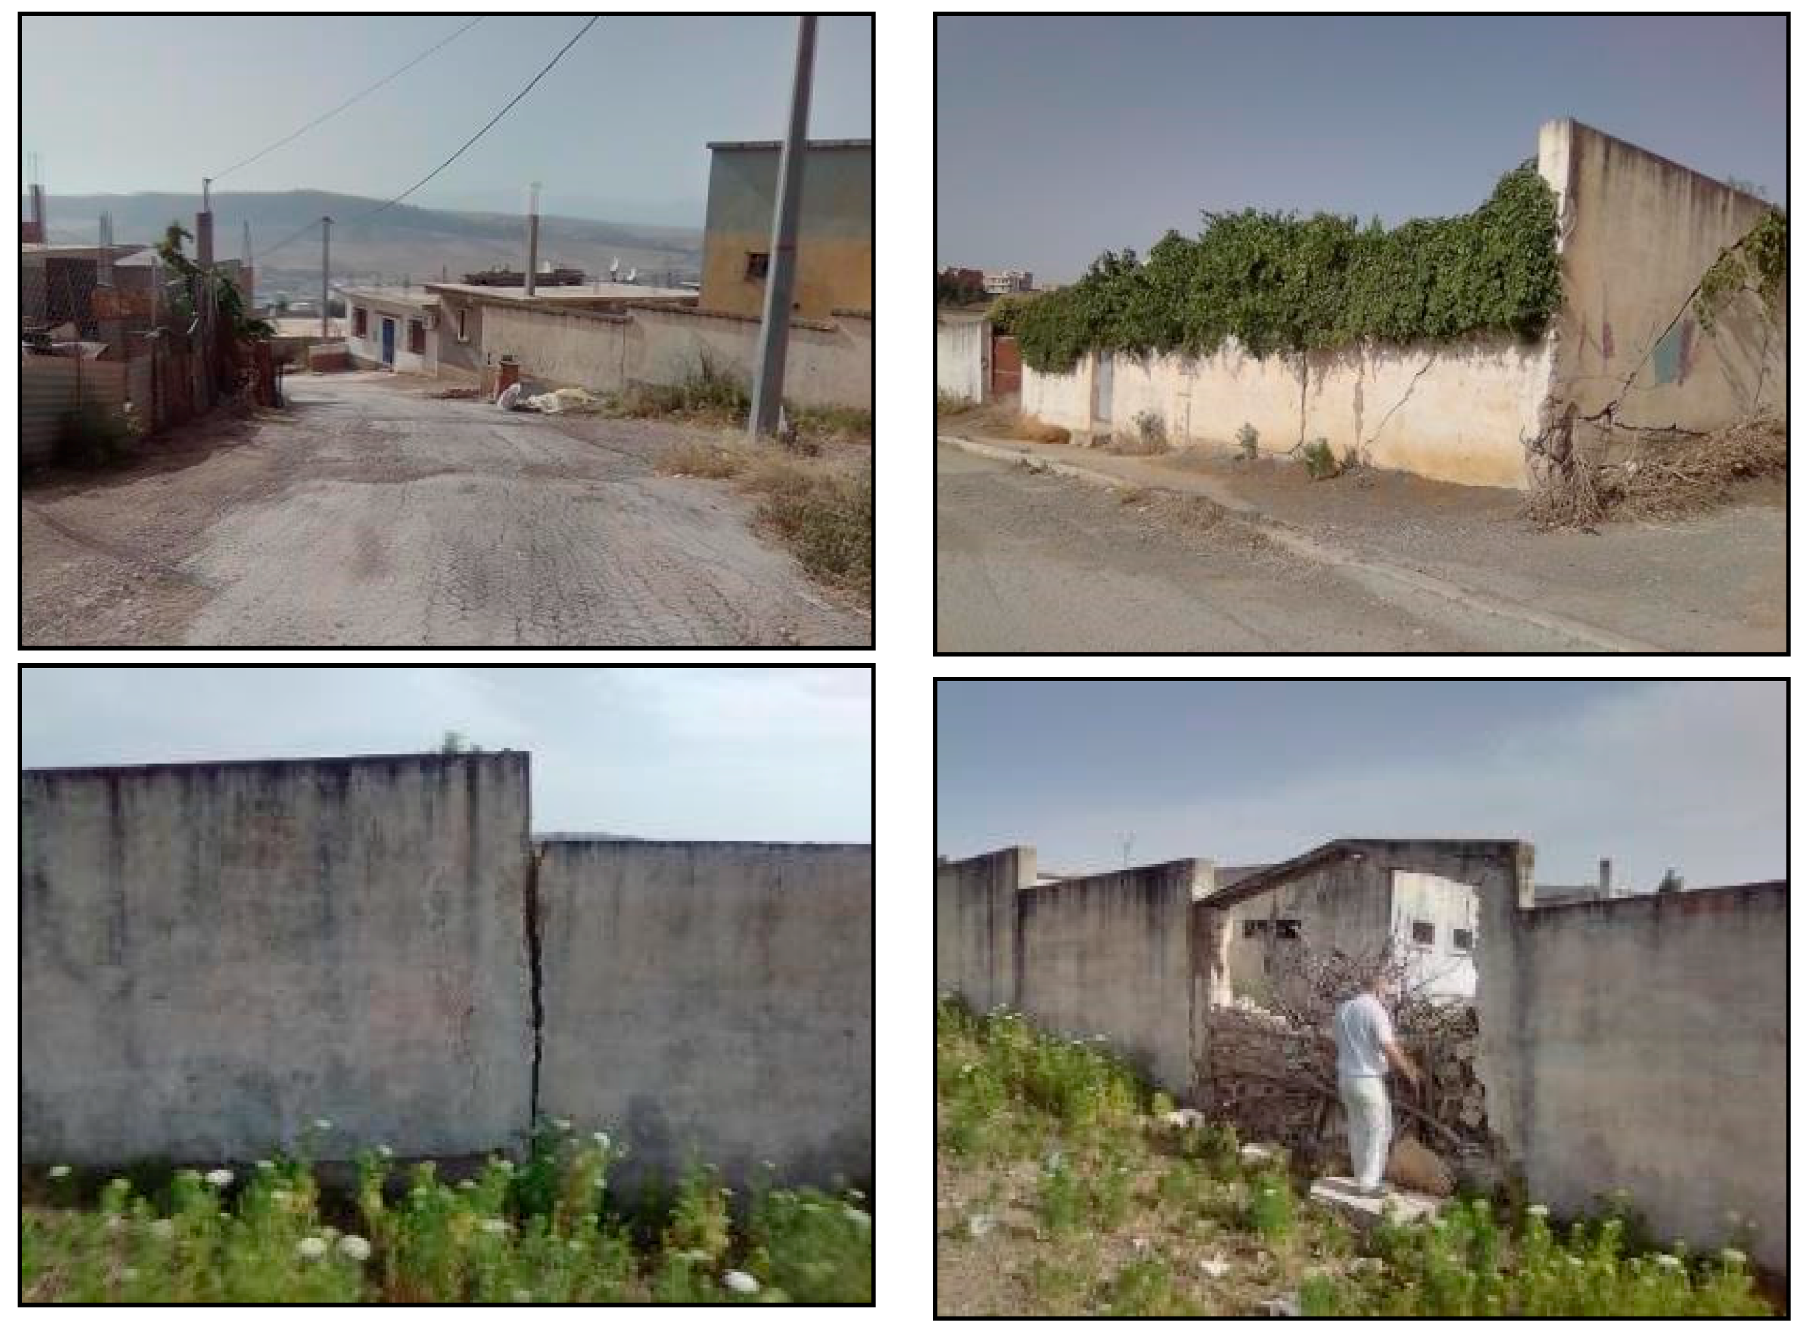
A field survey confirmed the deformations recorded by PS-InSAR, the photos in Figure 13 and Figure 14 show that the site is suffering from several movements, which put the life of the inhabitants in danger. Various forms of instability are observed on the roads of the various districts and in the building, which are often seriously damaged.
The causes of this instability are due to various natural and anthropic factors such as the predominance of lithological formations of soft consistency, the rugged topography of the slopes, the infiltration of rainwater in the soil, the lack of vegetation covers on degraded slopes, the degraded state of sanitary drainage networks of the city, the shabby construction, and the lack of drainage of rainwater. Before the urbanization, this site was characterized by a wavy and corrugated relief. Previous works describe the area as a place of a series of circular landslides, characterized by their steep slopes in the head followed against the bottom by a corrugated morphology at the lower downhill of the slipped mass. On the level of the western peak of the valley, instability takes shape by a large vertical displacement. It is located in the prolongation of an active landslide, where the higher part is consolidated by gabions. Other landslides were localized 200 m to the south and 120 m toward south-west, present a danger on constructions upstream and those located downstream [28].
The PS-InSAR analysis results were superimposed on the existing landslide, while a field investigation revealed damages to the buildings. Subsequently, new residential buildings remain uninhabited because of the appearance of numerous cracks on the pillars of the buildings. Some of these damages and the misplaced construction activities on active landslides could have been avoided, by using PS-InSAR based surface motion surveillance beforehand.
The causes of instability are due to the combination of natural and anthropogenic factors. Obvious surface motion in and around Constantine starts as soon as silty clay loam of slopes border or exceeds 10% in the lithological formations.
The obstruction of the natural network of drainage of the surface waters, which generate an active gullying, where the stagnation can generate other landslides. The urbanization accelerated the phenomenon of the landslides, by the passage of large machines on the slopes with argillaceous forming during construction. The various alteration works completed on-site involved the reactivation of some landslides. Currently, tension cracks are observed on the slopes of the site presenting a great danger in the future and must be considered very early by the authorities, so that the necessary safety measures can be taken in time.
6. Conclusions
We have presented examples of geomorphologic and geological hazard threatening the urban areas in the northeast of Algeria and landslides related to topographical/geological factors.
PS-InSAR highlights zones of deformations as it permits dense sampling of observations, several hundred measurements per square kilometer. The urban expansion of Constantine city faces landslides causing damages to many buildings. It is also exposed to flood risk near rivers. In Boussouf, causes are linked to low stability of the marly Miocene slopes, often disrupted by excessive earthworks, and occupation of riverbeds, which is also the case in the three other locations of the central part of Constantine, i.e., St Jean Road to Road Kitoni Abed Elmalek, Hay Elbir or district Boudraa Salah. On the contrary, in the northern part of Constantine the superposition of a geologic formation with high rheological contrast, and the fault network, can act as a potential detachment horizon. However, natural factors are not the only cause of landsides. Mining clays for the ceramic factory quarry in Didouche Mourad can accelerate the deformation. As we can see, Constantine has serious issues with landslides, therefore local authorities should keep an open eye on these phenomena. A permanent control is necessary to monitor the affected areas. A comparatively low cost and accurate way is surface motion estimation using PS-InSAR, especially with the global availability of Sentinel-1 data.
Finally, from the landslide hazard map, the several potentially most dangerous slides have been identified. Landslides in Constantine move constantly at slow velocities, a few centimeters per year on average. Damages to buildings are the result of cumulative displacements over several years, which is why the inhabitants do not want to evacuate their homes. The present work of hazard monitoring and risk monitoring, as well as the landslide inventory of existing studies has been strongly directed toward risk management and their application. Up-to-date results can be used to better estimate the nature and/or extent of such potential natural disasters with PS-InSAR.
Author Contributions
Conceptualization, O.B.; formal analysis, O.B.; investigation, M.A.; methodology, T.B.; supervision, T.B. and B.M.; writing—original draft, O.B.; writing—review and editing, T.B. and B.M.
Funding
This work was supported by the Natural Science Foundation of China under the Grant 61331016.
Acknowledgments
The authors would like to thank Daniele Perissin for providing the SarProZ software to support this research.
Conflicts of Interest
The authors declare no conflict of interest.
References
- Massonnet, D.; Rossi, M.; Carmona, C.; Adragna, F.; Peltzer, G.; Feigl, K.; Rabaute, T. The displacement field of the Landers earthquake mapped by radar interferometry. Nature 1993, 364, 138. [Google Scholar] [CrossRef]
- Ferretti, A.; Prati, C.; Rocca, F. Permanent scatterers in SAR interferometry. In Proceedings of the IEEE 1999 International Geoscience and Remote Sensing Symposium, Piscataway, NJ, USA, 28 June–2 July 1999; pp. 1528–1530. [Google Scholar]
- Ferretti, A.; Prati, C.; Rocca, F. Permanent scatterers in SAR interferometry. IEEE Trans. Geosci. Remote Sens. 2001, 39, 8–20. [Google Scholar] [CrossRef]
- Sillerico, E.; Ezquerro, P.; Marchamalo, M.; Herrera, G.; Duro, J.; Martínez, R. Monitoring ground subsidence in urban environments: M-30 tunnels under Madrid City (Spain). Ing. Investig. 2015, 35, 30–35. [Google Scholar]
- Prati, C.; Rocca, F.; Guarnieri, A.M.; Damonti, E. Seismic migration for SAR focusing: Interferometrical applications. IEEE Trans. Geosci. Remote Sens. 1990, 28, 627–640. [Google Scholar] [CrossRef]
- García, A.J.; Bakon, M.; Martínez, R.; Marchamalo, M. Evolution of urban monitoring with radar interferometry in Madrid City: Performance of ERS-1/ERS-2, ENVISAT, COSMO-SkyMed, and Sentinel-1 products. Int. J. Remote Sens. 2018, 39, 2969–2990. [Google Scholar] [CrossRef]
- Perissin, D.; Wang, Z.; Wang, T. The SARPROZ InSAR tool for urban subsidence/manmade structure stability monitoring in China. In Proceedings of the ISRSE, Sydney, Australia, 10–15 April 2011. [Google Scholar]
- Rosi, A.; Tofani, V.; Agostini, A.; Tanteri, L.; Stefanelli, C.T.; Catani, F.; Casagli, N. Subsidence mapping at regional scale using persistent scatters interferometry (PSI): The case of Tuscany region (Italy). Int. J. Appl. Earth Obs. Geoinf. 2016, 52, 328–337. [Google Scholar] [CrossRef]
- Sigmundsson, F.; Durand, P.; Massonnet, D. Opening of an eruptive fissure and seaward displacement at Piton de la Fournaise volcano measured by RADARSAT satellite radar interferometry. Geophys. Res. Lett. 1999, 26, 533–536. [Google Scholar] [CrossRef]
- Fiaschi, S.; Mantovani, M.; Frigerio, S.; Pasuto, A.; Floris, M. Testing the potential of Sentinel-1A TOPS interferometry for the detection and monitoring of landslides at local scale (Veneto Region, Italy). Environ. Earth Sci. 2017, 76, 492. [Google Scholar] [CrossRef]
- Colesanti, C.; Ferretti, A.; Prati, C.; Rocca, F. Monitoring landslides and tectonic motions with the Permanent Scatterers Technique. Eng. Geol. 2003, 68, 3–14. [Google Scholar] [CrossRef]
- Massonnet, D.; Sigmundsson, F. Remote sensing of volcano deformation by radar interferometry from various satellites. Remote Sens. Active Volcanism. 2000, 116, 207–221. [Google Scholar]
- Bell, J.W.; Amelung, F.; Ferretti, A.; Bianchi, M.; Novali, F. Permanent scatterer InSAR reveals seasonal and long-term aquifer-system response to groundwater pumping and artificial recharge. Water Resour. Res. 2008, 44, W02407. [Google Scholar] [CrossRef]
- Yu, X.; Hu, J.; Sun, Q. Estimating Actual 2D Ground Deformations Induced by Underground Activities with Cross-Heading InSAR Measurements. J. Sens. 2017, 2017. [Google Scholar] [CrossRef]
- Fiaschi, S.; Holohan, E.P.; Sheehy, M.; Floris, M. PS-InSAR Analysis of Sentinel-1 Data for Detecting Ground Motion in Temperate Oceanic Climate Zones: A Case Study in the Republic of Ireland. Remote Sens. 2019, 11, 348. [Google Scholar] [CrossRef]
- Rucci, A.; Ferretti, A.; Guarnieri, A.M.; Rocca, F. Sentinel 1 SAR interferometry applications: The outlook for sub millimeter measurements. Remote Sens. Environ. 2012, 120, 156–163. [Google Scholar] [CrossRef]
- Barra, A.; Solari, L.; Bejar, M.; Monserrat, O. A Methodology to Detect and Update Active Deformation Areas Based on Sentinel-1 SAR Images. Remote Sens. 2017, 9, 1002. [Google Scholar] [CrossRef]
- Guemache, M.A.; Chatelain, J.-L.; Machane, D.; Benahmed, S.; Djadia, L. Failure of Landslide Stabilization Measures: The Sidi Rached Viaduct Case (Constantine, Algeria). J. Afr. Earth Sci. 2011, 59, 349–358. [Google Scholar] [CrossRef]
- Hadji, R.; errahmane Boumazbeur, A.; Limani, Y.; Baghem, M.; el Madjid Chouabi, A.; Demdoum, A. Geologic, Topographic and Climatic Controls in Landslide Hazard Assessment Using GIS Modeling: A Case Study of Souk Ahras Region, NE Algeria. Quat. Int. 2013, 302, 224–237. [Google Scholar] [CrossRef]
- Cohen-Waeber, J.; Bürgmann, R.; Chaussard, E.; Giannico, C.; Ferretti, A. Spatiotemporal Patterns of Precipitation-Modulated Landslide Deformation from Independent Component Analysis of InSAR Time Series. Geophys. Res. Lett. 2018, 45, 1878–1887. [Google Scholar] [CrossRef]
- McKenzie, D. Active Tectonics of the Mediterranean Region. Geophys. J. R. Astron. Soc. 1972, 30, 109–185. [Google Scholar] [CrossRef] [Green Version]
- Aoudia, A.; Meghraoui, M. Seismotectonics in the Tell Atlas of Algeria: The Cavaignac (Abou El Hassan) Earthquake of 25.08. 1922 (Ms= 5.9). Tectonophysics 1995, 248, 263–276. [Google Scholar] [CrossRef]
- Mickus, K.; Jallouli, C. Crustal Structure beneath the Tell and Atlas Mountains (Algeria and Tunisia) through the Analysis of Gravity Data. Tectonophysics 1999, 314, 373–385. [Google Scholar] [CrossRef]
- Yelles-Chaouche, A.; Boudiaf, A.; Djellit, H.; Bracene, R. La Tectonique Active de La Région Nord-Algérienne. Comptes Rendus Geosci. 2006, 338, 126–139. [Google Scholar] [CrossRef]
- Hamdache, M.; Peláez, J.A.; Talbi, A.; Mobarki, M.; Casado, C.L. Ground-Motion Hazard Values for Northern Algeria. Pure Appl. Geophys. 2012, 169, 711–723. [Google Scholar] [CrossRef]
- Baba Hamed, F.Z.; Rahal, D.D.; Rahal, F. Seismic Risk Assessment of Algerian Buildings in Urban Area. J. Civ. Eng. Manag. 2013, 19, 348–363. [Google Scholar] [CrossRef]
- Bougdal, R.; Larriere, A.; Pincent, B.; Panet, M.; Bentabet, A. Les Glissements de Terrain Du Quartier Belouizdad, Constantine, Algérie. Bull. Eng. Geol. Environ. 2013, 72, 189–202. [Google Scholar] [CrossRef]
- Ministère de l’Habitat, de l’Urbanisme et de la Ville. La Direction de l’Urbanisme et de la Construction. Available online: http://www.mhuv.gov.dz (accessed on 10 January 2019).
- Vila, J.-M. La Chaîne Alpine de l’Algérie Orientale et Des Confins Algéro-Tunisiens. Ph.D. Thesis, Universite Pierre et Marie curie, Paris, France, 1980. [Google Scholar]
- Mattauer, M. Etude Géologique de l’Ouarsenis Oriental. Available online: http://hdl.handle.net/123456789/120630 (accessed on 4 July 2019).
- Benaissa, A.; Bellouche, M.A. Propriétés Géotechniques de Quelques Formations Géologiques Propices Aux Glissements de Terrains Dans l’agglomération de Constantine (Algérie). Bull. Eng. Geol. Environ. 1999, 57, 301–310. [Google Scholar] [CrossRef]
- Marmi, R.; Guiraud, R. End Cretaceous to Recent Polyphased Compressive Tectonics along the “Mole Constantinois” and Foreland (NE Algeria). J. African Earth Sci. 2006, 45, 123–136. [Google Scholar] [CrossRef]
- Buforn, E.; De Galdeano, C.S.; Udías, A. Seismotectonics of the Ibero-Maghrebian Region. Tectonophysics 1995, 248, 247–261. [Google Scholar] [CrossRef]
- Kherroubi, A.; Déverchère, J.; Yelles, A.; De Lépinay, B.M.; Domzig, A.; Cattaneo, A.; Bracène, R.; Gaullier, V.; Graindorge, D. Recent and Active Deformation Pattern off the Easternmost Algerian Margin, Western Mediterranean Sea: New Evidence for Contractional Tectonic Reactivation. Mar. Geol. 2009, 261, 17–32. [Google Scholar] [CrossRef]
- Bounif, A.; Haessler, H.; Meghraoui, M. The Constantine (Northeast Algeria) Earthquake of October 27, 1985: Surface Ruptures and Aftershock Study. Earth Planet. Sci. Lett. 1987, 85, 451–460. [Google Scholar] [CrossRef]
- Moreira, A.; Prats-Iraola, P.; Younis, M.; Krieger, G.; Hajnsek, I.; Papathanassiou, K.P. A Tutorial on Synthetic Aperture Radar. IEEE Geosci. Remote Sens. Mag. 2013, 1, 6–43. [Google Scholar] [CrossRef]
- Prats-Iraola, P.; Scheiber, R.; Marotti, L.; Wollstadt, S.; Reigber, A. TOPS Interferometry with TerraSAR-X. IEEE Trans. Geosci. Remote Sens. 2012, 50, 3179–3188. [Google Scholar] [CrossRef]
- Qin, Y.; Perissin, D.; Bai, J. Investigations on the Coregistration of Sentinel-1 TOPS with the Conventional Cross-Correlation Technique. Remote Sens. 2018, 10, 1405. [Google Scholar] [CrossRef]
- Qin, Y.; Perissin, D.; Bai, J. A Common “Stripmap-Like” Interferometric Processing Chain for TOPS and ScanSAR Wide Swath Mode. Remote Sens. 2018, 10, 1504. [Google Scholar] [CrossRef]
- Hanssen, R.F. Radar Interferometry: Data Interpretation and Error Analysis; Springer Science & Business Media: Berlin, Germany, 2001; Volume 2. [Google Scholar]
- Hooper, A.; Bekaert, D.; Spaans, K.; Arıkan, M. Recent Advances in SAR Interferometry Time Series Analysis for Measuring Crustal Deformation. Tectonophysics 2012, 514, 1–13. [Google Scholar] [CrossRef]
- Hooper, A. A Multi-temporal InSAR Method Incorporating Both Persistent Scatterer and Small Baseline Approaches. Geophys. Res. Lett. 2008, 35, L16302. [Google Scholar] [CrossRef]
- Farr, T.G.; Rosen, P.A.; Caro, E.; Crippen, R.; Duren, R.; Hensley, S.; Kobrick, M.; Paller, M.; Rodriguez, E.; Roth, L. The Shuttle Radar Topography Mission. Rev. Geophys. 2007, 45, RG2004. [Google Scholar] [CrossRef]
- Perissin, D. Interferometric SAR Multitemporal Processing: Techniques and Applications. In Multitemporal Remote Sensing; Springer: Cham, Switzerland, 2016; pp. 145–176. [Google Scholar]
Figure 1.
(a) Geographical location of the study area within northeast Algeria; (b) Provincial limit of the Constantine city and study area square.
Figure 1.
(a) Geographical location of the study area within northeast Algeria; (b) Provincial limit of the Constantine city and study area square.
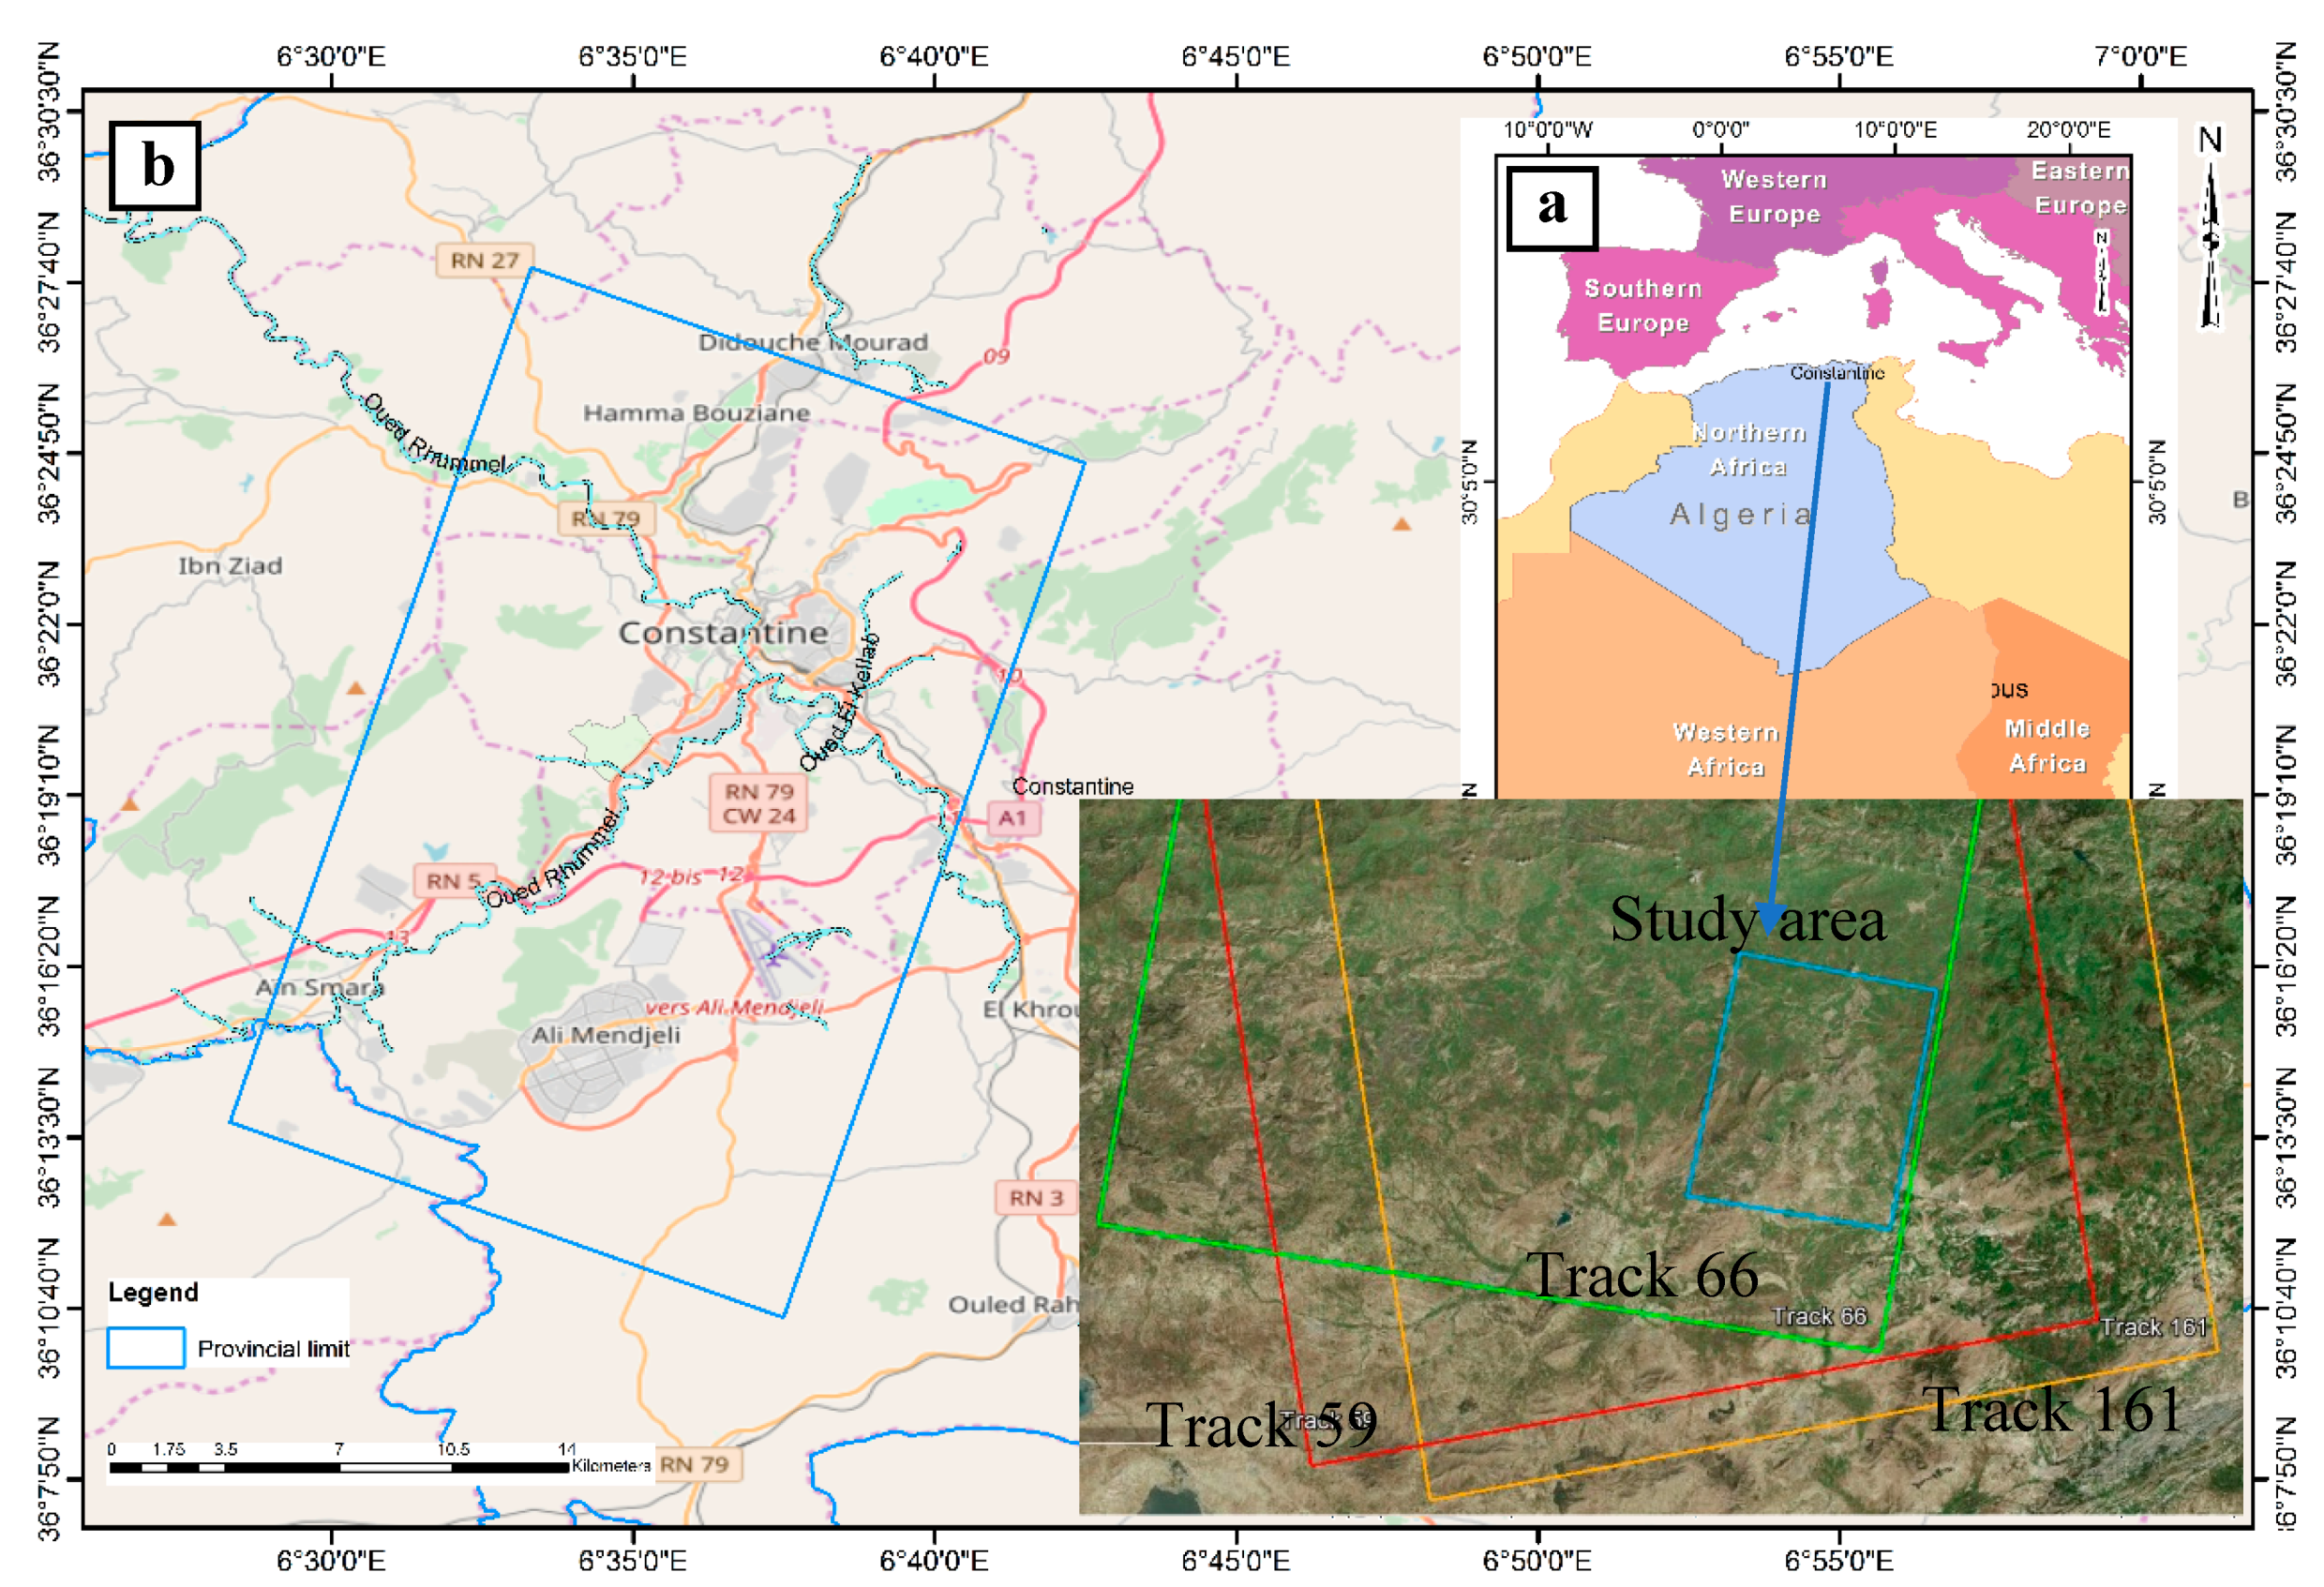
Figure 2.
Lithological map of the study area: 1—Quaternary colluviums, conglomerate and thick fill; 2—quaternary recent alluvial terraces; 3—quaternary ancient alluvial terraces; 4—quaternary lacustrine calcareous formations; 5—Pliocene lacustrine calcareous formations; 6—Miocene marly clay; 7—Miocene conglomerates; 8—flysh Massylian formations (upper cretaceous); 9—Tellian Calcareous marls (Cretaceous–Eocene); 10—neritic limestone (Cenomanian–Turonian).
Figure 3.
Main tectonic and kinematic regimes in the African–Eurasian plate boundaries.
Figure 4.
Map of active faults in Constantine region (Bouhadad 2009; CGS 2011a. Representation of Ain-Smara fault and Constantine city (Bounif et al. 1987)).
Figure 4.
Map of active faults in Constantine region (Bouhadad 2009; CGS 2011a. Representation of Ain-Smara fault and Constantine city (Bounif et al. 1987)).
Figure 5.
Star graph drawing showing the temporal/perpendicular baseline distribution of data pair of the orbit number 161. Blue lines represent the interferogram of two SAR acquisitions in blue dotes.
Figure 5.
Star graph drawing showing the temporal/perpendicular baseline distribution of data pair of the orbit number 161. Blue lines represent the interferogram of two SAR acquisitions in blue dotes.
Figure 6.
Star graph drawing showing the temporal/perpendicular baseline distribution of data pair of the orbit number 66. Blue lines represent the interferogram of two SAR acquisitions in blue dotes.
Figure 6.
Star graph drawing showing the temporal/perpendicular baseline distribution of data pair of the orbit number 66. Blue lines represent the interferogram of two SAR acquisitions in blue dotes.
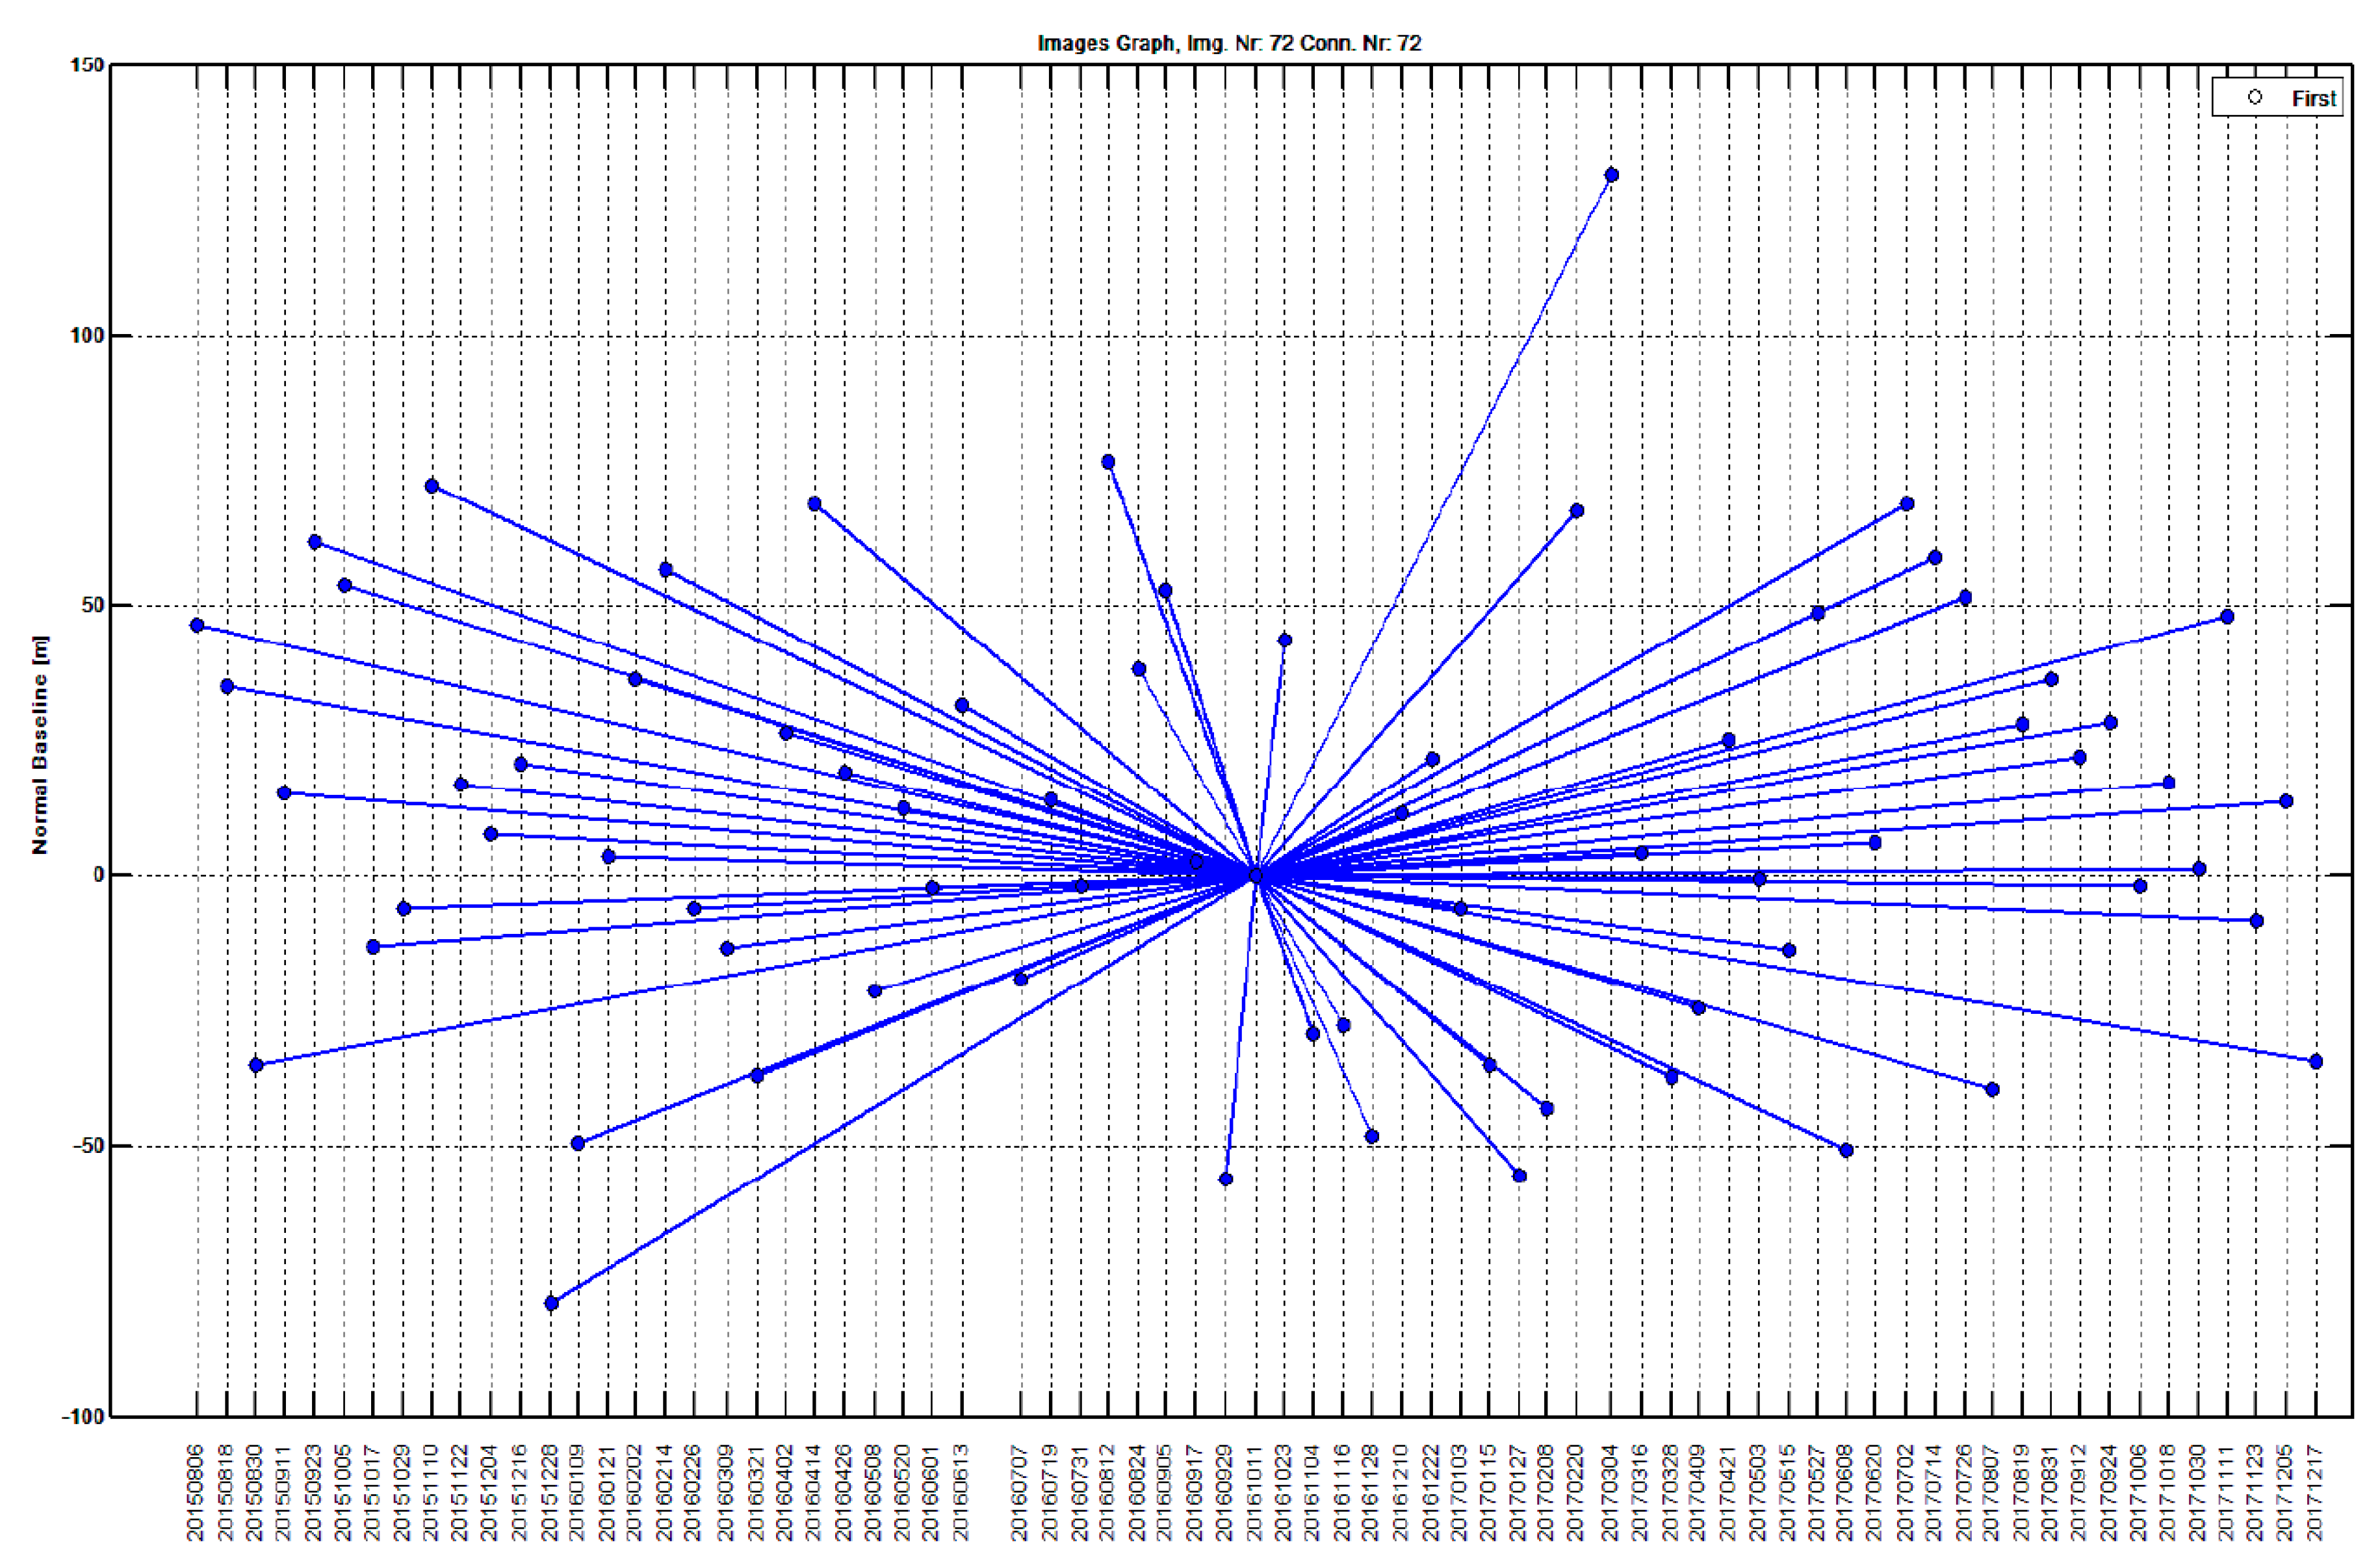
Figure 7.
Line-of-sight (LOS) mean deformation velocity map of Constantine of tracks 66 in (A) and 161 in (B) respectively.
Figure 7.
Line-of-sight (LOS) mean deformation velocity map of Constantine of tracks 66 in (A) and 161 in (B) respectively.
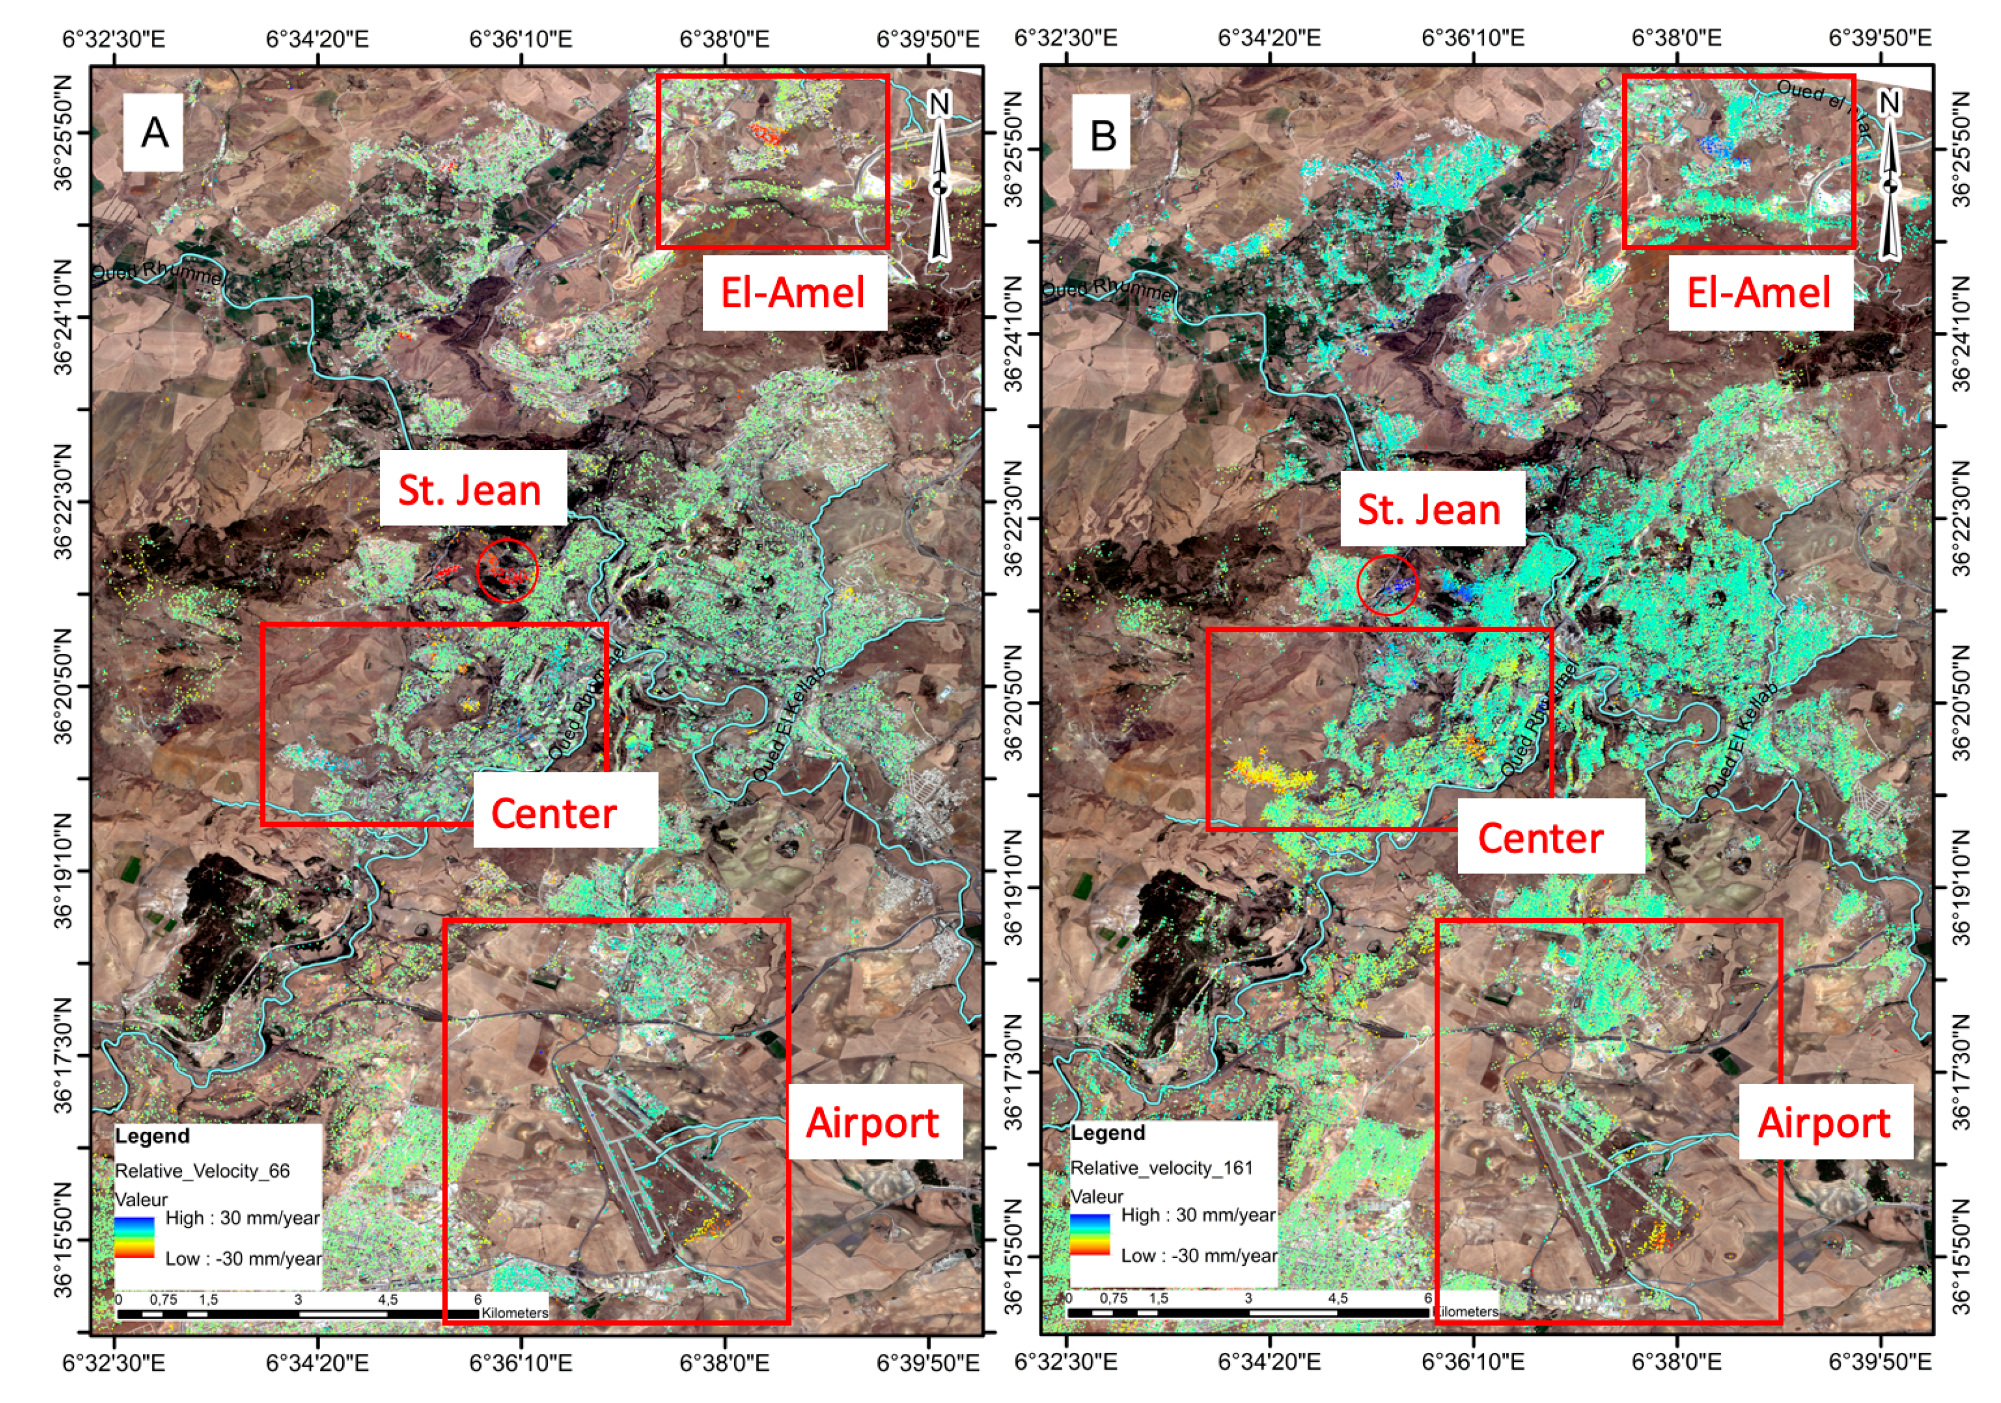
Figure 8.
Displacement time series of two points near St Jean. Left: track number 66; right: track number 161.
Figure 8.
Displacement time series of two points near St Jean. Left: track number 66; right: track number 161.
Figure 9.
LOS mean deformation velocity map of Constantine (center) of tracks 161 (A) and 66 (B).
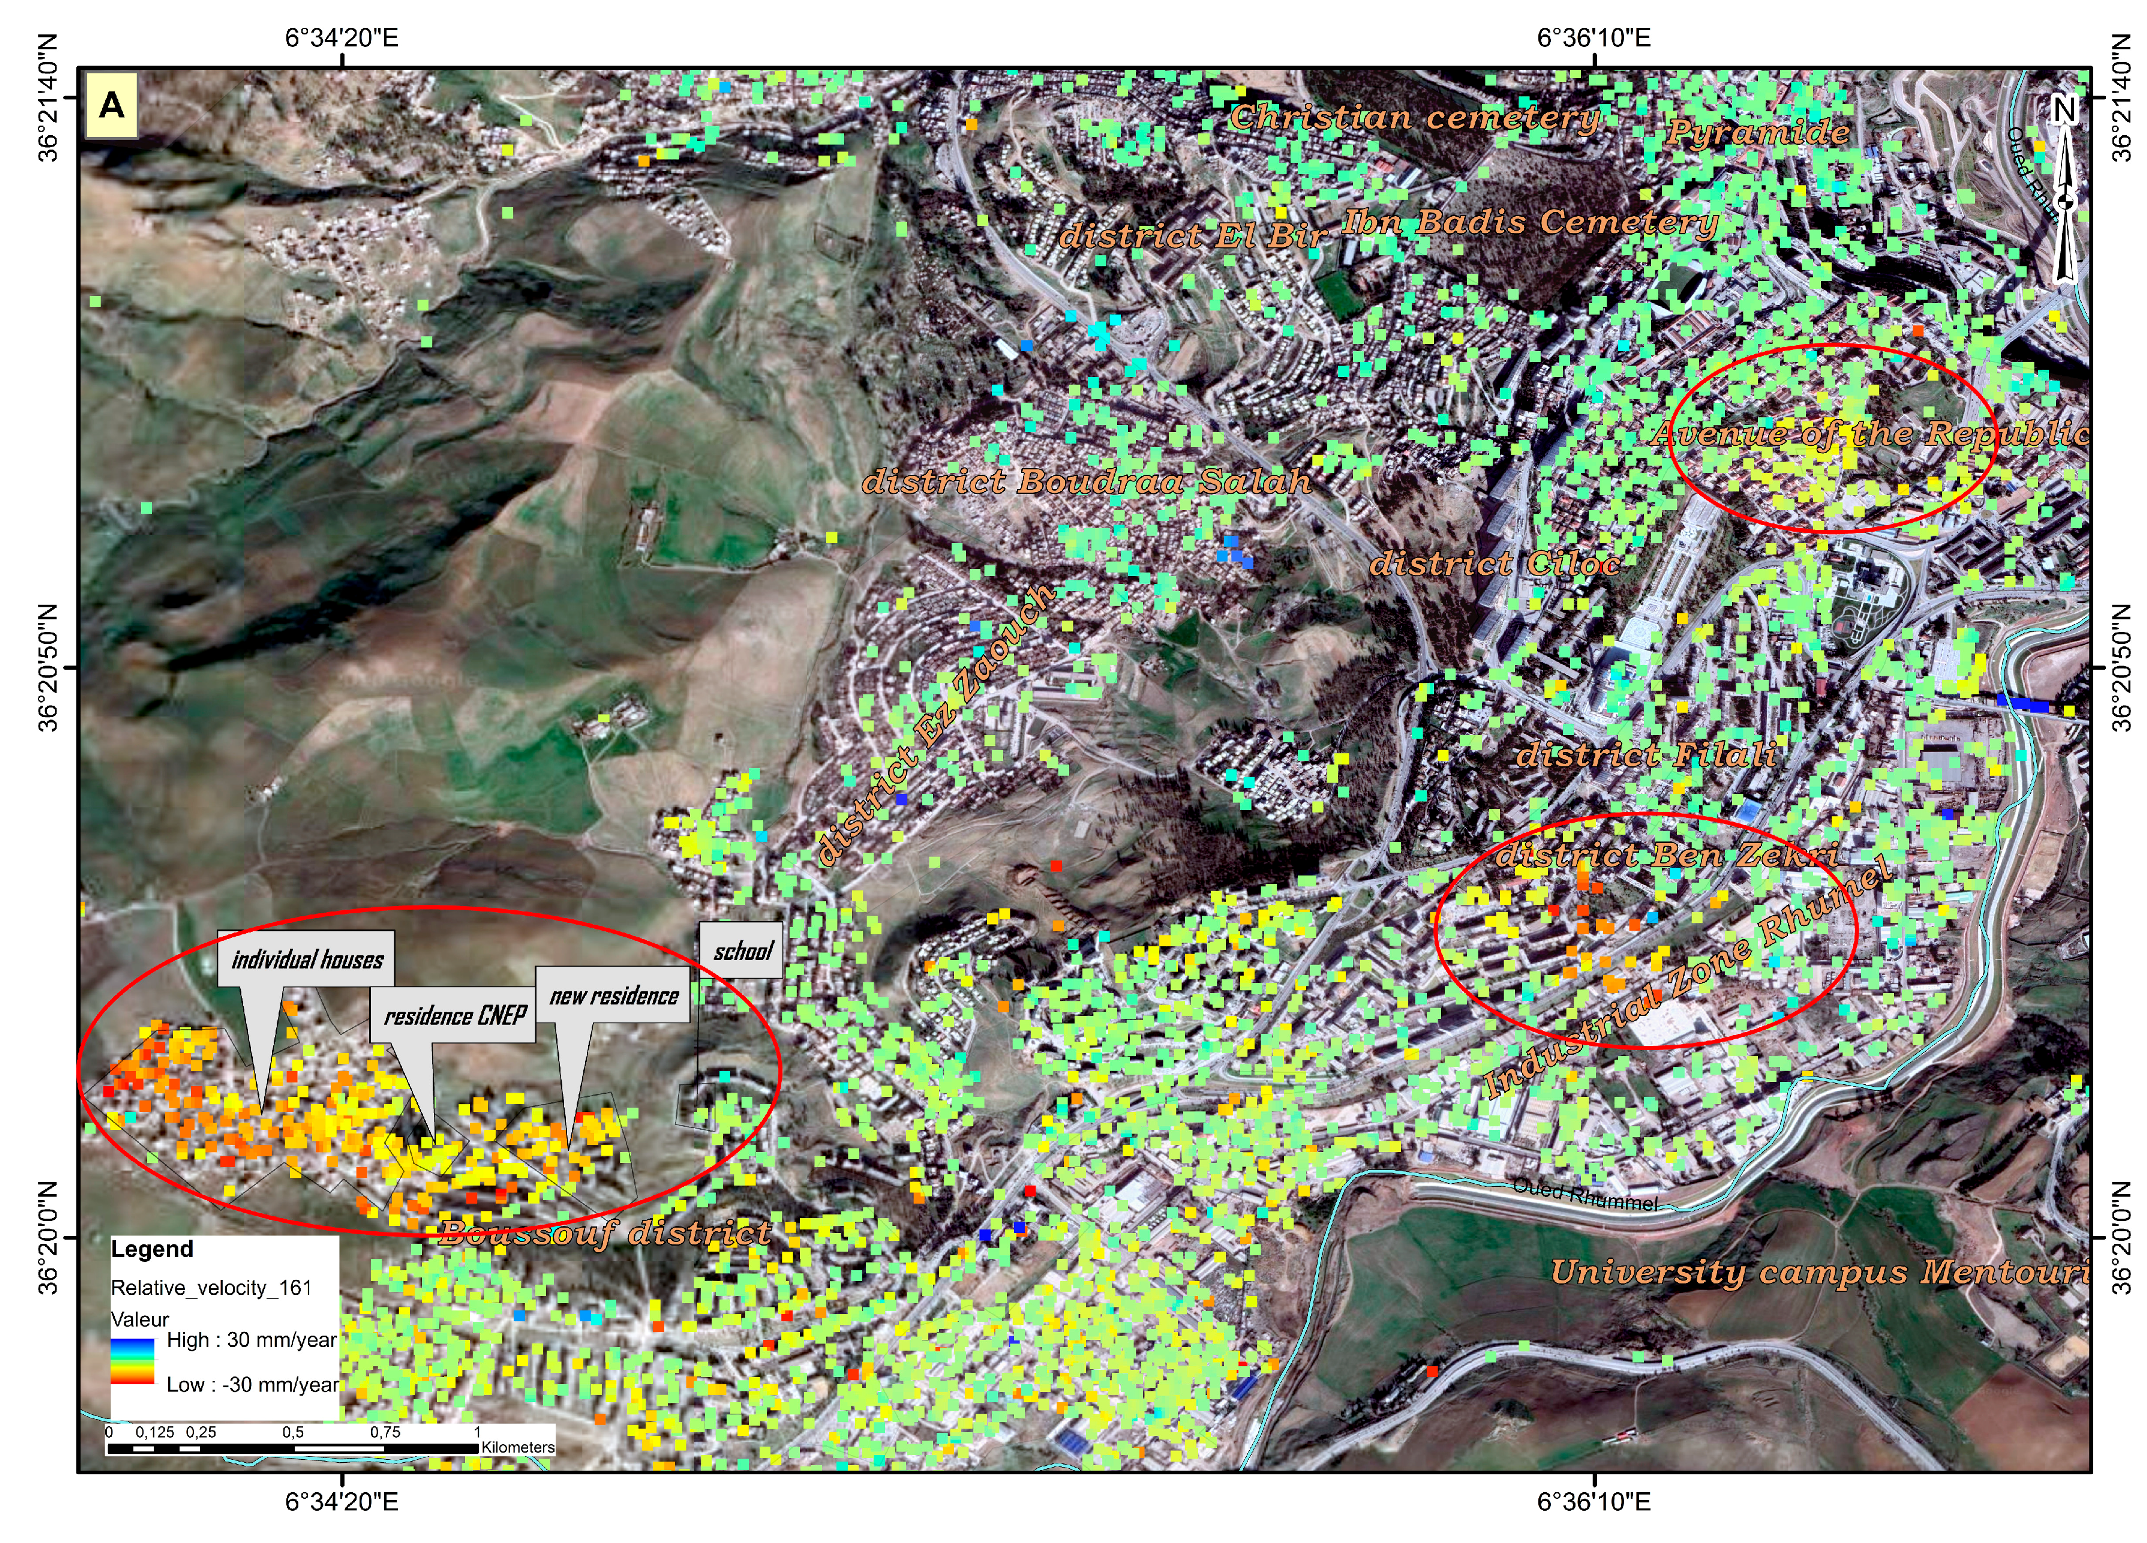
Figure 10.
Deformation map of El-Amal; (A) ascending orbit number 161; (B) descending orbit number 66.
Figure 10.
Deformation map of El-Amal; (A) ascending orbit number 161; (B) descending orbit number 66.
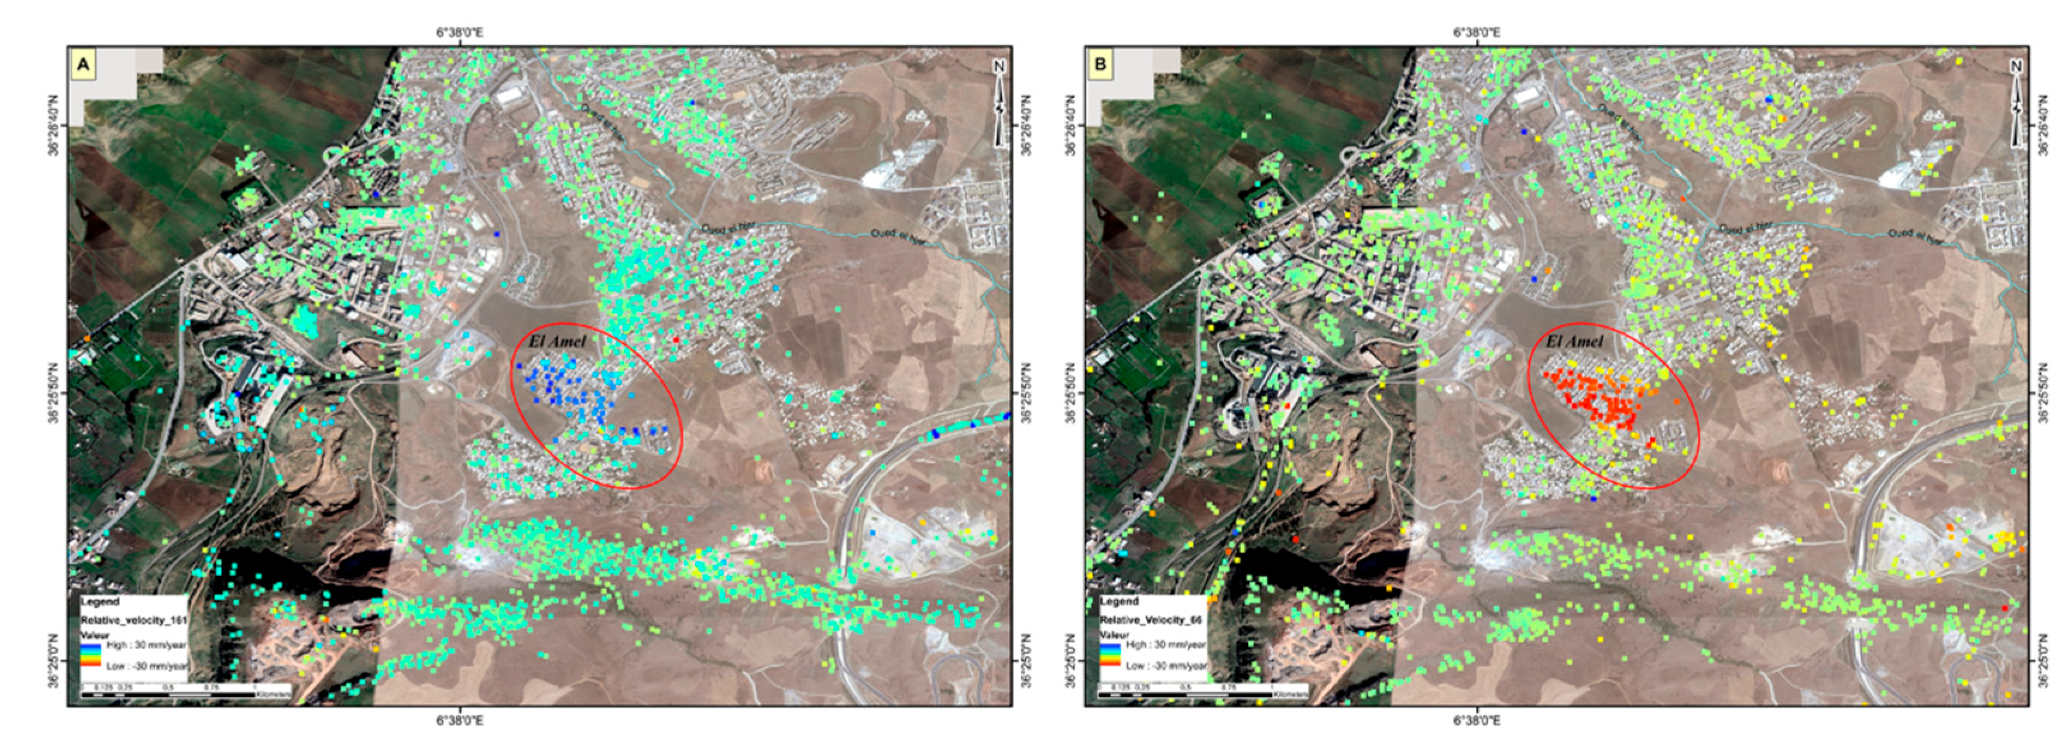
Figure 11.
Deformation map at the Constantine airport; (a) descending orbit number 66; (b) ascending orbit number 161.
Figure 11.
Deformation map at the Constantine airport; (a) descending orbit number 66; (b) ascending orbit number 161.
Figure 12.
Landslide damage on the infrastructure in Sidi Arab (South Didouche Mourad).
Figure 13.
Building damaged at the Boussouf district.
Figure 14.
Damaged school at the Boussouf district.
© 2019 by the authors. Licensee MDPI, Basel, Switzerland. This article is an open access article distributed under the terms and conditions of the Creative Commons Attribution (CC BY) license (http://creativecommons.org/licenses/by/4.0/).
Share and Cite
MDPI and ACS Style
Beladam, O.; Balz, T.; Mohamadi, B.; Abdalhak, M. Using PS-InSAR with Sentinel-1 Images for Deformation Monitoring in Northeast Algeria. Geosciences 2019, 9, 315. https://doi.org/10.3390/geosciences9070315
AMA Style
Beladam O, Balz T, Mohamadi B, Abdalhak M. Using PS-InSAR with Sentinel-1 Images for Deformation Monitoring in Northeast Algeria. Geosciences. 2019; 9(7):315. https://doi.org/10.3390/geosciences9070315
Chicago/Turabian StyleBeladam, Omar, Timo Balz, Bahaa Mohamadi, and Mahdjoub Abdalhak. 2019. "Using PS-InSAR with Sentinel-1 Images for Deformation Monitoring in Northeast Algeria" Geosciences 9, no. 7: 315. https://doi.org/10.3390/geosciences9070315
Note that from the first issue of 2016, this journal uses article numbers instead of page numbers. See further details here.