Regional Landslide Potential Mapping in Earthquake-Prone Areas of Kepahiang Regency, Bengkulu Province, Indonesia

 ,
,
Abstract
:1. Introduction
2. Materials and Methods
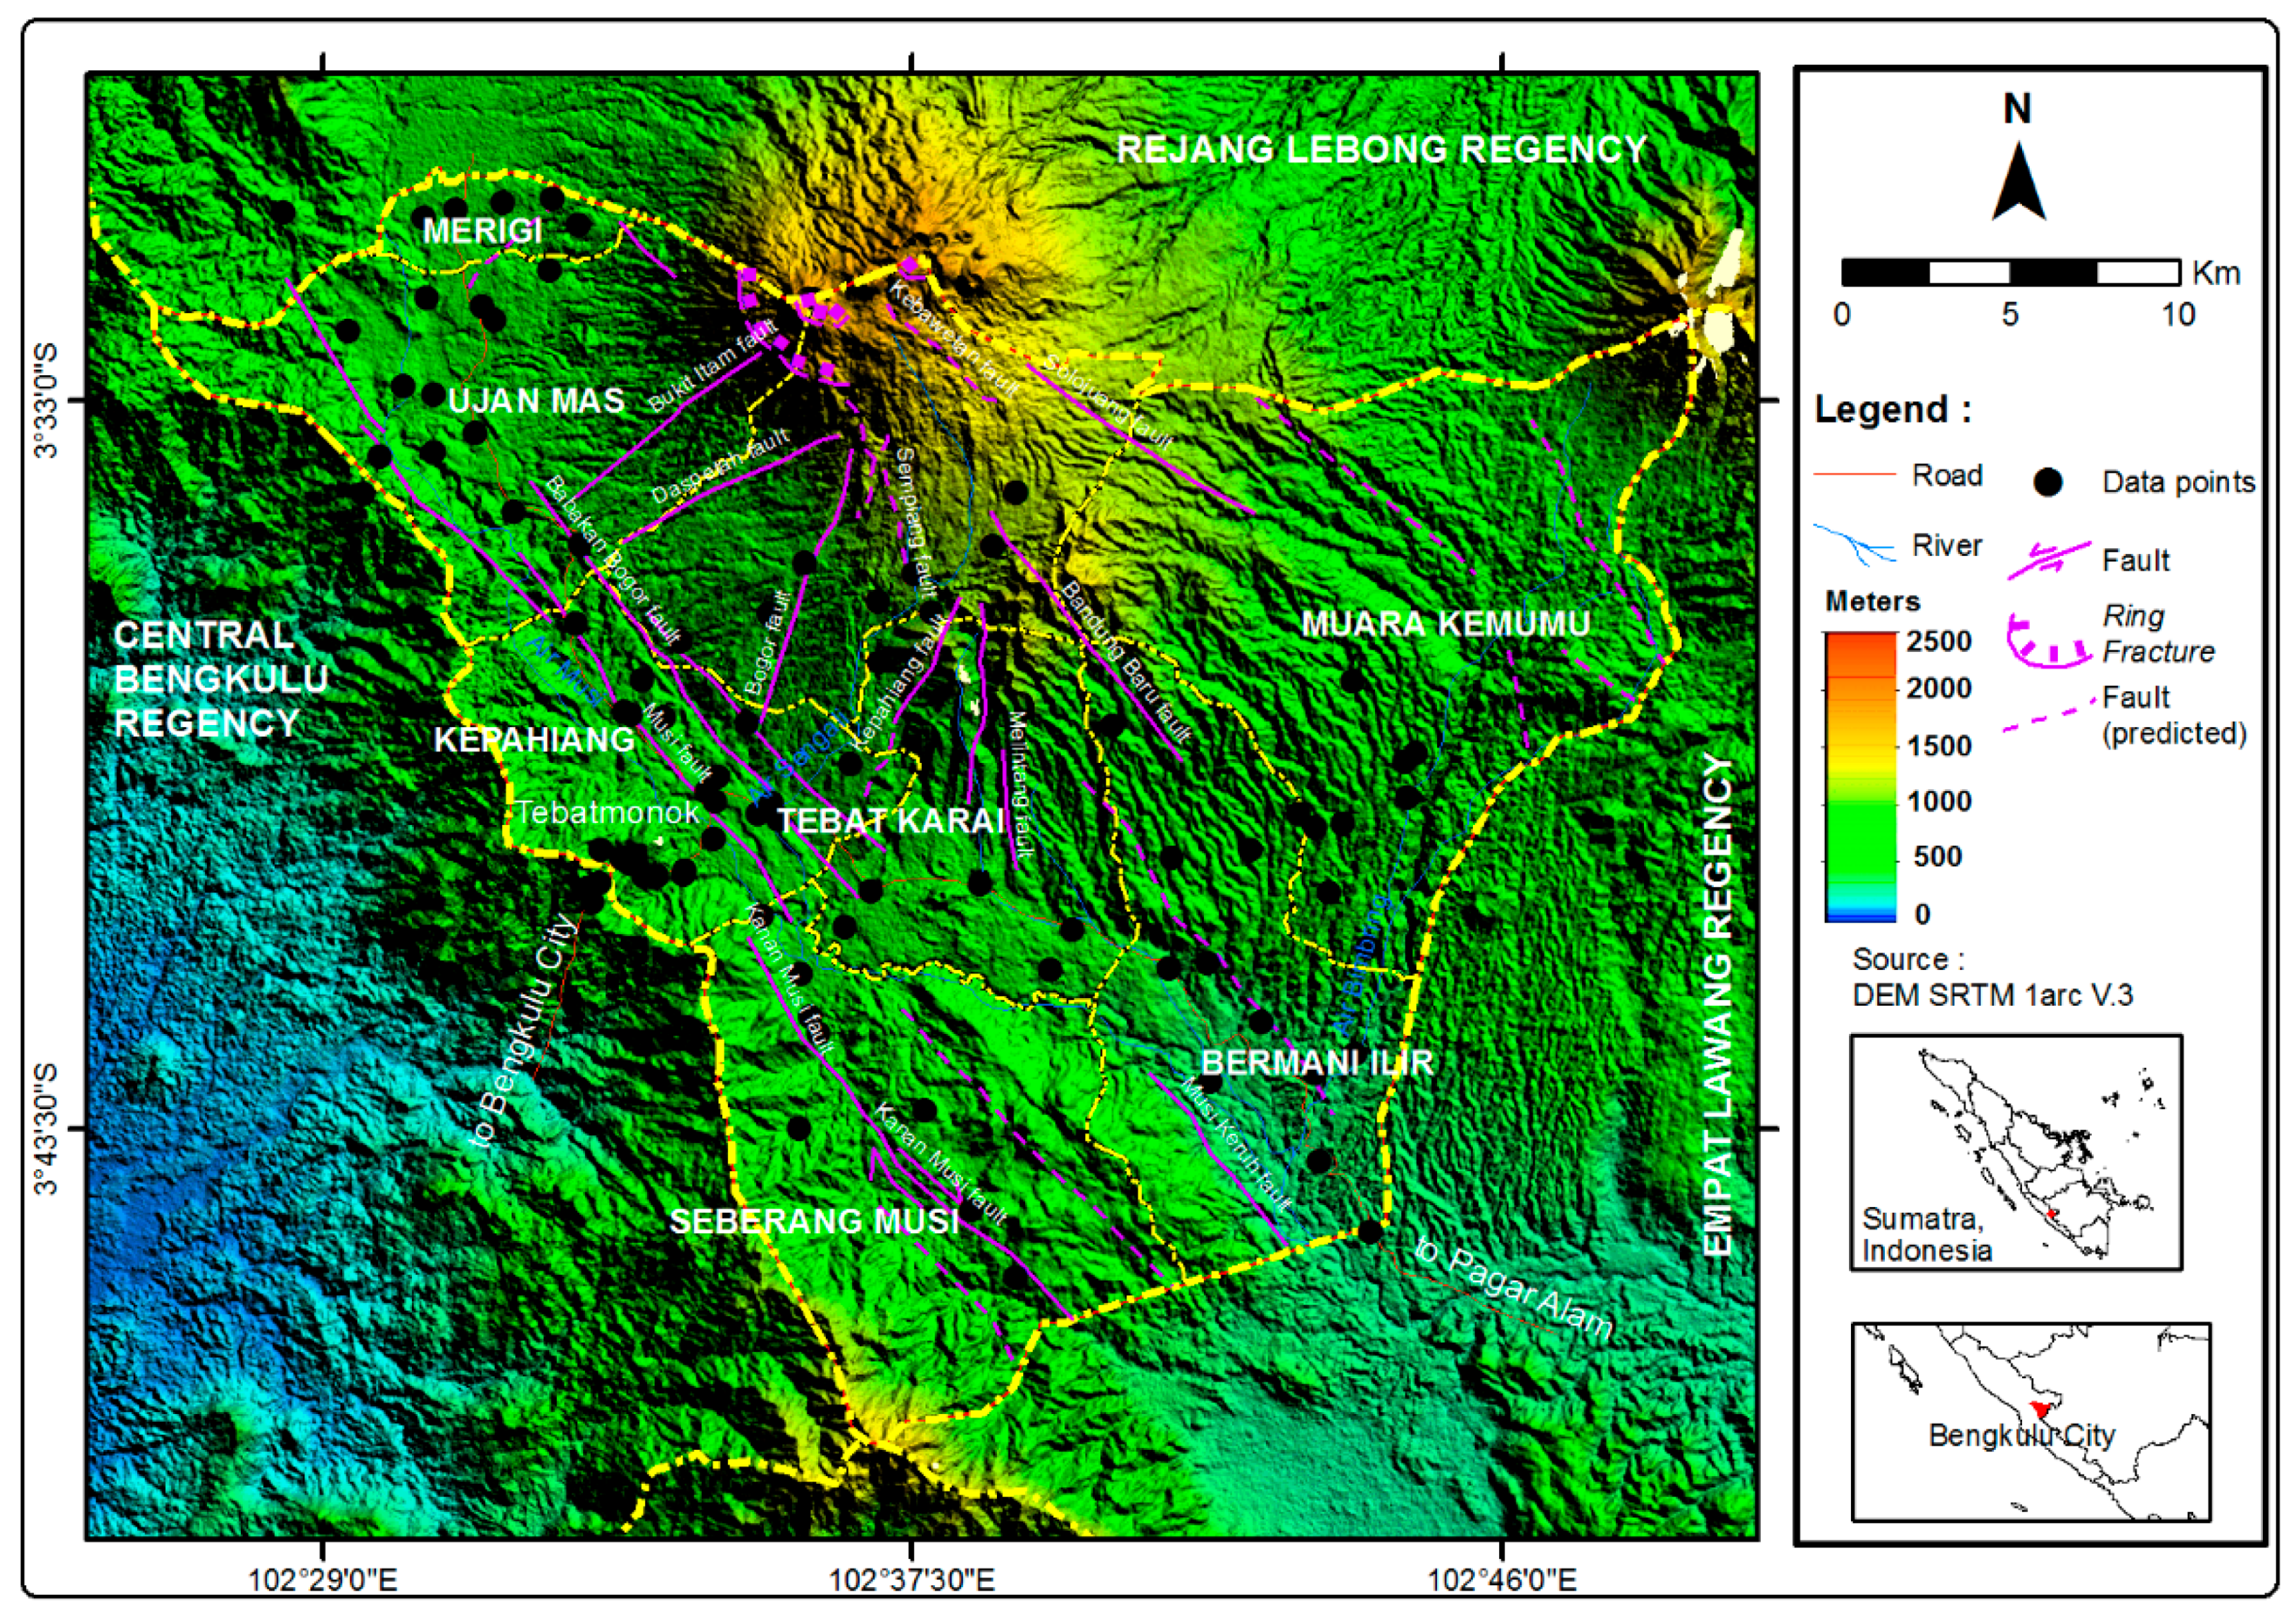
2.1. Data Acquisition
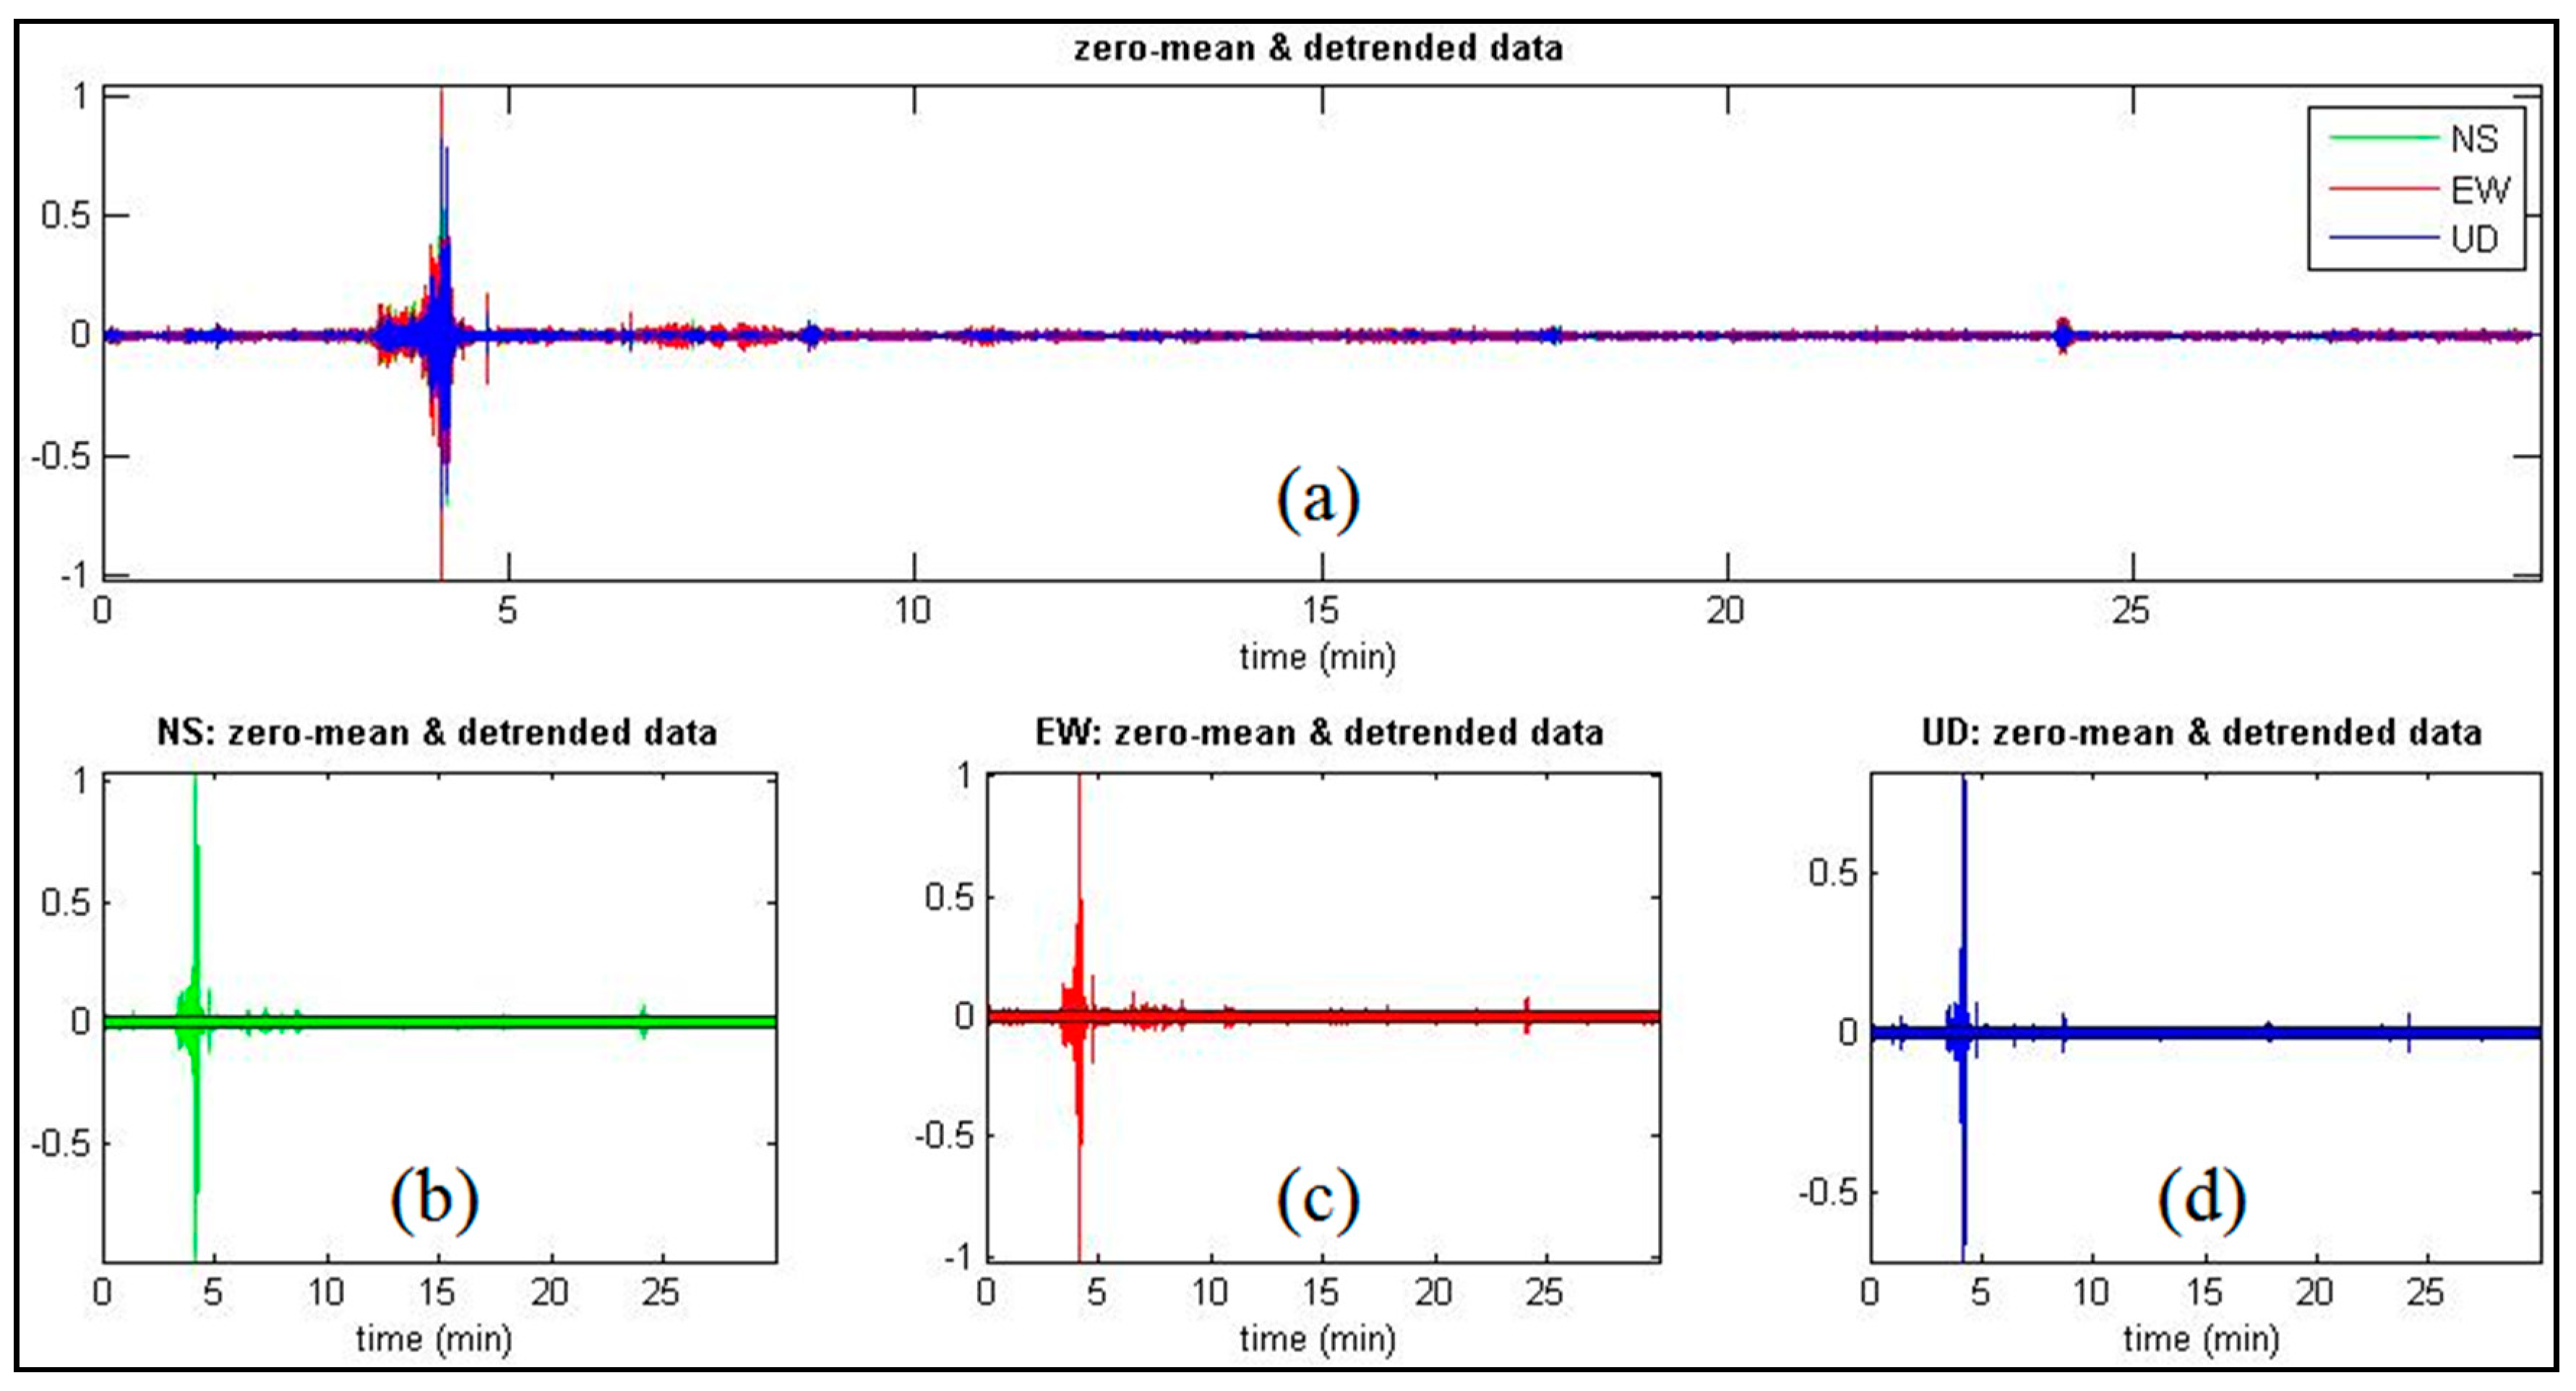
2.2. Data Processing
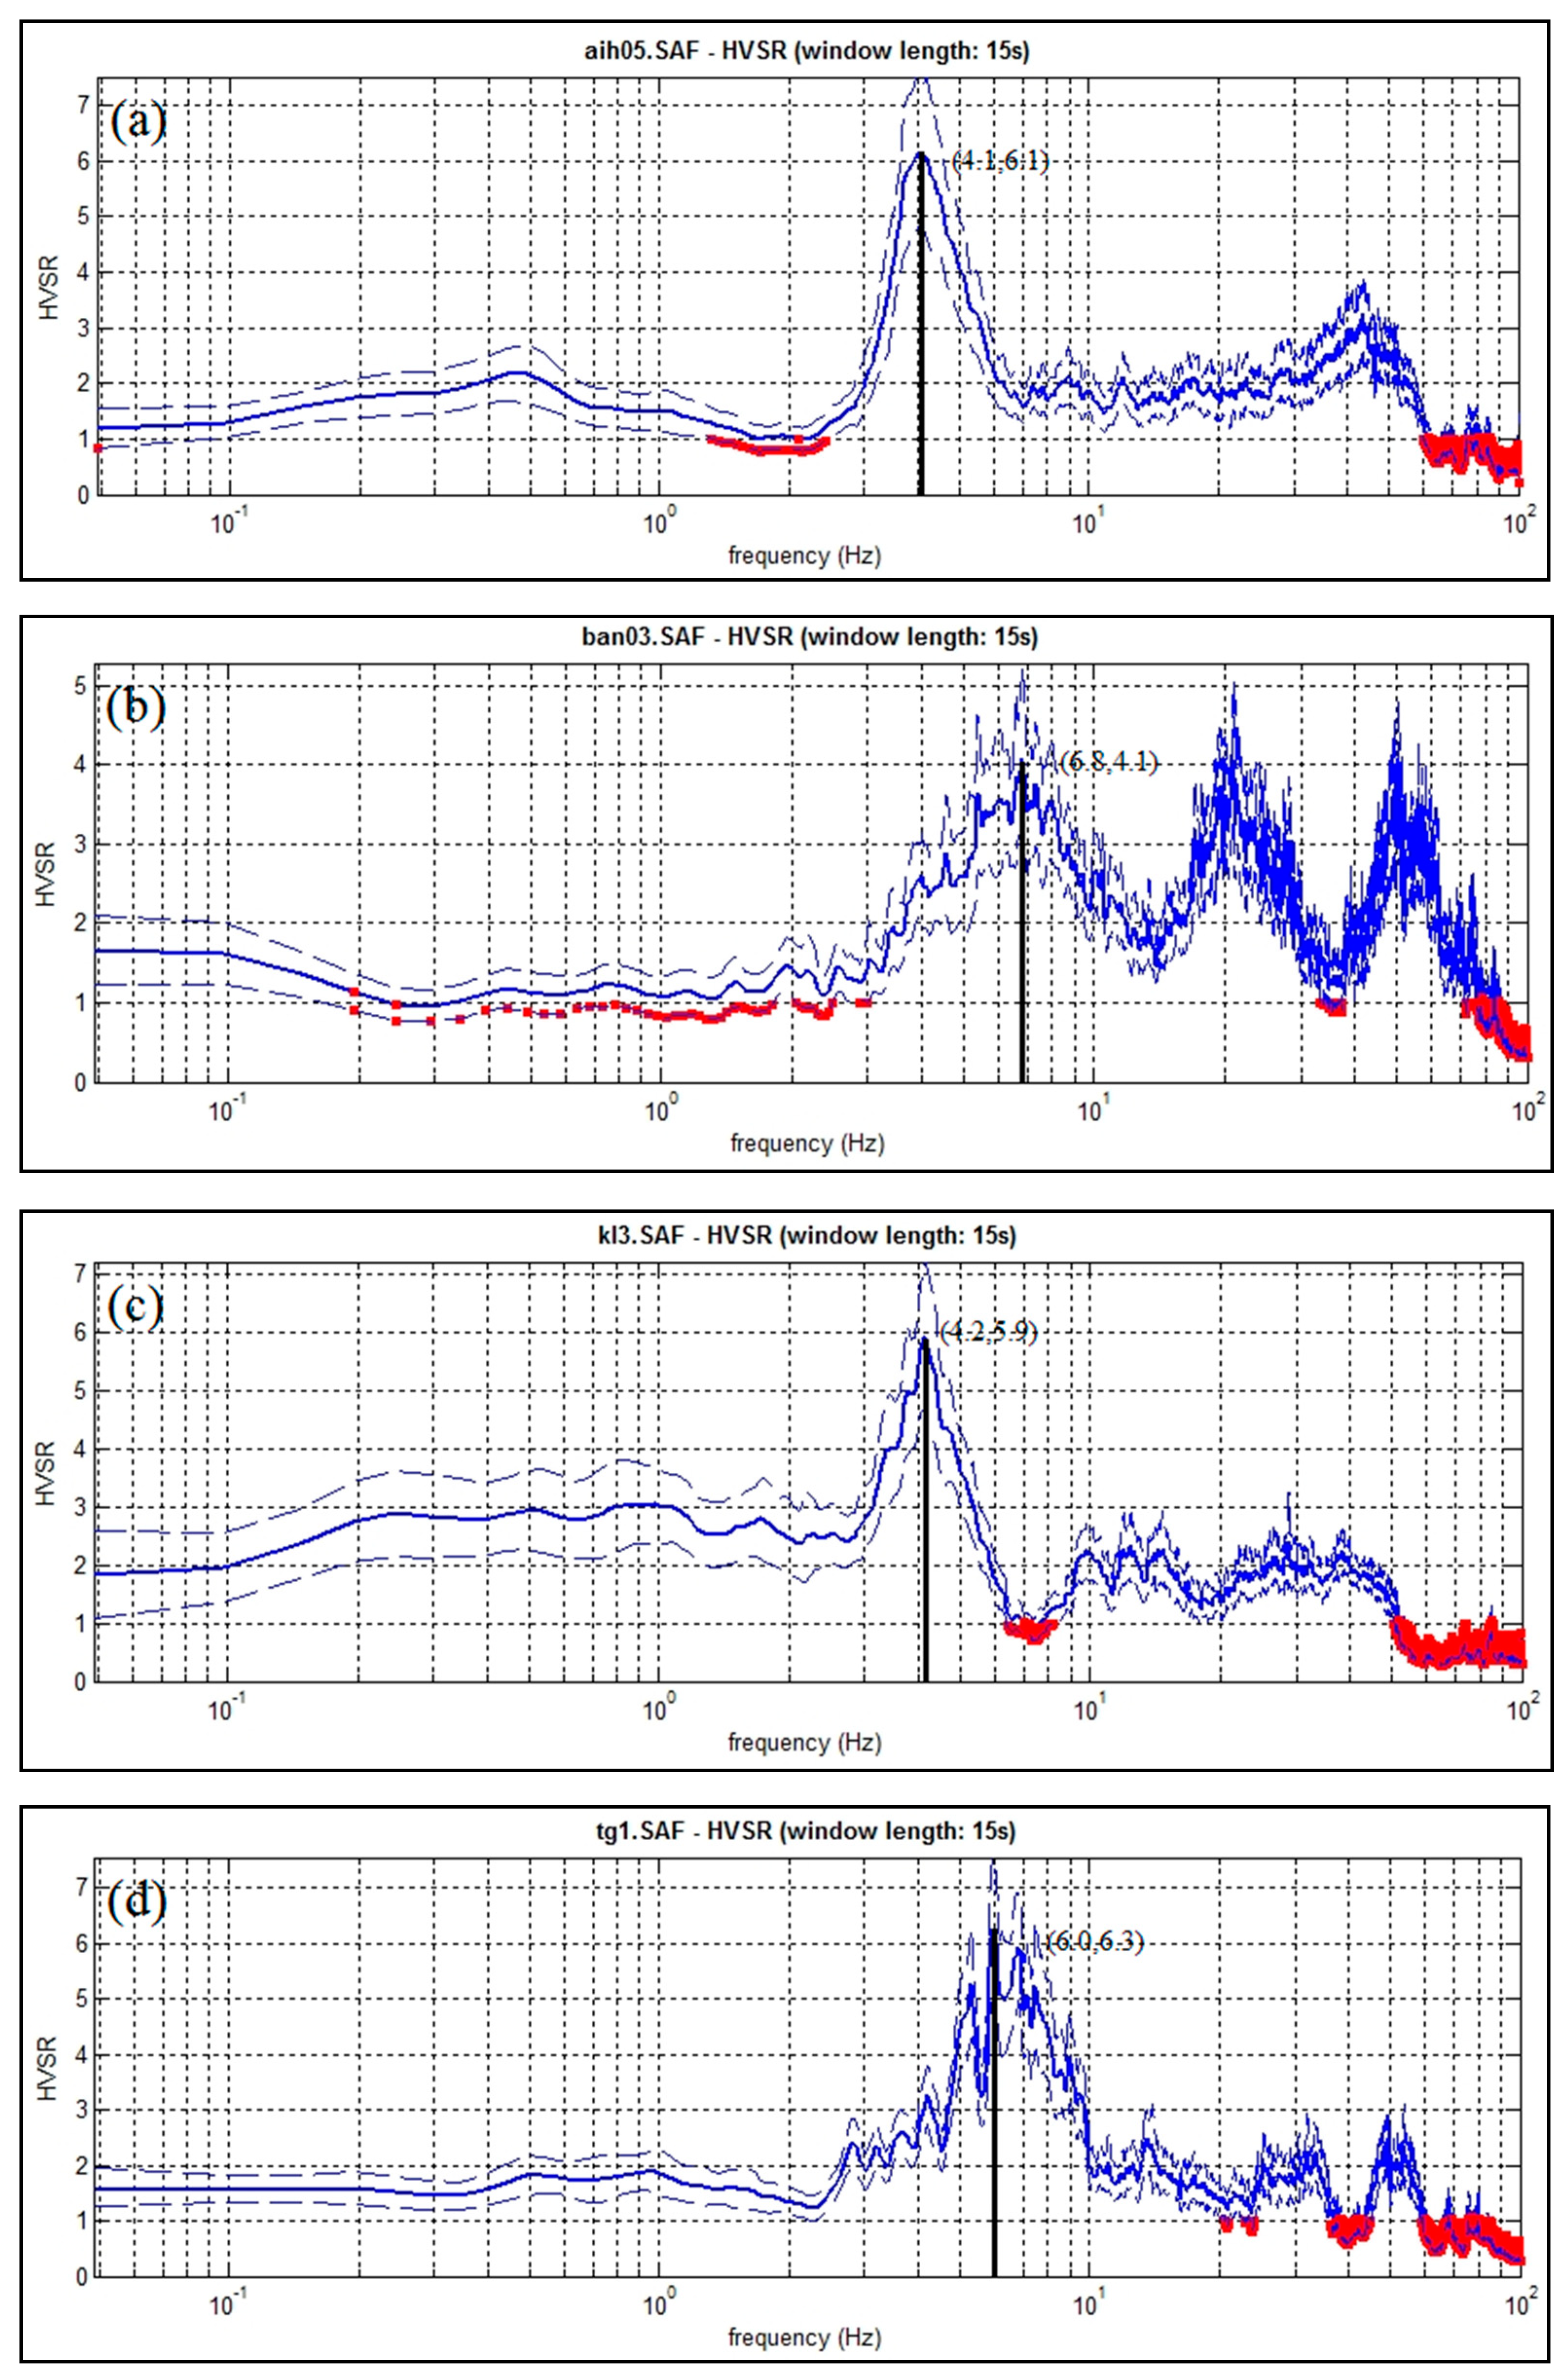
2.3. Data Analysis and Interpretation
3. Results
3.1. Microtremor Recording
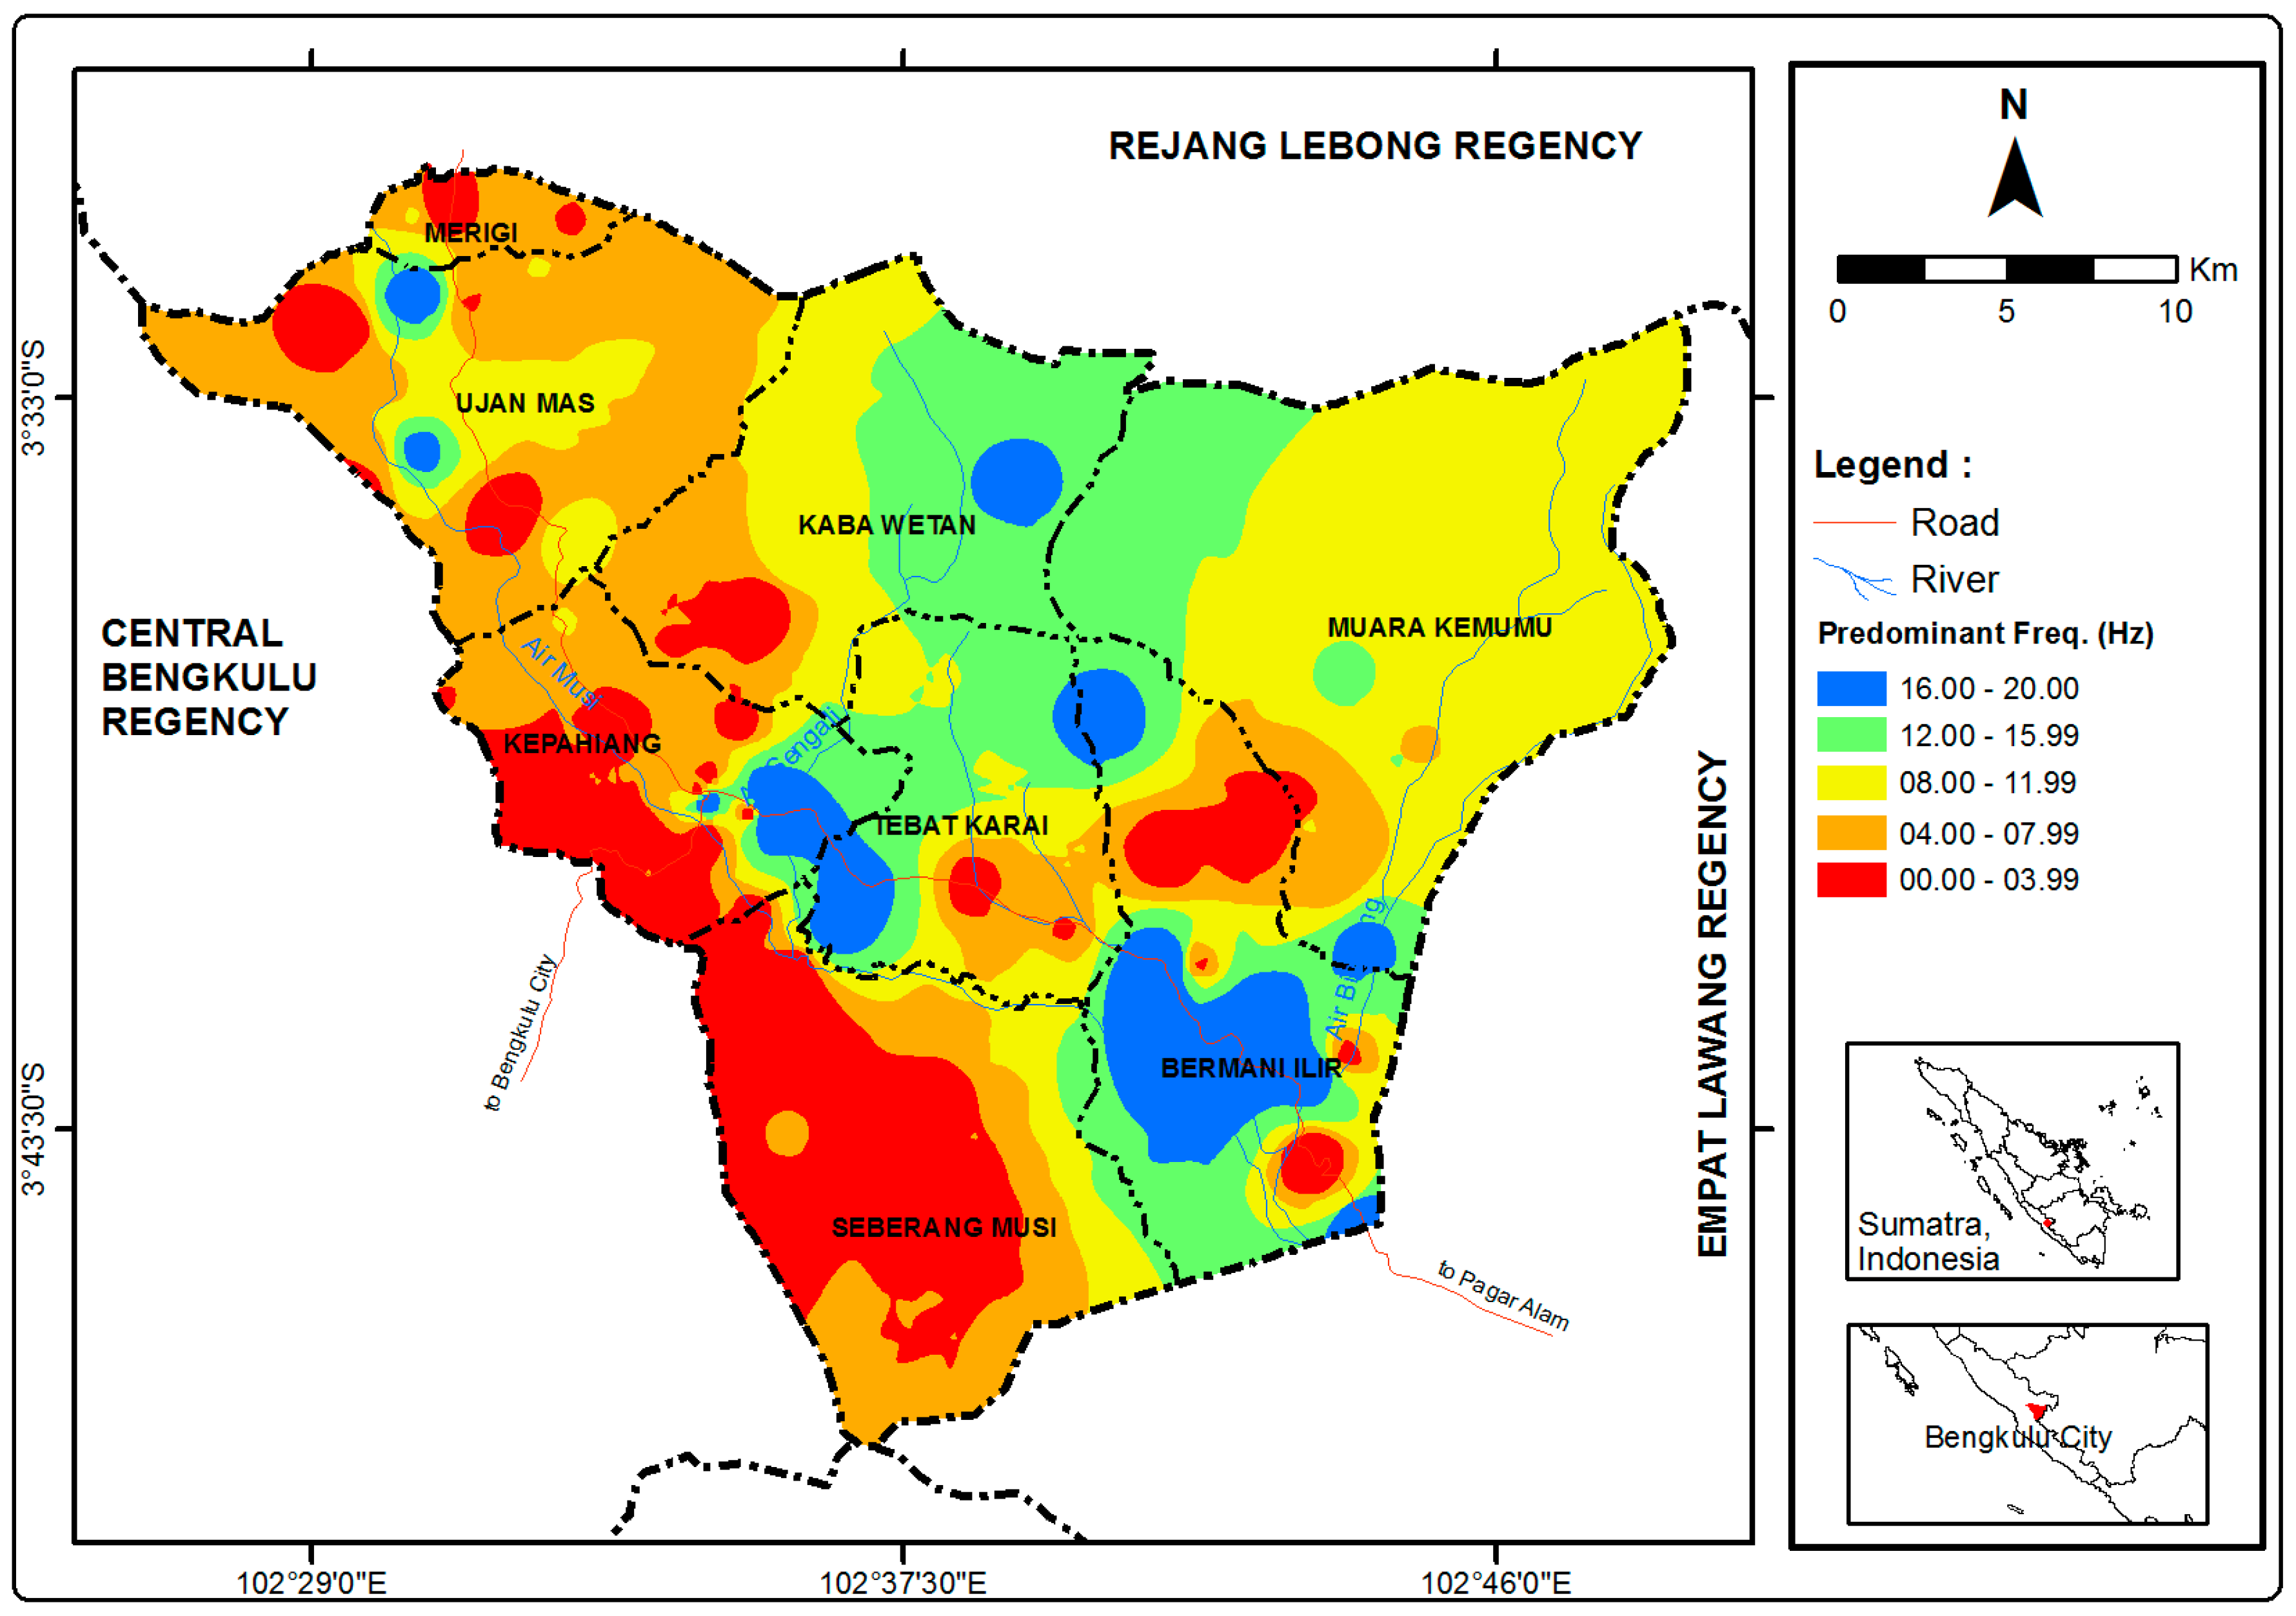
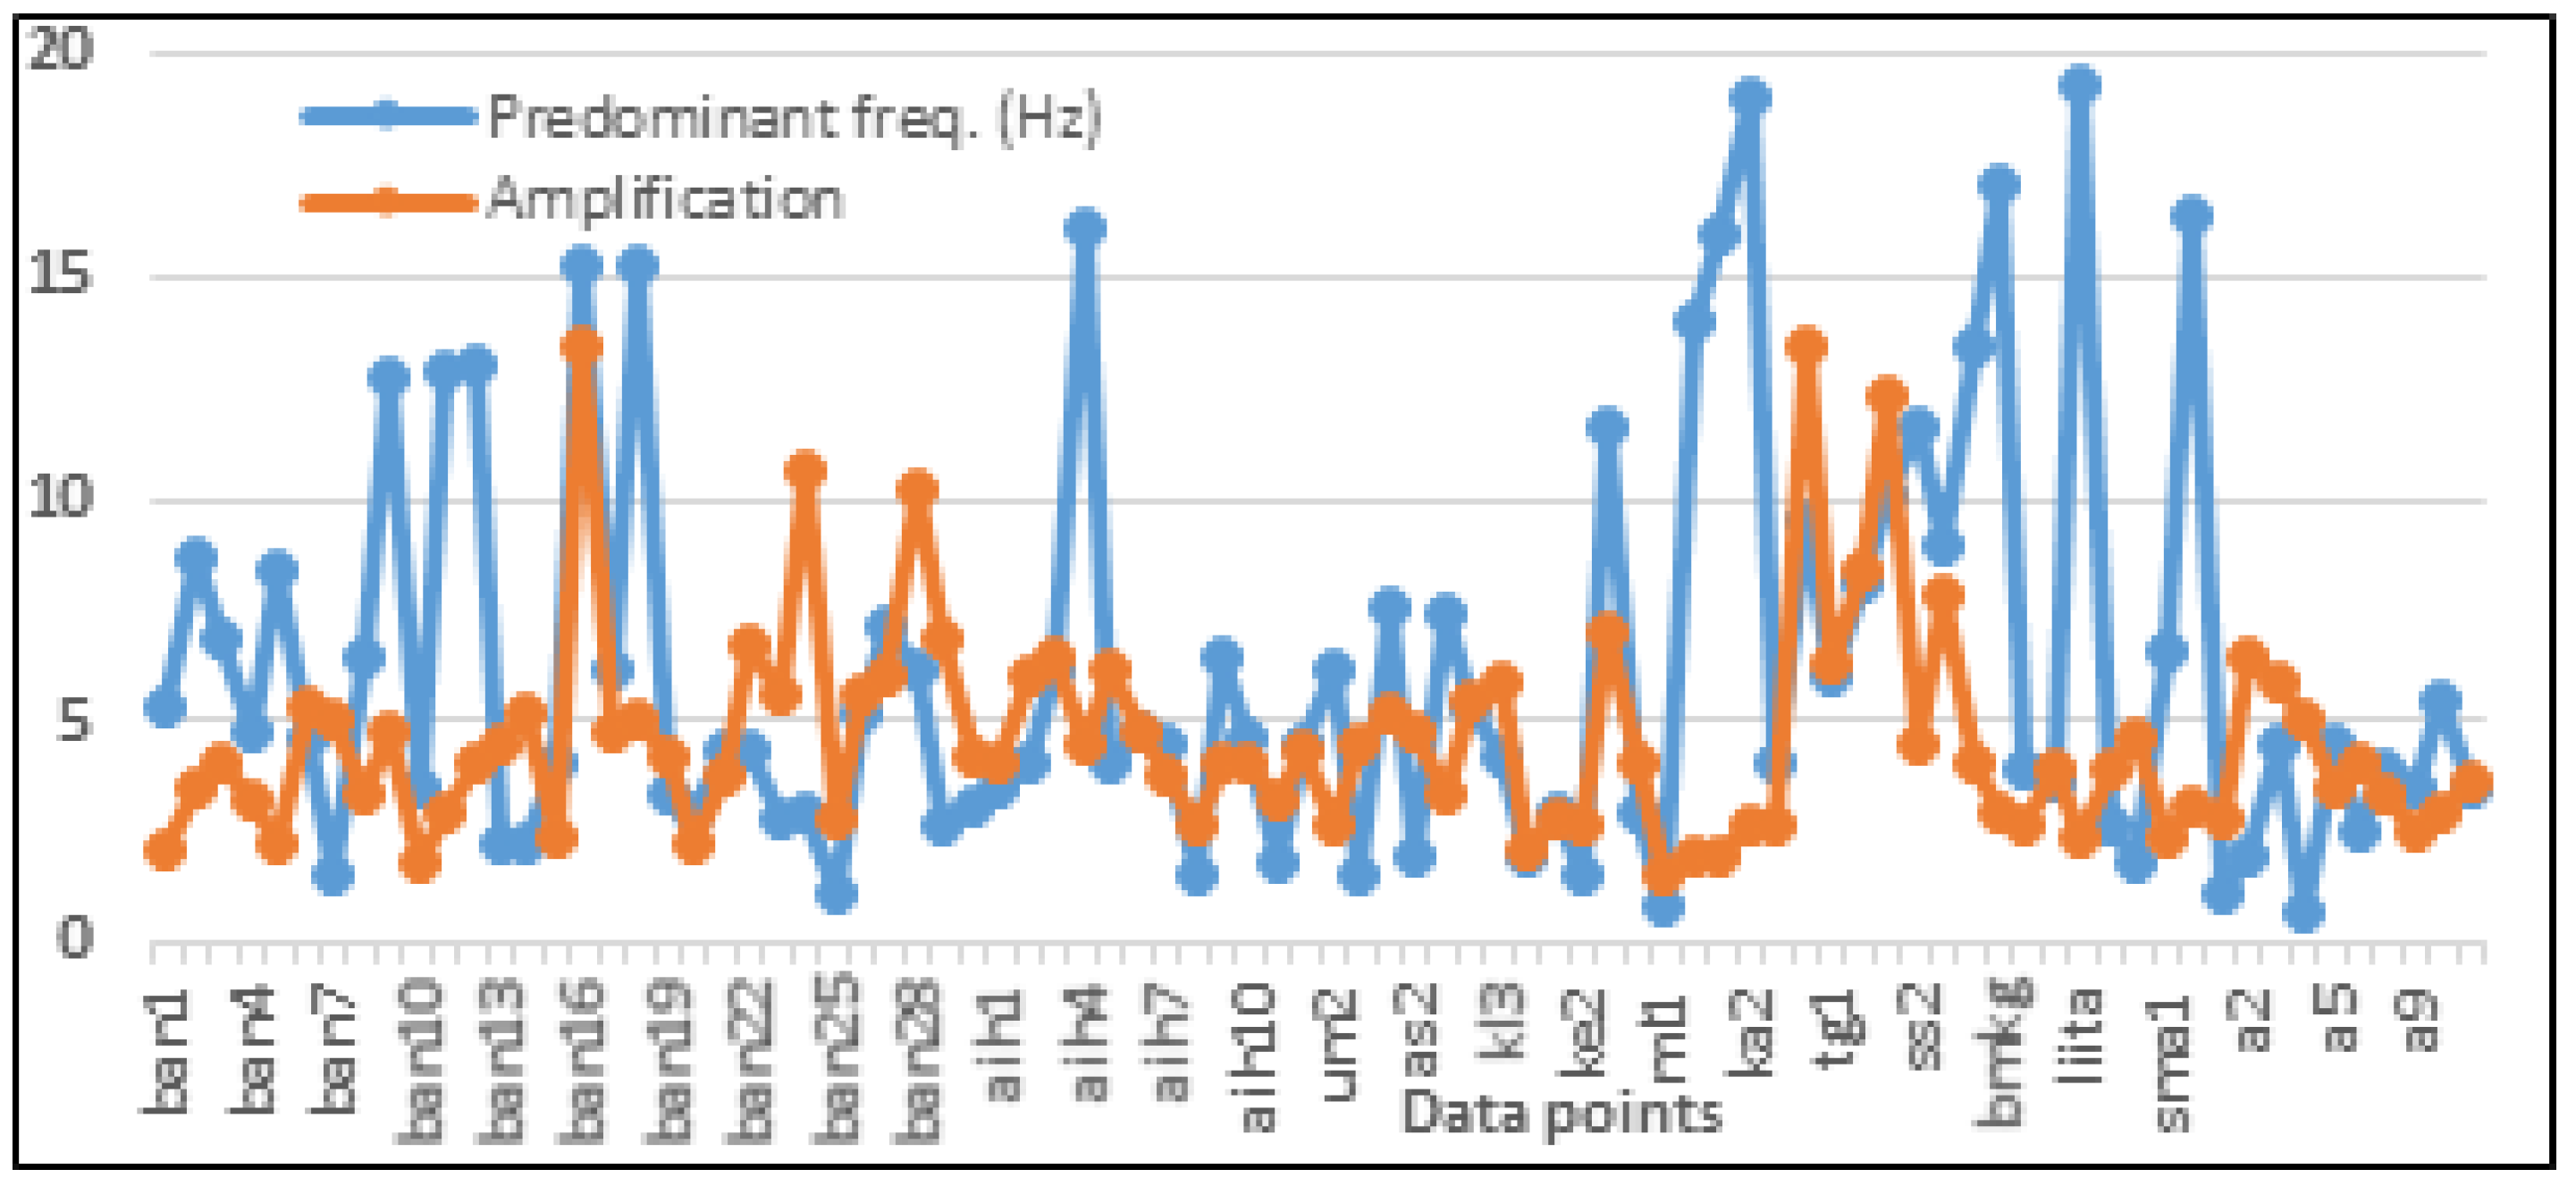
3.2. Predominant Frequency
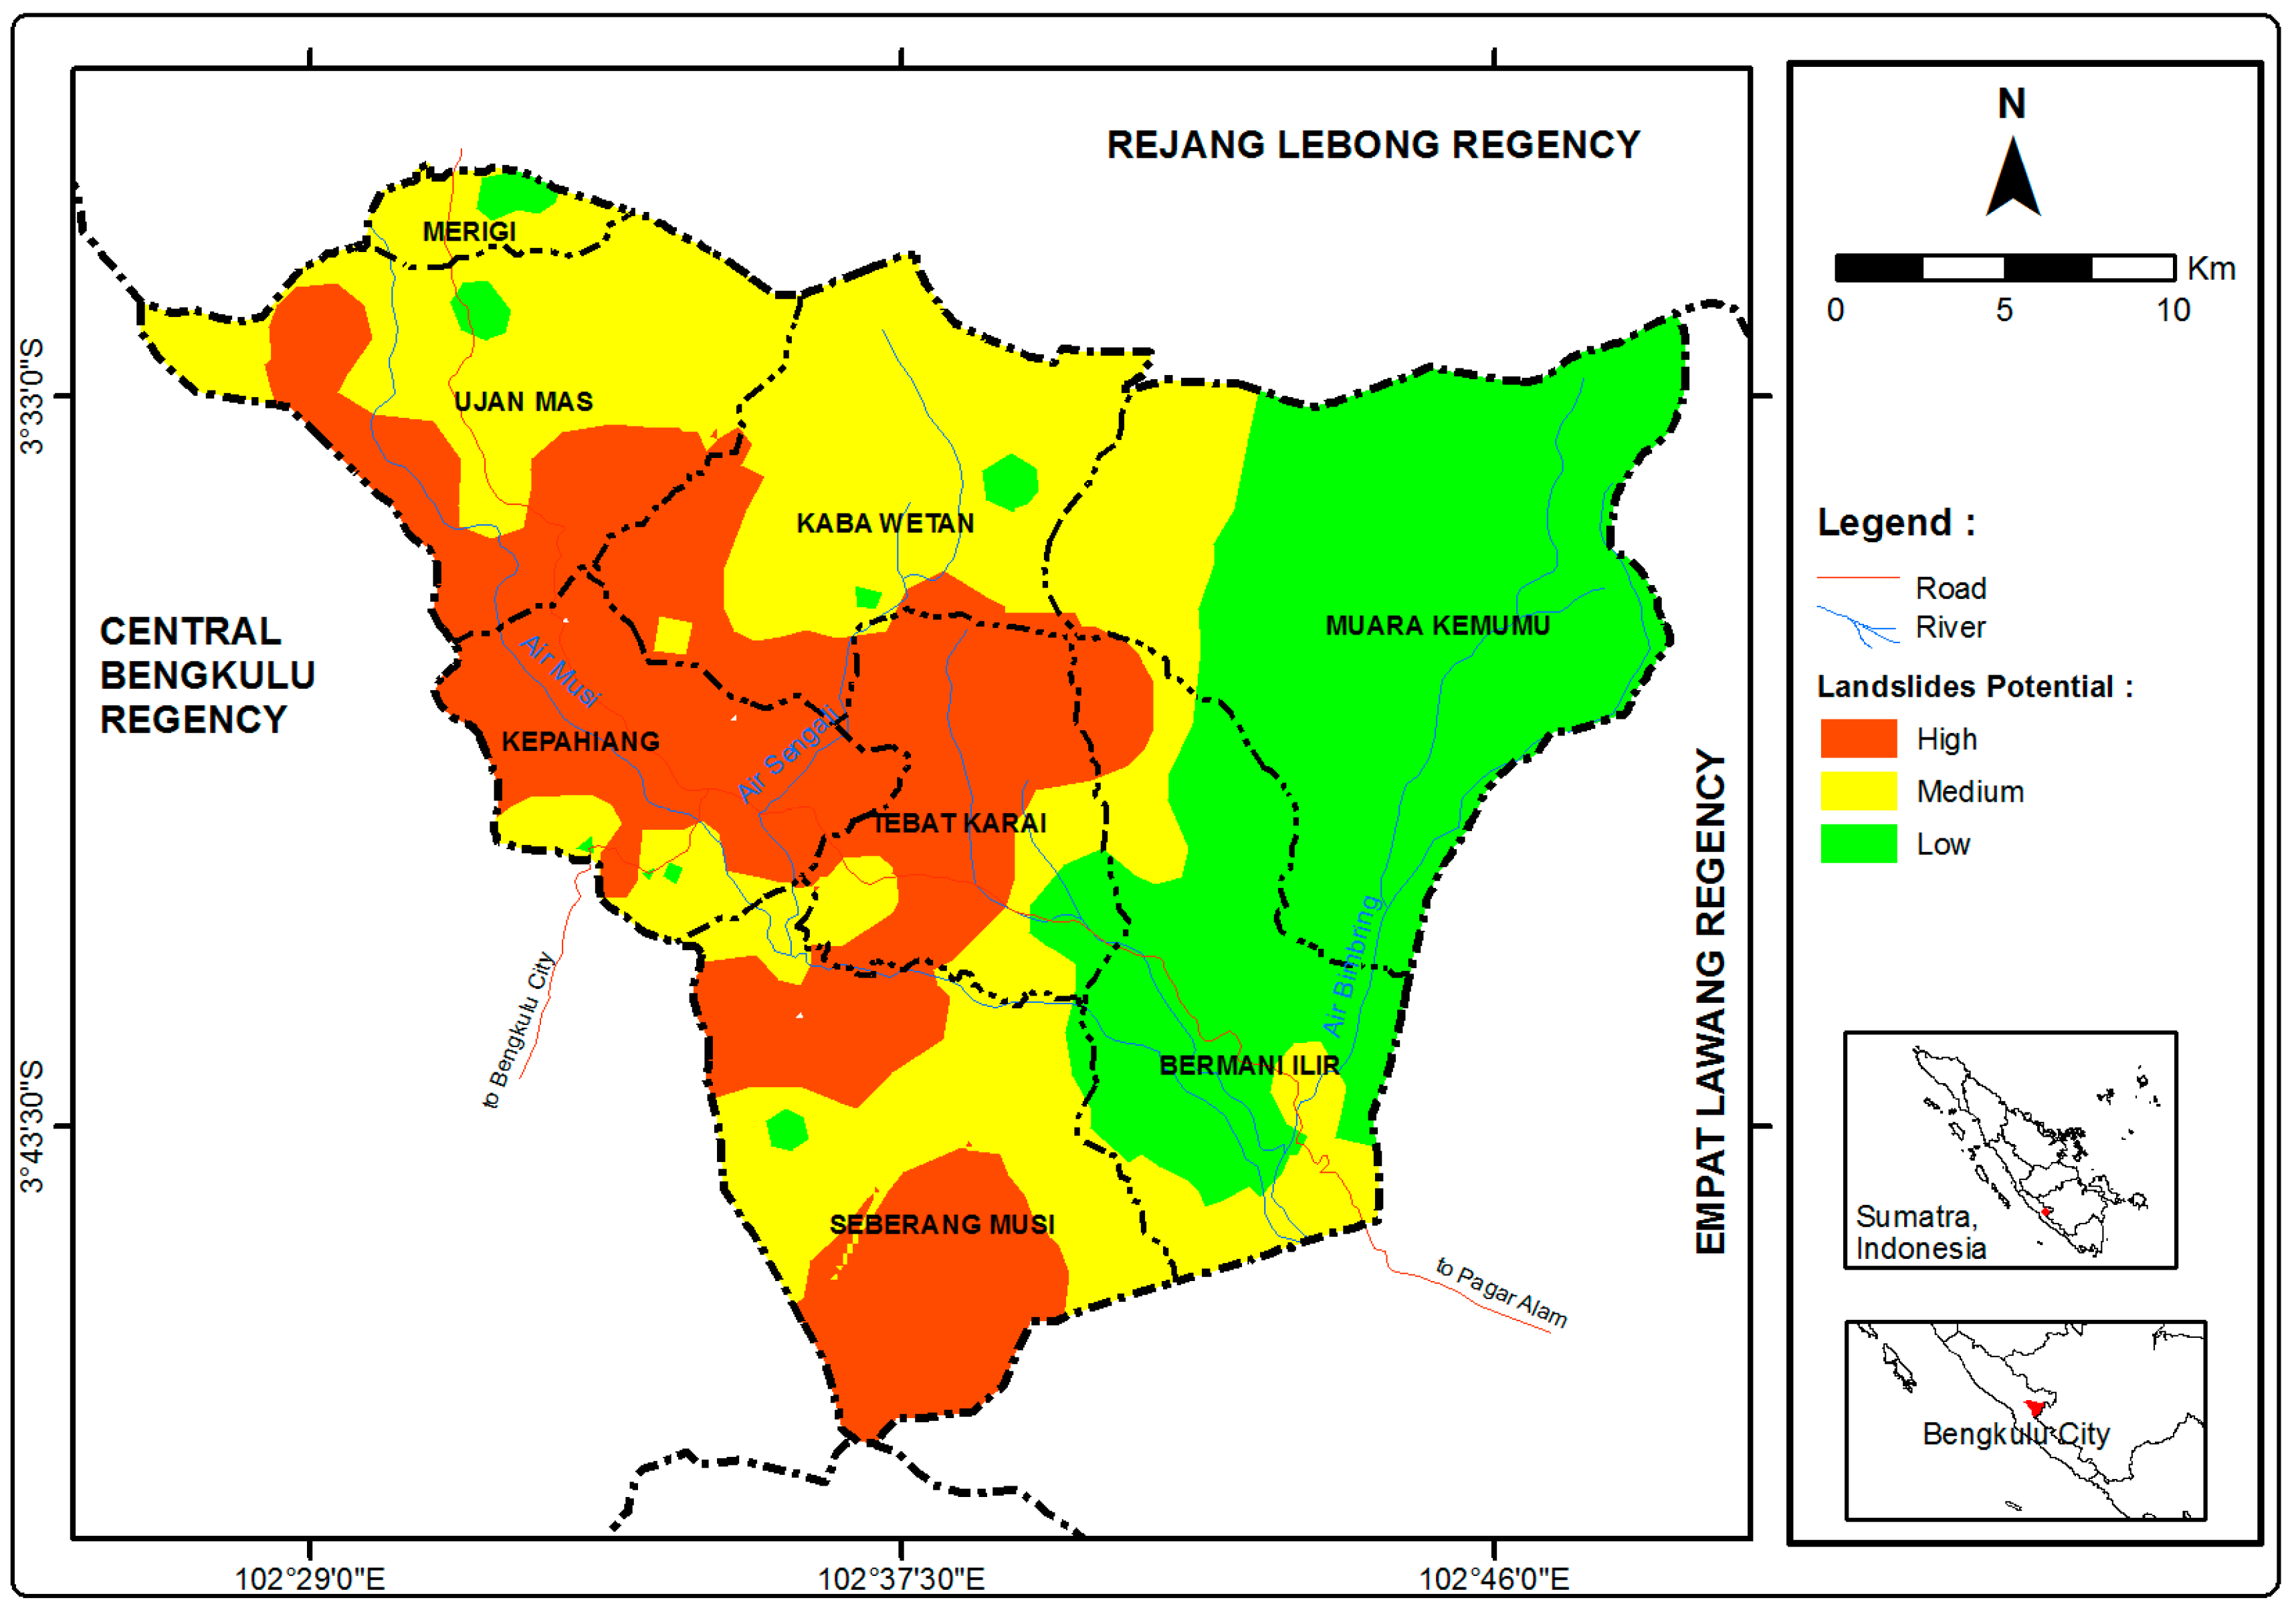
3.3. The Landslide Potential Map
4. Discussion and Conclusions
Author Contributions
Acknowledgments
Conflicts of Interest
References
- Sudrajat, A. Bengkulu as a Disaster Risk Areas; Indonesian Agency for Meteorology, Climatology and Geophysics: Jakarta, Indonesia, 2007; pp. 1–5.
- Gafoer, S.; Amin, T.C.; Pardede, R. Geology of the Bengkulu Quadrangle, Sumatra; Department of Mines and Energy, Directorate General of Geology and Mineral Resources, Geological Research and Development Centre: Bandung, Indonesia, 2012; pp. 9–35. [Google Scholar]
- Sieh, K.; Natawidjaja, D.H. Neotectonics of the Sumatran fault, Indonesia. J. Geophys. Res. 2000, 105, 28295–28326. [Google Scholar] [CrossRef] [Green Version]
- Zhang, S.; Zhang, L.M.; Glade, T. Characteristics of earthquake and rain-induced landslides near the epicenter of Wenchuan earthquake. Eng. Geol. 2014, 175, 58–73. [Google Scholar] [CrossRef]
- Karnawati, D. Mechanism of mass movement of rocks due to earthquake: Overview and analysis of technical geology. J. Dinamika Teknik Sipil 2007, 7, 179–190. [Google Scholar]
- Hasi, B.; Ishii, Y.; Maruyama, K.; Nakamura, A.; Hara, Y. Controls on Distribution and Scale of Earthquake Induced Landslides Caused by the Iwate—Miyagi Inland Earthquake in 2008, Japan; Geophysical Research Abstracts, EGU2010-3827-4; European Geosciences Union (EGU) General Assembly: Vienna, Austria, 2010; Volume 12. [Google Scholar]
- Djadja; Sutikno; Suparman, T.; Iskak, M.; Ronald, F.; Reawaru, O. Report on Mapping of Land Movement Vulnerability Zone in Kepahiang and Surrounding Area, Bengkulu; Center for Volcanology and Geological Hazard Mitigation, Geological Agency, Department of Mineral Resources: Bandung, Indonesia, 2009; pp. 1–60. [Google Scholar]
- Sukisno; Muin, S.N. Prediction of Landslide Prone Areas in Kepahiang Regency by Using Geographic Information System; Seminar Nasional Menuju Pertanian Yang Berdaulat; Faculty of Agriculture, University of Bengkulu: Bengkulu, Indonesia, 2012; pp. 621–629. [Google Scholar]
- Hadi, A.I.; Sismanto; Brotopuspito, K.S. Landslide potential analysis using microtremor and slope data on Bengkulu-Kepahiang Main Road at Km 31–60. IOSR J. Appl. Geol. Geophys. 2016, 4, 9–14. [Google Scholar] [CrossRef]
- Taufik, R.; Rahmat, B.S. Landslide analysis in deep claystone deposits and handling, Cipularang toll road, a case study at KM 92 + 650 and KM 92 + 800. J. Widyariset. 2006, 9, 79–92. [Google Scholar]
- Gafoer, S.; Amin, T.C.; Pardede. Geological Map of Bengkulu Quadrangle, Sumatra; Department of Mines and Energy, Directorate General of Geology and Mineral Resources, Geological Research and Development Centre: Bandung, Indonesia, 2007. [Google Scholar]
- Irwanto, H.; Jaya, D.; Miansyah, A.; Septiawan, A.; Girsang, R.; Margiana. Final Report of Mineral and Rock Inventory of Fiscal Year 2013; Mining Office of Energy and Mineral Resources, Kepahiang Regency: Kepahiang, Indonesia, 2013. [Google Scholar]
- SESAME. Guidelines for the Implementation of the H/V Spectral Ratio Technique on Ambient Vibrations: Measurements, Processing and Interpretation; Project No. EVG1-CT-2000-00026 SESAME; European Commission—Research General Directorate: Brussels, Belgium, 2004; pp. 8–31. [Google Scholar]
- Bullen, K.E. An Introduction to the Theory of Seismology, 3rd ed.; Cambridge University Press: Cambridge, UK, 1987; pp. 231–234. ISBN 0-521-04367-0. [Google Scholar]
- Kramer, S.L. Geotechnical Earthquake Engineering; Prentice-Hall: Upper Saddle River, NJ, USA, 1996; pp. 45–124. ISBN 0-13-374943-6. [Google Scholar]
- Nakamura, Y.; Saita, J.; Sato, T. Development of vulnerability assessment models using microtremor/strong motion. In Proceedings of the 6th EQTAP Workshop, Kashikojima, Japan, 1–2 December 2003. [Google Scholar]
- Nakamura, Y. On the H/V spectrum. In Proceedings of the 14th World Conference on Earthquake Engineering, Beijing, China, 12–17 October 2008. [Google Scholar]
- Fell, R.; Corominas, J.; Bonnard, C.; Cascini, L.; Leroi, E.; Savage, W.Z. Guidelines for landslide susceptibility, hazard and risk zoning for land-use planning on behalf of the JTC-1 Joint Technical Committee on Landslides and Engineered Slopes. Eng. Geol. 2008, 102, 99–111. [Google Scholar] [CrossRef]
- Soeters, R.; Westen, C.J.V. Slope instability recognition, analysis and zonation. In Landslides: Investigation and Mitigation; Turner, A.K., Schuster, R.L., Eds.; Transportation Research Board, National Research Council, National Academy Press: Washington, DC, USA, 1996; pp. 129–177. [Google Scholar]
- Kusumadewi, S.; Hartati, S.; Harjoko, A.; Wardoyo, R. Fuzzy Multi-Attribute Decision Making (Fuzzy MADM), 1st ed.; Graha Ilmu: Yogyakarta, Indonesia, 2006; pp. 69–81. ISBN 10-979-756-125-. [Google Scholar]
- Matheron, G. Principles of geostatistics. Econ. Geol. 1963, 58, 1246–1266. [Google Scholar] [CrossRef]
- Daryono. Seismic Vulnerability Index Based on Microtremor at Each Unit Landforms in Bantul Graben Zone, Yogyakarta Special Region. Ph.D. Thesis, Universitas Gadjah Mada, Yogyakarta, Indonesia, 2011. [Google Scholar]
- Eskisar, T.; Ozyalin, S.; Kuruoglu, M.; Yilmaz, H.R. Microtremor measurements in the northern coast of Izmir Bay, Turkey to evaluate site-specific characteristics and fundamental periods by H/V spectral ratio method. J. Earth Syst. Sci. 2013, 122, 123–136. [Google Scholar] [CrossRef]
- Warnana, D.D.; Soemitro, R.A.A.; Utama, W. Application of microtremor HVSR method for assessing site effect in residual soil slope. IJBAS IJENS 2011, 11, 100–105. [Google Scholar]
- Ishihara, K. Soil Behaviour in Earthquake Geotechnics; Oxford University Press Inc.: New York, NY, USA, 1996. [Google Scholar]
- Oliveira, C.S.; Roca, A.; Goula, X. Assessing and Managing Earthquake Risk; Geo-Scientific and Engineering Knowledge for Earthquake Risk Mitigation: Developments, Tools, Techniques; Springer: Dordrecht, The Netherlands, 2008; pp. 67–78. ISBN 13-978-1-4020-3608-8. [Google Scholar]
- BMKG. Annual Report on Rainfall in Bengkulu Province; Indonesian Agency for Meteorology, Climatology and Geophysics: Bengkulu, Indonesia, 2016.
- Hadi, A.I.; Brotopuspito, K.S. Mapping of peak ground acceleration using probabilistic seismic hazard analysis (PSHA) approach in Kepahiang regency of Bengkulu province. J. Berkala Fisika 2015, 18, 101–112. [Google Scholar]
- Allen, T.I.; Wald, D.J. Topographic Slope as a Proxy for Global Seismic Site Conditions (Vs30) and Amplification around the Globe; Open-File Report 2007–1357; U.S. Geological Survey: Reston, GA, USA, 2007; 69p.
- Kirmanto, D. Guidelines for Space Planning in Vulnerable Area to Landslides Disaster; Directorate General of Space Planning, Department of Public Works: Jakarta, Indonesia, 2007.
- Keefer, D.K. Landslides caused by earthquakes. Bull. Geol. Soc. Am. 1984, 95, 406–421. [Google Scholar] [CrossRef]
- Nepop, R.K.; Agatova, A.R. Estimating magnitudes of prehistoric earthquakes from landslide data: First experience in southern Altai. Russ. Geol. Geophys. 2008, 49, 144–151. [Google Scholar] [CrossRef]
- Karnawati, D. Natural Disasters, Land Mass Movement in Indonesia and Handling It; Jurusan Teknik Geologi, Fakultas Teknik, Universitas Gadjah Mada: Yogyakarta, Indonesia, 2005; pp. 16–23. ISBN 979-95811-3-3. [Google Scholar]
- Brotopuspito, K.S.; Prasetya, T.; Widigdo, F.M. Peak ground acceleration of Yogyakarta special region 1945–2006. J. Geofisika 2006, 1, 19–22. [Google Scholar]
- Indonesian National Board for Disaster Management (BNPB). Regulation of the Head of National Agency for Disaster Management Number 02 Year 2012 on General Guidelines for Disaster Risk Assessment; BNPB: Jakarta, Indonesia, 2007.
- Wald, D.J.; Quitoriano, V.; Heaton, T.H.; Kanamori, H. Relationships between peak ground acceleration, peak ground velocity, and modified Mercalli intensity in California. J. Earthq. Spectra 1999, 15, 557–564. [Google Scholar] [CrossRef]
- Wood, N.; Ratliff, J. Population and Business Exposure to Twenty Scenario Earthquakes in the State of Washington; Open-File Report 2011–1016; U.S. Geological Survey: Reston, GA, USA, 2011; 13p.
- Wangsadinata, W. Earthquake Resistant Building Planning Based on SNI 1726–2002, Shortcourse HAKI 2006; Wiratman & Associates Chairman SNI-1726-2002 Committee: Jakarta, Indonesia, 2006.
- Hartantyo, E. The Mapping of Shear Wave Velocity Profiles and Their Implications to Liquefaction in the Volcaniclastic Sediments, South Flank of Merapi Volcano, Yogyakarta. Ph.D. Thesis, Universitas Gadjah Mada, Yogyakarta, Indonesia, 2015. [Google Scholar]
- SNI 1726-2012. Earthquake Resistance Planning Procedure for Building Structure and Non Building; National Standardization Agency of Indonesia: Jakarta, Indonesia, 2012. [Google Scholar]
- Zuidam, R.A.V. Guide to Geomorphological Aerial Photographic Interpretation and Mapping; ITC Eschede: Eschede, The Netherlands, 1983; pp. 38–45. [Google Scholar]
- Sukmono, S. Fractal Analysis of Seismicity Mechanics for Sumatran Fault System. Ph.D. Thesis, Institut Teknologi Bandung, Bandung, Indonesia, 1997. [Google Scholar]
- Arsadipura, S.; Kholid, M.; Djuhardi, D. Integrated Geophysical Investigation on Gravity, Geomagnet and Geo-Electrical at Kepahiang Geothermal Area of Kabawetan Sub-District, Kepahiang Regency, Bengkulu Province; Geological Resource Center Activities Results: Jakarta, Indonesia, 2010; pp. 653–664. [Google Scholar]
- Khanh, N.Q. Landslide Hazard Assessment in Muonglay, Vietnam Applying GIS and Remote Sensing. Ph.D. Thesis, Faculty of Mathematics and Natural Sciences, Ernst-Moritz-Arndt-University Greifswald, Greifswald, Germany, 2009. [Google Scholar]
- USGS. Search Earthquake Archives. Available online: http://earthquake.usgs.gov/earthquakes/search/ (accessed on 9 July 2015).


| Indicator | Criterion Weight | Level of Susceptibility | Index Class | Performance Rating |
|---|---|---|---|---|
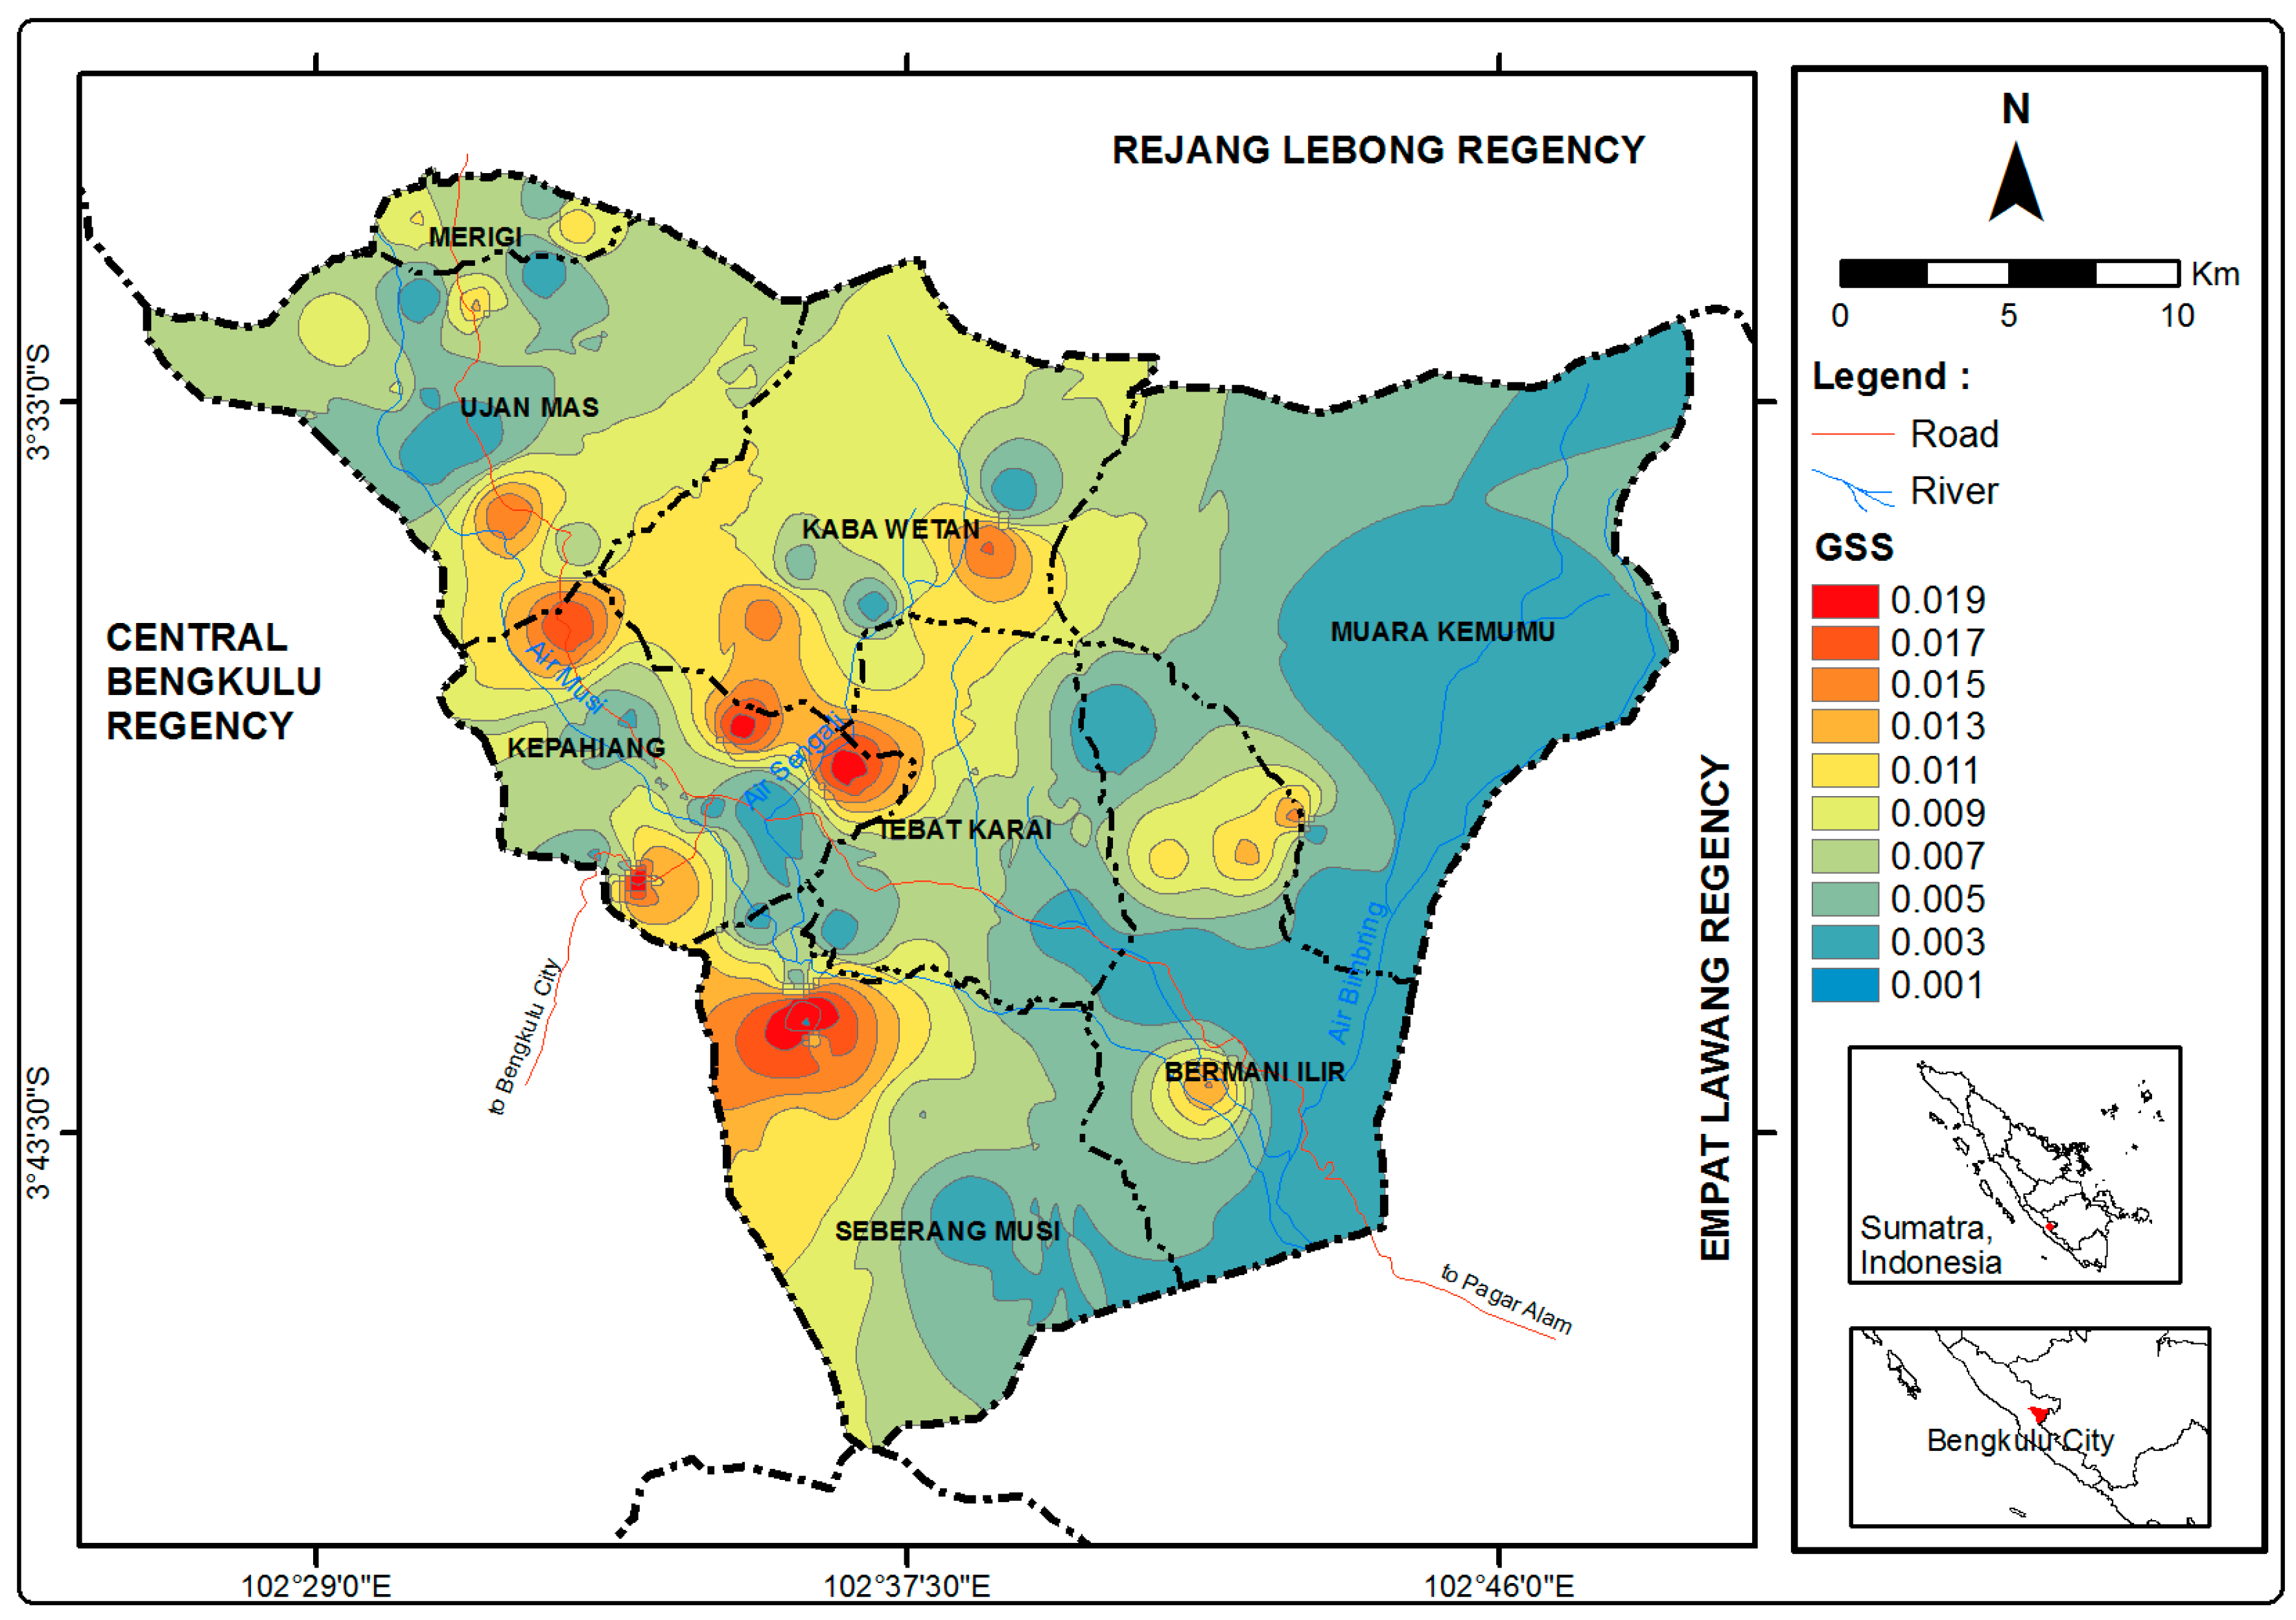
| Ground shear strain (GSS) | 5 | High | GSS ≥ 0.01 | 3 |
| Medium | 0.0001 ≤ GSS ≤ 0.01 | 2 | ||
| Low | GSS ≤ 0.0001 | 1 | ||
| Rainfall (mm/year) | 3 | High | Rainfall ≥ 2500 mm/year | 3 |
| Medium | 1000 mm/year ≤ rainfall ≤ 2500 mm/year | 2 | ||
| Low | Rainfall ≤ 1000 mm/year | 1 | ||
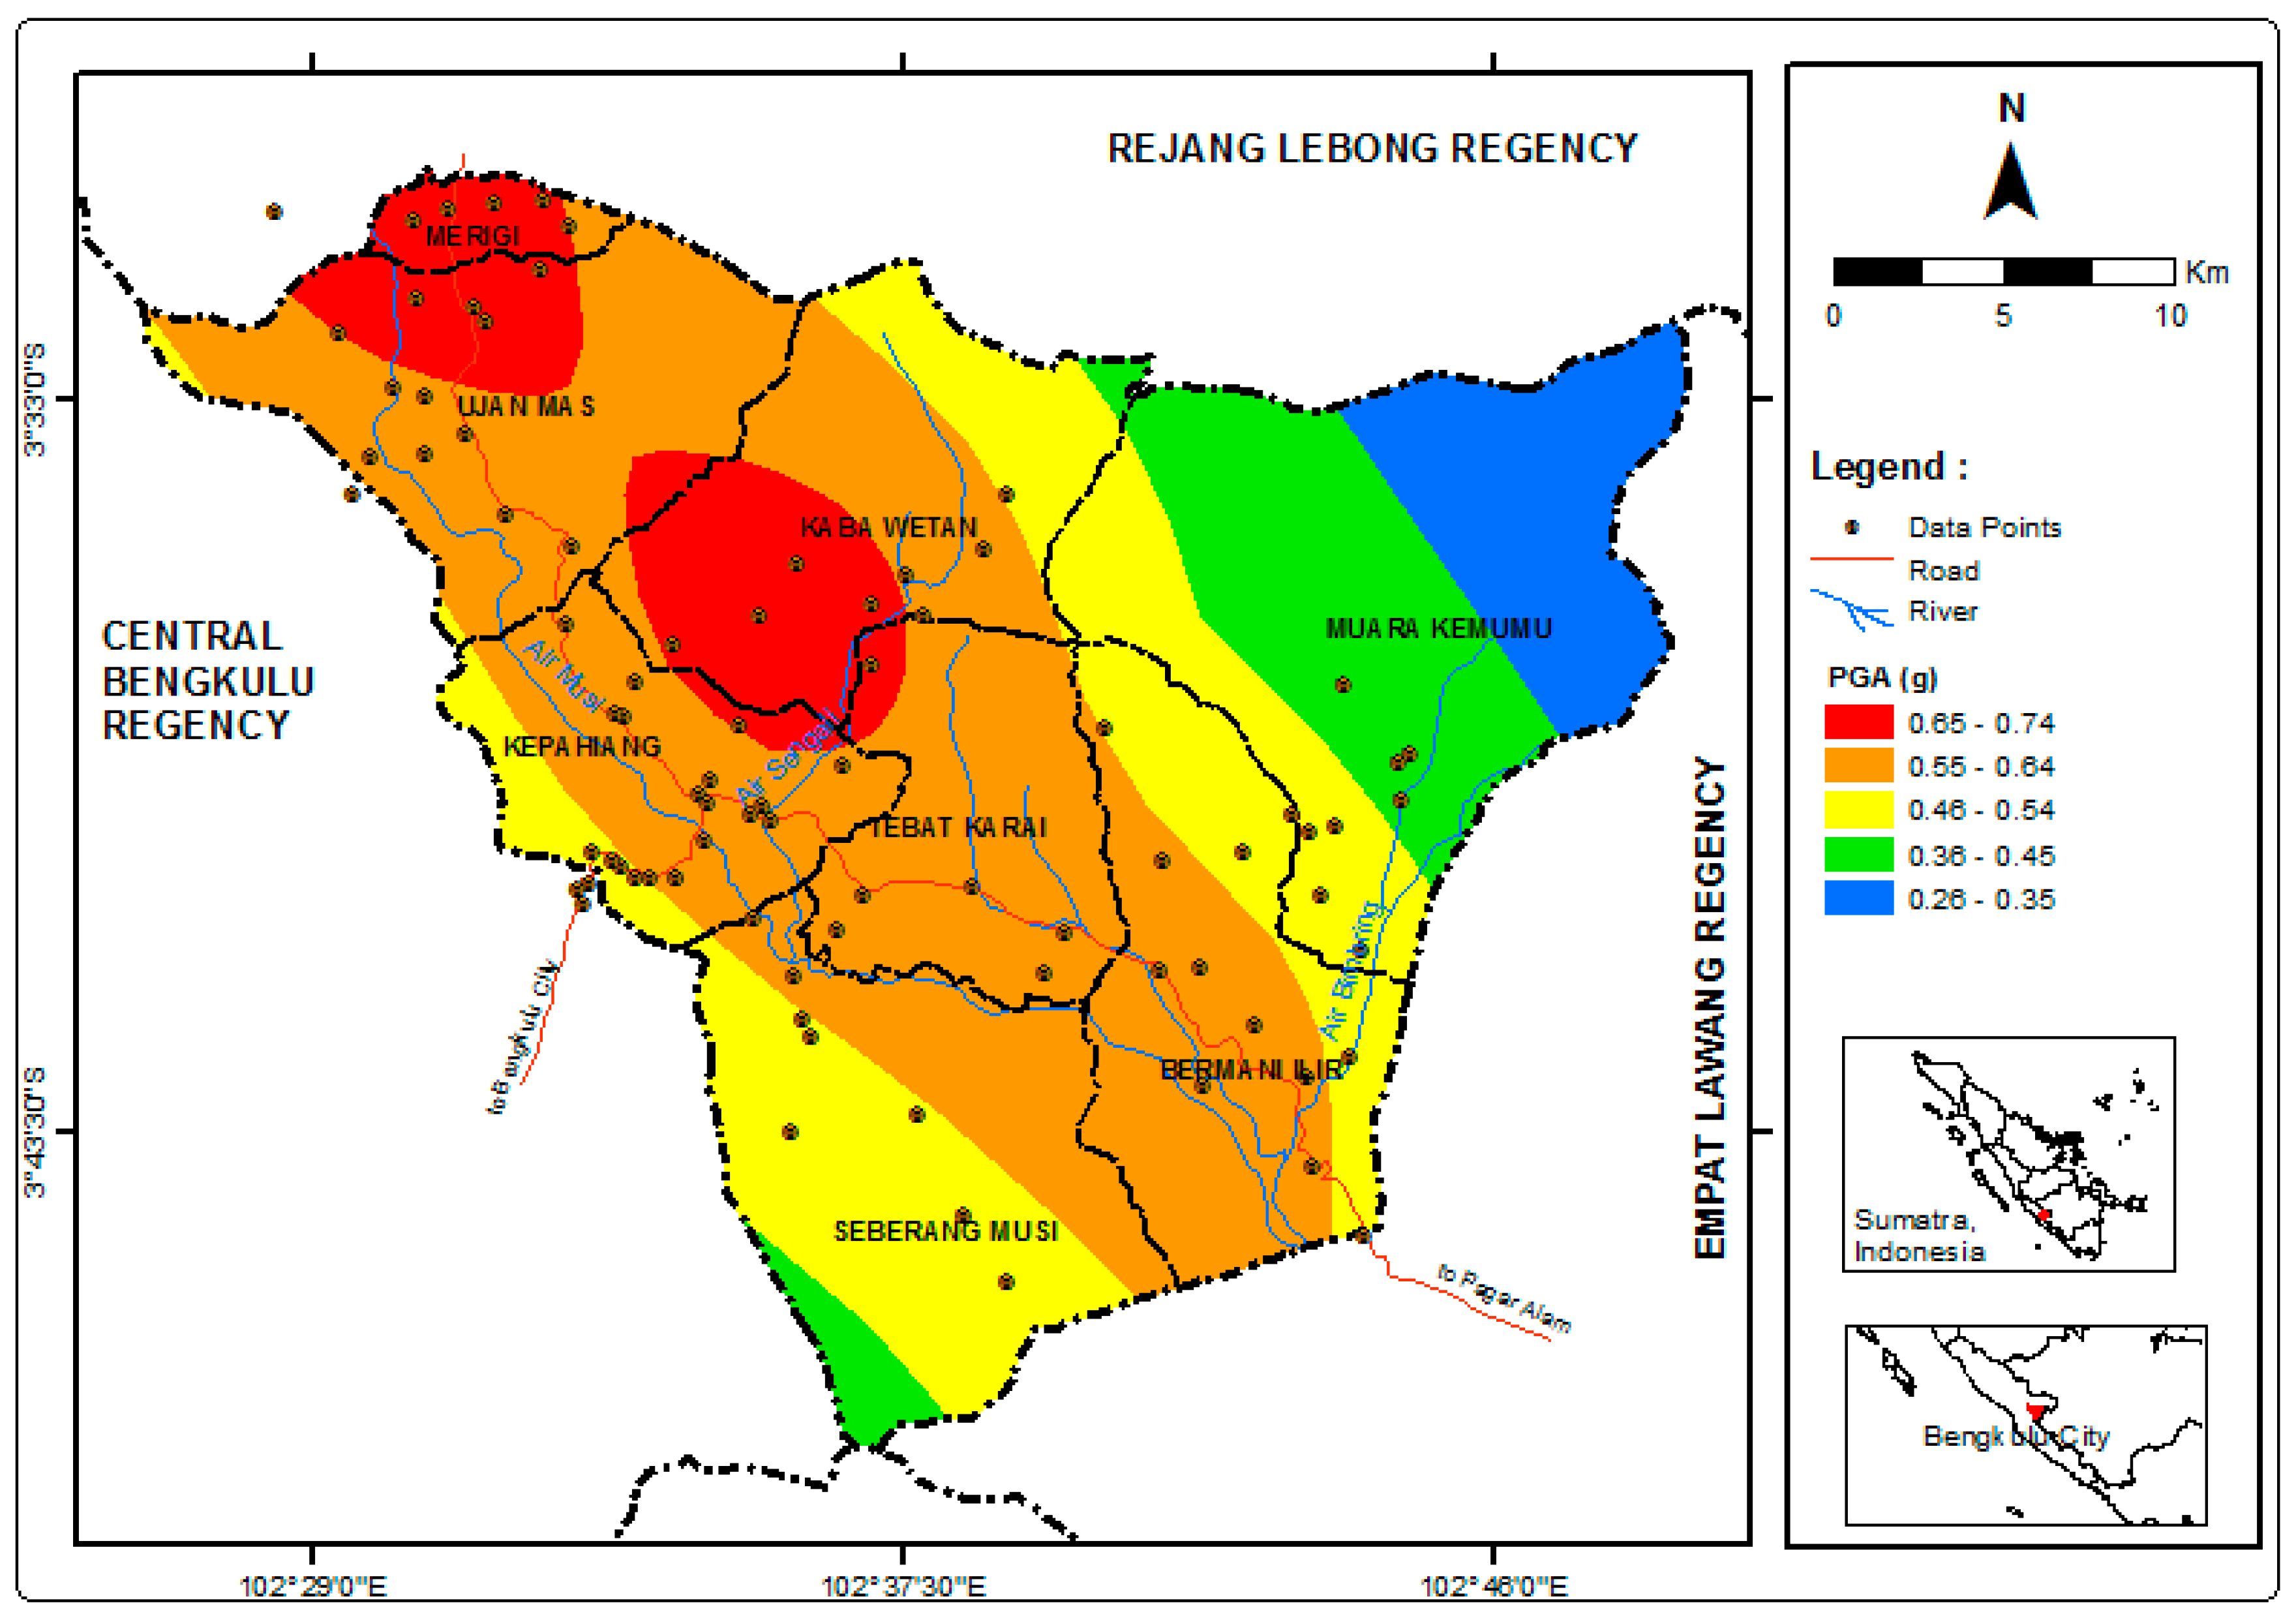
| PGA (g) | 2 | High | PGA > 0.7 g | 3 |
| Medium | 0.26 g < PGA < 0.7 g | 2 | ||
| Low | PGA < 0.26 g | 1 | ||
| Vs30 (m/s) | 4 | High | Vs30 ≤ 350 m/s | 3 |
| Medium | 350 m/s ≤ Vs30 ≤ 750 m/s | 2 | ||
| Low | Vs30 ≥ 750 m/s | 1 | ||
| Slope (°) | 3 | High | Slope > 40° | 3 |
| Medium | 25° < Slope < 40° | 2 | ||
| Low | Slope < 25° | 1 | ||
| Distance from the fault (km) | 3 | High | Distance from the fault ≤ 1 km | 3 |
| Medium | 1 km ≤ distance from the fault ≤ 5 km | 2 | ||
| Low | Distance from the fault ≥ 5 km | 1 |
© 2018 by the authors. Licensee MDPI, Basel, Switzerland. This article is an open access article distributed under the terms and conditions of the Creative Commons Attribution (CC BY) license (http://creativecommons.org/licenses/by/4.0/).
Share and Cite
Hadi, A.I.; Brotopuspito, K.S.; Pramumijoyo, S.; Hardiyatmo, H.C. Regional Landslide Potential Mapping in Earthquake-Prone Areas of Kepahiang Regency, Bengkulu Province, Indonesia. Geosciences 2018, 8, 219. https://doi.org/10.3390/geosciences8060219
Hadi AI, Brotopuspito KS, Pramumijoyo S, Hardiyatmo HC. Regional Landslide Potential Mapping in Earthquake-Prone Areas of Kepahiang Regency, Bengkulu Province, Indonesia. Geosciences. 2018; 8(6):219. https://doi.org/10.3390/geosciences8060219
Chicago/Turabian StyleHadi, Arif Ismul, Kirbani Sri Brotopuspito, Subagyo Pramumijoyo, and Hary Christady Hardiyatmo. 2018. "Regional Landslide Potential Mapping in Earthquake-Prone Areas of Kepahiang Regency, Bengkulu Province, Indonesia" Geosciences 8, no. 6: 219. https://doi.org/10.3390/geosciences8060219