Article

A Physical Study of the Effect of Groundwater Salinity on the Compressibility of the Semarang-DemakAquitard, Java Island

1
Applied Geology Research Group, Faculty of Earth Science and Technology, Institut Teknologi Bandung, Bandung 40132, Indonesia
2
Research Center for Geotechnology, Indonesian Institute of Sciences (LIPI), Bandung 40135, Indonesia
3
Center for Groundwater Resource and Environmental Geology, Indonesian Geological Agency, 40122 Bandung, Indonesia
*
Author to whom correspondence should be addressed.
Geosciences 2018, 8(4), 130; https://doi.org/10.3390/geosciences8040130
Submission received: 26 January 2018 / Revised: 25 March 2018 / Accepted: 4 April 2018 / Published: 8 April 2018

Abstract

:
Semarang-Demak and other cities along the coast of North Java are vulnerable to land subsidence. The presence of saline groundwater in the coastal region is thought to affect the high subsidence rate, in this case the compressibility of the aquitard layer. We aimed to analyze the effects of groundwater salinity on the compression characteristics of the Semarang-Demak clay using physical analysis. Methods included the determination of groundwater salinity, clay mineralogy and fabrics, and consolidation tests under various salinity conditions. The Semarang-Demak clay is dominated by smectite of high activity, and saline clay exists at the depth of 10 to 35 m. Consolidation tests revealed that the increase insalinity increases the average consolidation rate and hydraulic conductivity up to 42% and 37.5%, respectively. Clay fabric analysis showed that the groundwater salinity modified the interconnectivity of pores by changing the fabric into parallel alignments, facilitating faster porewater dissipation, hence the clay is more readily compressed. These findings are useful for explaining the mechanism of the fast-subsiding coastal plains of North Java.

1. Introduction

The sinking of land surfaces is threatening coastal areas all over the world and affects almost half a billion people living on or near the coast [1]. Land subsidence is defined as the gradual settling of the earth’s surface by subsurface movement of earth materials [2]. More than 150 areas across the world are affected by contemporary land subsidence; most of these areas are located in coastal regions [3], such as Shanghai [4], Hanoi [5], Bangkok [6], and Mekong delta, Vietnam [7]. The coastal areas of Indonesia arealso susceptible to land subsidence, particularly in the most densely populated island of Java. Large cities on the northern coast of Java are experiencing land subsidence at different rates: Jakarta and Semarang-Demak (1.0 to >10.0 cm/year) [8,9,10], Pekalongan (4.8 cm/year) [10], and Surabaya (2.0 cm/year) [11]. The high rate of land subsidence in the coastal area is primarily related to the aquifer-aquitard system compaction due to the abstraction of groundwater [2,12,13,14], although other factors such as natural compaction could coexist [15,16]. Exploitation of the confined groundwater reduces the piezometric pressure of the aquifer.As the piezometric pressure drops, the total stress of the aquifer-aquitard system remains constant; hence, the effective stress increases. The increase in the effective stress causes the compaction of the aquifer-aquitard system, leading to land subsidence. Aquitards are particularly prone to large compaction because of their high compressibility. The compressibility of an aquitard is several orders of magnitude higher than that of an aquifer. Accordingly, aquitard compressibility controls the compaction of the aquifer-aquitard system and accounts for most of the subsidence [13,17]. Therefore, it is important to understand the compressibility behavior of aquitards to understand the land subsidence process.
The clay-rich soil in aquitards has notable characteristics of low hydraulic conductivity, high compressibility, relatively soft consistency and a high affinity for water. The engineering behavior of clay is controlled by the water adsorbed on the clay surface (diffuse double-layer). Diffuse double-layer water is the water adsorbed as a result of the induced electrical force of the negatively charged clay particles and the concentration of exchangeable cations near the particle surface [18]. During the land subsidence process, the compaction of the aquifer-aquitard system is largely derived from the clay consolidation. The effective stress increase of the aquifer due to the piezometric head lowering induces the slow drainage of clay porewater, causing consolidation settlement of the clay. Literature reveals that, apart from the mechanical factor, the clay consolidation process is also influenced by the clay mineralogy and porewater chemistry [18,19]. Previous studies have shown that an inorganic salt solution has a strong impact on the compressibility of clay [20,21,22,23,24,25], which is mainly due to the change of the diffuse double layer thickness at different electrolyte concentrations. The rate of change of the double layer water thickness varies with the type of clay mineral, with smectite being the most reactive. Most of the previous studies used a single type of clay mineral or artificial soils, except [21,24], who used natural marine clay. The introduction of saline pore fluid to clay affects the hydro-mechanical properties of single type smectite soils [20,22,23]. However, the effect of salinity on the compressibility of natural clays showed different reactions. The increase insalinity in Boom clay [21] had an almost negligible effect on compressibility indices, while for Lianyungang clay [24], the opposite effect occurred.
The coastal aquifer-aquitard system has variable groundwater quality from fresh to saline, depending on its former environmental conditions [26]. Some marine clays with saline porewaterare known to be soft and vulnerable to excessive settlements, posing threats to construction and the maintance of infrastructure, for example, the marine clays fromBangkok [27,28], Shanghai [29,30], Pusan [31], and Kansai [32]. Land subsidence of marine clays has been widely analyzed in the light of one-dimensional consolidation theory [5,14,33,34]; however, the effect of groundwater salinity on the subsidence process (e.g., consolidation parameters) tends to be overlooked. To address this knowledge gap, it is important to understand the effect of groundwater salinity on the compressive characteristics of marine clay. The marine clay of the North Java coastal plain is generally soft and highly compressible [35,36,37] and hence prone to subside. The high rate of land subsidence in the coastal cities of North Java raises the question of whether the groundwater quality affects the compressibility characteristics of the aquitard. This study aims to analyze the effects of groundwater salinity on the compressive characteristics of saline clay using physical analysis. Clay samples from the subsiding Semarang-Demak plain were analyzed to understand the consolidation properties when exposed to different salinity conditions. We examine the correlation between groundwater salinity and clay consolidation indices (compression and swelling indexes, oedometer modulus, consolidation rate, hydraulic conductivity) and validate the experimental results with a clay fabric analysis, thus emphasizing the importance of the groundwater salinity effect to the land subsidence mechanisms in the study area and in other North Java cities.

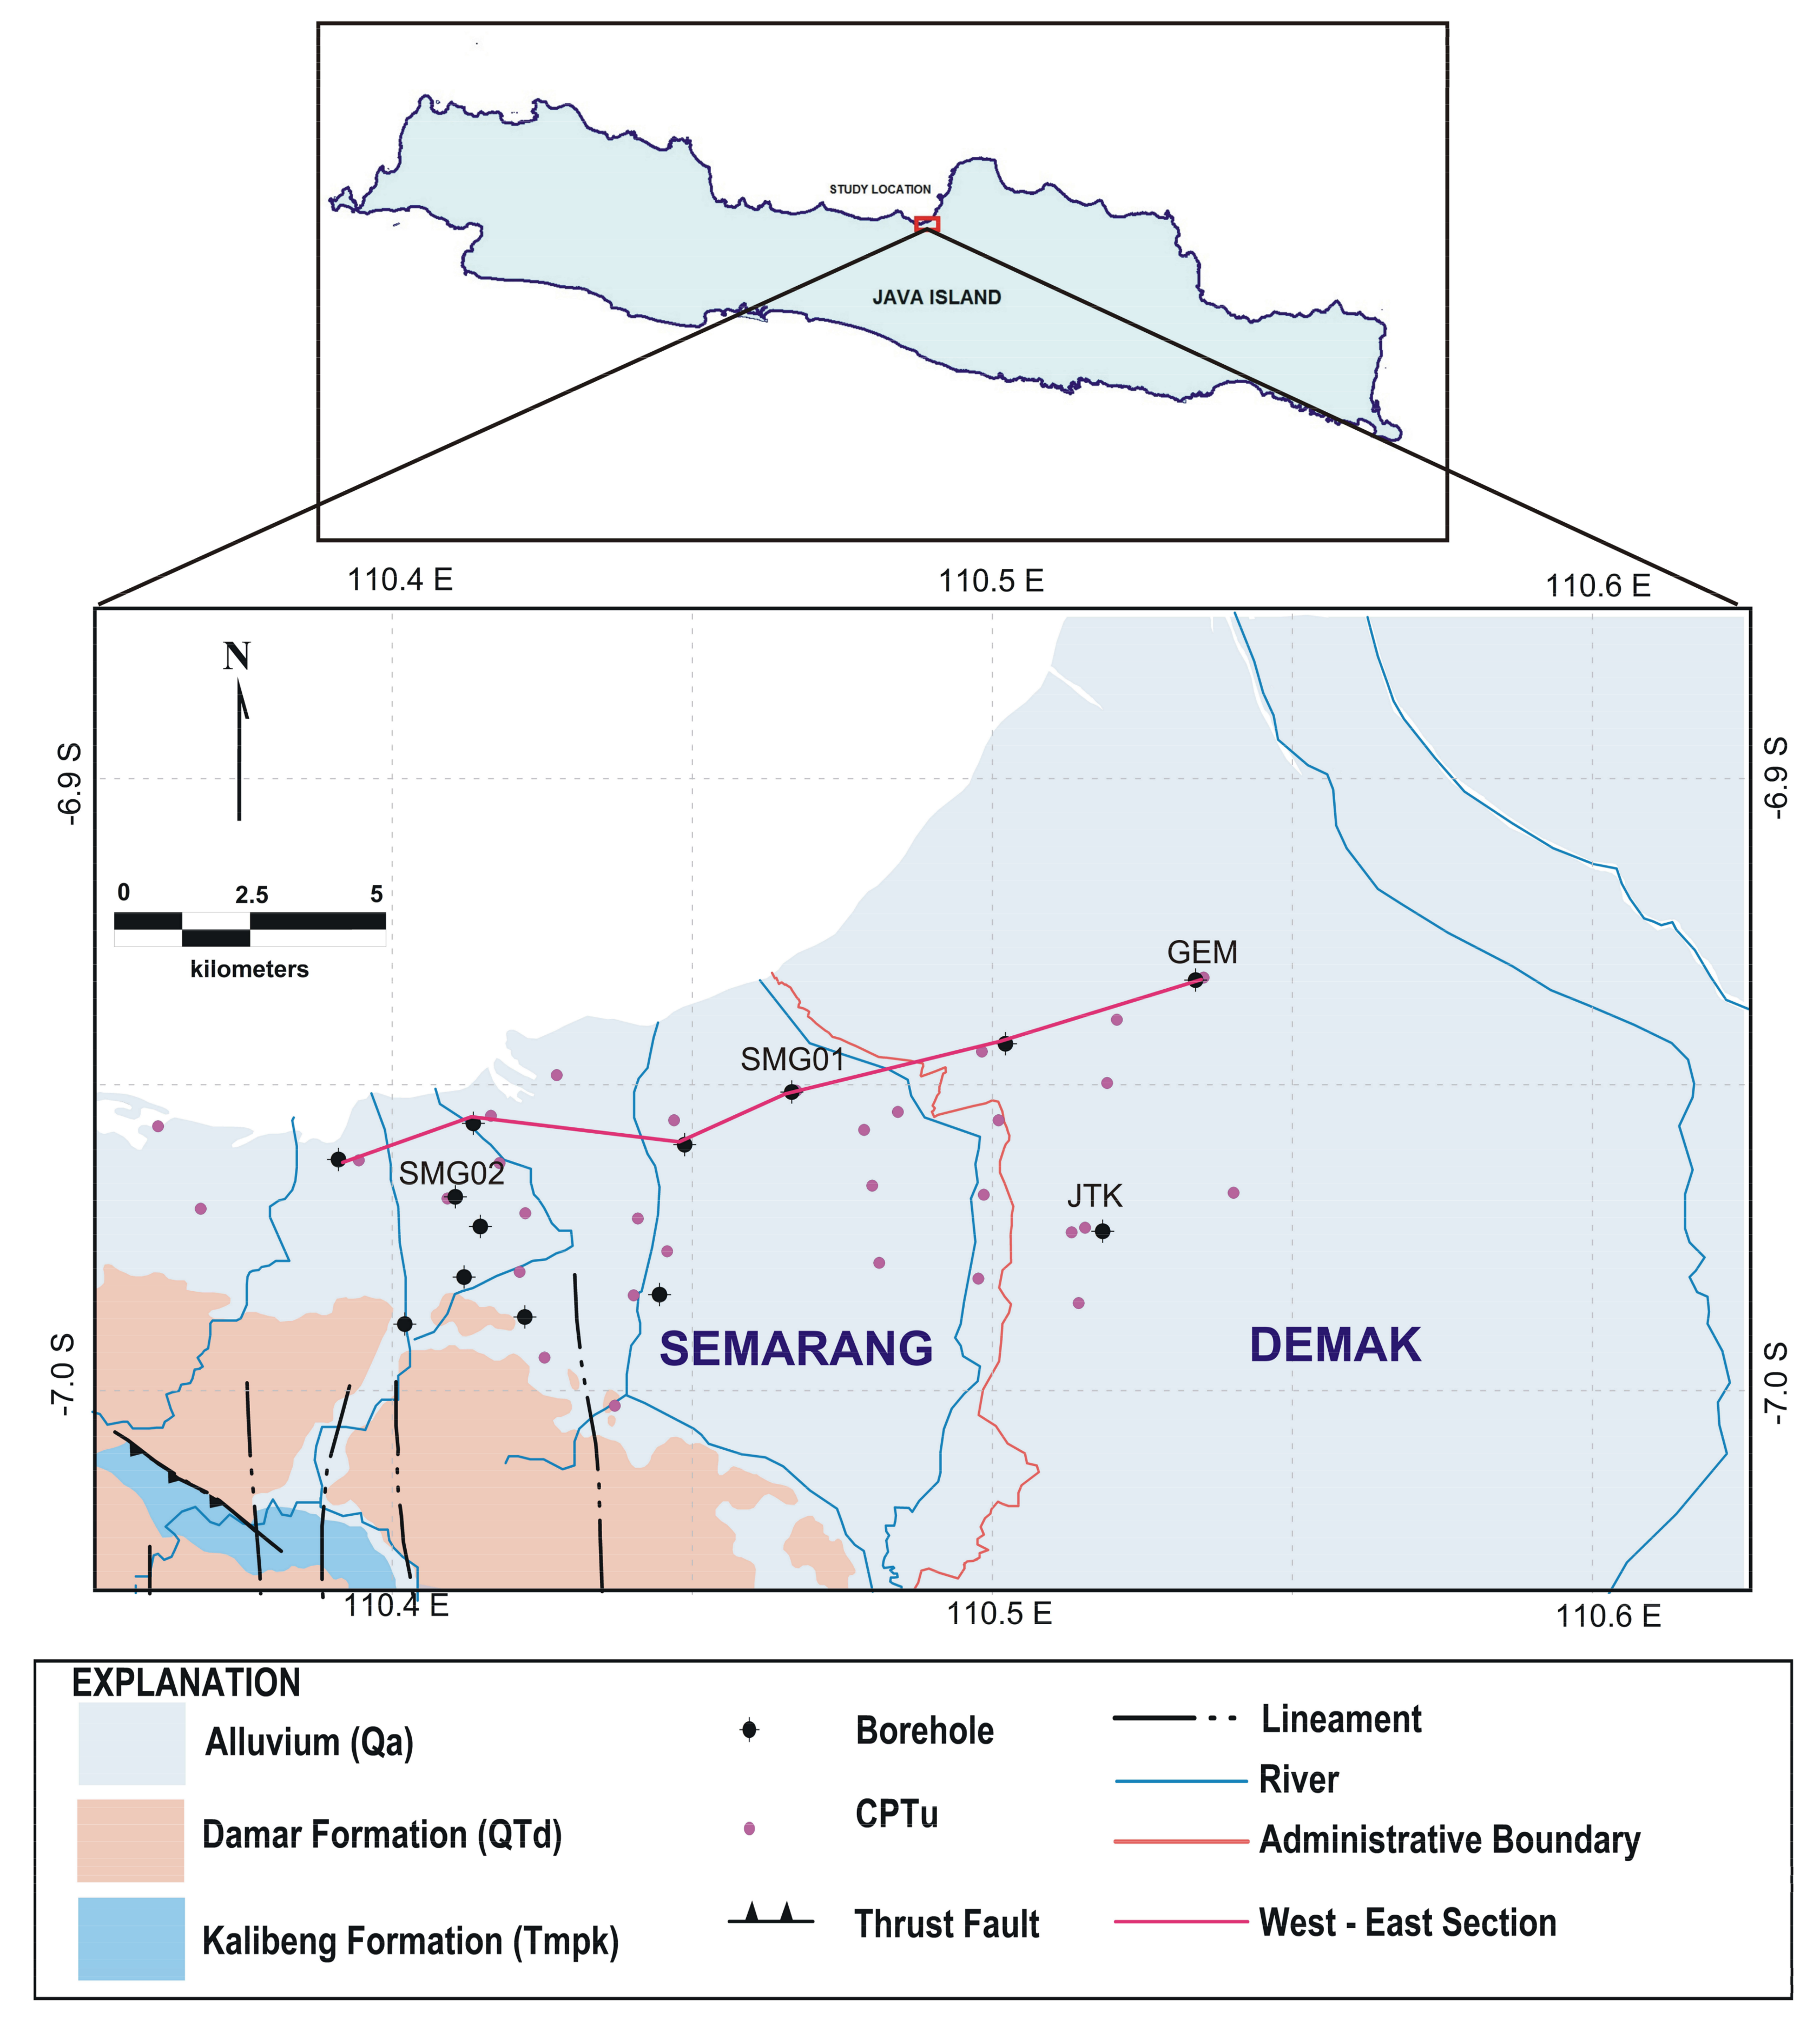
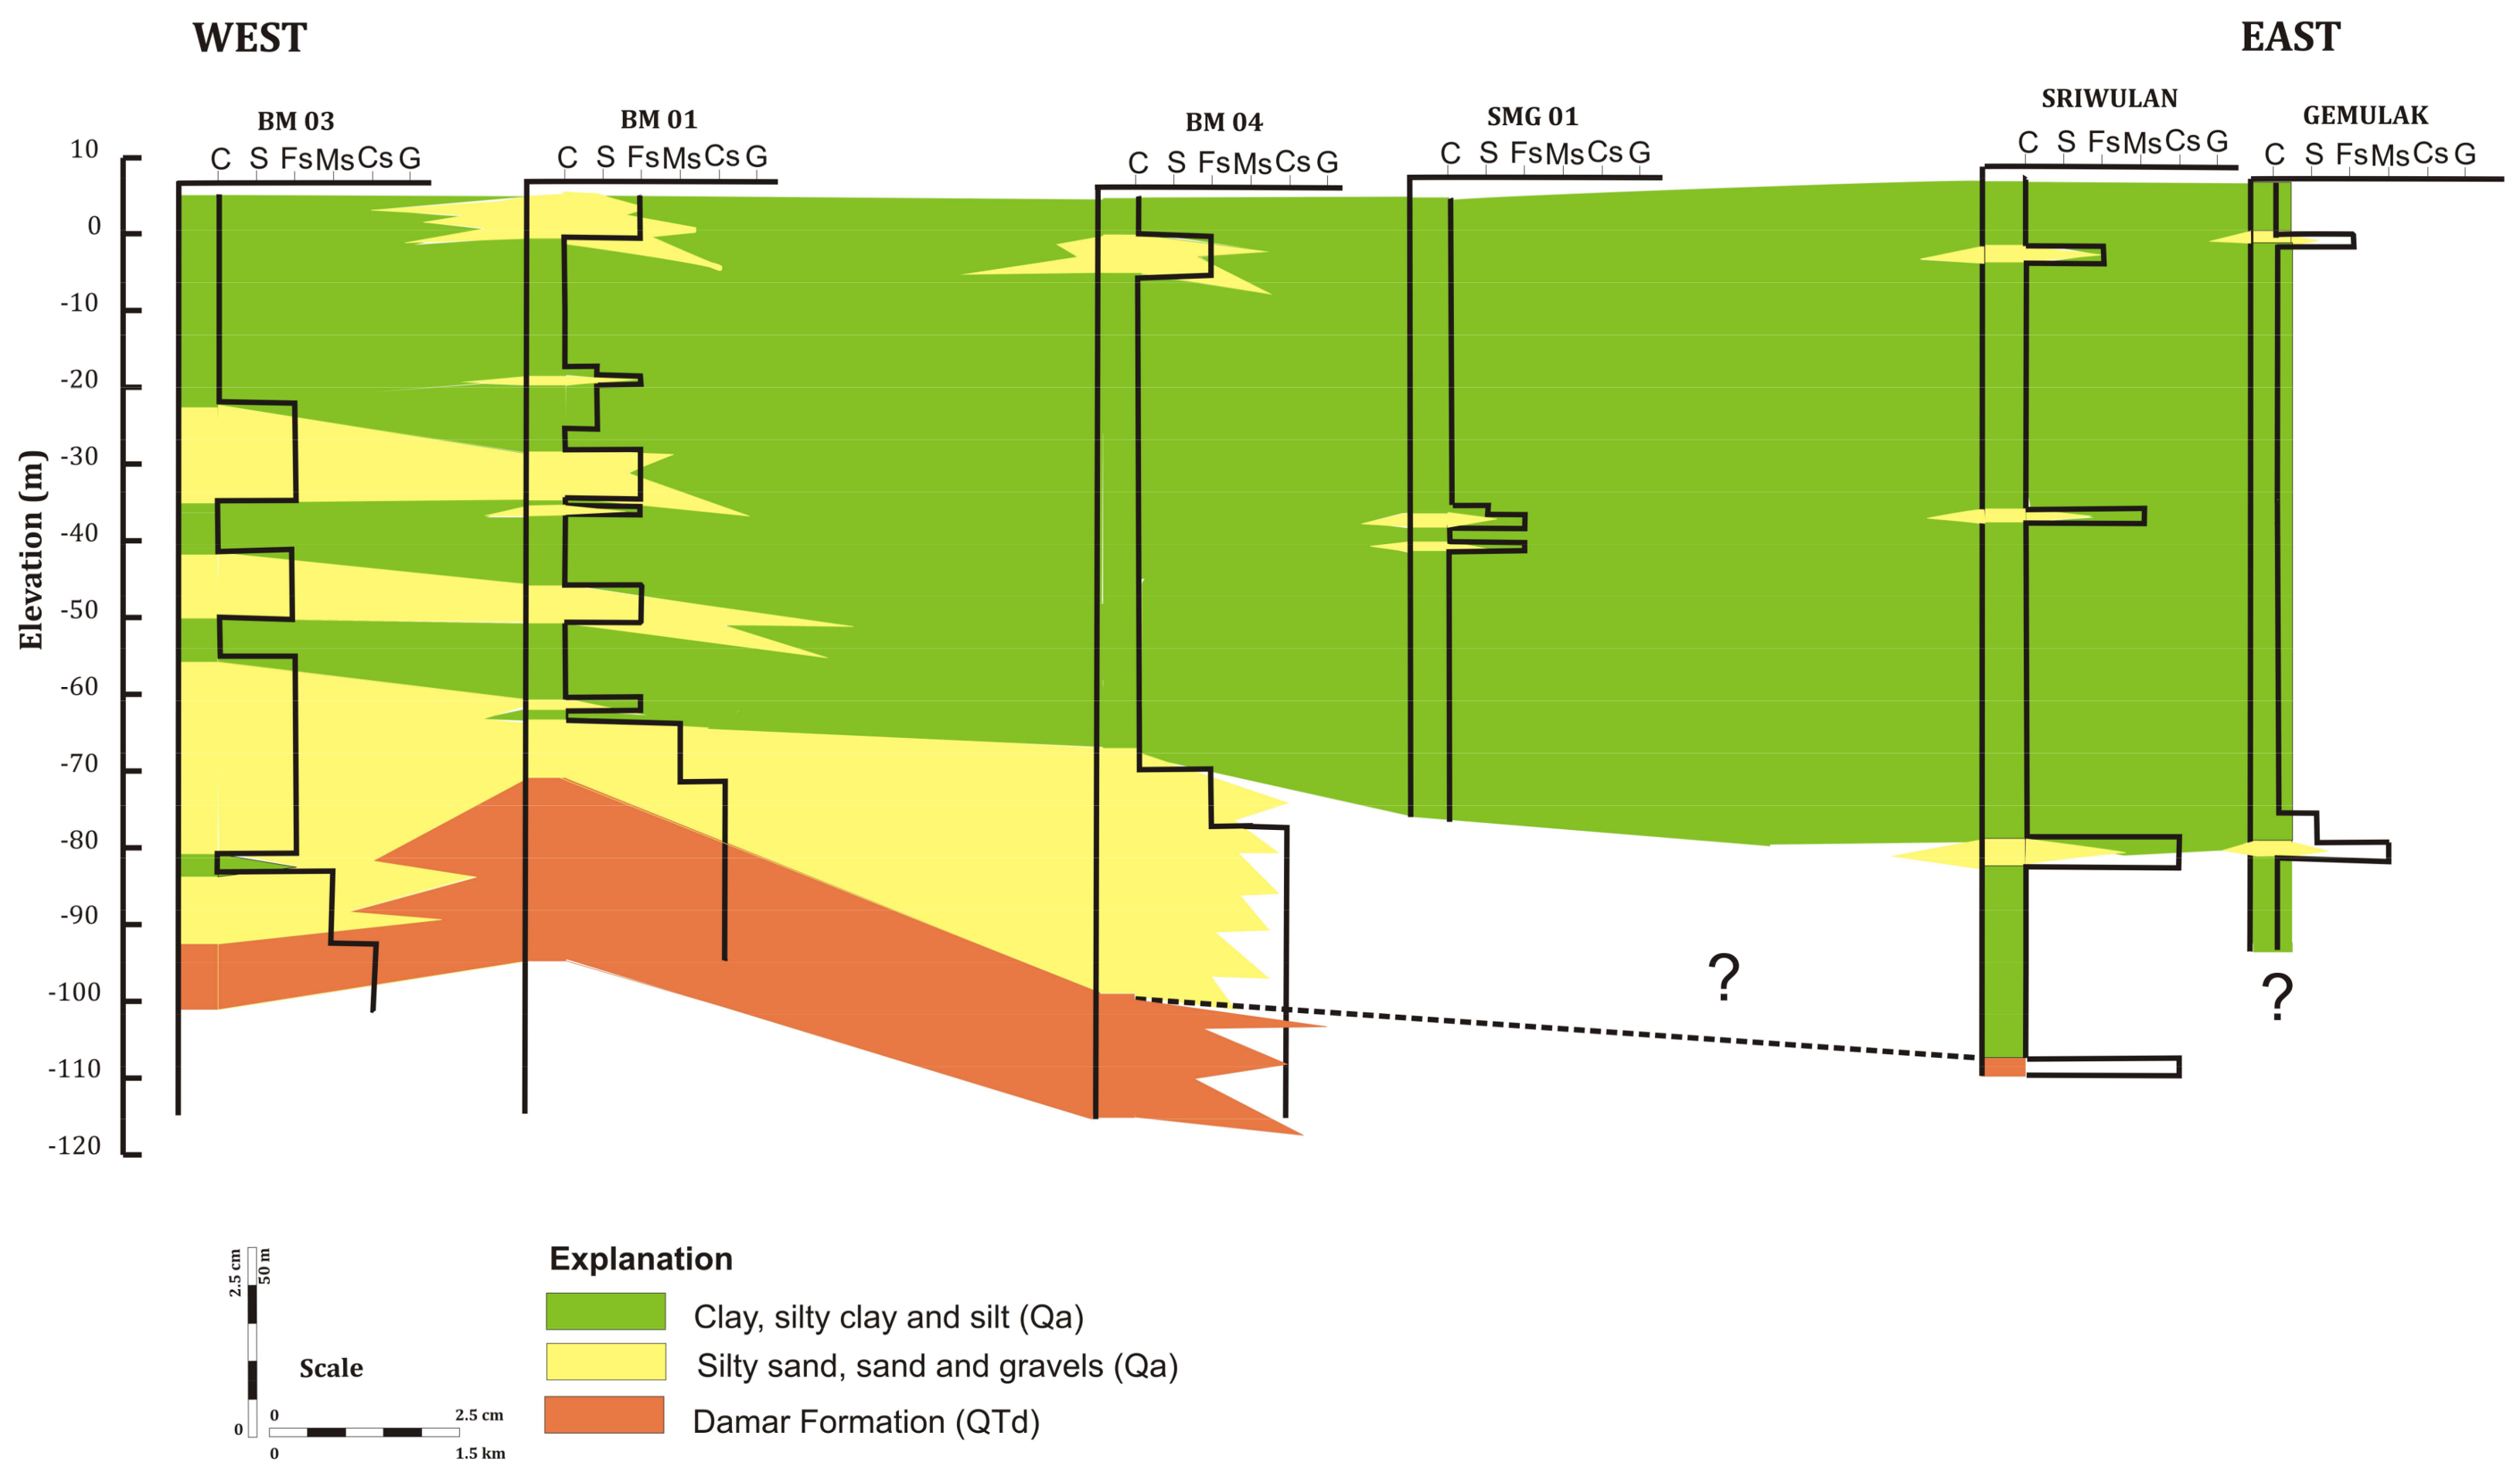
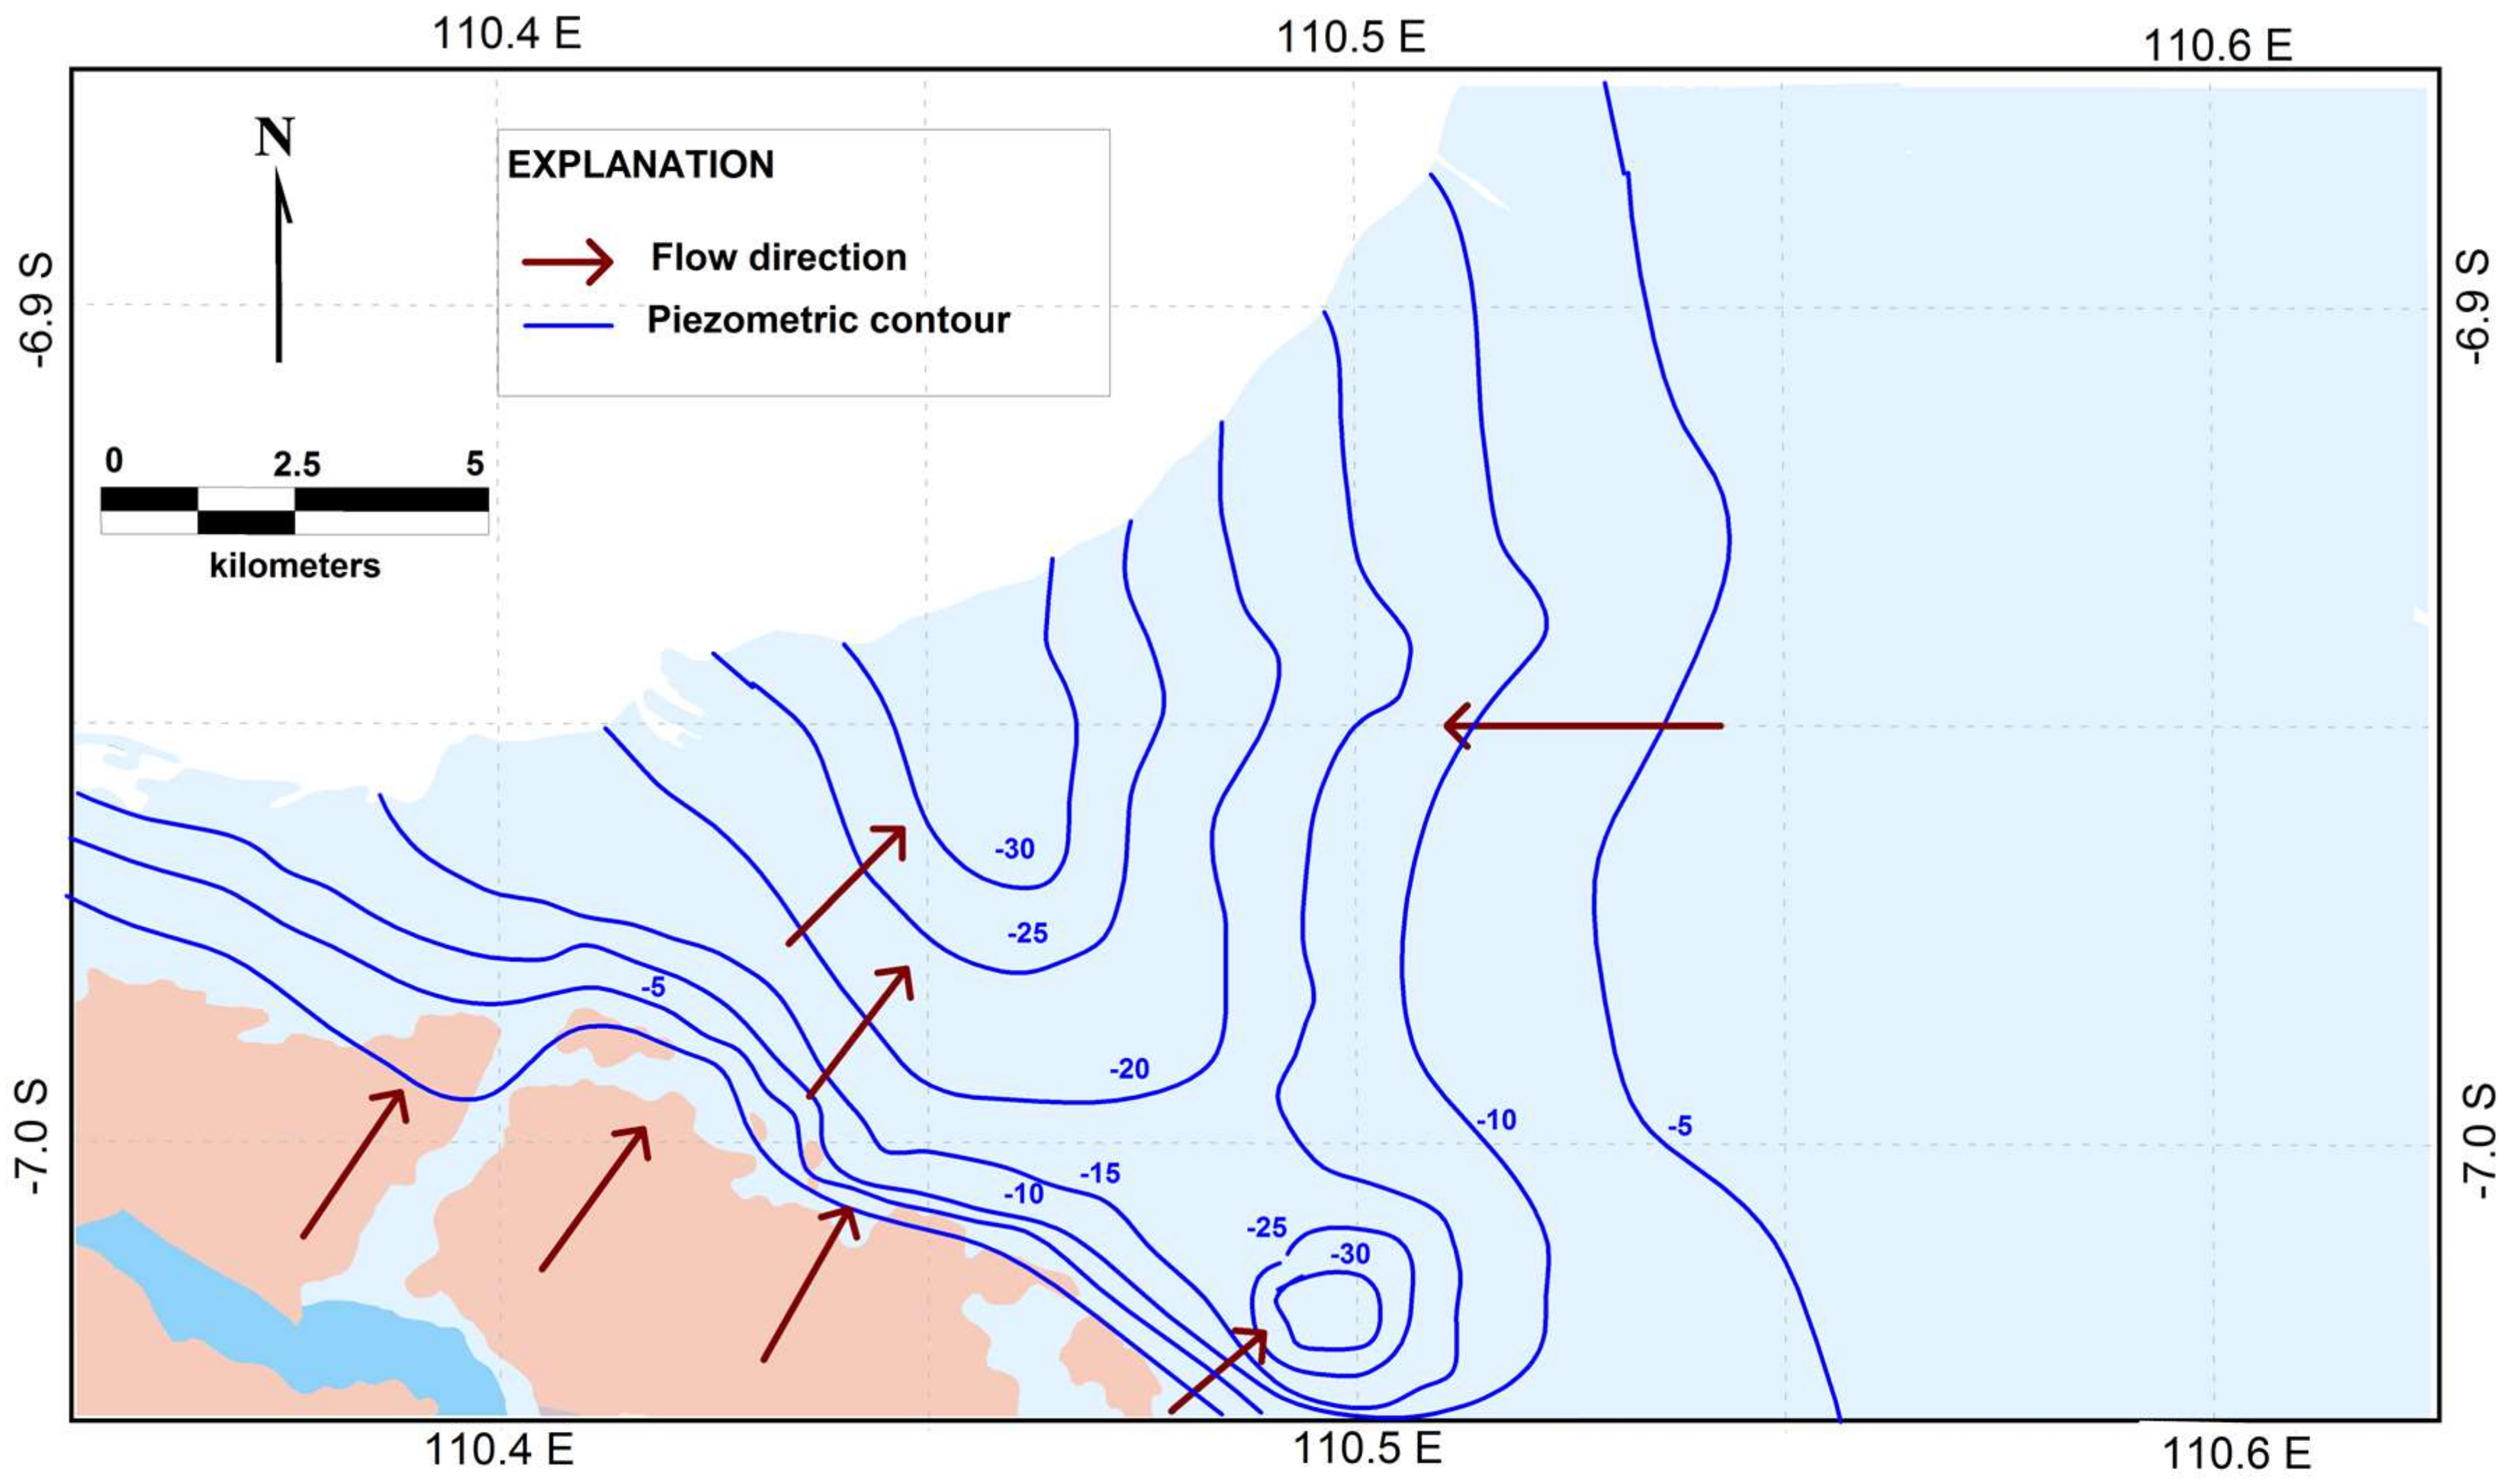
2. Geology and Hydrogeology of the Study Location

The study area is located between 6.8–7.0°S and 110.4–110.6°E, consisting of the coastal lowland morphology in the north and a hilly area in the south. The Semarang-Demak coastal plain in the north is overlain by surficial alluvium (Qa), and the south hilly topography consists of Quartenary volcanic rock (QTd) and Tertiary rock (Tmpk) (Figure 1). The Kalibeng Formation (Tmpk) consists of marl with tuffaceous sandstone and limestone intercalations. The Damar Formation (QTd) consists of tuffaceous sandstone, conglomerate, and volcanic breccia. The surficial alluvium lies unconformably on top of the Damar Formation. [38] stated that the coastal plain of Semarang—Demak is formed by an alluvial deposit of thick layers of calcareous and shell-bearing clay, with thin intercalations of sand, and occasionally gravel or cemented gravel deposited in a marine environment. Van Bemmelen (1941), in [38], estimated the thickness of the alluvial deposit to be 50 m near the south hills and along the coast of about 90 m. The latest tectonic activity in Semarang was in the Plio-Pleistocene, forming the thrust fault separating the Quartenary Damar Formation and the Tertiary rock (Tmpk) [39].
Recent sedimentation processes influenced the Semarang-Demak plain to a great extent. The sea level rise during the Pleistocene caused submersion of this area, and sedimentation of the Semarang-Demak alluvial plain started at the beginning of the Holocene [38]. The fluctuation of the global sea level during the Holocene caused transgression and regression, forming the silting of the Semarang-Demak plain. Van Bemmelen (1941), in [41], noted that 300 years ago, the Semarang port was in Bergoto which is about 5 km south of the present coastline and the Semarang-Demak plain was a sea until 500 years ago [42]. The sedimentation of the study area is fairly recent; previous studies [42,43,44] reported that during 1695–1991, the shoreline in the study area progressed rapidly towards the sea at an average rate of 8.0 m/year.
Hydrogeologically, the Semarang-Demak plain consists of unconfined and confined aquifers. The unconfined aquifer is formed by alluvial deposit of clayey sand to sand, with a fluctuating water table, depending on the recharge from precipitation. The annual rainfall of the Semarang-Demak plain is 1500–3000 mm, with dry months from May to October and wet months from November to April [45]. The confined aquifers are the Quaternary deposit aquifers and the Damar Formation aquifer [45]. The Quaternary deposit aquifers are divided into the Garang deltaic aquifer of freshwater and the Quaternary marine aquifer of saline water. The Garang deltaic aquifer consists of medium to coarse sand, and the Quaternary marine aquifers consists of clayey sand, and fine to coarse, shell-bearing sand. The Damar aquifer is the main aquifer in the Semarang - Demak plain that contains freshwater of volcanic rocks. The West-East section from compiled borehole and CPTu sounding data provides a typical subsurface profile of the study area (Figure 2).
Figure 2 shows that the bulk of the Semarang-Demak plain sediment consists of thick aquitard layers of clay and silty clay, intercalated with lenses of sand and gravels. The thickness of the clay layer is 25–80 m, and becomes thicker towards the east (Demak). From the grain size distribution in Figure 2, it can be seen that the Garang deltaic aquifer exists at the depth of 60–90 m, and the Quaternary marine aquifer occurs at the shallower depths (less than 60 m). The Garang deltaic aquifer and Quaternary marine aquifer were possibly formed during regression and transgression during the Holocene. A specific study on the Semarang-Demak plain Quaternary deposition is not yet available; therefore, the detailed information on its depositional history is largely unknown. The Quaternary aquifers mostly exist as lenses which contain freshwater and saline water of limited yield; therefore, utilization of these aquifers is limited. The most exploited groundwater comes from the Damar Formation, and the piezometric contour of this aquifer shows some depressions related to groundwater utilization at industrial estates (Figure 3). The lowering of piezometric pressure due to groundwater exploitation exerts additional pressure on the overlying aquitard. The compaction of the thick, compressible upper clay of the study area is thought to contribute to the land subsidence.

3. Materials and Methods

In this study, clay samples and water samples were taken from subsidence areas in the Semarang-Demak plain. Clay samples were taken from four boreholes: SMG01 and SMG02 (Semarang City), and JTK and GEM (Demak Regency), and water samples were taken from nearby dug and bored wells (Figure 1). A Shelby thin-walled tube sampler was used to retract relatively undisturbed samples. The samples were then tested for compressibility, index properties, clay mineralogy and were used for porewater extraction. Laboratory investigations of geotechnical index properties of clay (natural water content, density, specific gravity, Atterberg limits, and grain size distribution) were carried out according to ASTM D 2216, D 7263, D 854-02, D 4318, and D 422, respectively.
Identification of clay mineralogy requires separation of the clay fraction from the bulk soil. About ten grams of clay were taken from each stratum and dispersed in distilled water using a high speed stirrer, followed by centrifugation to obtain a fraction of <0.002 mm. Two oriented glass slides were prepared for each sample, one for an air-dried oriented slide and the other slide had ethylene glycol. All slides were exposed to Cu-Kα radiation on an XRD Shimadzu-6000 at a scanning speed of 2° per minute, from 2° to 30°. A semi quantitative estimation of clay minerals was carried out from the peak area (I) using the formula [46,47]:
%   o f   c l a y   m i n e r a l s = 100 ×   [ I   c l a y   m i n e r a l s / Σ   I   a l l   c l a y   m i n e r a l s   i n   t h e   s a m p l e ]
The peaks used for semi-quantitative analysis were 15–17 Å (smectite), 10 Å (illite) and 7.1 Å (kaolinite and chlorite). Due to the absence of heat treatment, kaolinite and chlorite are not distinguishable in this analysis. We stress the presence of smectite and illite as they have higher activity [48] in response to the changes in physicochemical properties.
Extraction of clay porewater was carried out by leaching, adapting the procedures from [49]. Clay samples were mixed with de-ionized water at a solid to liquid ratio of 1:5. Clay solutions were homogenized using a magnetic stirrer and were agitated for 3 h using a laboratory shaking bath (Julabo SW23) at 200 rpm. After leaching, the clay suspensions were centrifuged in 50 mL tubes using a HeraeusLabofuge I bench-top centrifuge at a speed of 2000 rpm for 20 min. Following centrifugation, the aliquots were filtered using Whatman filter paper No. 42 to remove any clay particles present. Aliquots of the clay suspension, and groundwater samples from dug and bored wells were tested for electrical conductivity, pH, sodium ion, and chloride ion concentrations. Electrical conductivity and pH were measured using a portable electrical conductivity/pH meter (WM-32EP, DKK-Toa.co). Chloride concentration was determined by argentometric titration (APHA, 4500 Cl) using the Titroline alpha apparatus (Schott GmbH, Frankfurt, Germany) and Na cation by an atomic absorption spectrophotometer (AAS Shimadzu 7000). All measurements were carried out in triplicate.
To study the porewater salinity effect on the compressive behavior of clay, laboratory oedometer tests (ASTM D 2435) were performed. Replacement of porewater was achieved by soaking the sample with de-ionized water, and NaCl solutions of 1000 mg/L, 3000 mg/L, and 6000 mg/L concentrations during consolidation process. The clay compressibility behavior was evaluated from the compression index (cc), coefficient of consolidation (cv), hydraulic conductivity (k), oedometer modulus (Eodo), and coefficient of swelling (cs). The compression index (cc), swelling index (cs), and oedometer modulus (Eodo) were determined from the logarithmic curve of applied stress against the void ratio; and the coefficient of consolidation (cv) was computed using the Casagrande time-square method (t90), which indicated the rate of clay sample compression required to achieve 90% of consolidation (in m2/year) [50].The hydraulic conductivity (k) was calculated by:
k = c v   ρ w   g / E o d o
where is the density of water (1.00 g/cm3 and 1.01 g/cm3 for NaCl solutions), g is the gravitational acceleration (9.8 m/s2) and Eodo is oedometer modulus (kPa).
The fabric of the marine clays was examined using a scanning electron microscope (SEM, Jeol-JSM-6510). Samples were prepared by oven drying at constant temperature of 30 °C and cut perpendicular to their horizontal bedding plane. Clay samples were examined under their natural condition to observe the original fabric, and were re-observed after porewater replacement with saline waters to study the fabric change caused by changes in porewater salinity.

4. Results and Discussion

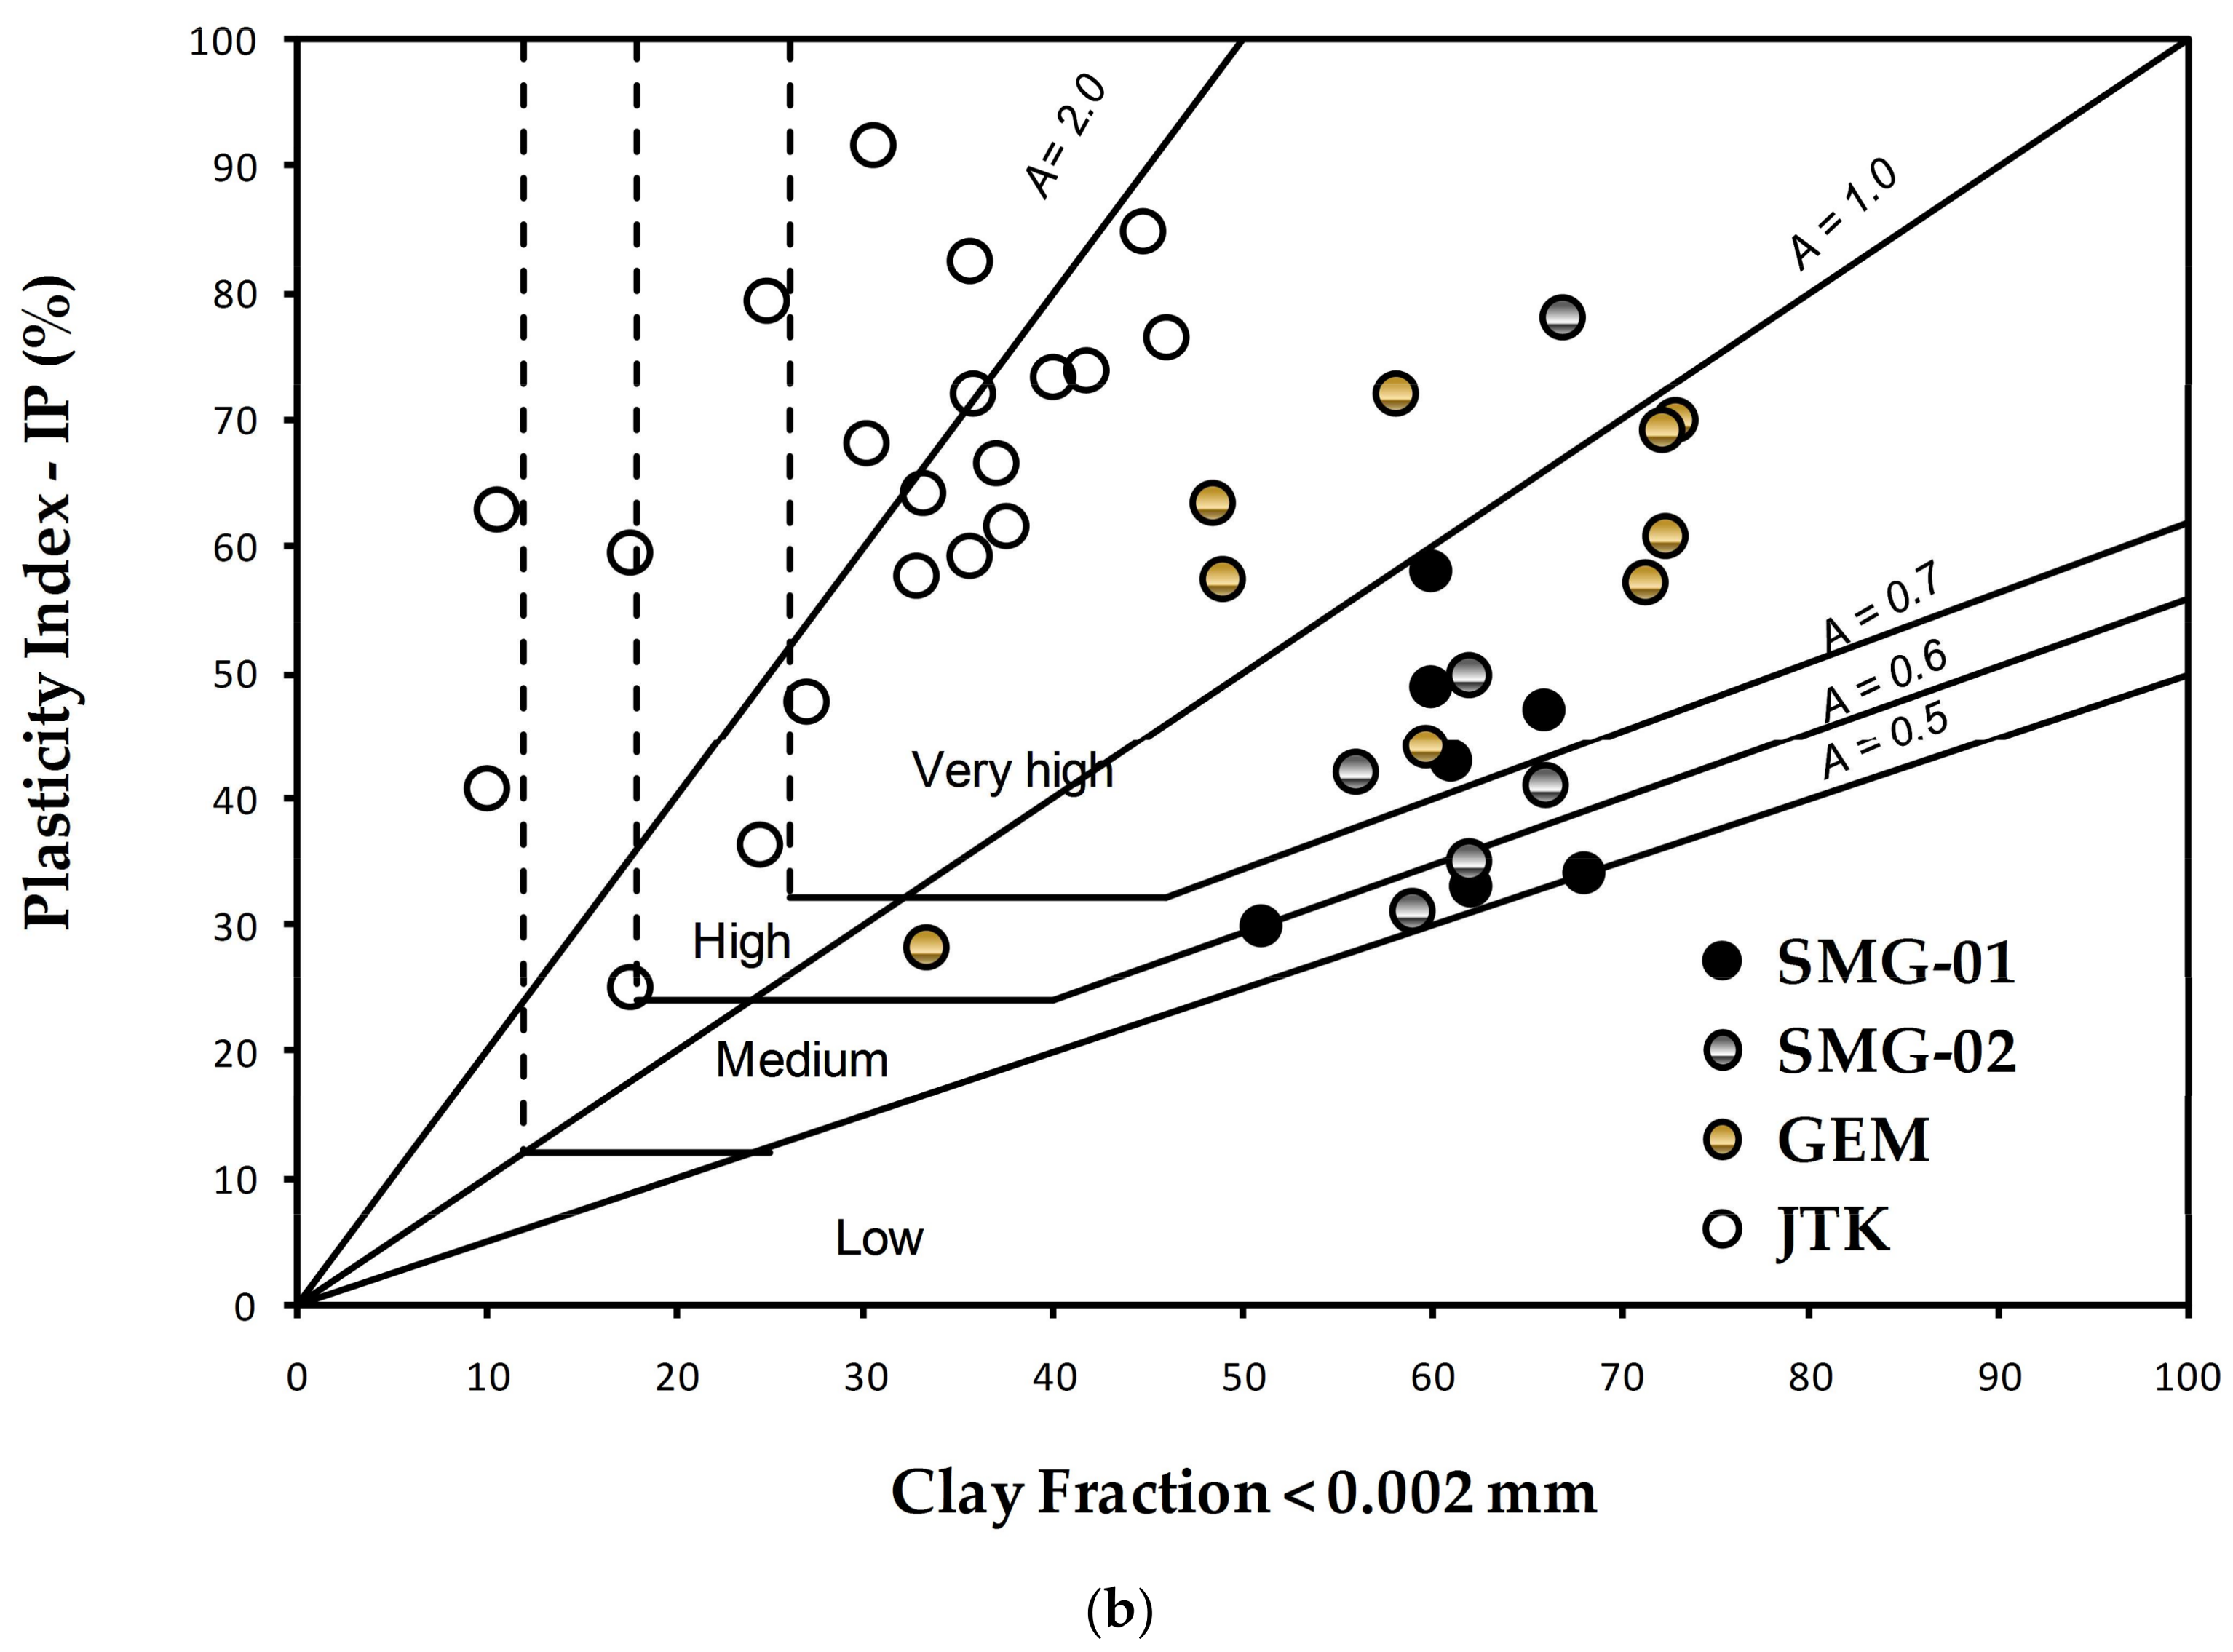
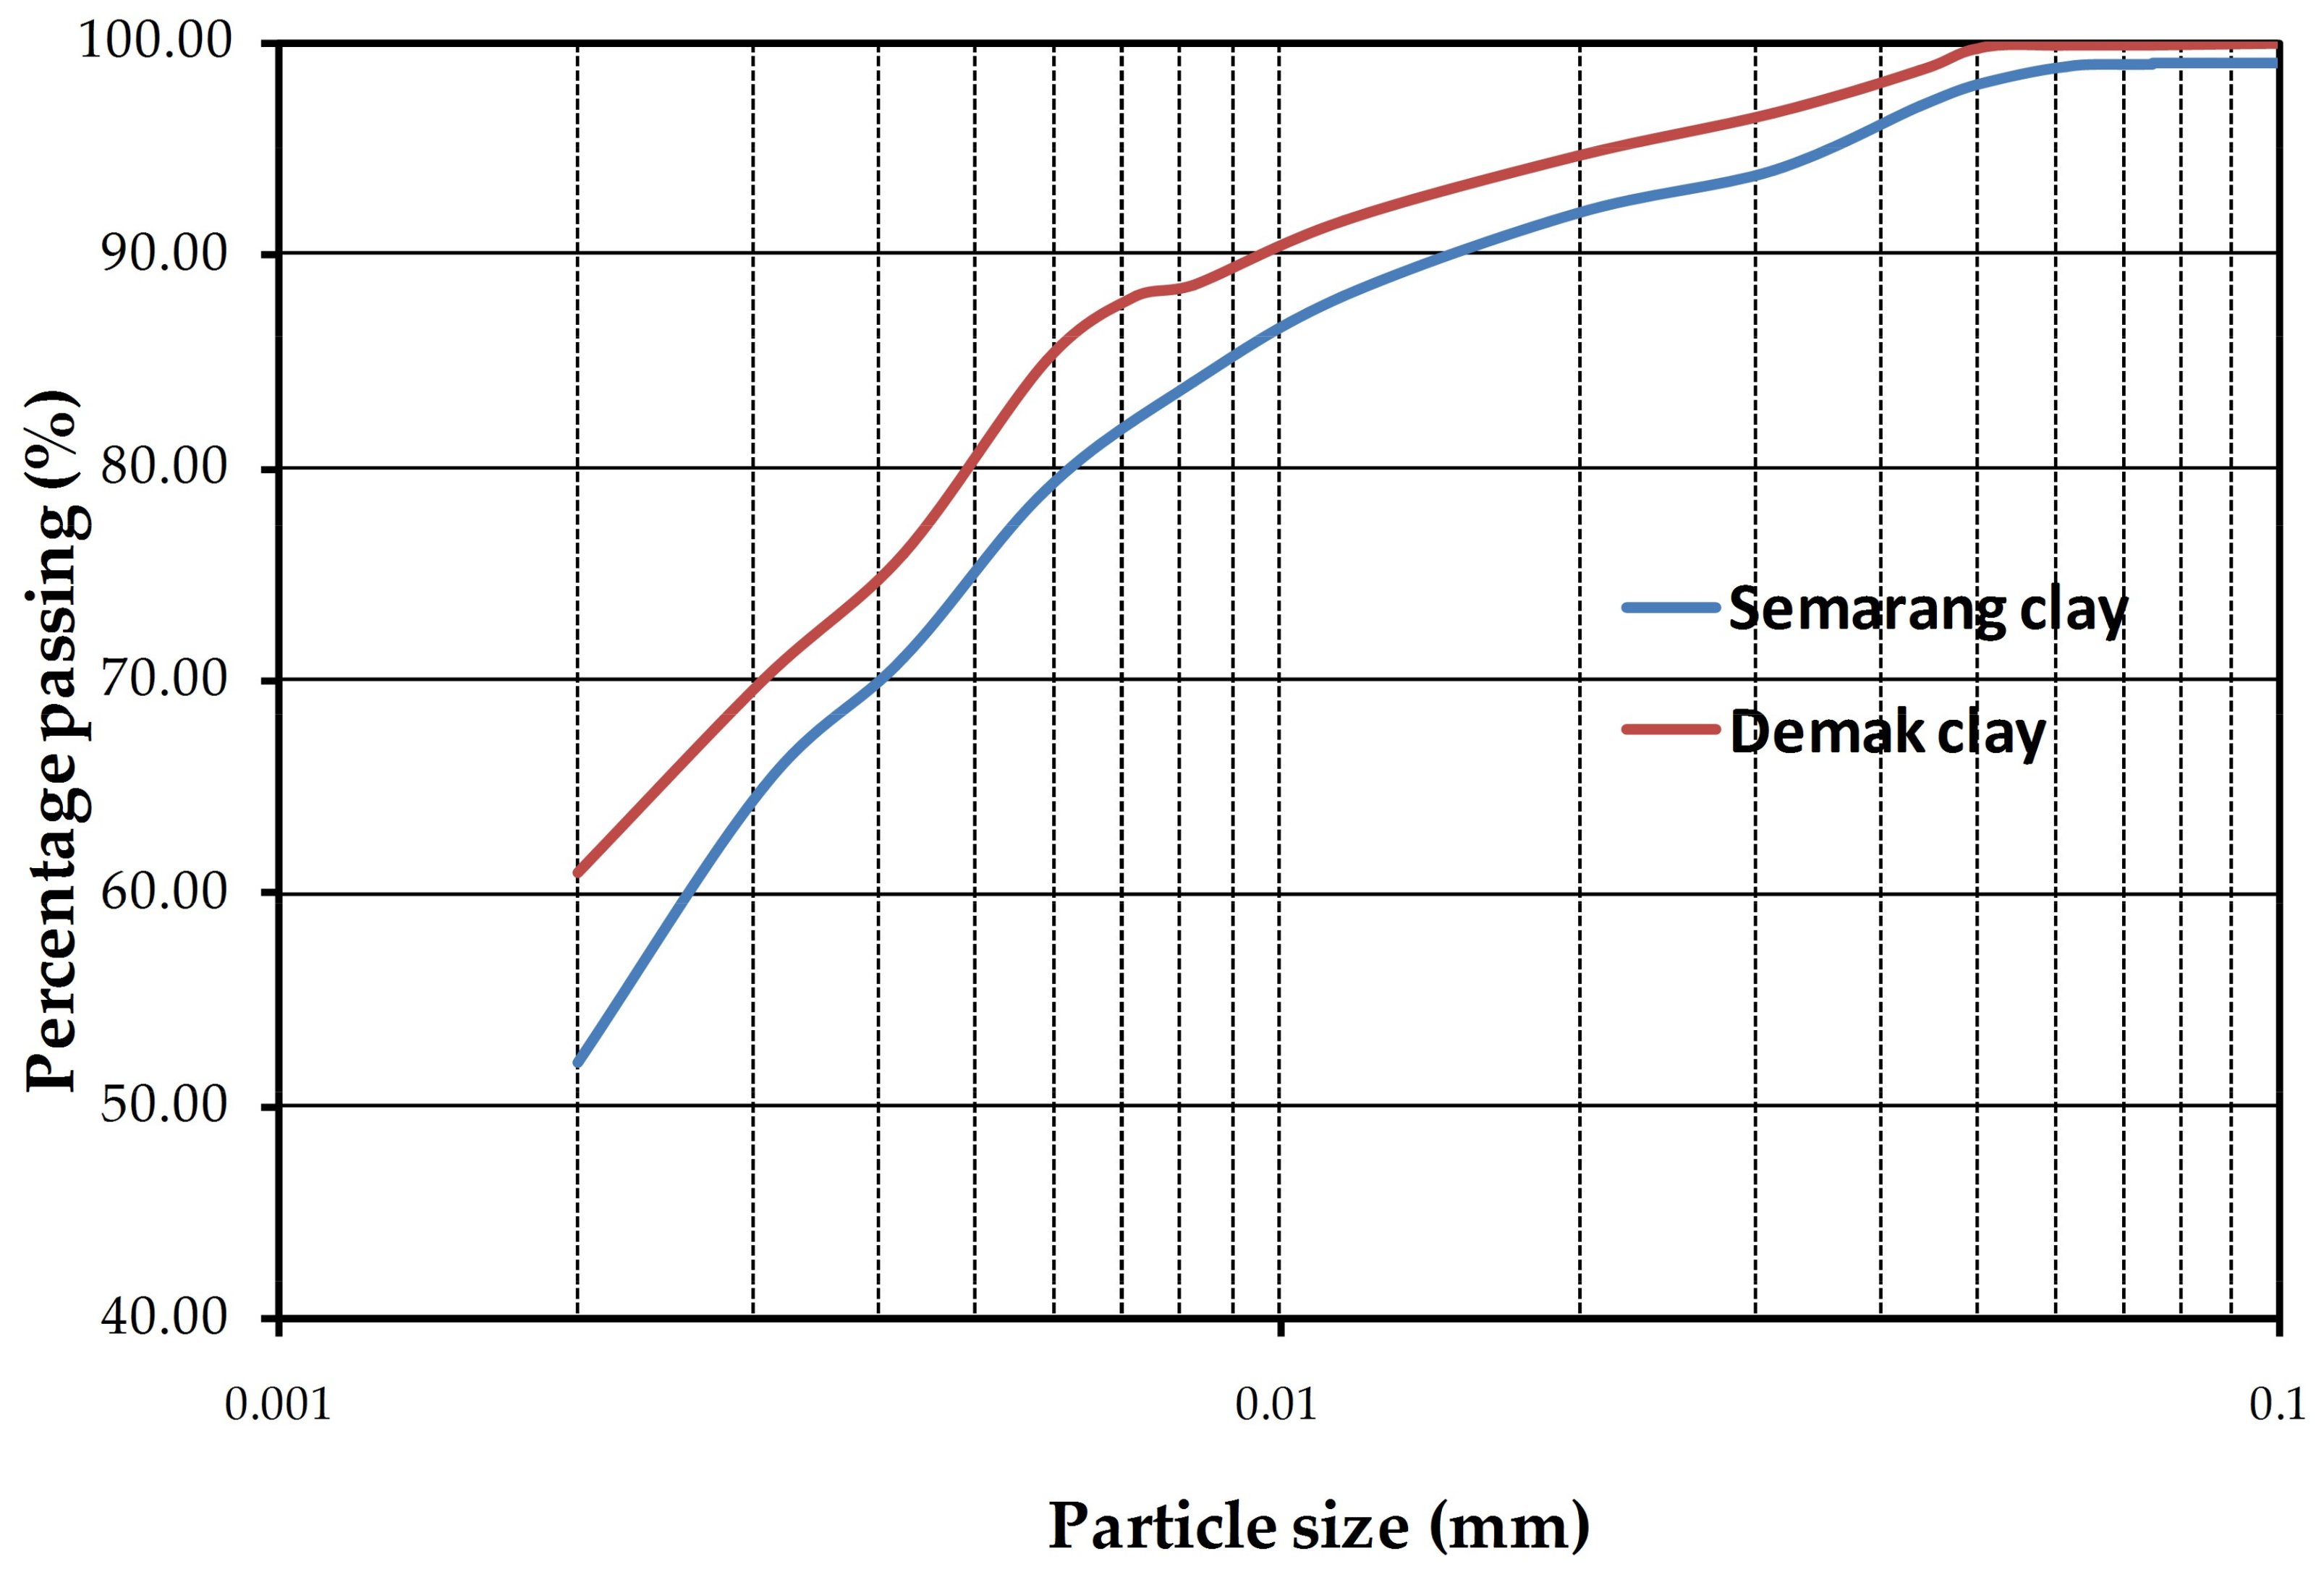
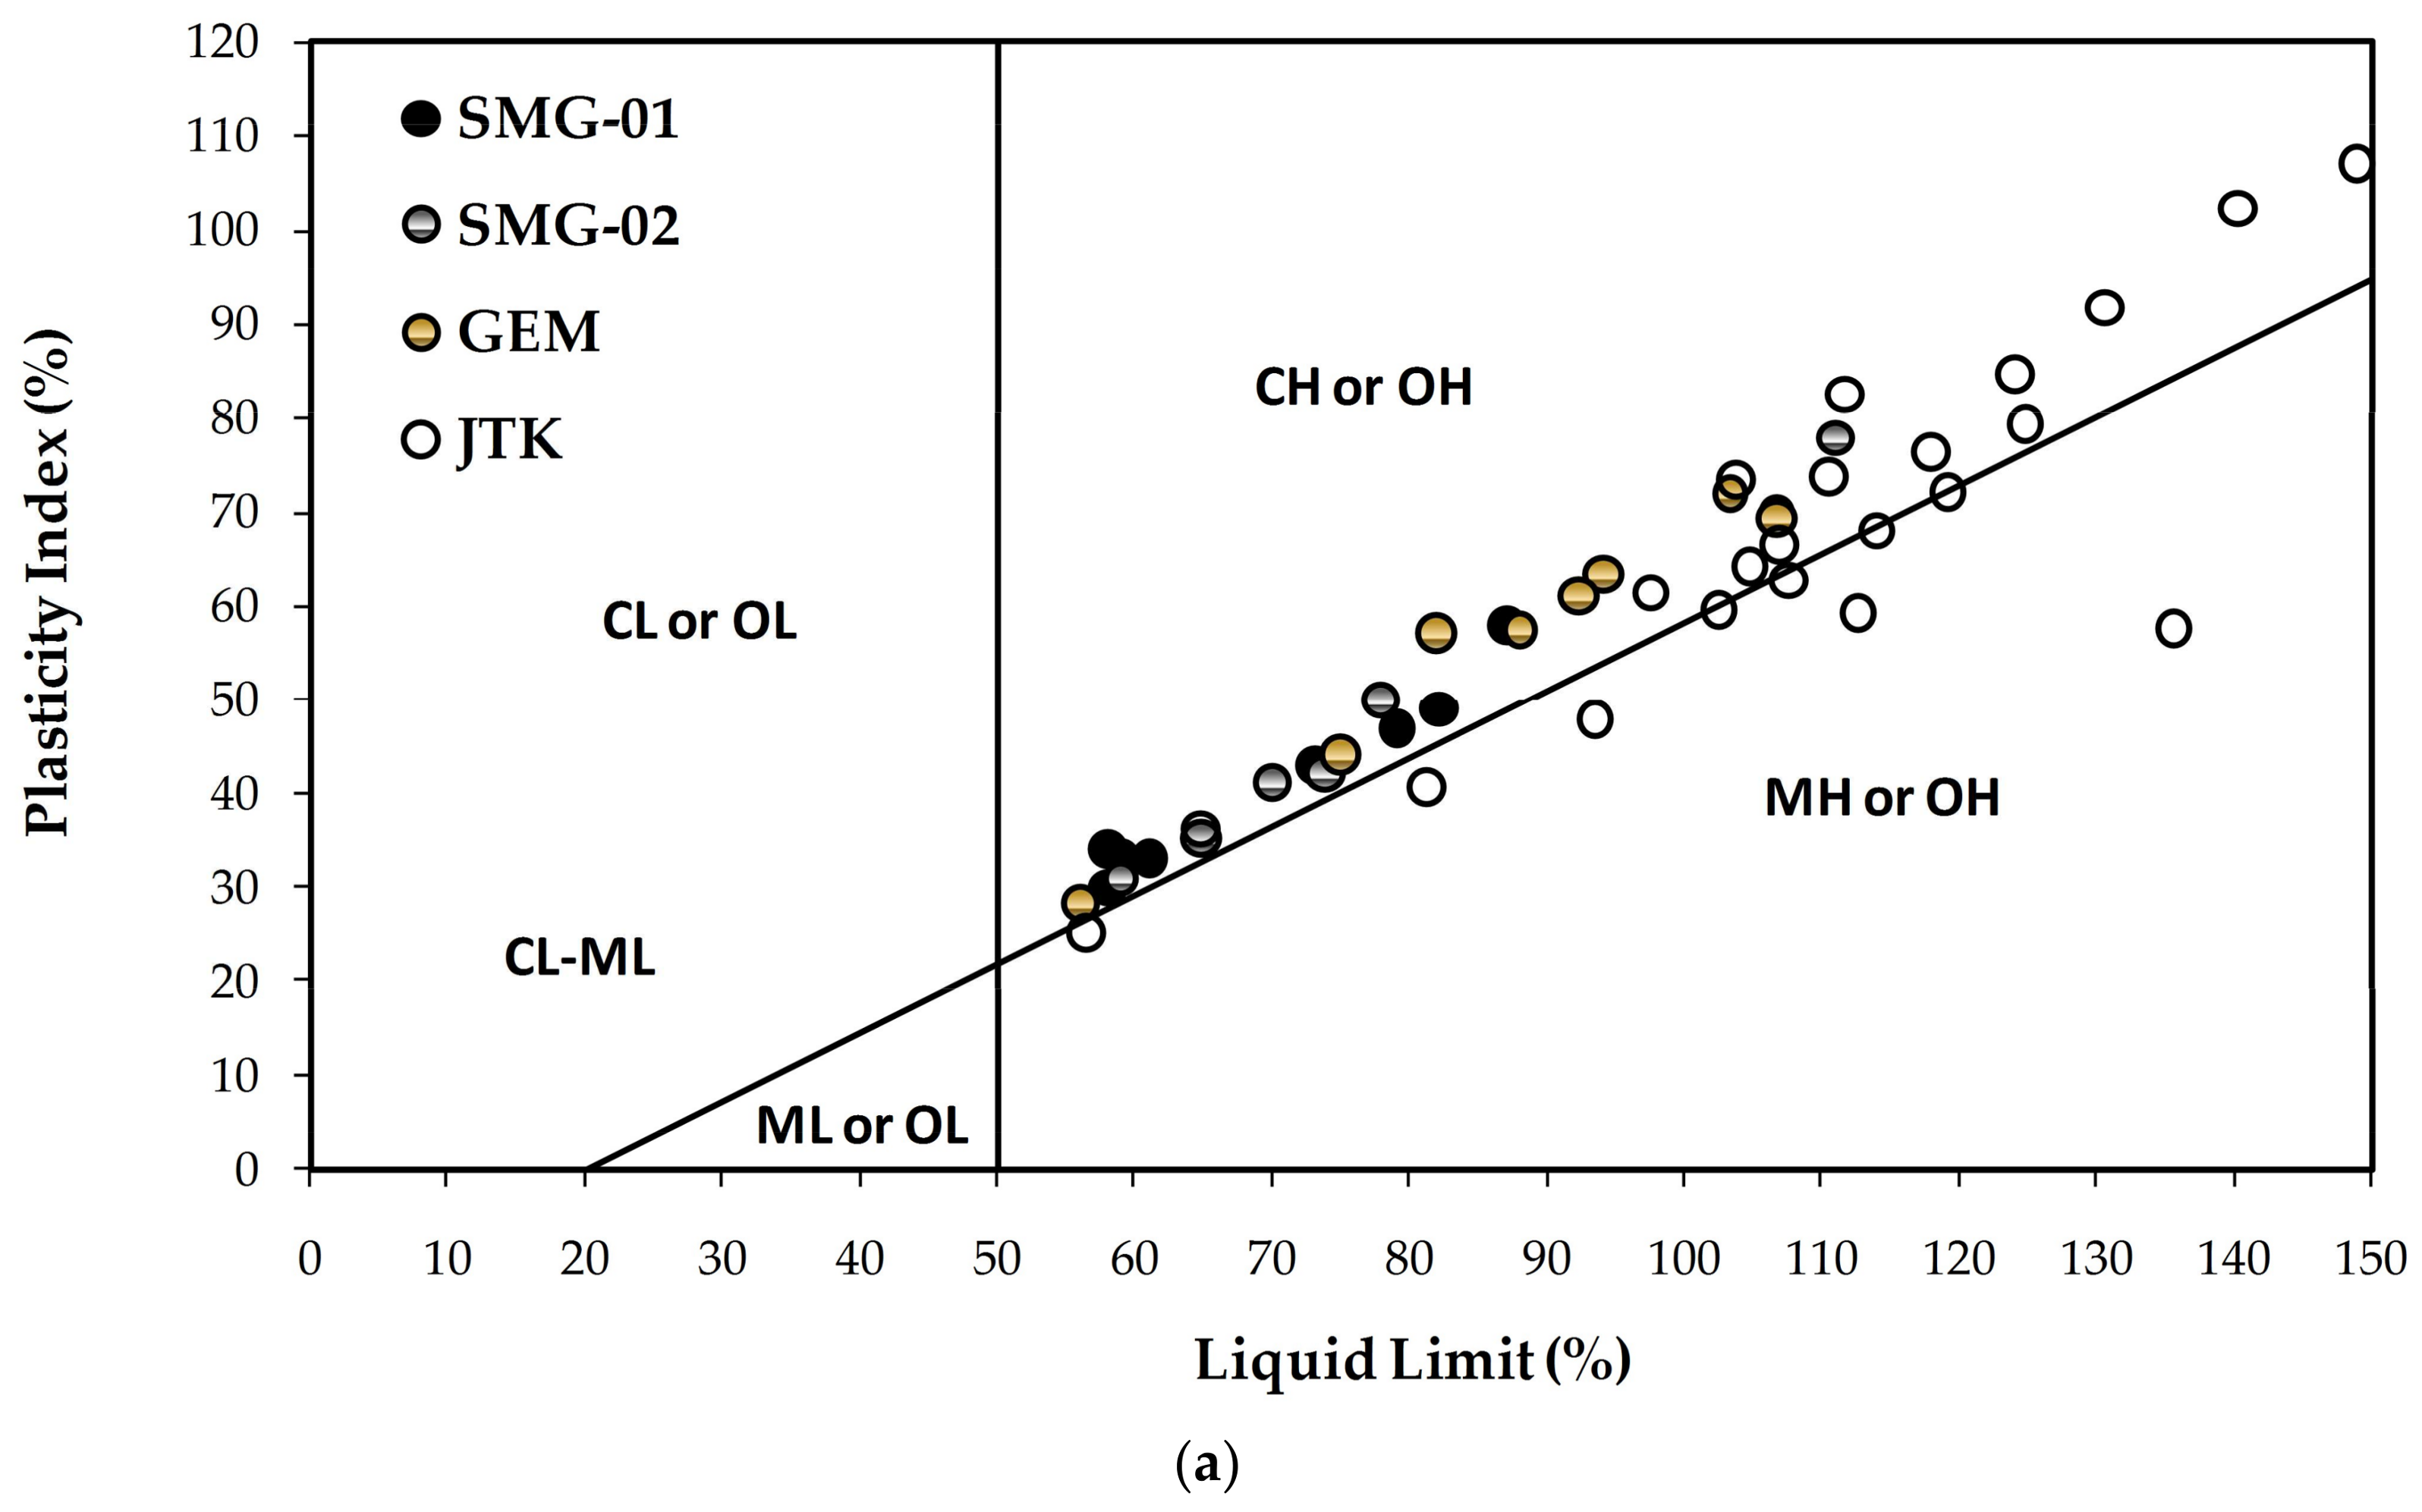
4.1. Geotechnical Index Properties of Clay

The laboratory results are presented in Figure 4, Figure 5 and Figure 6. Figure 4 shows that the natural water content of the clay ranges between 41.6 to 87.5%, bulk density between 12.7 to 18.3 kN/m3 and specific gravity from 2.45 to 2.90. Degree of saturation, calculated from the preceding results, varies from 90.0 to 124.0%, showing the saturation state of the clay. The grain size distribution curves of Semarang-Demak clays are quite similar, showing a high clay content (particle size less than 0.002 mm) of more than 50% (Figure 5). Atterberg limit test results show that the Semarang-Demak clay is mostly highly plastic (CH) (Figure 6a). Semarang clay has medium to high activity and Demak clay has high to very high activity (Figure 6b). The higher the activity of clay, the more pronounced the influence of the clay fraction on its engineering behavior and the more susceptible it is to changes in pore fluid composition [51]. The high activity of clay is also related to greater smectite presence [28].

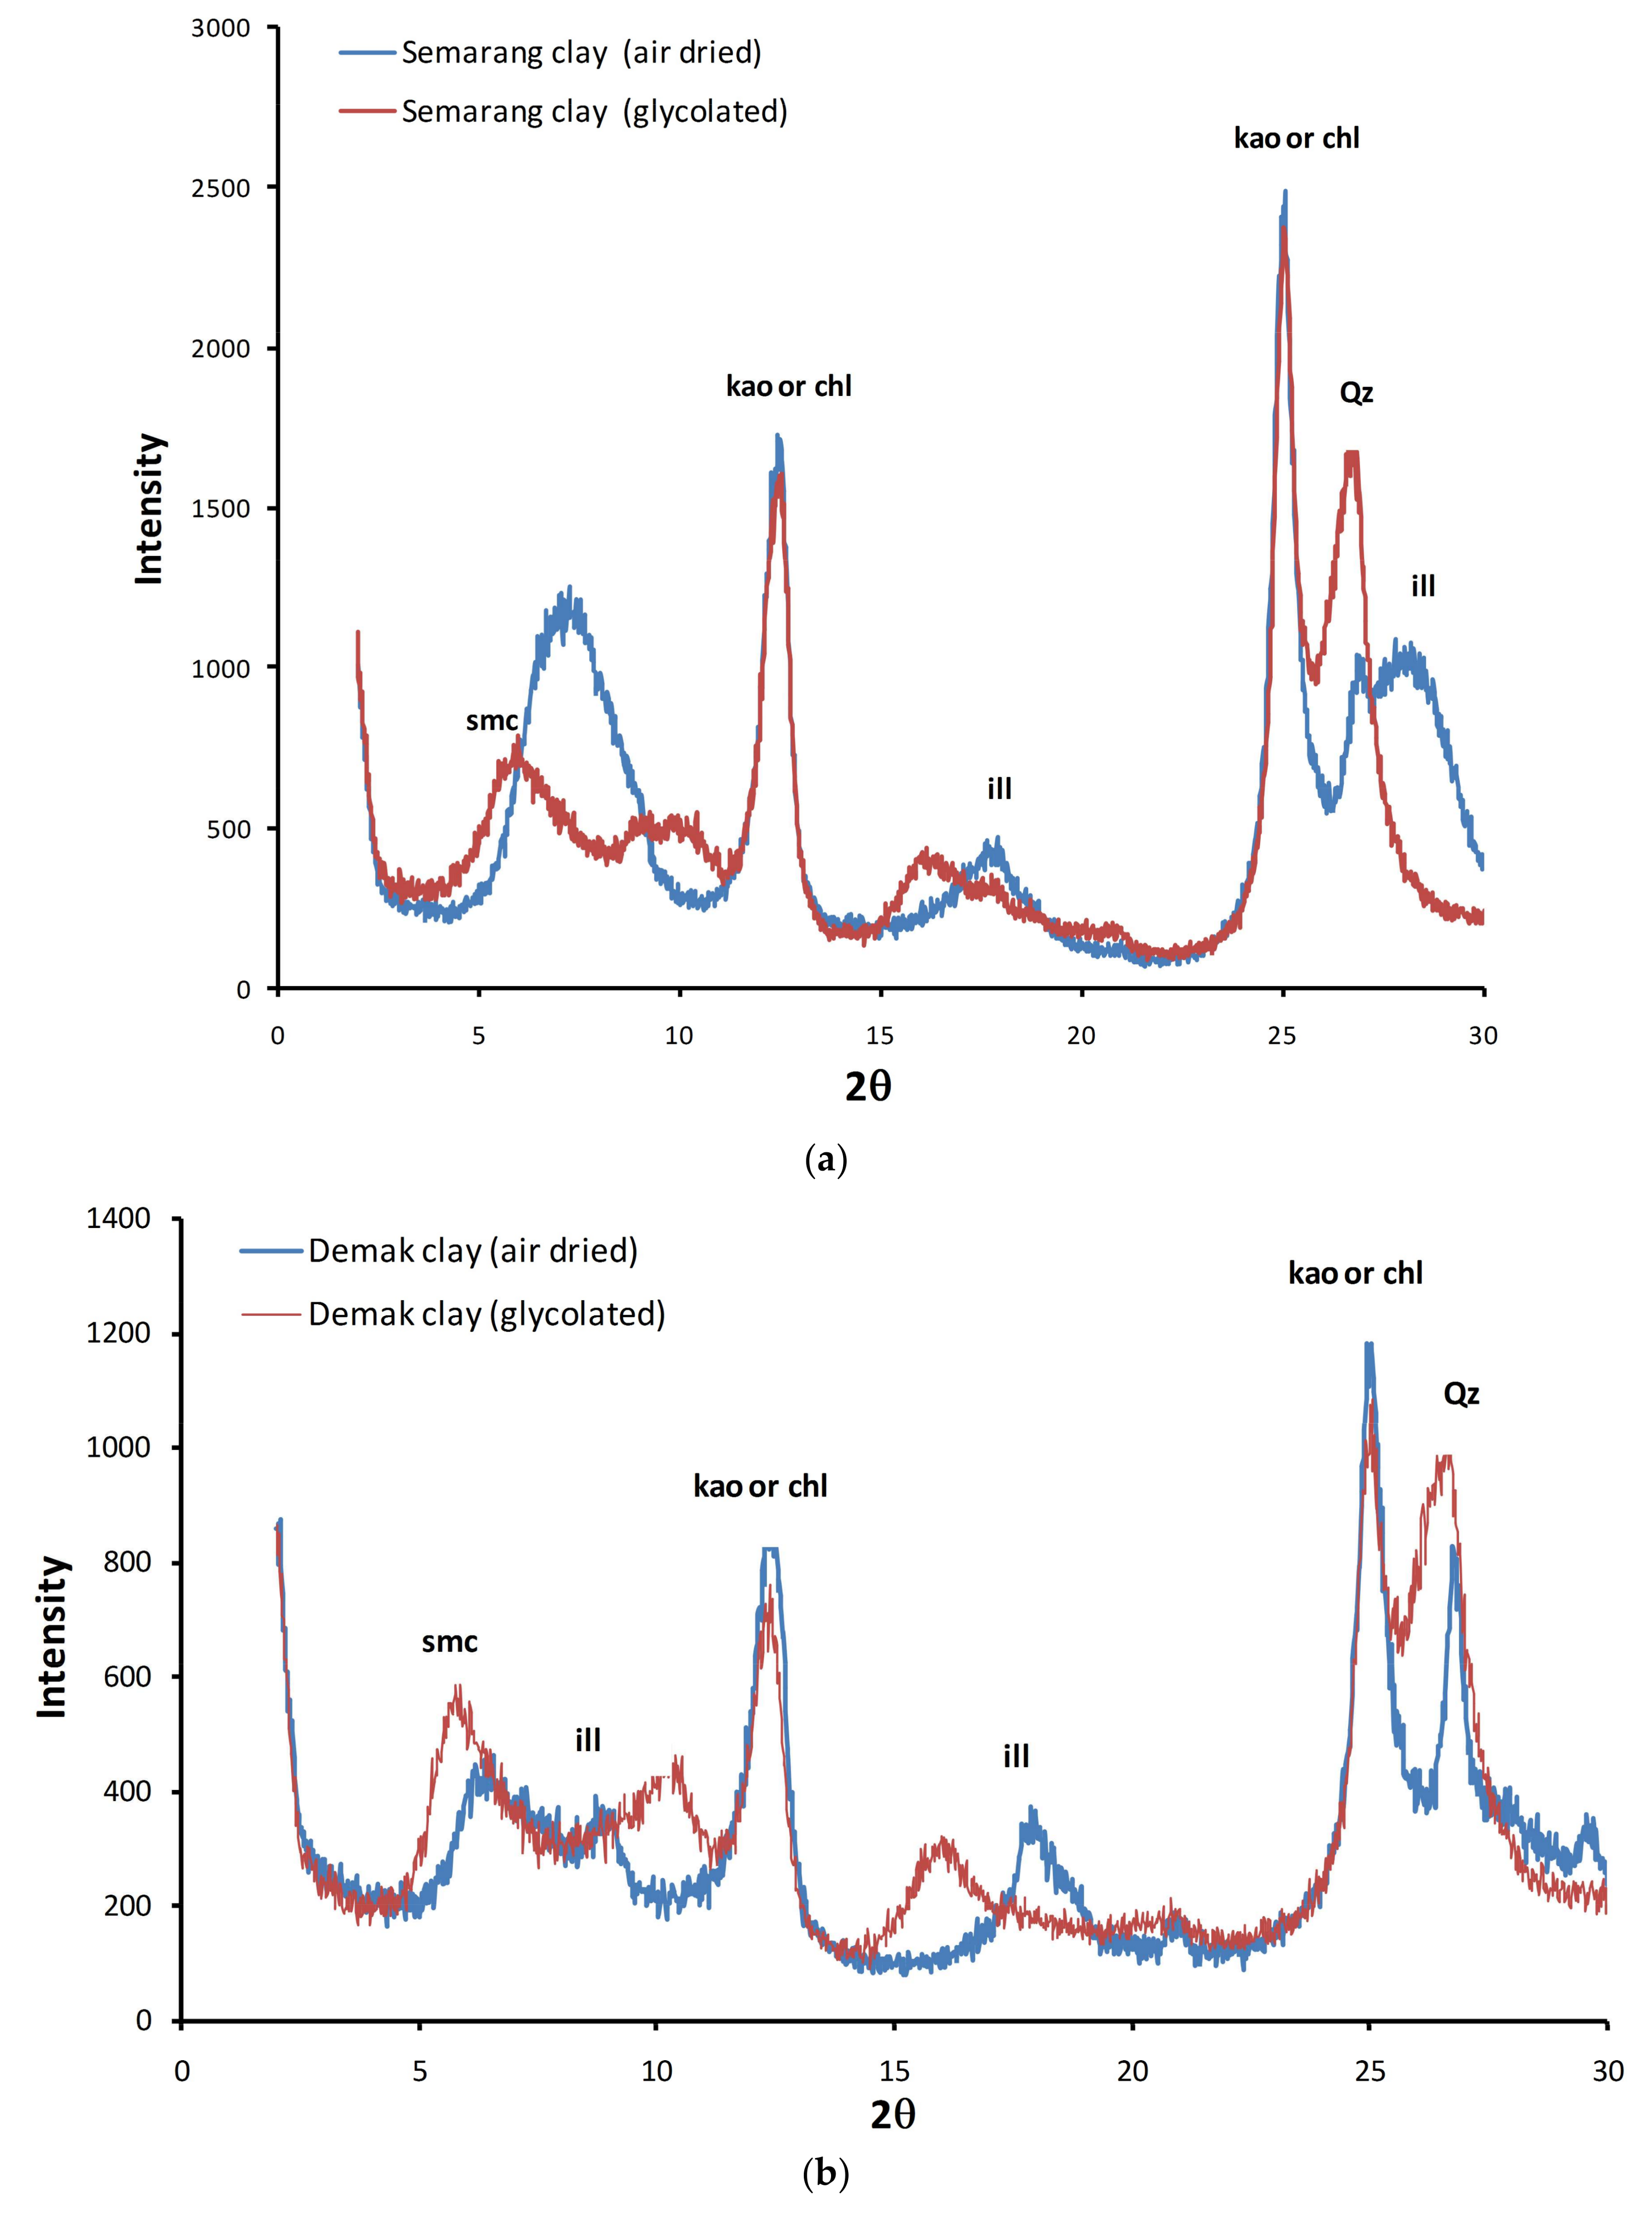
4.2. Mineralogy of Semarang-Demak Clay

Figure 7 shows the XRD patterns for air-dried and glycolated samples of Semarang-Demak clay. The presence of smectite is identified at of 7.1° (12 Å) to 5.8° (15.2 Å) (air dried) and of 5.7° (15.5Å) to 5.1° (17 Å) (glycolated). The peaks of 7.1 Å, 10 Å and 3.31 Å are due to kaolinite or chlorite, illite, and quartz, respectively. The relative percentage of clay minerals (Table 1) shows the significant amount of smectite. The higher activity of Demak clay, compared to Semarang clay, is confirmed by the higher amount of smectite.

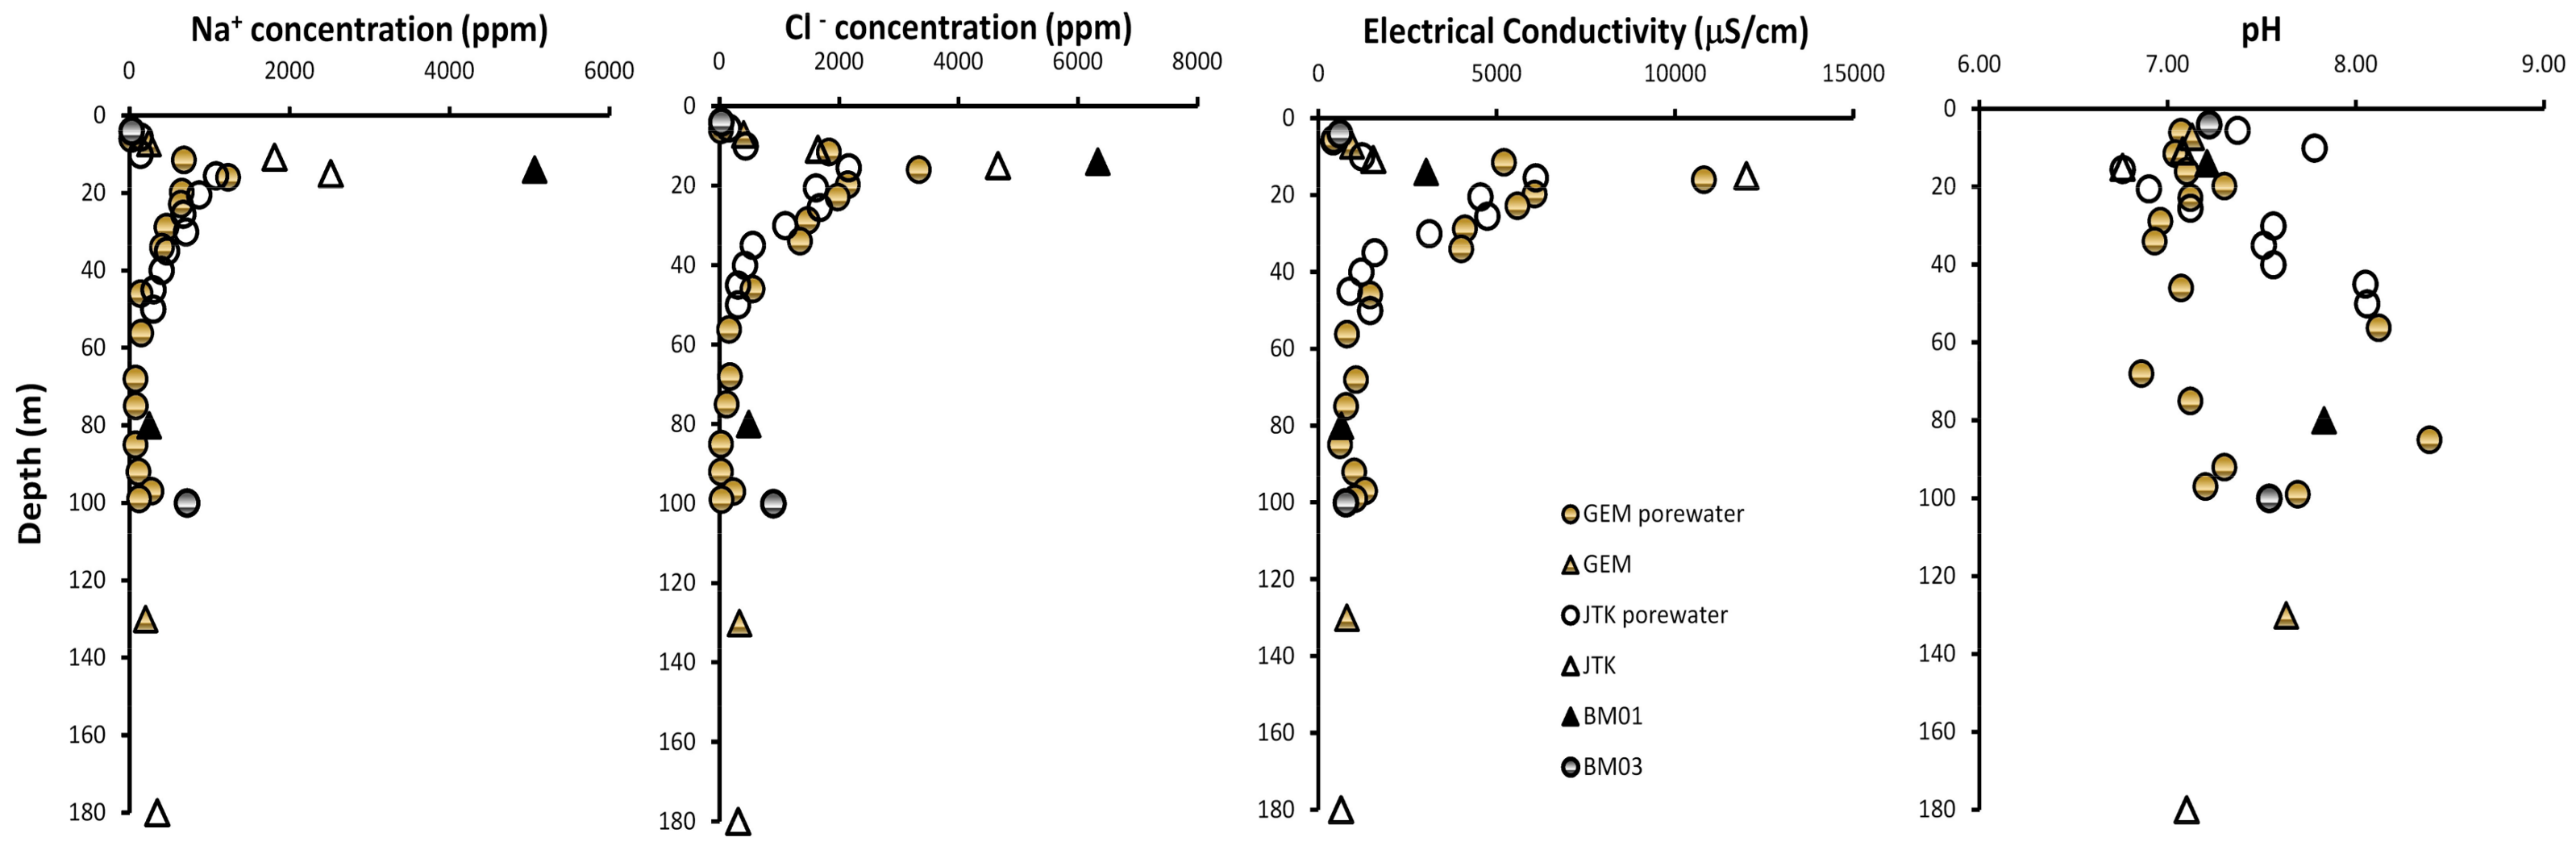
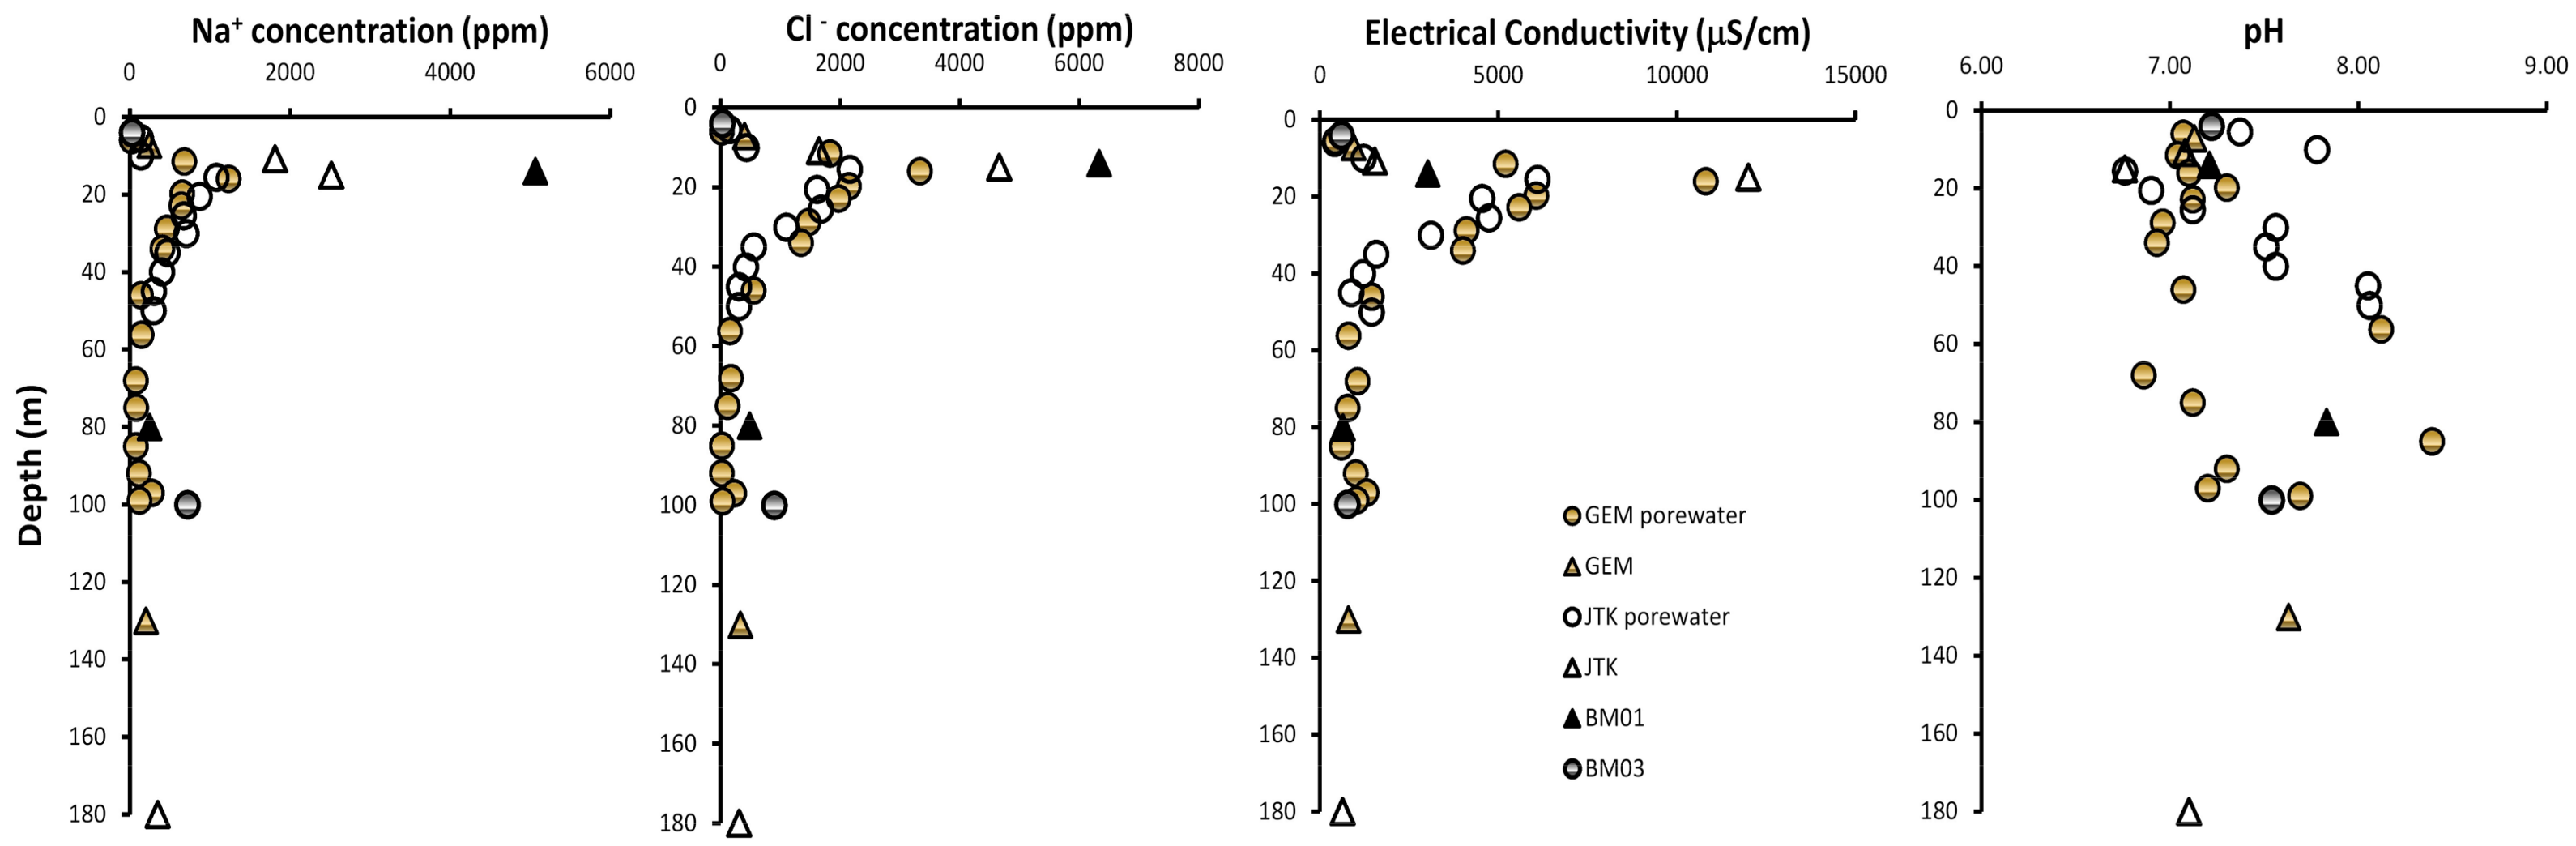
4.3. Groundwater Salinity of Semarang-Demak Plain

Concentrations of Na+ and Cl ions, electrical conductivity and pH of the porewater and groundwater from wells are shown in Figure 8. The chloride concentration in the upper 10 m is less than 500 ppm, and increases to 1100–6300 ppm at the depths of 10–35 m. Chloride concentration at the depths of 40–180 m is well below 400 ppm. The pH of the waters ranges from 6.7 to 8.4. The variation of Na+ion concentration and electrical conductivity with depth is similar to that of the chloride concentration. It is revealed that saline water exists at the depth of 10–35 m, and most likely the saline water was formed during the sediment deposition. Figure 8 indicates that the Quaternary marine aquifer system occurs at depth of 10–35 m, and the freshwater below this depth comes from either the Garang deltaic aquifer or the Damar Formation aquifer. From this result, we use the term saline clay for clay with saline porewater (chloride concentration of more than 1000 ppm), and freshwater clay for clay with fresh porewater.

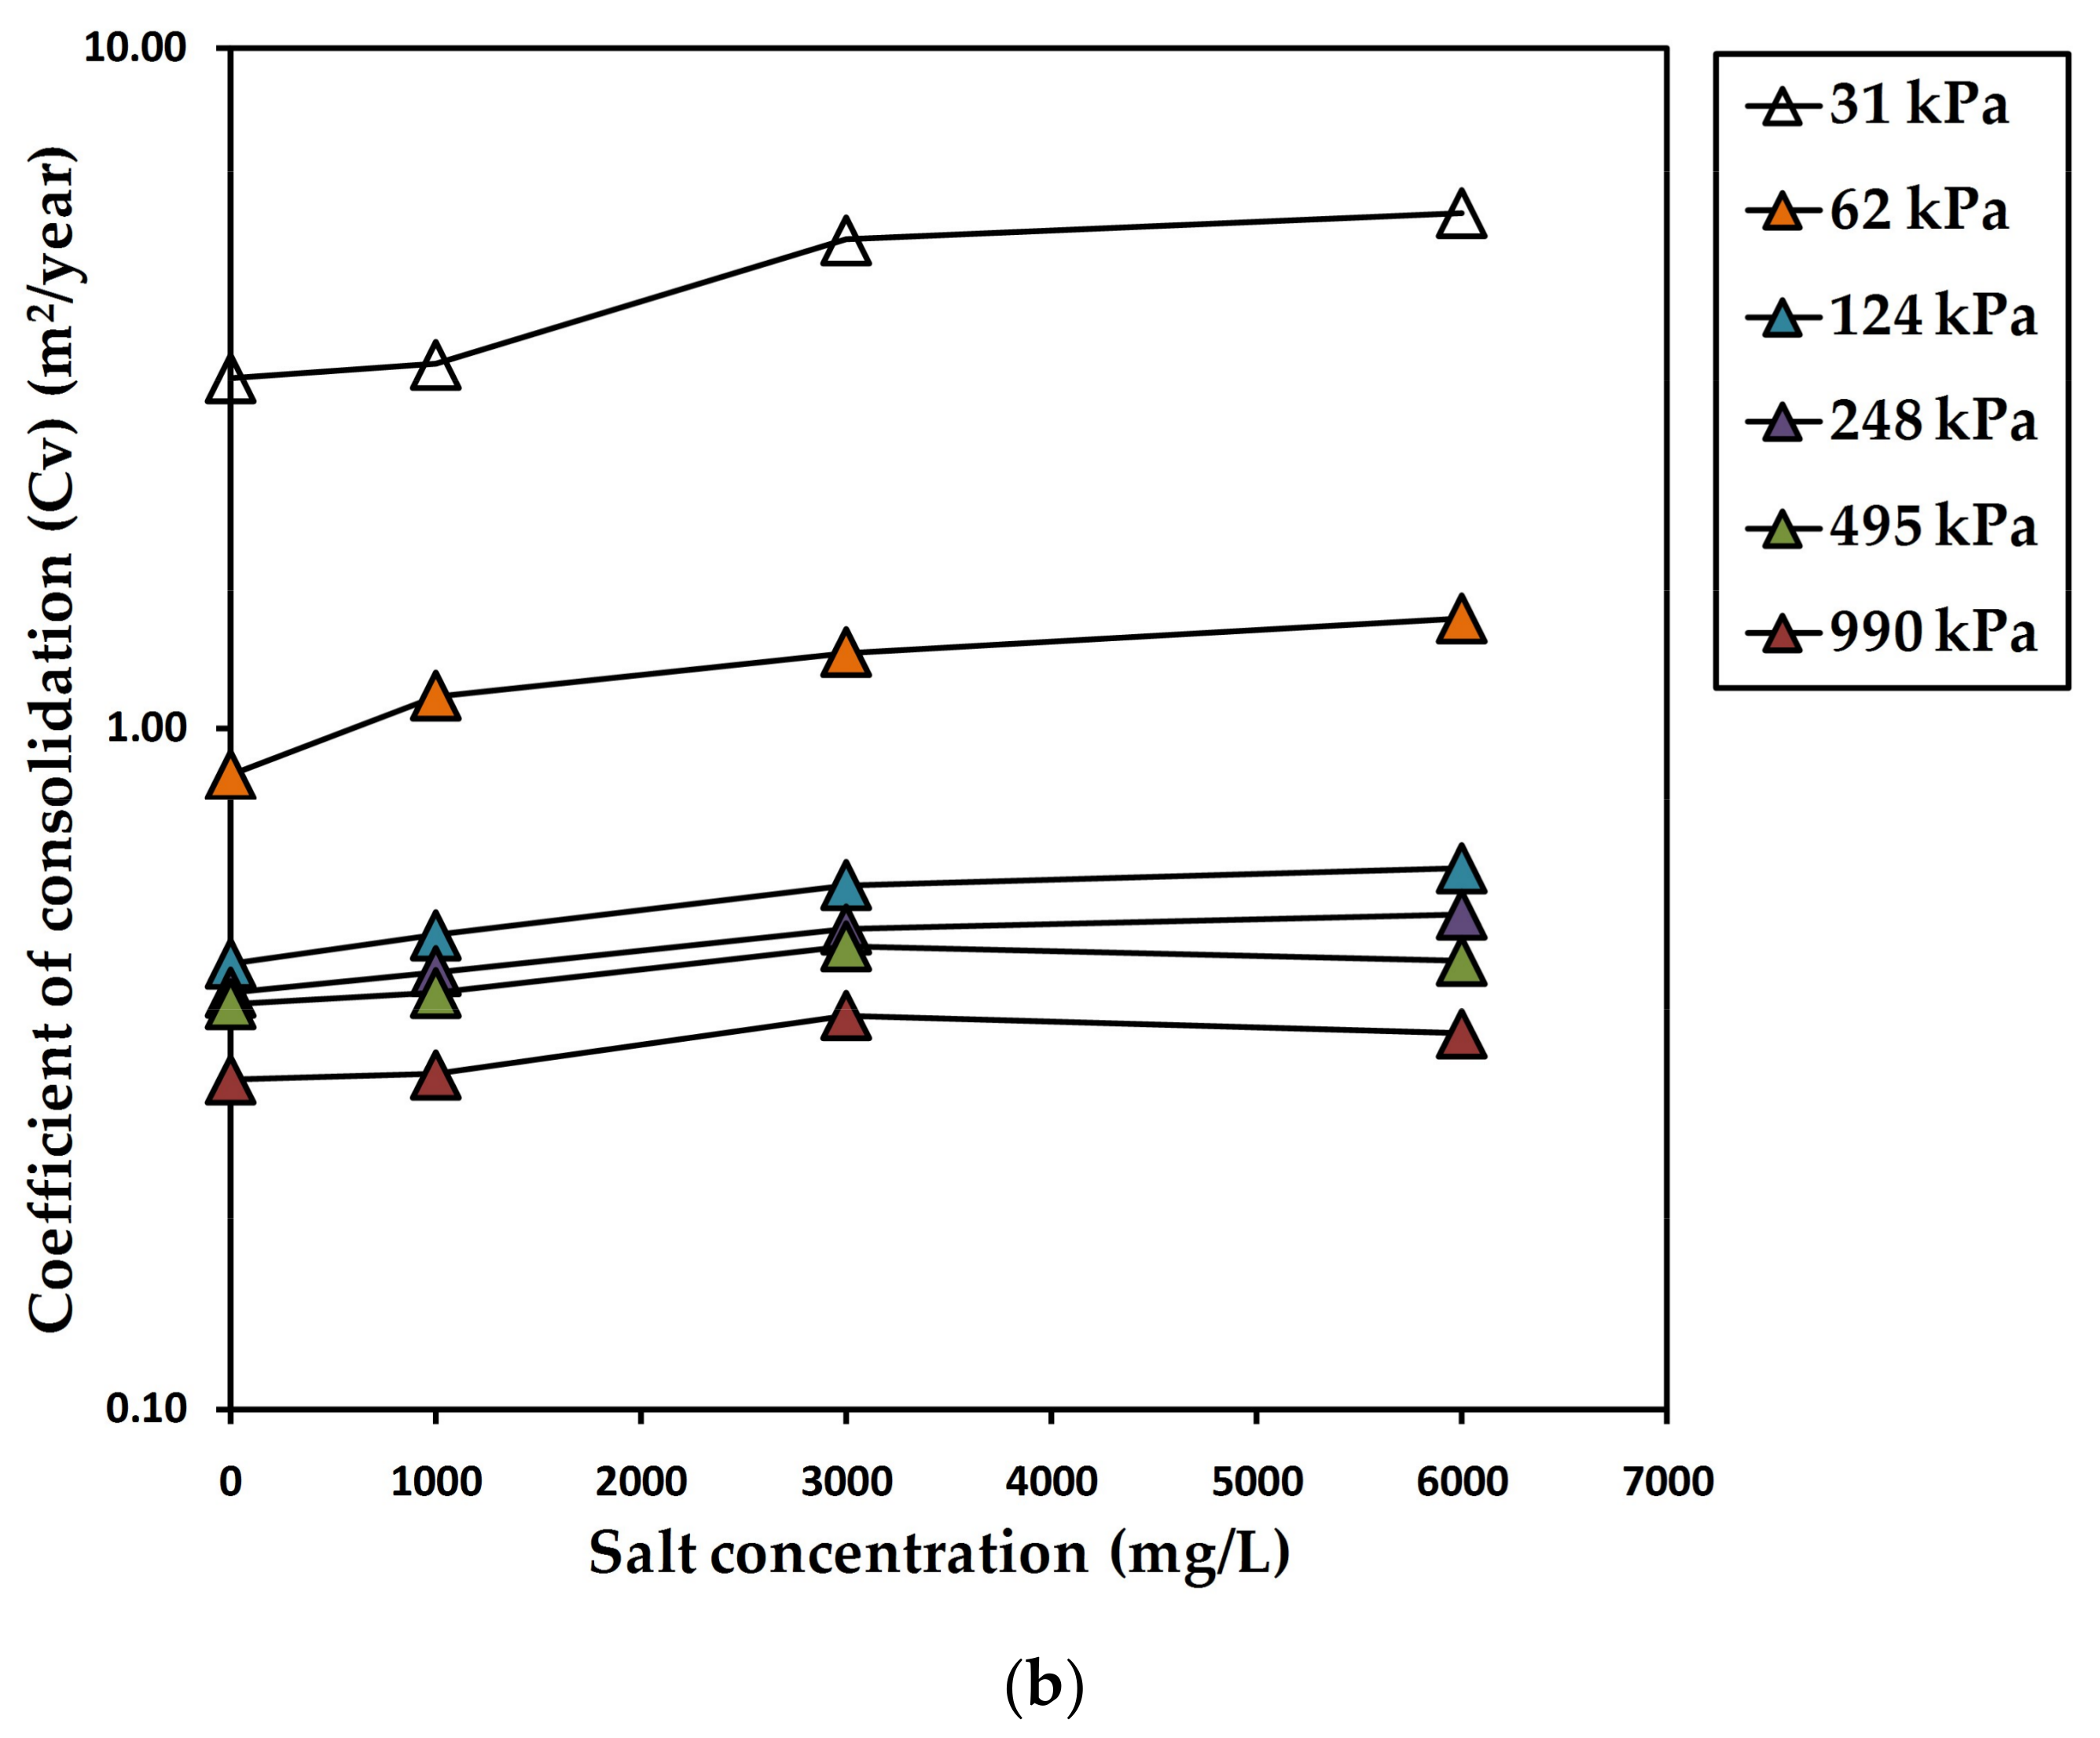
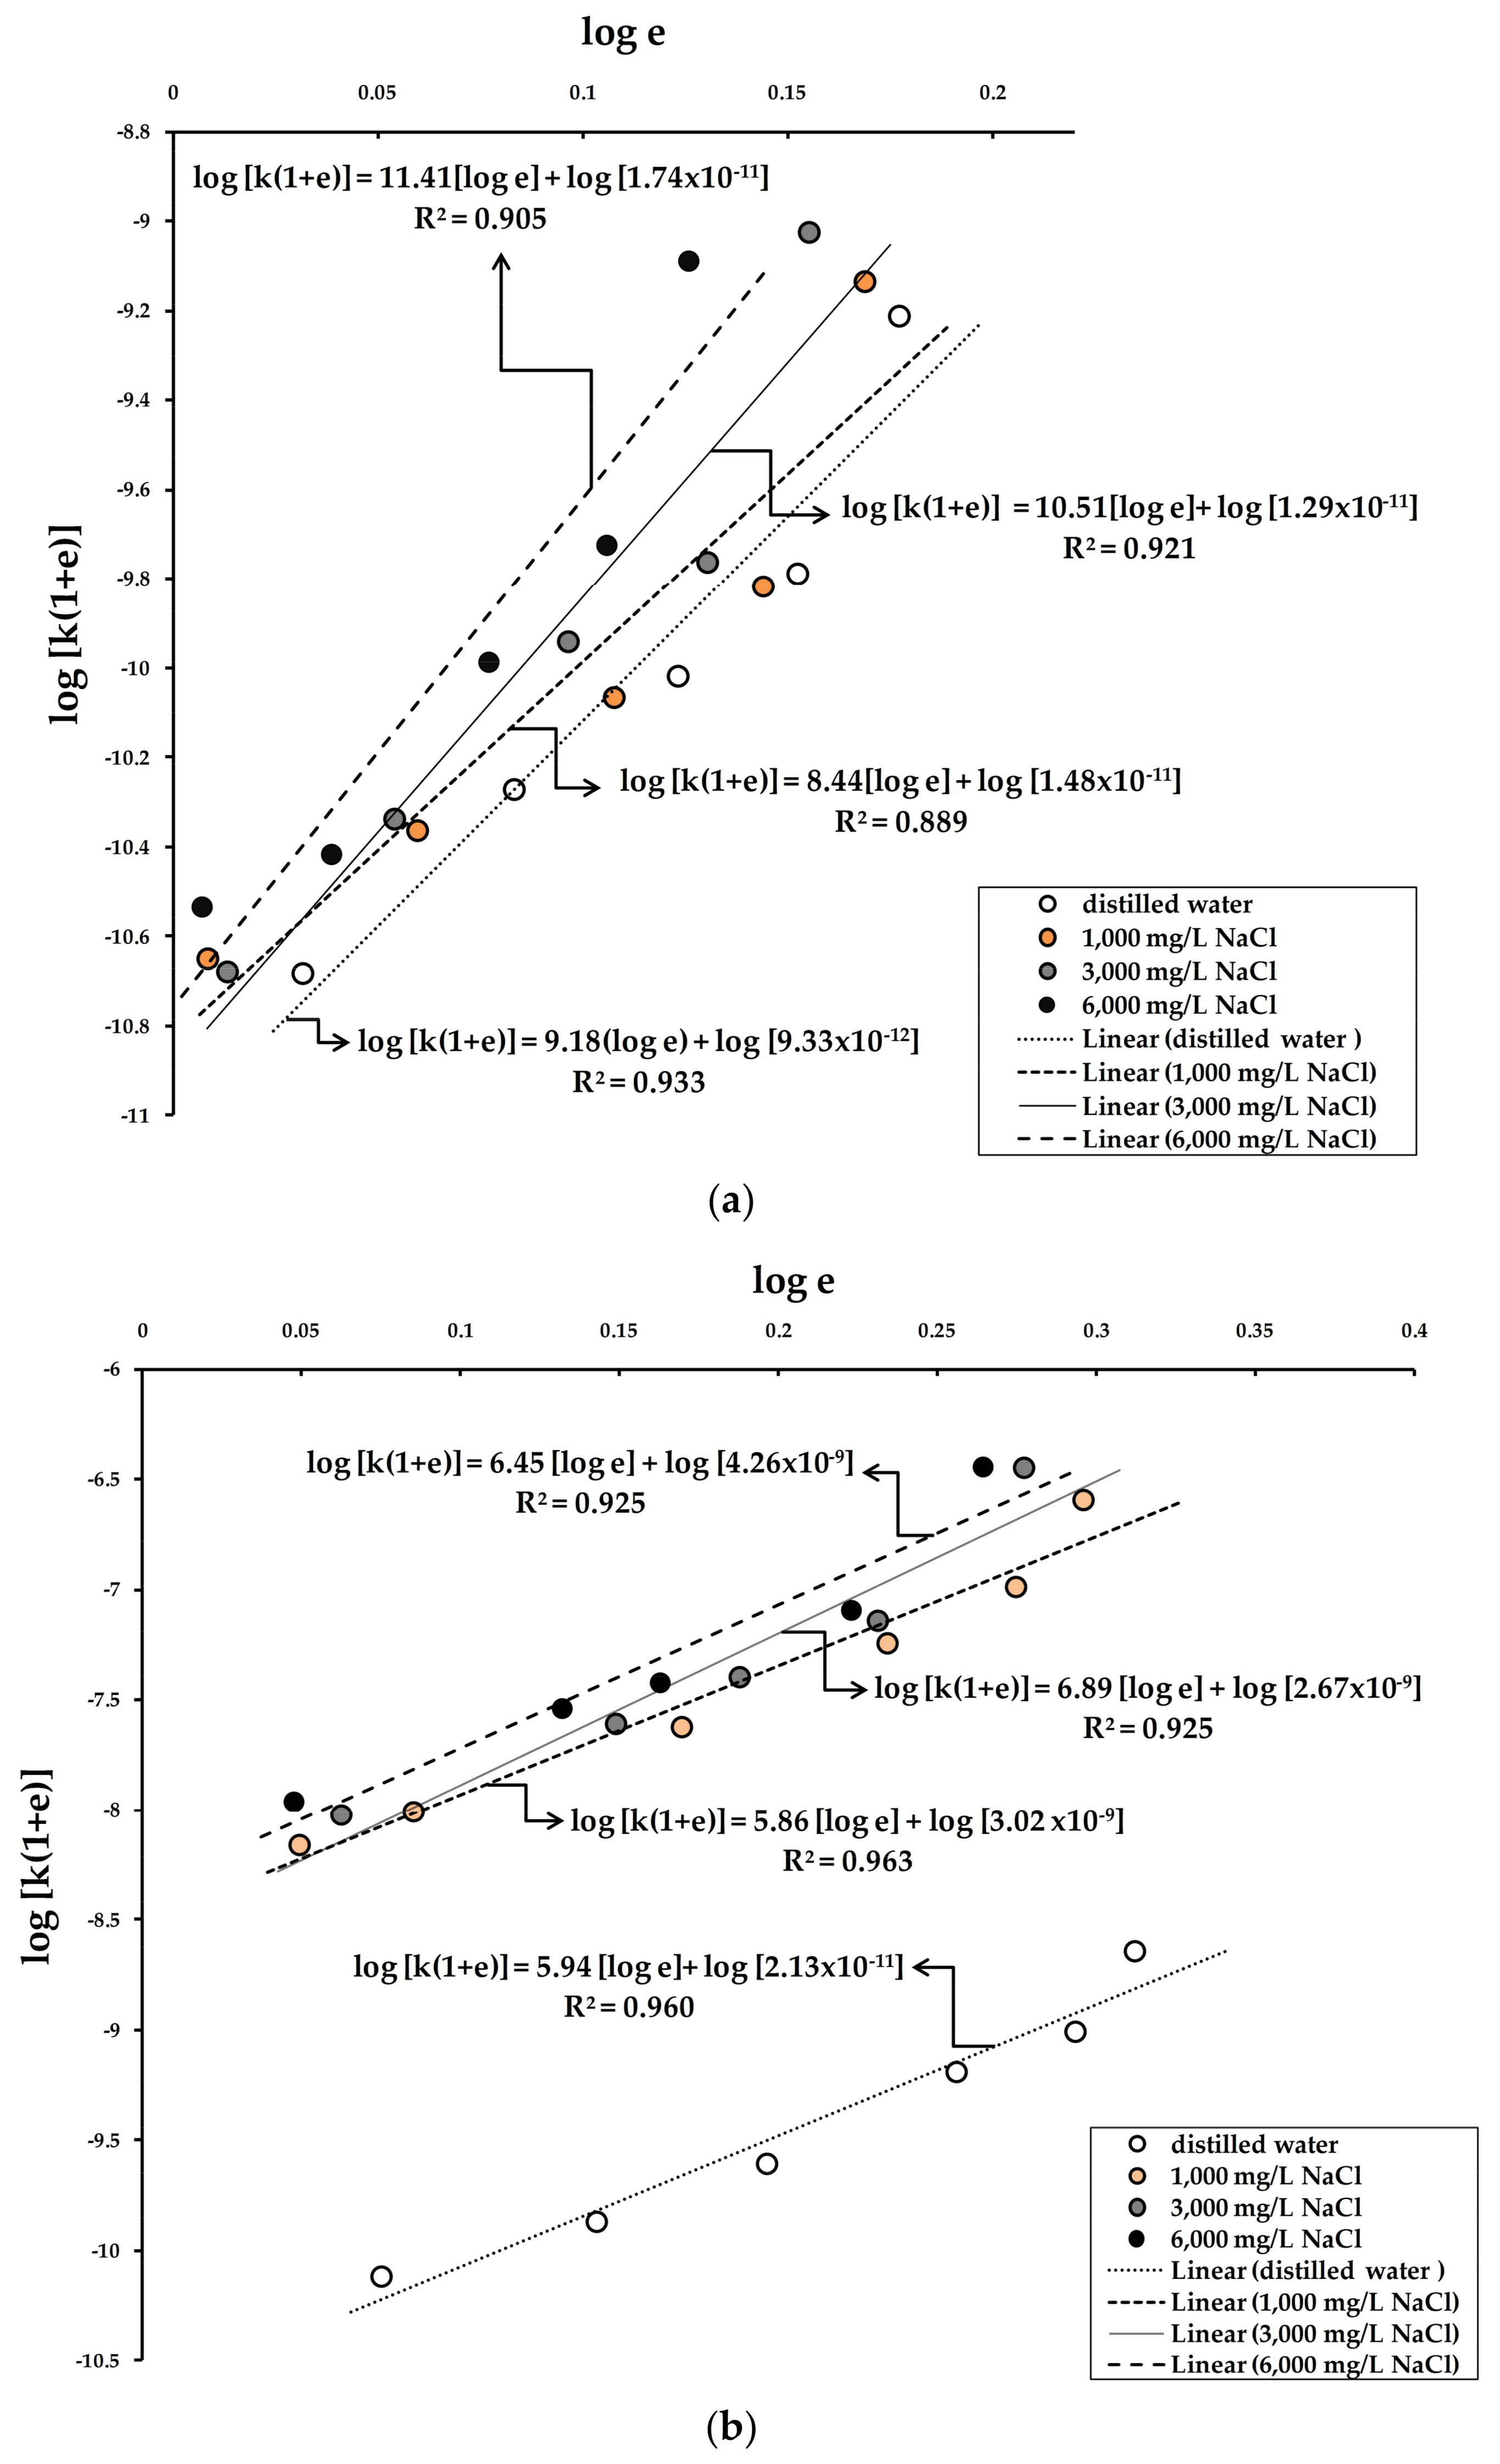
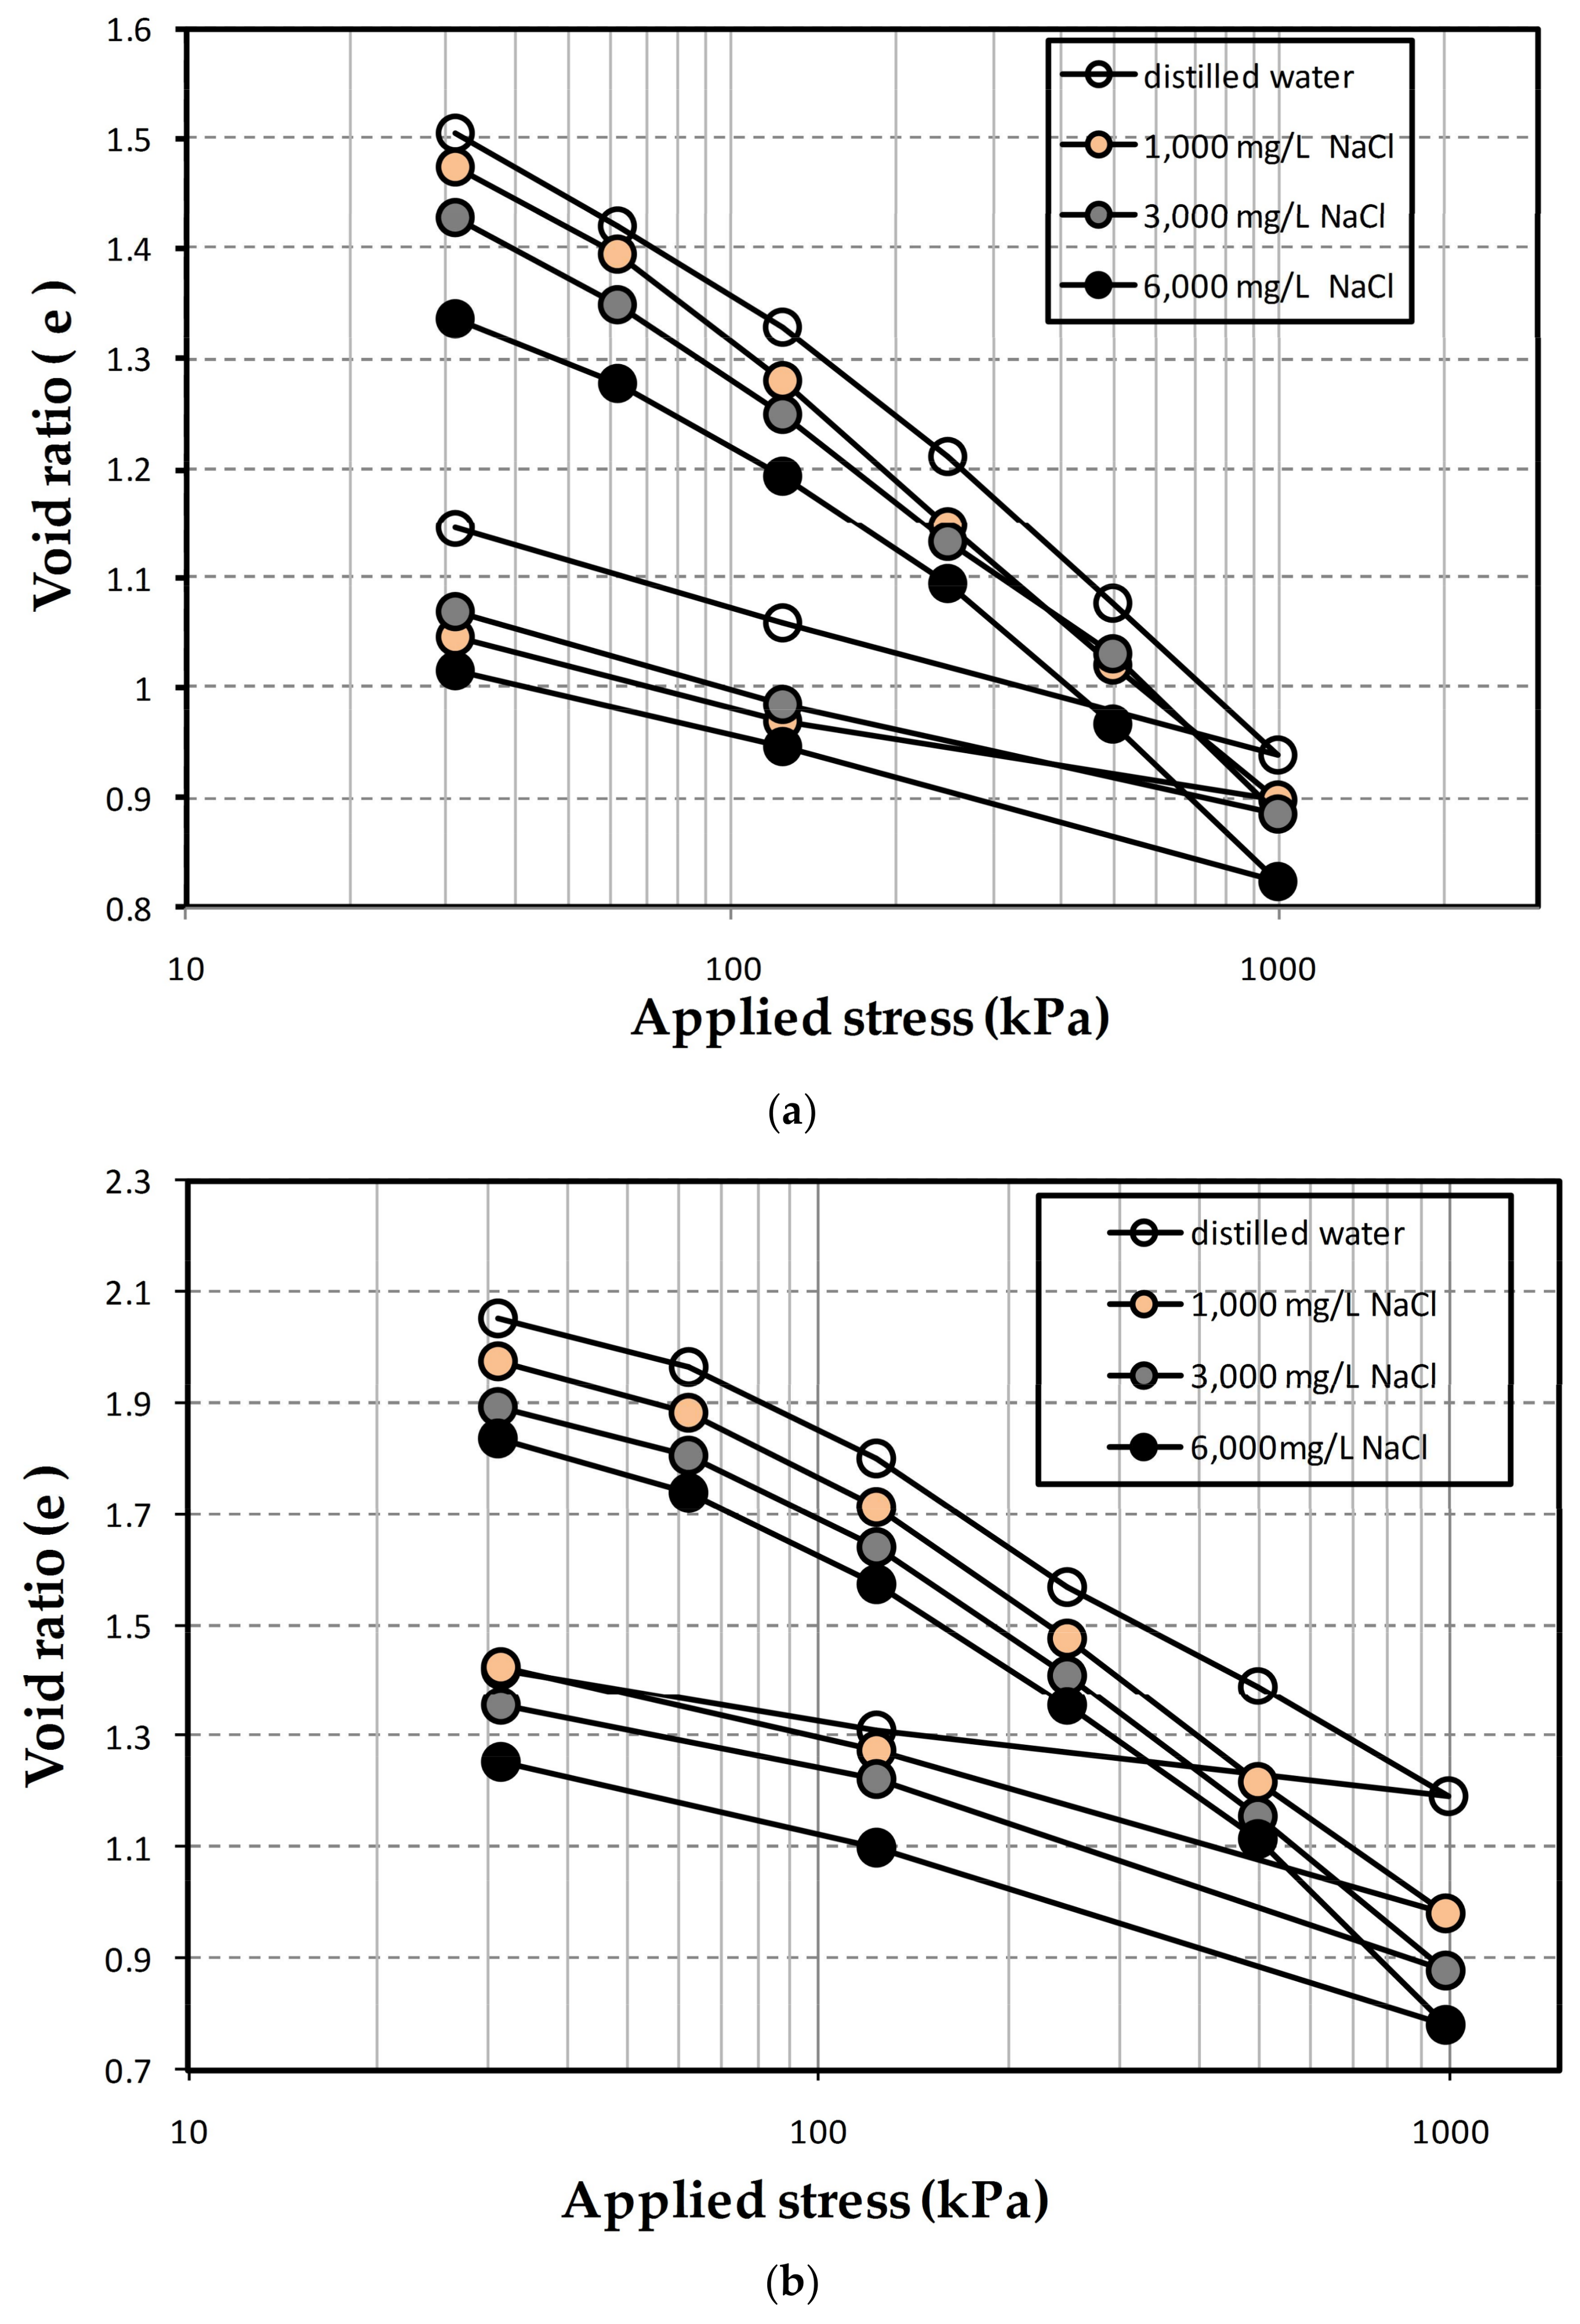
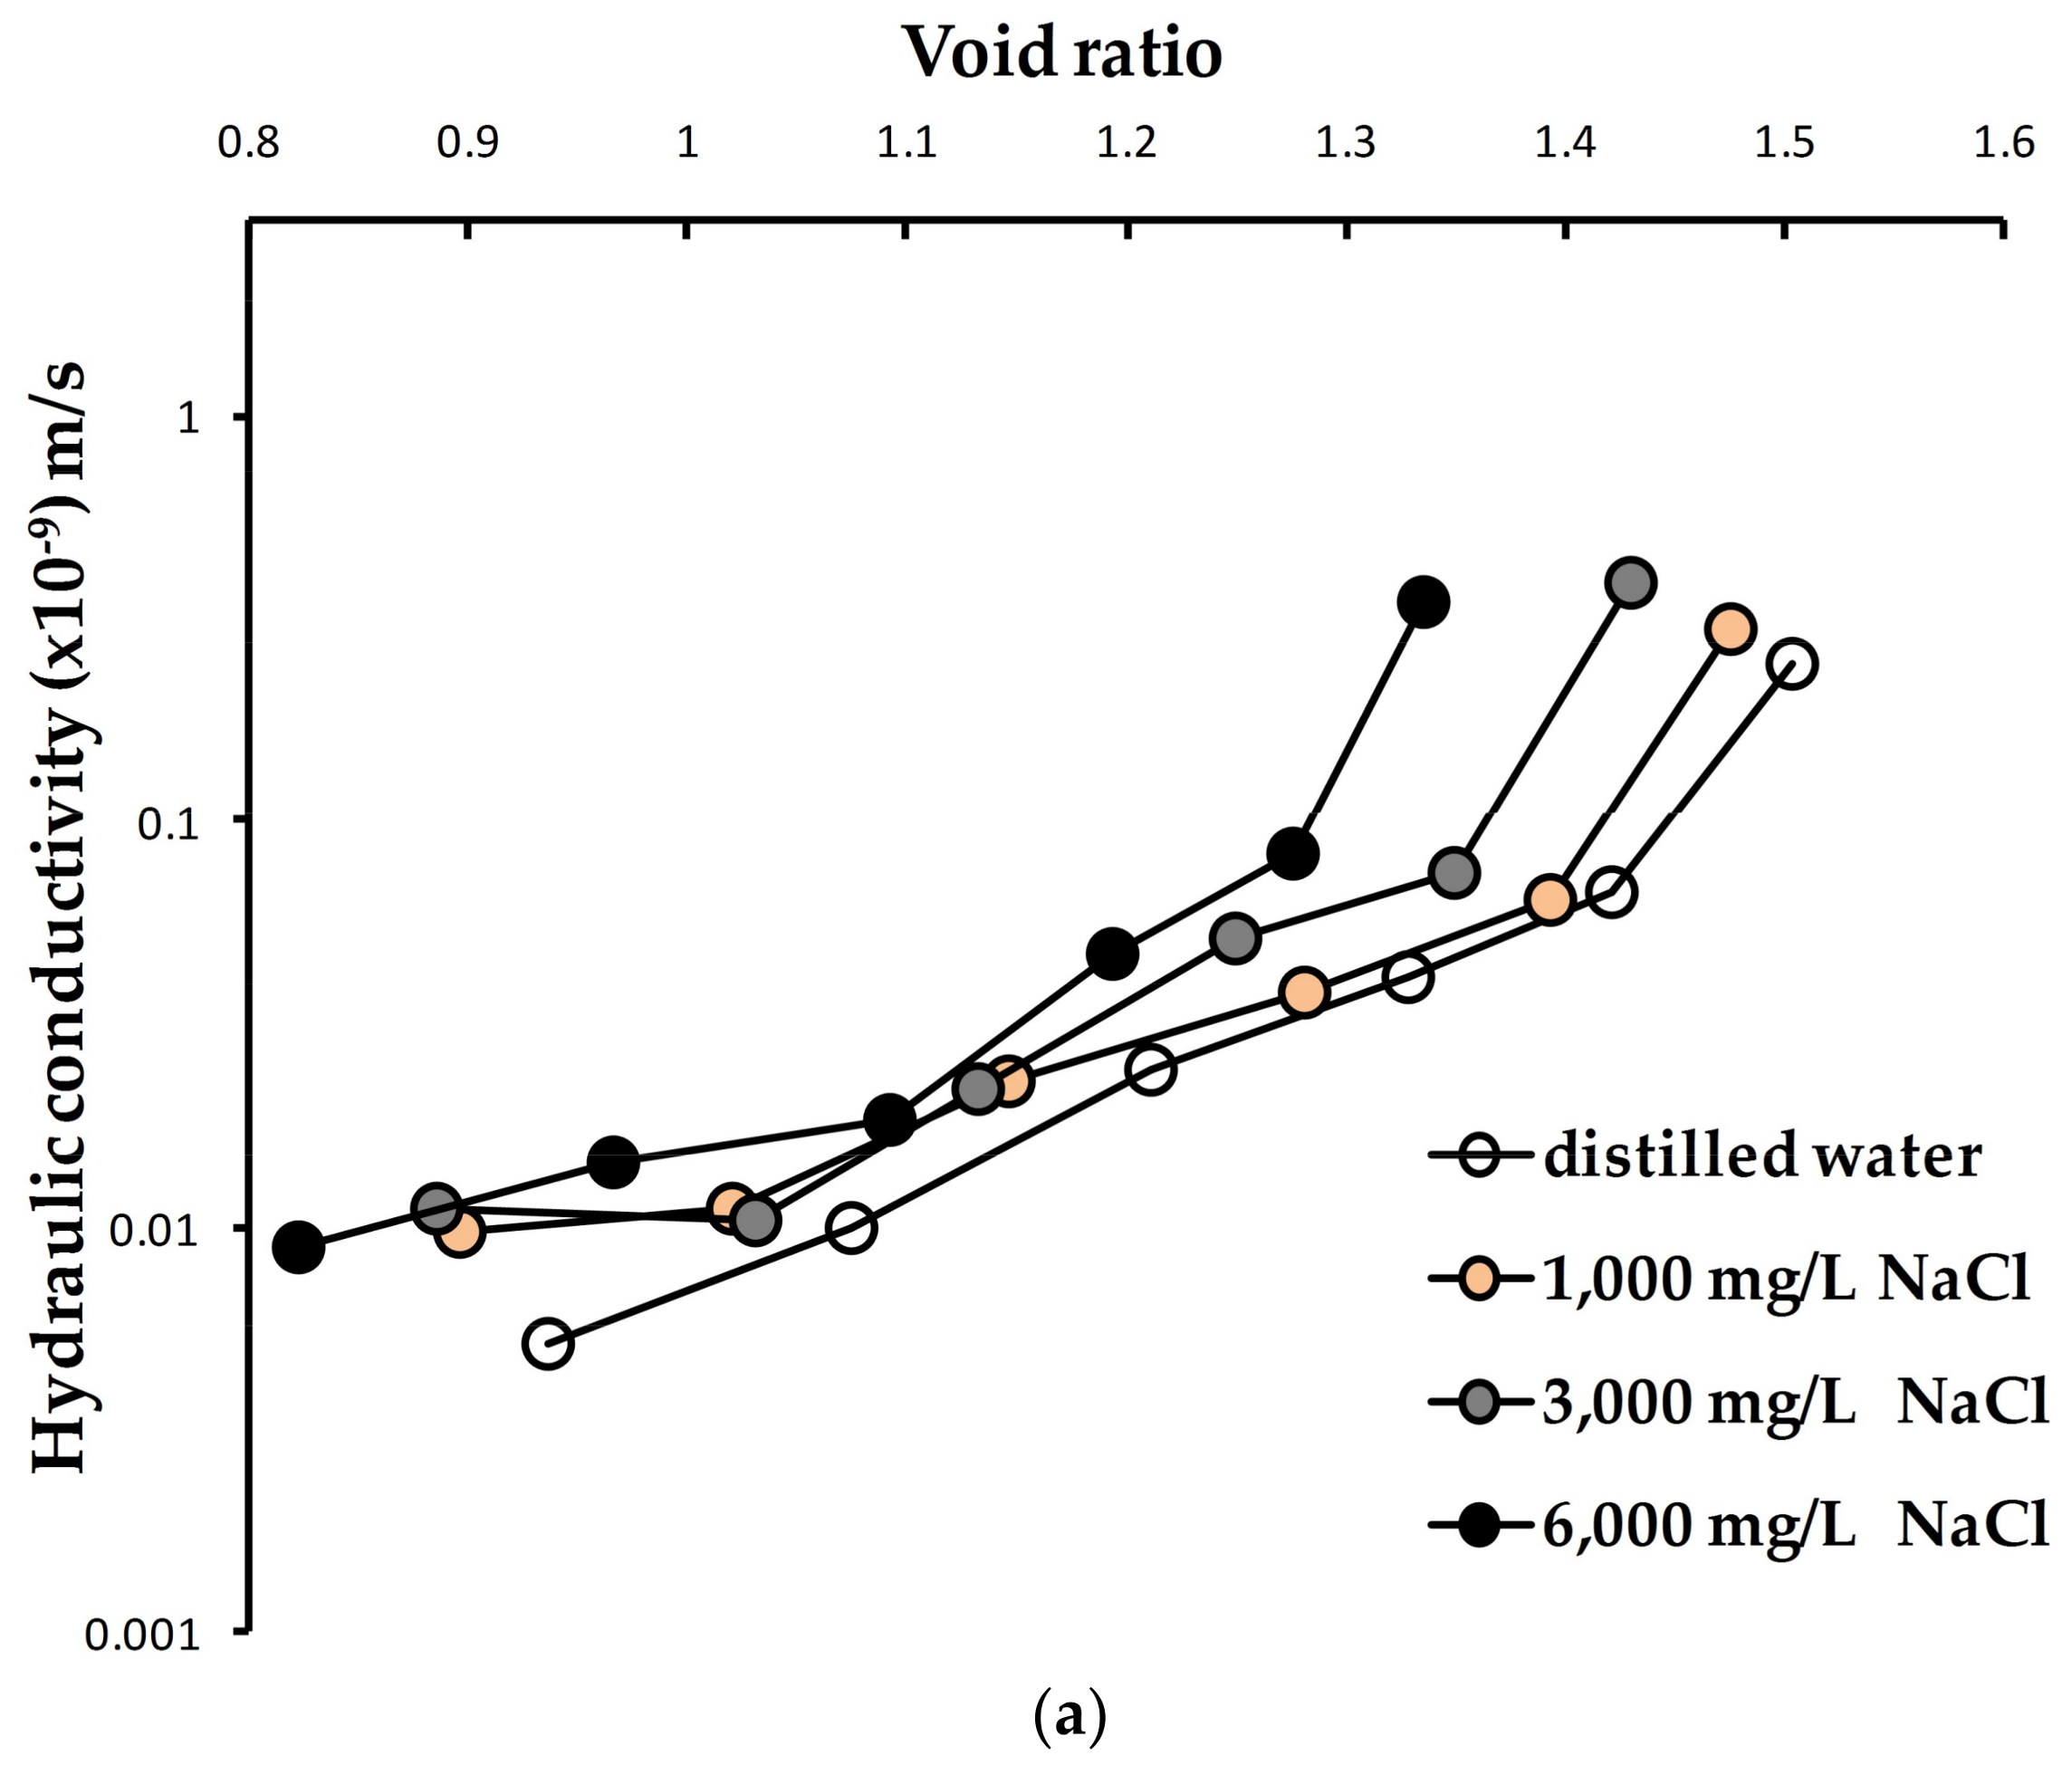
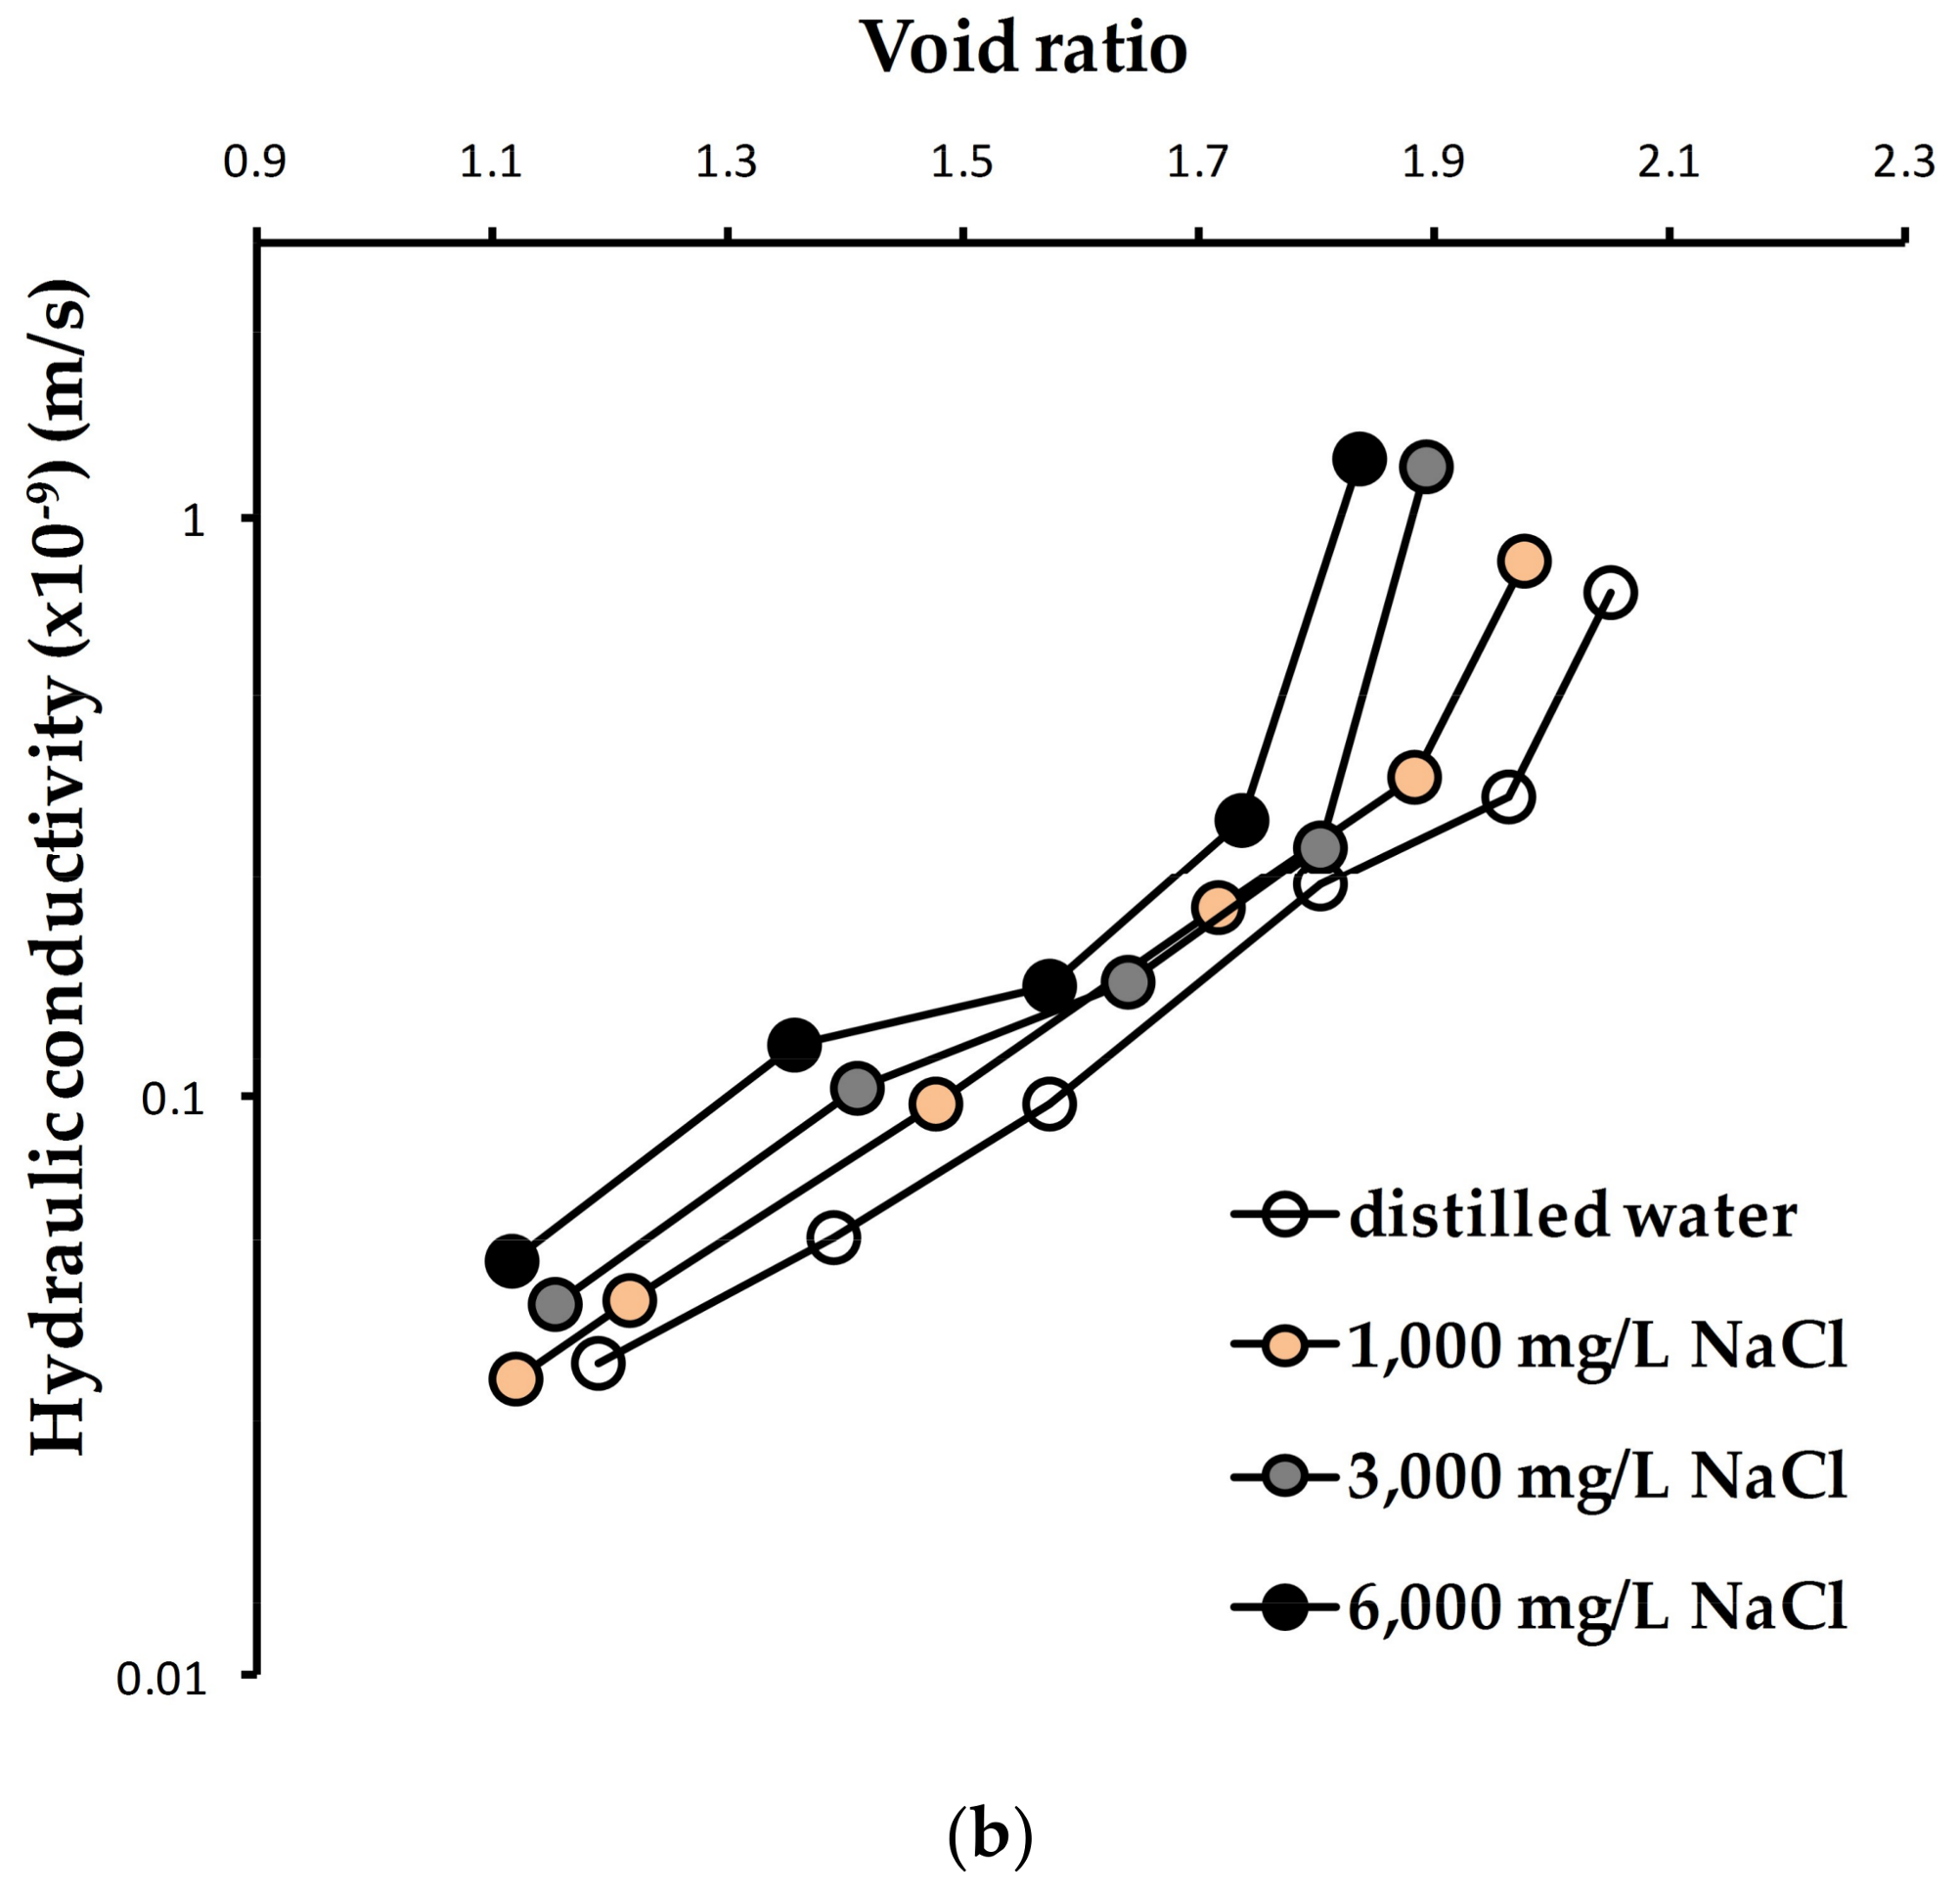
4.4. Compressibility of Semarang-Demak Clay

Consolidation tests (1-D) were performed for saline clay samples from Semarang City and Demak Regency. Compression curves for the Semarang-Demak clays under various salinity conditions (Figure 9) show that increasing the salt concentration in the porewater decreases the void ratio throughout the loading range. The effects of increasing salinity are thus noticeable even at the initial loading (30 kPa). The Semarang and Demak clays experience different changes in compressibility index and oedometer modulus as a result of increased salt concentration during loading, and different changes in the swelling index with unloading, as detailed in Table 2.
The average compression index (cc) for the Semarang-Demak clay (Table 2) shows a slight decreasing trend as the salt concentration increases. The decrease in the compression index is attributed to the reduction of the double-layer thickness as the pore fluid concentration increases. Swelling of the clay sample occurs during the unloading process, as indicated by the swelling index (cs). The physicochemical condition of the porewater affects the swelling behavior in terms of osmosis [53]. The intake of water that is held by the clay during unloading is the result of the osmotic gradient between the more concentrated pore fluid within the clay matrix and the less concentrated ambient porewater. The effect of salt concentration on swelling is more evident in saline water. The osmotic pressure difference for the saline water decreases as the concentration increases, and thus causes less swelling of the saline clay. The computed coefficient of consolidation (cv) and hydraulic conductivity (k) for various porewater salinities are shown in Figure 10 and Figure 11.
Figure 10 shows that during loading, the cv values increase as the concentration of NaCl solution increases. It can be seen that during loading of greater than 124 kPa, the rate of increase in cv diminishes. Figure 10 also shows that the cv value for the Demak clay is higher than that of the Semarang clay. The calculated hydraulic conductivity versus void ratio graphs for the Semarang and Demak clays are presented in Figure 11a,b, respectively.
Figure 11 shows that the hydraulic conductivity increases as the concentration of NaCl solution increases; at lower void ratios this increase is small. The pattern of increases in the coefficient of consolidation and hydraulic conductivity isthe result of reduced increases in salt concentration at certain stress levels and void ratios. The effect of double-layer water on the geomechanical properties of the clay depends on the mechanical stress and chemical concentration level [18]. Figure 6 and Figure 7 show that at higher stress levels (or lower void ratios) the increase rates of the coefficient of consolidation and the hydraulic conductivity are reduced. To observe the approximate change of cv and k due to the increase of salt concentration, average values of cv and K are calculated (Table 3).
Table 3 shows that the increase of salt concentration raises the average cv values from 17.0–42.0%, and the k values from 7.0–37.5%. The higher the salt concentration, the higher the hydraulic conductivity, which causes the compression rate (cv) to increase. Mathematically, a linear relationship exists between the logarithm of hydraulic conductivity (k) and the void ratio (e) for clays [54]; this is shown in Figure 12 for the Semarang-Demak clay. This relationship is useful to predict the change in hydraulic conductivity of the clay over increasing stress states (i.e., void ratio) at various groundwater salinity values. A higher change in hydraulic conductivity due to higher groundwater salinity is observed in Demak clay (Figure 12b), indicating higher activity of the clay.

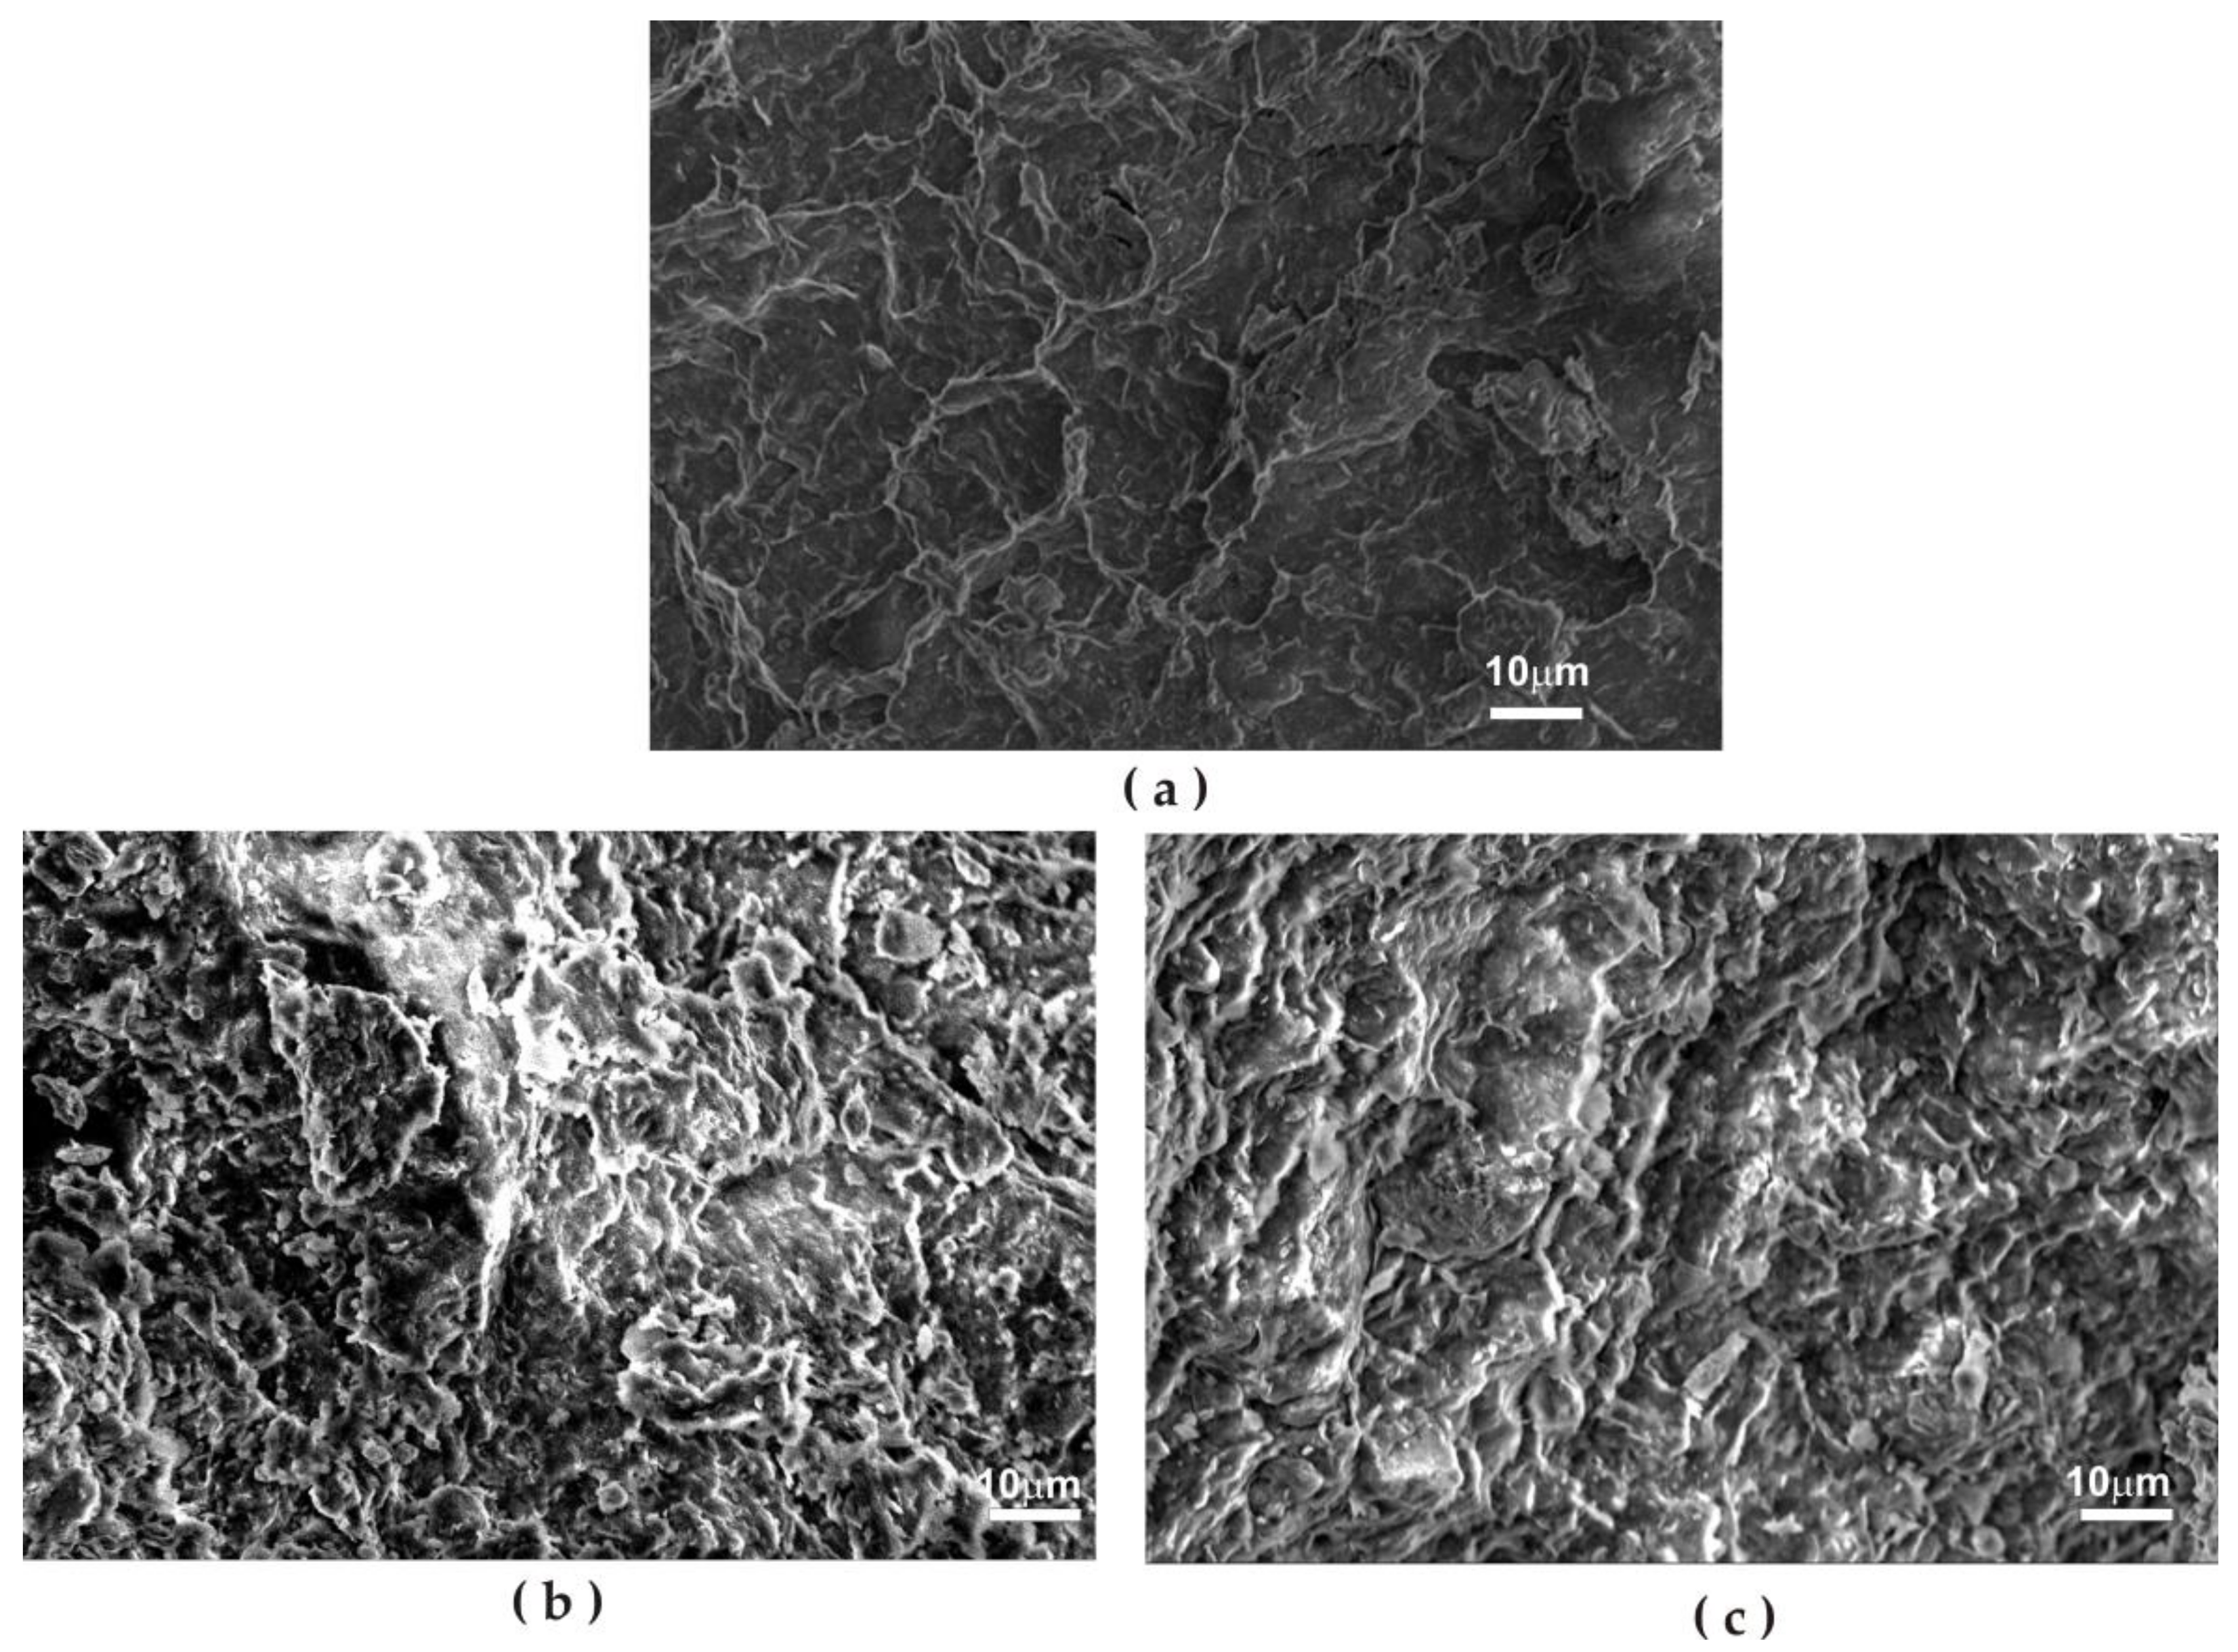
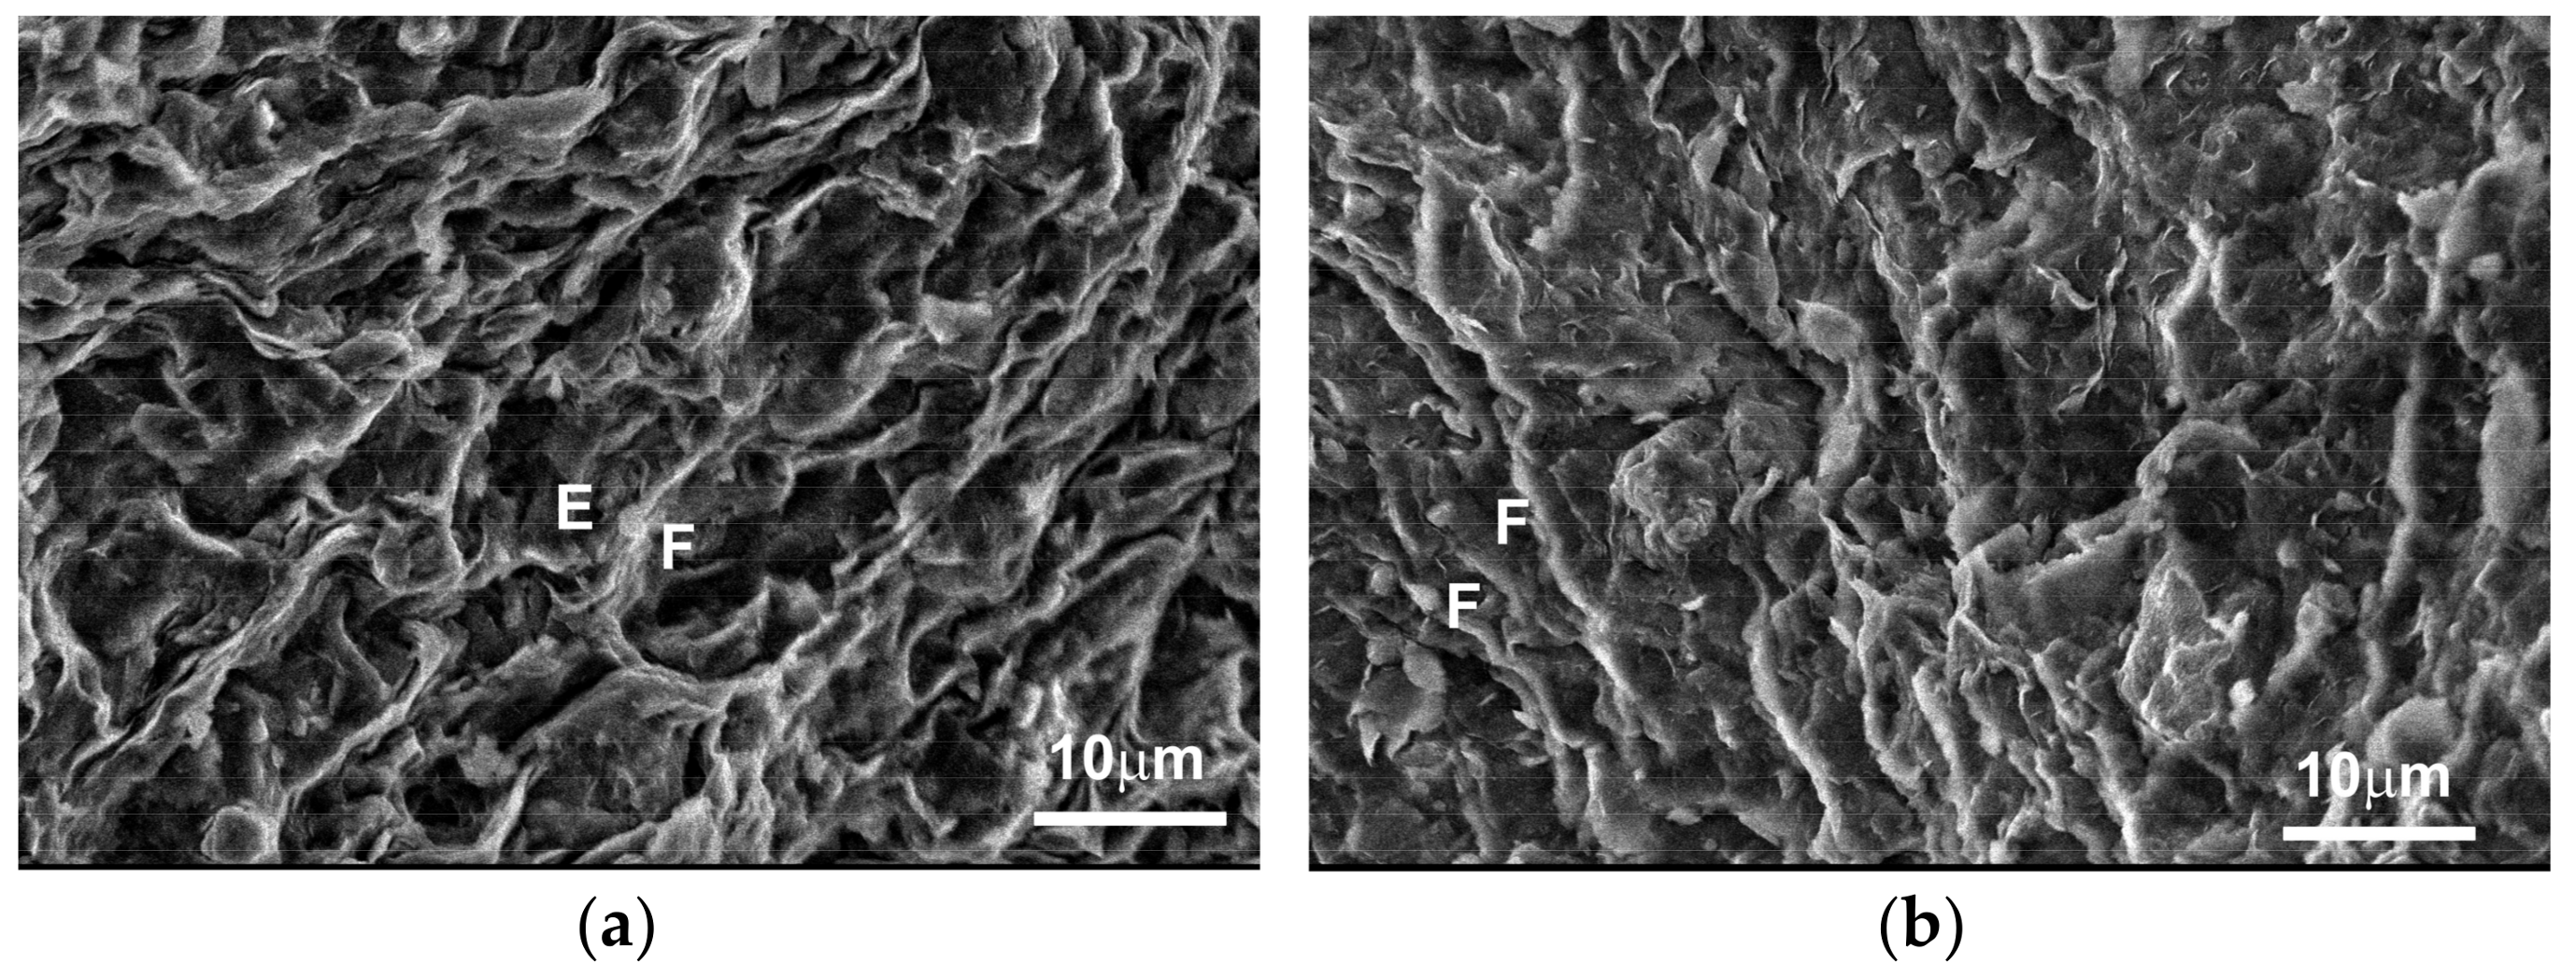
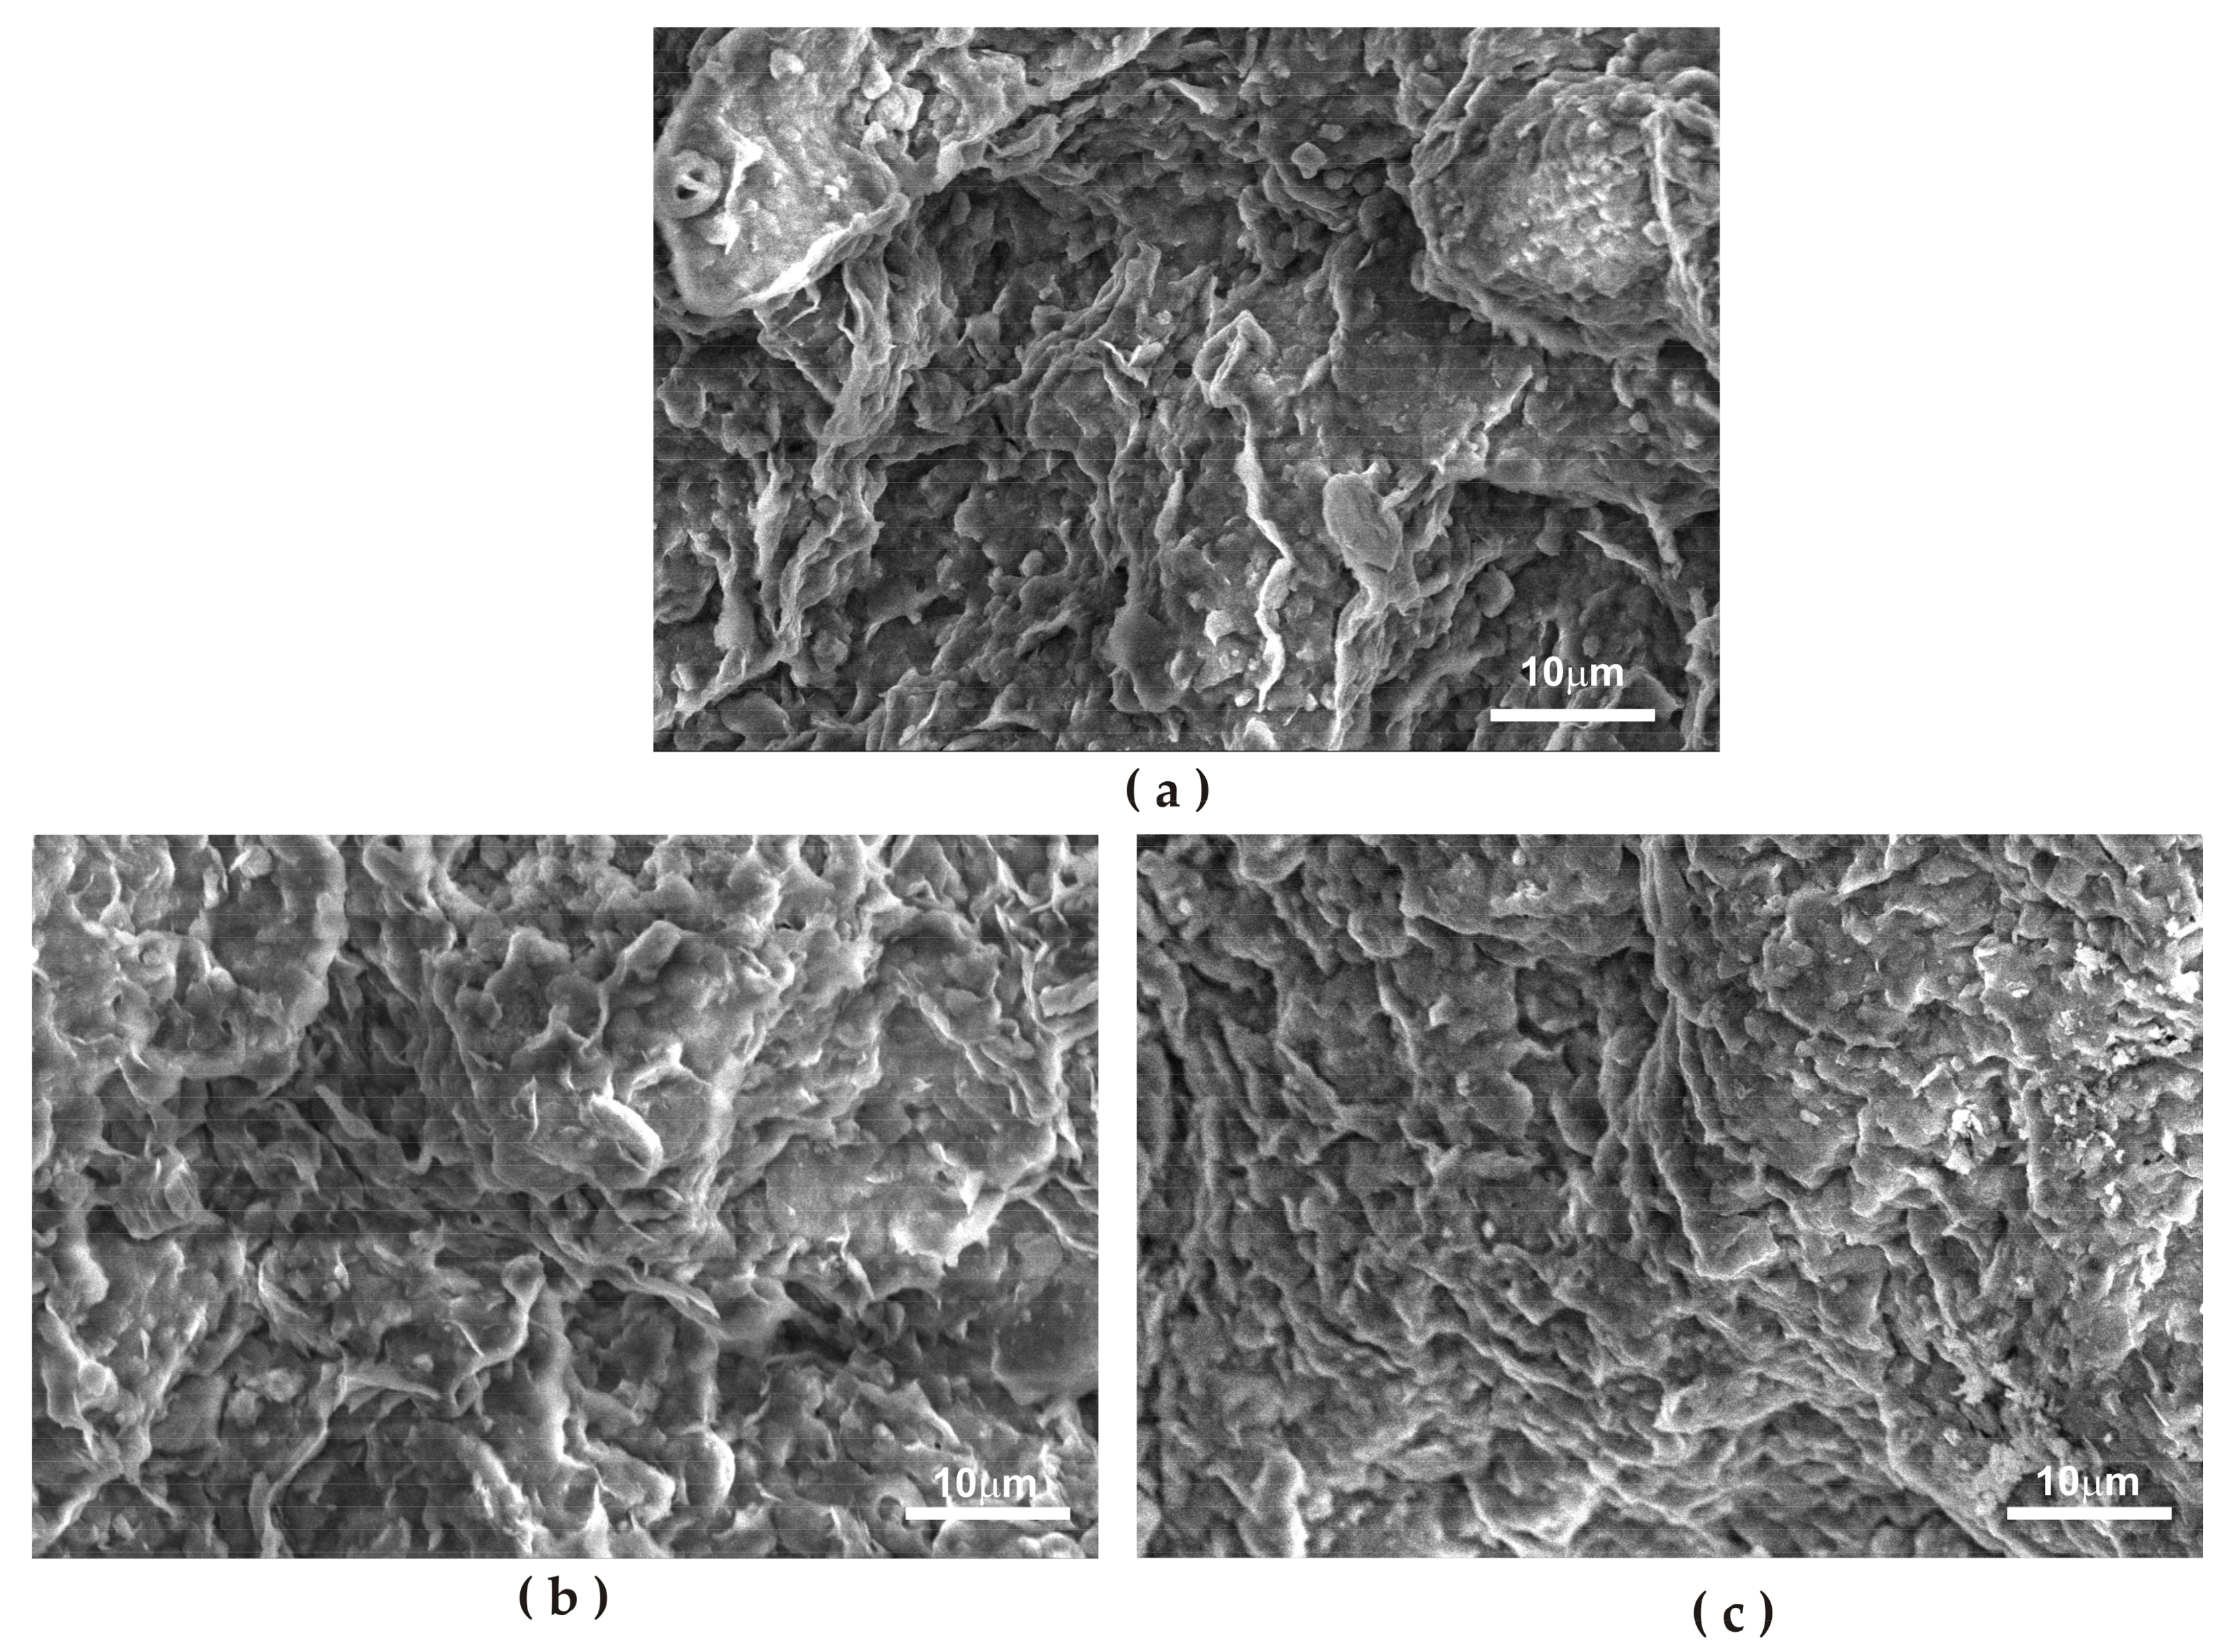
4.5. Fabric Analysis of Semarang-Demak Clay

Features observed in the Semarang-Demak clays show that two distinct fabrics of natural clay of fresh porewater and saline clay are present (Figure 13). Freshwater clay is dominated by edge-to-face (E-F) flocculation (Figure 13a) and the saline clay is dominated by dispersed parallel (face to face) (F-F) alignment with some edge-to-edge (E-E) flocculation (Figure 13b).
The change in porewater salinity affected the initial clay fabrics for both freshwater and saline clays, as shown in Figure 14 and Figure 15. The initial clay fabrics changed because of porewater replacement. Alteration of porewater chemistry changes the electrical interparticle forces between clay and the double-layer water, and results in fabric change [55]. Figure 14 and Figure 15 also show that increasing salinity causes changes to the clay fabric that result in a more dispersed parallel fabric. The parallel fabric facilitates faster porewater movement; consequently, the hydraulic conductivity increases as salinity increases. This observation is supported by the hydraulic conductivity measurements (Figure 11 and Table 3). The test results show that the Semarang-Demak aquitard is dominated by saturated high plasticity clay of medium to very high activity, containing considerable amounts of smectite (Table 2). The compressive behavior of such clay is governed by the state of the adsorbed double-layer water. The introduction of saline porewater immediately reduces the void ratio, and consequently decreases the compression index (cc) and swelling index (cs), and increases the clay stiffness (Eodo). Similar behavior is found in pure smectite soil [22,23] and in the Lianyugang natural clay [24]. The average change in the compression index (cc) for smectite soil is 77% [22], which is comparable to that of the Semarang-Demak clay (76–82%). Saline clay has a higher coefficient of consolidation (cv) than freshwater clay, which indicates that the saline clay compresses faster than freshwater clay. The increase in the consolidation rate is 1.5 to 1.7 times for the Semarang-Demak clay. In comparison, the increased rate of consolidation is 2.5–3 times for smectite soil and Lianyugang clay [23,24]. The increase in the consolidation rate can be explained by the increase in the hydraulic conductivity (k) caused by the clay fabric change. The observed fabric change for the Semarang-Demak clay is similar to that of pure Ponza bentonite when exposed to saline fluids [20].
The test results show that the effect of saline fluid on the compressibility behavior of Semarang-Demak clay is similar to that of pure smectite soil. The natural clay of Boom [21] is not affected by salinity changes because of its low smectite content (<20%). The Semarang-Demak clay (30–50% smectite) and Lianyugang clay (44–57% illite/smectite) [24] have a high smectite content, and therefore tend to react similarly to the pure smectite soil when affected by salinity. The influence in porewater salinity increases with the smectite content. The Demak clay has a higher smectite content, and higher cv and k values, and shows a higher rate of change with increasing porewater salinity.
In the case of land subsidence in the study area, the saline clay (at 10–35 m depth) compresses faster due to both overburden load and increase of effective stress from the lowering of piezometric pressure. Excess pore pressure developed on the saline clay is dissipated faster due to the higher consolidation rate (cv) and hydraulic conductivity (k), which is confirmed by the parallel alignment of the clay fabric thatease the groundwater flow movement. The parallel clay fabric is also mechanically more favourable to compression, showing the saline clay is readily compressed. These findings help to explain the mechanism of land subsidence from the physical perspective. The compression parameters of saline clay are useful inputs for land subsidence numerical models.

5. Conclusions

The effect of groundwater salinity on the compressibility characteristics of the Semarang-Demak aquitard was examined based on physical analysis. The aquitard of the study area consists of high plasticity clay with medium to high activity. The groundwater salinity profile of the Semarang-Demak plain shows the existence of saline water at 10–35 m depth, and the clay aquitard predominantly consists of smectite. Analysis of the effect of groundwater salinity to compressibility shows that the increase in salinity decreases the compression and swelling indexes, and increases the stiffness of clay due to the reduction of double layer water by physicochemical reaction. The increase in salinity increases the average consolidation rate and hydraulic conductivity up to 42% and 37.5%, respectively. The increase in groundwater salinity modified the interconnectivity of pores by changing the clay fabric into parallel alignments, facilitating faster porewater dissipation. The dissipation of porewater is faster in saline clay than in freshwater clay as a result of improved hydraulic conductivity, and thus consolidation is achieved more quickly (i.e., a faster rate of subsidence). These findings are useful to understand the mechanism of the fast-subsiding coastal plains of North Java and can be used for numerical modeling input.

Acknowledgments

Borehole cores of Semarang-Demak plain were provided by the Research Center for Geotechnology, the Indonesian Institute of Sciences (LIPI) and the Center for Groundwater Resource and Environmental Geology, Indonesian Geological Agency. The support from a P3MI grant (Institut Teknologi Bandung) for field and laboratory work is gratefully acknowledged.

Author Contributions

Dwi Sarah performed this study and wrote this paper in the framework of her PhD project at Institut Teknologi Bandung. Lambok M. Hutasoit, Robert M. Delinom and Imam A. Sadisun provided guidance and support throughout the study and revised the manuscript. Taufiq Wirabuana and Dwi Sarah carried out the field work in Semarang-Demak, and he performed the index property tests.

Conflicts of Interest

The authors declare no conflict of interest.

References

  1. Syvitski, J.P.M.; Kettner, A.J.; Overeem, I.; Hutton, E.W.H.; Hannon, M.T.; Brakenridge, G.R.; Day, J.; Vörösmarty, C.; Saito, Y.; Giosan, L.; et al. Sinking Deltas due to Human Activities. Nat. Geosci. 2009, 2, 681–686. [Google Scholar] [CrossRef]
  2. Galloway, D.; Jones, D.R.; Ingebritsen, S.E. Land Subsidence in the United States; US Geological Survey: Reston, VA, USA, 1999.
  3. Barends, F.B.; Brouwer, F.J.; Schröder, F.H. Land Subsidence: Natural Causes, Measuring Techniques, the Groningen Gasfields. In Proceedings of the Fifth International Symposium on Land Subsidence, The Hague, The Netherlands, 16–20 October 1995. [Google Scholar]
  4. Xu, Y.-S.; Shen, S.-L.; Ren, D.-J.; Wu, H.-N. Analysis of Factors in Land Subsidence in Shanghai: A View Based on a Strategic Environmental Assessment. Sustainability 2016, 8, 573. [Google Scholar] [CrossRef]
  5. Phi, T.H.; Strokova, L.A. Prediction Maps of Land Subsidence Caused by Groundwater Exploitation in Hanoi, Vietnam. Resour. Technol. 2015, 1, 80–89. [Google Scholar] [CrossRef]
  6. Phien-Wej, N.; Giao, P.H.; Nutalaya, P. Land Subsidence in Bangkok, Thailand. Eng. Geol. 2006, 82, 187–201. [Google Scholar] [CrossRef]
  7. Erban, L.E.; Gorelick, S.M.; Zebker, H.A. Groundwater Extraction, Land Subsidence, and Sea-Level Rise in the Mekong Delta, Vietnam. Environ. Res. Lett. 2014, 9. [Google Scholar] [CrossRef]
  8. Abidin, H.Z.; Andreas, H.; Gumilar, I.; Gamal, M. Land Subsidence and Urban Development in Jakarta (Indonesia) Land Subsidence and Urban Development in Jakarta (Indonesia). In Proceedings of the 7th FIG Regional Conference, Spatial Data Serving People: Land Governance and the Environment, Hanoi, Vietnam, 19–22 October 2009. [Google Scholar]
  9. Abidin, H.Z.; Andreas, H.; Gumilar, I.; Sidiq, T.P.; Fukuda, Y. Land Subsidence in Coastal City of Semarang (Indonesia): Characteristics, Impacts and Causes. Geomat. Nat. Hazards Risk 2013, 4, 226–240. [Google Scholar] [CrossRef]
  10. Chaussard, E.; Amelung, F.; Abidin, H.; Hong, S.-H. Sinking Cities in Indonesia: ALOS PALSAR Detects Rapid Subsidence due to Groundwater and Gas Extraction. Remote Sens. Environ. 2013, 128, 150–161. [Google Scholar] [CrossRef]
  11. Aditiya, A.; Takeuchi, W.; Aoki, Y. Land Subsidence Monitoring by InSAR Time Series Technique Derived from ALOS-2 PALSAR-2 over Surabaya City, Indonesia. IOP Conf. Ser. Earth Environ. Sci. 2017, 98. [Google Scholar] [CrossRef]
  12. Bakr, M. Influence of Groundwater Management on Land Subsidence in Deltas. Water Resour. Manag. 2015, 29, 1541–1555. [Google Scholar] [CrossRef]
  13. Shen, S.L.; Ma, L.; Xu, Y.S.; Yin, Z.Y. Interpretation of Increased Deformation Rate in Aquifer IV due to Groundwater Pumping in Shanghai. Can. Geotech. J. 2013, 50, 1129–1142. [Google Scholar] [CrossRef]
  14. Xu, Y.S.; Yuan, Y.; Shen, S.L.; Yin, Z.Y.; Wu, H.N.; Ma, L. Investigation into Subsidence Hazards due to Groundwater Pumping from Aquifer II in Changzhou, China. Nat. Hazards 2015, 78, 281–296. [Google Scholar] [CrossRef]
  15. Gambolati, G.; Teatini, P.; Tomasi, L.; Gonella, M. Coastline Regression of the Romagna Region, Italy, due to Natural and Anthropogenic Land Subsidence and Sea Level Rise. Water Resour. Res. 1999, 35, 163–184. [Google Scholar] [CrossRef]
  16. Teatini, P.; Tosi, L.; Strozzi, T. Quantitative Evidence That Compaction of Holocene Sediments Drives the Present Land Subsidence of the Po Delta, Italy. J. Geophys. Res. Solid Earth 2011, 116, 1–10. [Google Scholar] [CrossRef]
  17. Holzer, T.L.; Galloway, D.L. Impacts of Land Subsidence Caused by Withdrawal of Underground Fluids in the United States. Rev. Eng. Geol. 2005, 16, 87–99. [Google Scholar] [CrossRef]
  18. Schmitz, R.M. Can the Diffuse Double Layer Theory Describe Changes in Hydraulic Conductivity of Compacted Clays? Geotech. Geol. Eng. 2006, 24, 1835–1844. [Google Scholar] [CrossRef]
  19. Meade, R.H. Rearrangement of Particles During the Compaction of Clayey Sediments—Review; Mechanics of Aquifer Systems; Geological Survey Professional Paper 497-B; United States Government Printing Office: Washington, DC, USA, 1964.
  20. Di Maio, C. Exposure of Bentonite to Salt solution:Osmotic and Mechanical Effects. Geotechnique 1996, 46, 695–707. [Google Scholar] [CrossRef]
  21. Deng, Y.; Cui, Y.; Tang, A.M.; Nguyen, X.; Deng, Y.; Cui, Y.; Tang, A.M.; Nguyen, X.; Li, X. Investigating the Pore-Water Chemistry Effects on the Volume Change Behaviour of Boom Clay. Phys. Chem. Earth Elsevier 2011, 36, 1905–1912. [Google Scholar] [CrossRef] [Green Version]
  22. Tiwari, B.; Ajmera, B. Effects of Saline Fluid on Compressibility of Clay Minerals. Environ. Geotech. 2014, 1, 108–120. [Google Scholar] [CrossRef]
  23. Dutta, J.; Mishra, A.K. Applied Clay Science Consolidation Behaviour of Bentonites in the Presence of Salt Solutions. Appl. Clay Sci. 2016, 120, 61–69. [Google Scholar] [CrossRef]
  24. Deng, Y.F.; Yue, X.B.; Cui, Y.J.; Shao, G.H.; Liu, S.Y.; Zhang, D.W. Effect of Pore Water Chemistry on the Hydro-Mechanical Behaviour of Lianyungang Soft Marine Clay. Appl. Clay Sci. 2014, 95, 167–175. [Google Scholar] [CrossRef]
  25. Di Maio, C.; Santoli, L.; Schiavone, P. Volume Change Behaviour of Clays: The Influence of Mineral composition, Pore Fluid Composition and Stress State. Mech. Mater. 2004, 36, 435–451. [Google Scholar] [CrossRef]
  26. Post, V.E. Fresh and Saline Groundwater Interaction in Coastal Aquifers: Is Our Technology Ready for the Problems Ahead? Hydrogeol. J. 2005, 13, 120–123. [Google Scholar] [CrossRef]
  27. Bergado, D.T.; Ahmed, S.; Sampaco, C.L.; Balasubramaniam, A.S. Settlements of Bagna-Bangpakong Highway on Soft Bangkok Clay. J. Geotech. Eng. 1990, 116, 136–155. [Google Scholar] [CrossRef]
  28. Wu, C.-J.; Ye, G.-L.; Zhang, L.-L.; Bishop, D.; Wang, J. Depositional Environment and Geotechnical Properties of Shanghai Clay: A Comparison with Ariake and Bangkok Clays. Bull. Eng. Geol. Environ. 2015, 74, 717–732. [Google Scholar] [CrossRef]
  29. Xu, Y.S.; Shen, S.L.; Du, Y.J. Geological and Hydrogeological Environment in Shanghai with Geohazards to Construction and Maintenance of Infrastructures. Eng. Geol. 2009, 109, 241–254. [Google Scholar] [CrossRef]
  30. Luo, C.Y.; Shen, S.L.; Han, J.; Ye, G.L.; Horpibulsuk, S. Hydrogeochemical Environment of Aquifer Groundwater in Shanghai and Potential Hazards to Underground Infrastructures. Nat. Hazards 2015, 78, 753–774. [Google Scholar] [CrossRef]
  31. Chung, S.G.; Giao, P.H.; Kim, G.J.; Leroueil, S. Geotechnical Properties of Pusan Clays. Can. Geotech. J. 2002, 39, 1050–1060. [Google Scholar] [CrossRef]
  32. Puzrin, A.M.; Alonso, E.E.; Pinyol, N. Chapter 2 Unexpected Excessive Settlements: Kansai International Airport, Japan. In Geomechanics of Failures; Springer Science+Business Media B.V.: Dordrecht, The Netherlands, 2010; pp. 23–43. [Google Scholar]
  33. Shen, S.-L.; Xu, Y.-S. Numerical Evaluation of Land Subsidence Induced by Groundwater Pumping in Shanghai. Can. Geotech. J. 2011, 48, 1378–1392. [Google Scholar] [CrossRef]
  34. Hung, W.-C.; Hwang, C.; Liou, J.-C.; Lin, Y.-S.; Yang, H.-L. Modeling Aquifer-System Compaction and Predicting Land Subsidence in Central Taiwan. Eng. Geol. 2012, 147, 78–90. [Google Scholar] [CrossRef]
  35. Barry, T. The Soft Soils of Semarang. In Seminar & Workshop Polder Systems in Waterfront Cities September 27–28, 2001; CUR & Universitas Katolik Parahyangan: Bandung, Indonesia, 2001; pp. 1–12. [Google Scholar]
  36. Tirta, B.A.; Nugroho, M.A.; Parahita, B.; Focks, D.J. Observational Method for More Reliable Settlement Prediction for Reclamation on the Holocene Marine Clay Deposit in Jakarta Bay. In The Third International Conference on Sustainable Infrastructure and Built Environment (SIBE 2017), Bandung, West Java, Indonesia, 26–27 September 2017; EDP Sciences: Les UlisCedex A, France, 2018; pp. 1–9. [Google Scholar]
  37. Irsyam, M.; Krisnanto, S.; Wardhani, S.P.R. Instrumented Full Scale Test and Numerical Analysis to Investigate Performance of Bamboo Pile-Mattress System as Soil Reinforcement for Coastal Embankment on Soft Clay. In Geotechnical Engineering for Disaster Mitigation and Rehabilitation; Liu, H., Deng, A., Chu, J., Eds.; Springer: Berlin/Heidelberg, Germany, 2008. [Google Scholar]
  38. Van Schaeck Mathon, F.M.A. Analysis of Groundwater Conditions on the Basis of Existing Data: A Study of the East Semarang- Demak Plain Central Java. In Seminar on Groundwater Development for the Purpose of Irrigation; Ministry of Mining Directorate General of Mining Directorate of Geology: Surabaya, Indonesia, 1975; pp. 1–23. [Google Scholar]
  39. Thaden, R.E.; Sumardirdja, H.; Richards, P.W. Geological Map of Magelang and Semarang Quadrangles, Java, Scale 1:100.000; Geological Research and Development Centre: Bandung, Indonesia, 1996. [Google Scholar]
  40. Suwarti, T.; Wikarno, S. Geological Map of Kudus Quadrangle, Java, Scale 1:100.000; Geological Research and Development Centre: Bandung, Indonesia, 1992. [Google Scholar]
  41. Marsudi. Prediksi LajuAmblesan Tanah Di Dataran Aluvial Semarang, Propinsi Jawa Tengah; Doctoral Dissertation, Institut Teknologi Bandung (ITB): Bandung, Indonesia, 2001. [Google Scholar]
  42. Bemmelen, R.W.V. The Geology of Indonesia v. 1; MartinusNijhoff: The Hague, The Netherlands, 1949. [Google Scholar]
  43. Tobing, M.H.L.; Syarief, E.A.; Murdohardono, D. Penyelidikan Geologi Teknik Amblesan Tanah Daerah Semarang Dan Sekitarnya, Propinsi Jawa Tengah; Center for Groundwater Resource and Environmental Geology, Indonesian Geological Agency: Bandung, Indonesia, 2000. [Google Scholar]
  44. Marfai, M.A.; Almohammad, H.; Dey, S.; Susanto, B.; King, L. Coastal Dynamic and Shoreline Mapping: Multi-Sources Spatial Data Analysis in Semarang Indonesia. Environ. Monit. Assess. 2008, 142, 297–308. [Google Scholar] [CrossRef] [PubMed]
  45. Taufik Nz, A. Penelitian Hidrogeologi Daerah Imbuhan Airtanah Dengan Metode Isotop Dan Hidrokimia Di Cekungan Airtanah Semarang—Demak ProvinsiJawa Tengah; Center for Groundwater Resource and Environmental Geology, Indonesian Geological Agency: Bandung, Indonesia, 2009. [Google Scholar]
  46. Brown, G.; Brindley, G.W. X-Ray Diffraction Procedures for Clay Mineral Identificatio. In Crystal Structures of Clay Minerals and their X-Ray Identification; Mineralogical Society London: Twickenham, UK, 1980. [Google Scholar]
  47. Deepthy, R.; Balakrishnan, S. Climatic Control on Clay Mineral Formation: Evidence from Weathering Profiles Developed. J. Earth Syst. Sci. 2005, 114, 545–556. [Google Scholar] [CrossRef]
  48. Skempton, A.W. The Consolidation of Clays by Gravitational Compaction. Q. J. Geol. Soc. 1970, 125, 373–411. [Google Scholar] [CrossRef]
  49. Bradbury, M.H.; Baeyens, B. A Physicochemical Characterisation and Geochemical Modelling Approach for Determining Porewater Chemistries in Argillaceous Rocks. Geochim. Cosmochim. Acta 1998, 62, 783–795. [Google Scholar] [CrossRef]
  50. Das, B.M. Advanced Soil Mechanics, 3rd ed.; Taylor& Francis: London, UK; New York, NY, USA, 2008; Volume 66. [Google Scholar]
  51. Mitchell, J.K.; Soga, K. Fundamentals of Soil Behavior, 3rd ed.; John Wiley & Sons, Inc.: Hoboken, NJ, USA, 2005; Volume 40. [Google Scholar]
  52. Merwe, V.D.; Mechanics, S.; Engineering, F. The weathering of some basic igneous and their engineering properties. Trans. South Afr. Inst. Civ. Eng. 1964, 6, 213–222. [Google Scholar]
  53. Wong, R.C.K. Swelling and Softening Behaviour of La Biche Shale. Can. Geotech. J. 1998, 35, 206–221. [Google Scholar] [CrossRef]
  54. Ren, X.; Zhao, Y.; Deng, Q.; Kang, J.; Li, D.; Wang, D. A Relation of Hydraulic Conductivity—Void Ratio for Soils Based on Kozeny-Carman Equation. Eng. Geol. 2016, 213, 89–97. [Google Scholar] [CrossRef]
  55. Ren, X.W.; Santamarina, J.C. The Hydraulic Conductivity of Sediments: A Pore Size Perspective. Eng. Geol. 2018, 233, 48–54. [Google Scholar] [CrossRef]
Figure 1. Geology of the study location (modified from [39,40]).
Geosciences 08 00130 g001
Figure 2. Typical subsurface profile of the Semarang-Demak plain.
Geosciences 08 00130 g002
Figure 3. Piezometric contour of the Damar Formation aquifer (in m a.m.s.l).
Geosciences 08 00130 g003
Figure 4. Water content, bulk density and specific gravity of Semarang-Demak clay.
Geosciences 08 00130 g004
Figure 5. Grain size distribution of Semarang-Demak clay.
Geosciences 08 00130 g005
Figure 6. (a) Plasticity chart; (b) Clay activity chart [modified from 52].
Geosciences 08 00130 g006aGeosciences 08 00130 g006b
Figure 7. XRD diffractograms: (a) Semarang clay; (b) Demak clay.
Geosciences 08 00130 g007
Figure 8. Concentrations of Na+ and Cl ions, electrical conductivity, and pH of Semarang-Demak groundwater.
Geosciences 08 00130 g008
Figure 9. Compression curves: (a) Semarang clay; (b)Demak clay.
Geosciences 08 00130 g009
Figure 10. Changes in the coefficient of consolidation (cv) versus porewater salt concentration for (a) Semarang clay; and (b) Demak clay.
Geosciences 08 00130 g010aGeosciences 08 00130 g010b
Figure 11. Changes in hydraulic conductivity (k) during compression at various porewater salt concentrations for (a) Semarang clay; and (b) Demak clay.
Geosciences 08 00130 g011aGeosciences 08 00130 g011b
Figure 12. Mathematical relationship of hydraulic conductivity to void ratio for: (a) Semarang clay; (b) Demak clay.
Geosciences 08 00130 g012
Figure 13. (a) Fabric of freshwater clay; (b) Fabric of saline clay.
Geosciences 08 00130 g013
Figure 14. Change of fabric caused by porewater replacement: (a) initial freshwater clay fabric; (b) parallel fabric after porewater replacement with 1000 mg/L NaCl solution; (c) denser parallel fabric after porewater replacement with 6000 mg/L NaCl solution.
Geosciences 08 00130 g014
Figure 15. Change of fabric caused by porewater replacement: (a) initial saline clay fabric; (b) parallel fabric after porewater replacement with 1000 mg/L NaCl solution; (c) denser parallel fabric after porewater replacement with 6000 mg/L NaCl solution.
Geosciences 08 00130 g015
Table 1. Result of semi quantitative analysis of Semarang-Demak clay.
BoreholeClay Mineralogy (%)
SMG-01Smectite (31.0%), illite (29.0%), kaolinite/chlorite (40.0%)
SMG-02Smectite (37%), illite (22.0%), kaolinite/chlorite (38.0%)
GEMSmectite (58.9%), illite (14.3%), kaolinite/chlorite (24.9%)
JTKSmectite (52.6%), illite (12.7%), kaolinite/chlorite (33.4%)
Table 2. Compression index, swelling index and oedometer modulus of Semarang-Demak clay.
Salt ConcentrationcccsEodo (kPa)
(mg/L)SemarangDemakSemarangDemakSemarangDemak
00.4340.8270.1400.1551468.811231.08
10000.4020.7680.1200.3601495.621298.97
30000.3790.6900.0990.2161586.521427.45
60000.3600.6300.0940.1671716.441615.13
Table 3. Average coefficient of consolidation (cv) and hydraulic conductivity (k) of Semarang-Demak clay.
Salt ConcentrationAverage cv (m2/year)Average k (×10−9 m/s)
(mg/L)SemarangDemakSemarangDemak
00.2261.0406.5470.240
10000.1841.2507.5220.259
30000.2761.4009.2860.304
60000.3191.5908.6920.375

