Preventing Groundwater Pollution Using Vulnerability and Risk Mapping: The Case of the Florina Basin, NW Greece
_S._Voudouris.png)


Abstract
:1. Introduction
2. Methodology
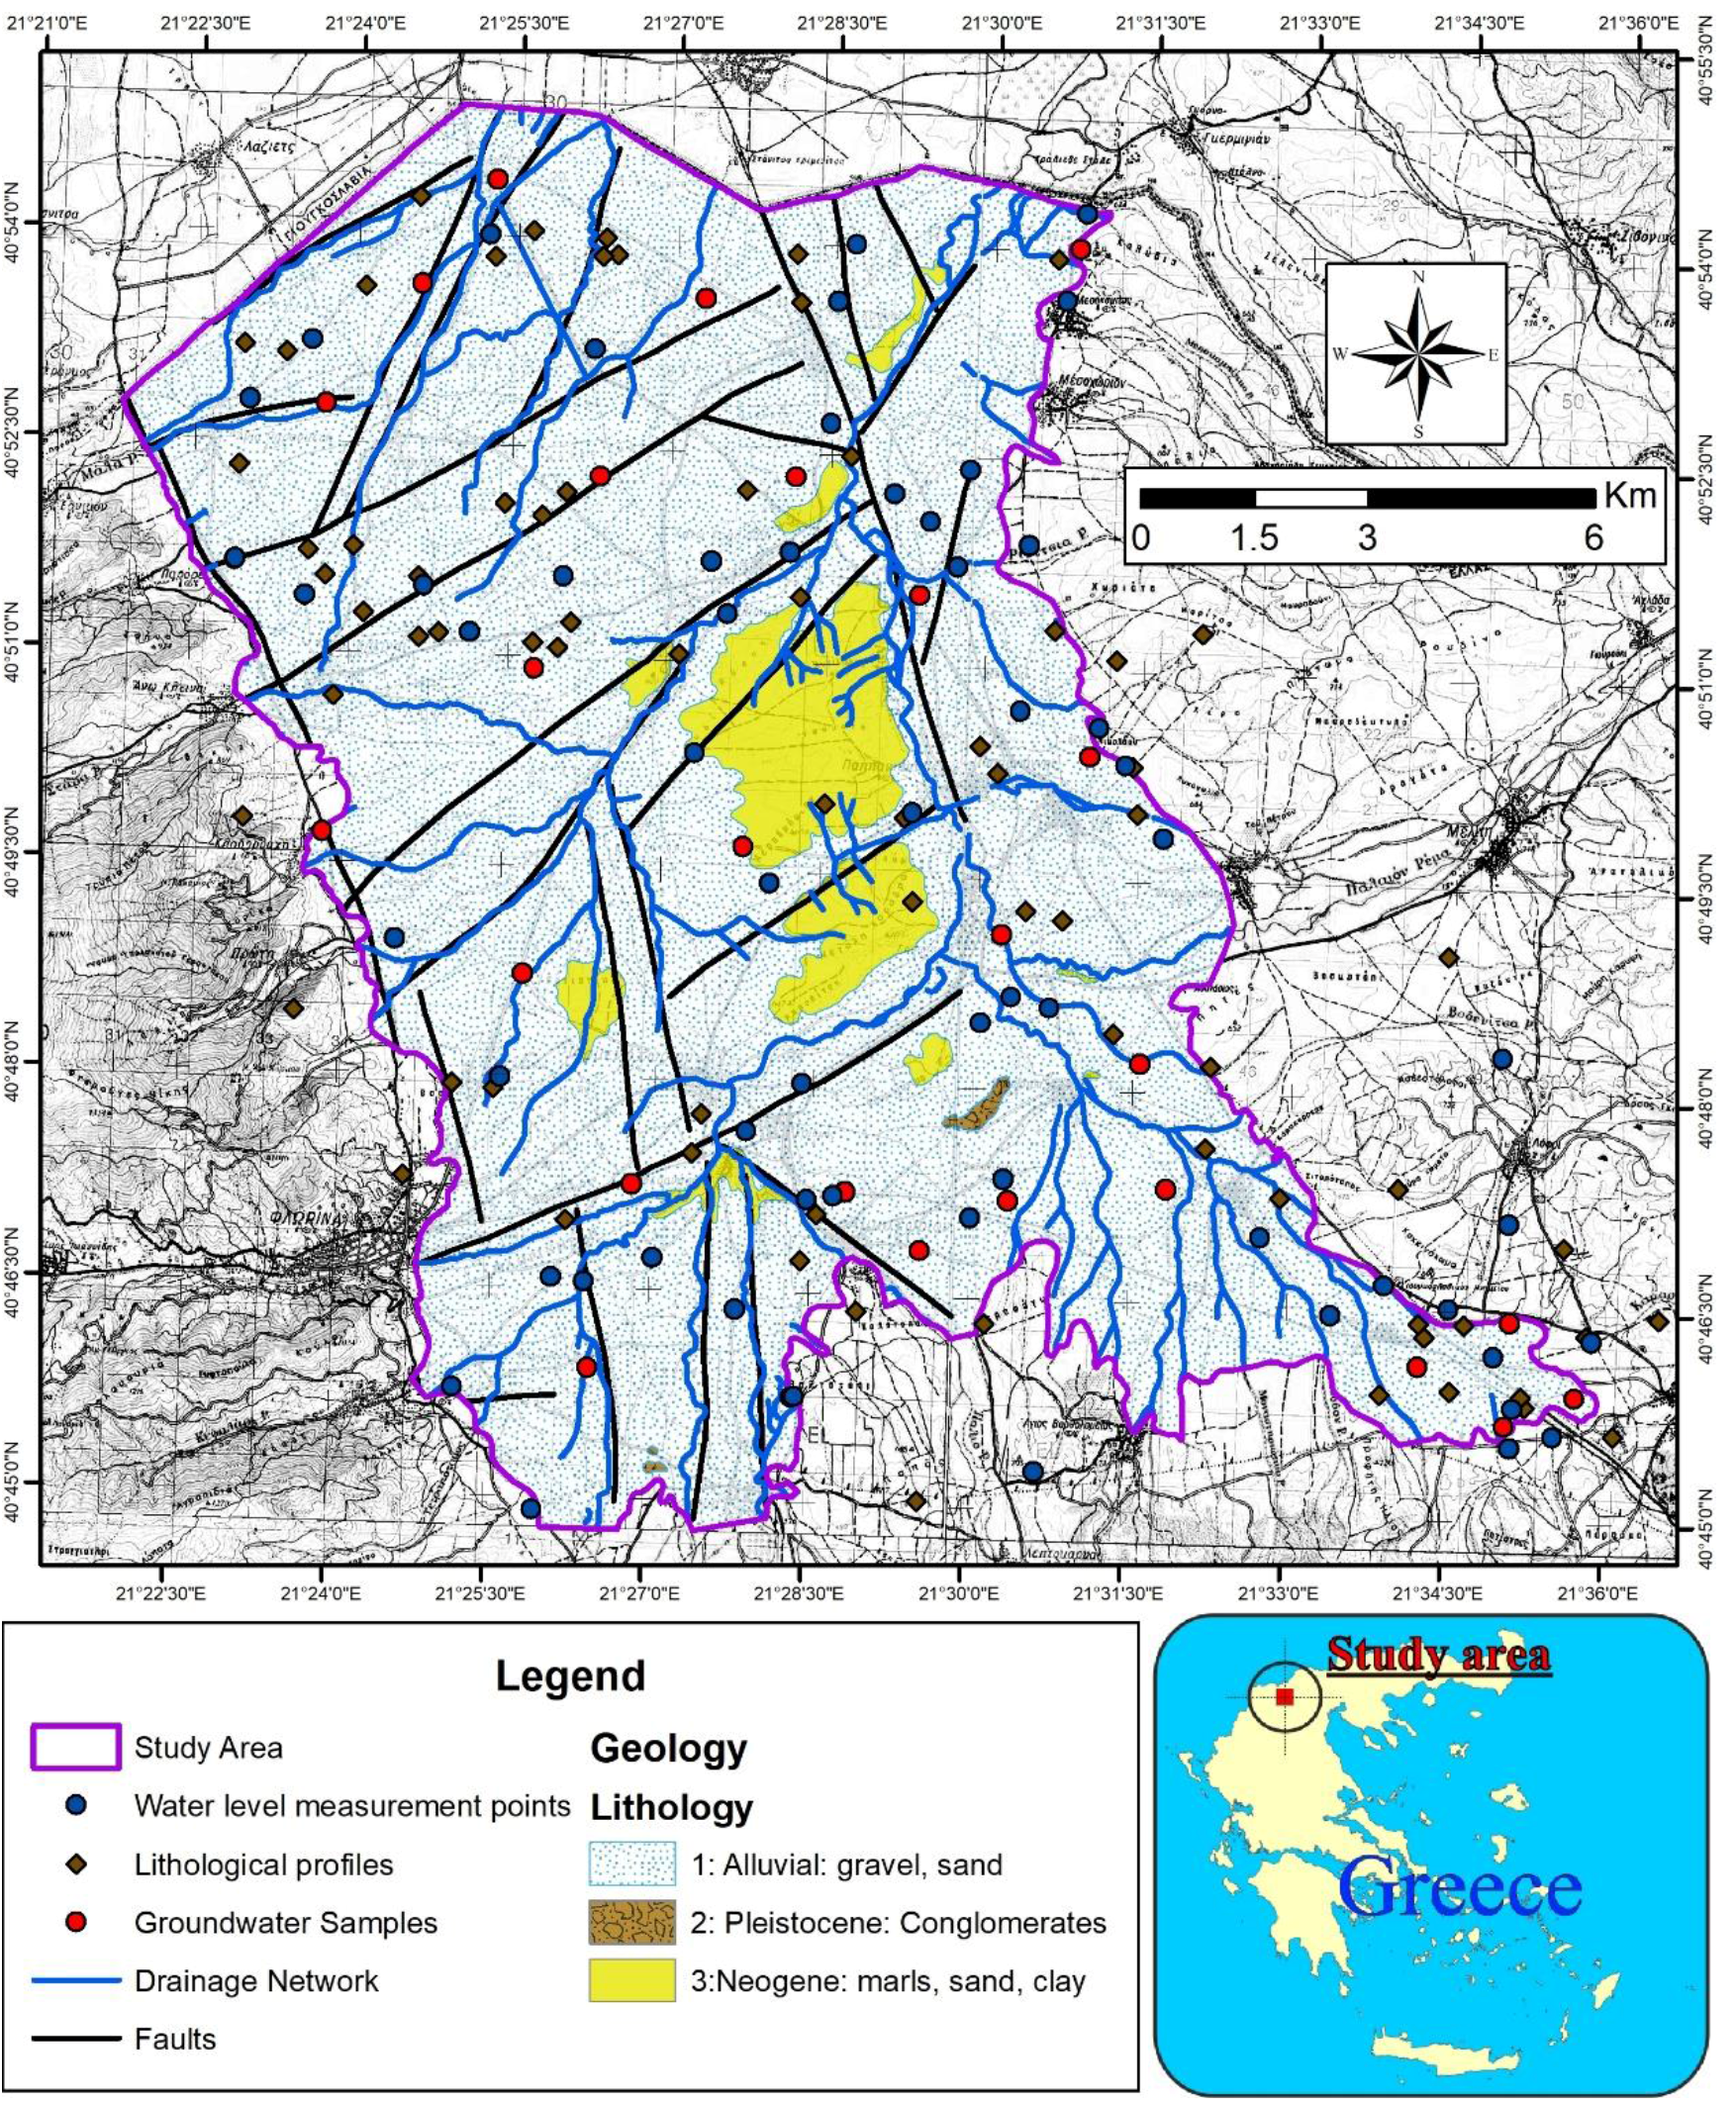
2.1. Study Area
2.2. Data Collection and Analysis
2.3. Vulnerability Assessment
2.4. Pollution Risk
3. Results and Discussion
3.1. Aquifer System
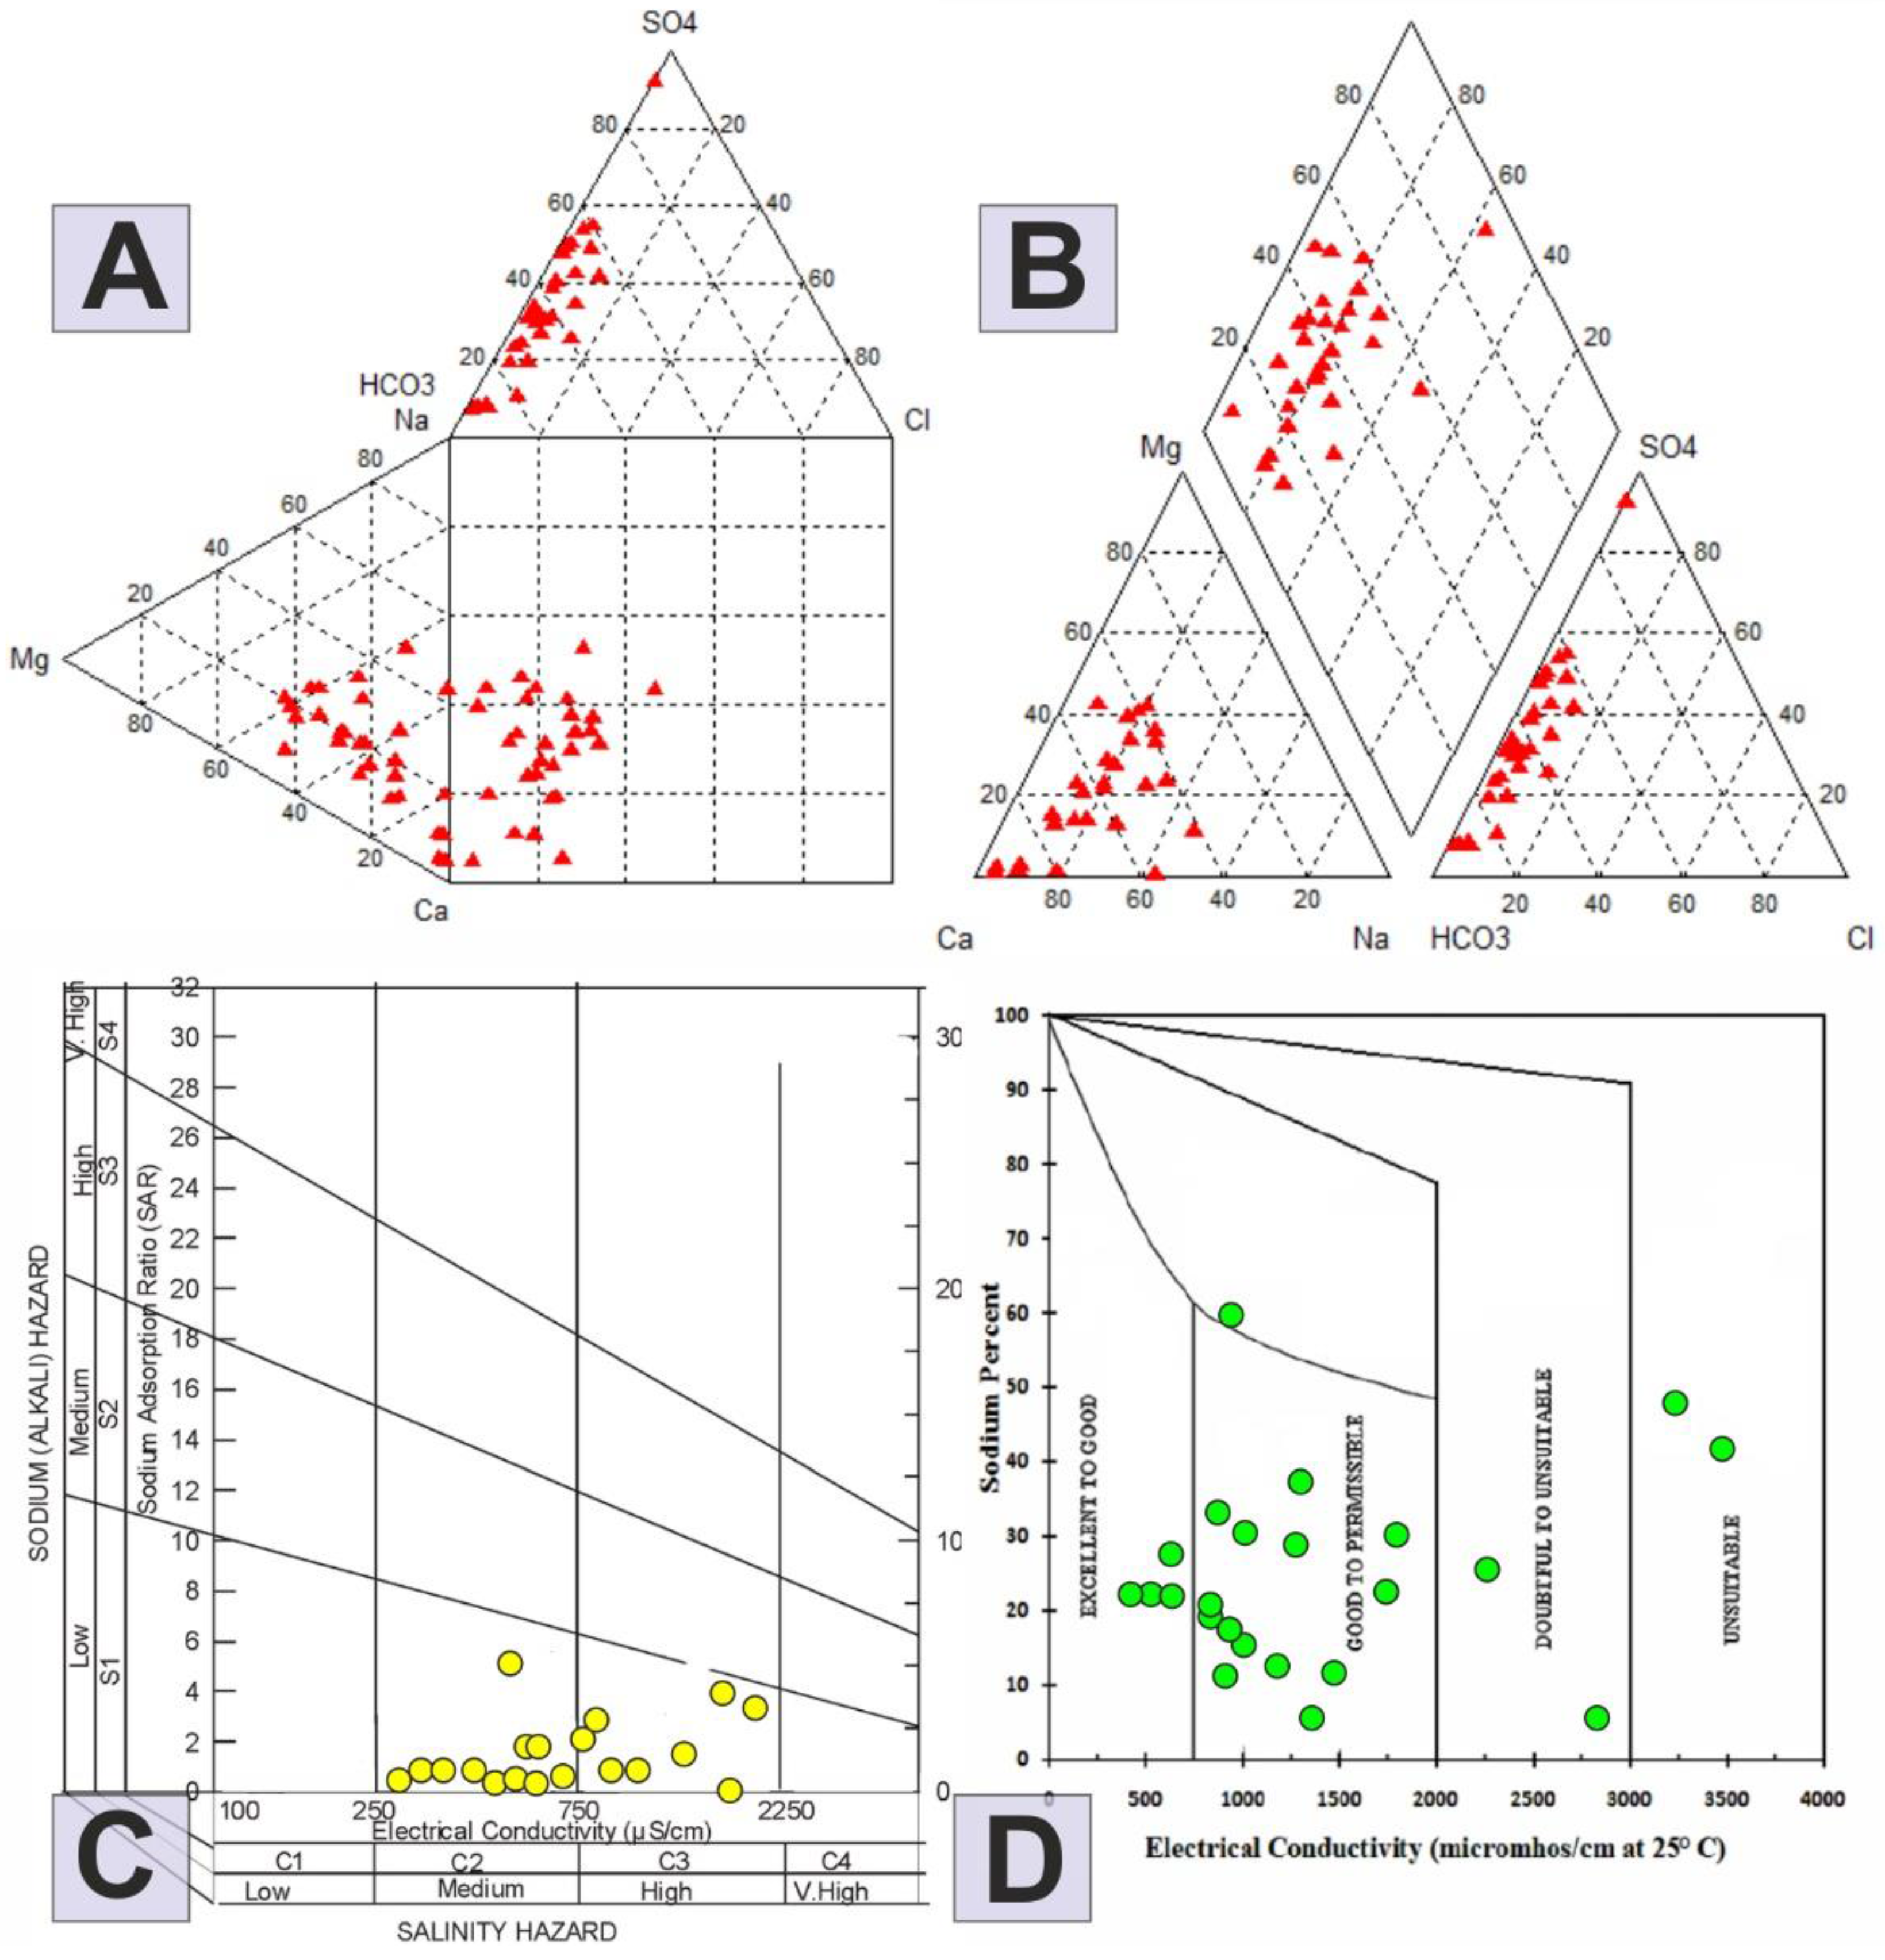
3.2. Groundwater Quality
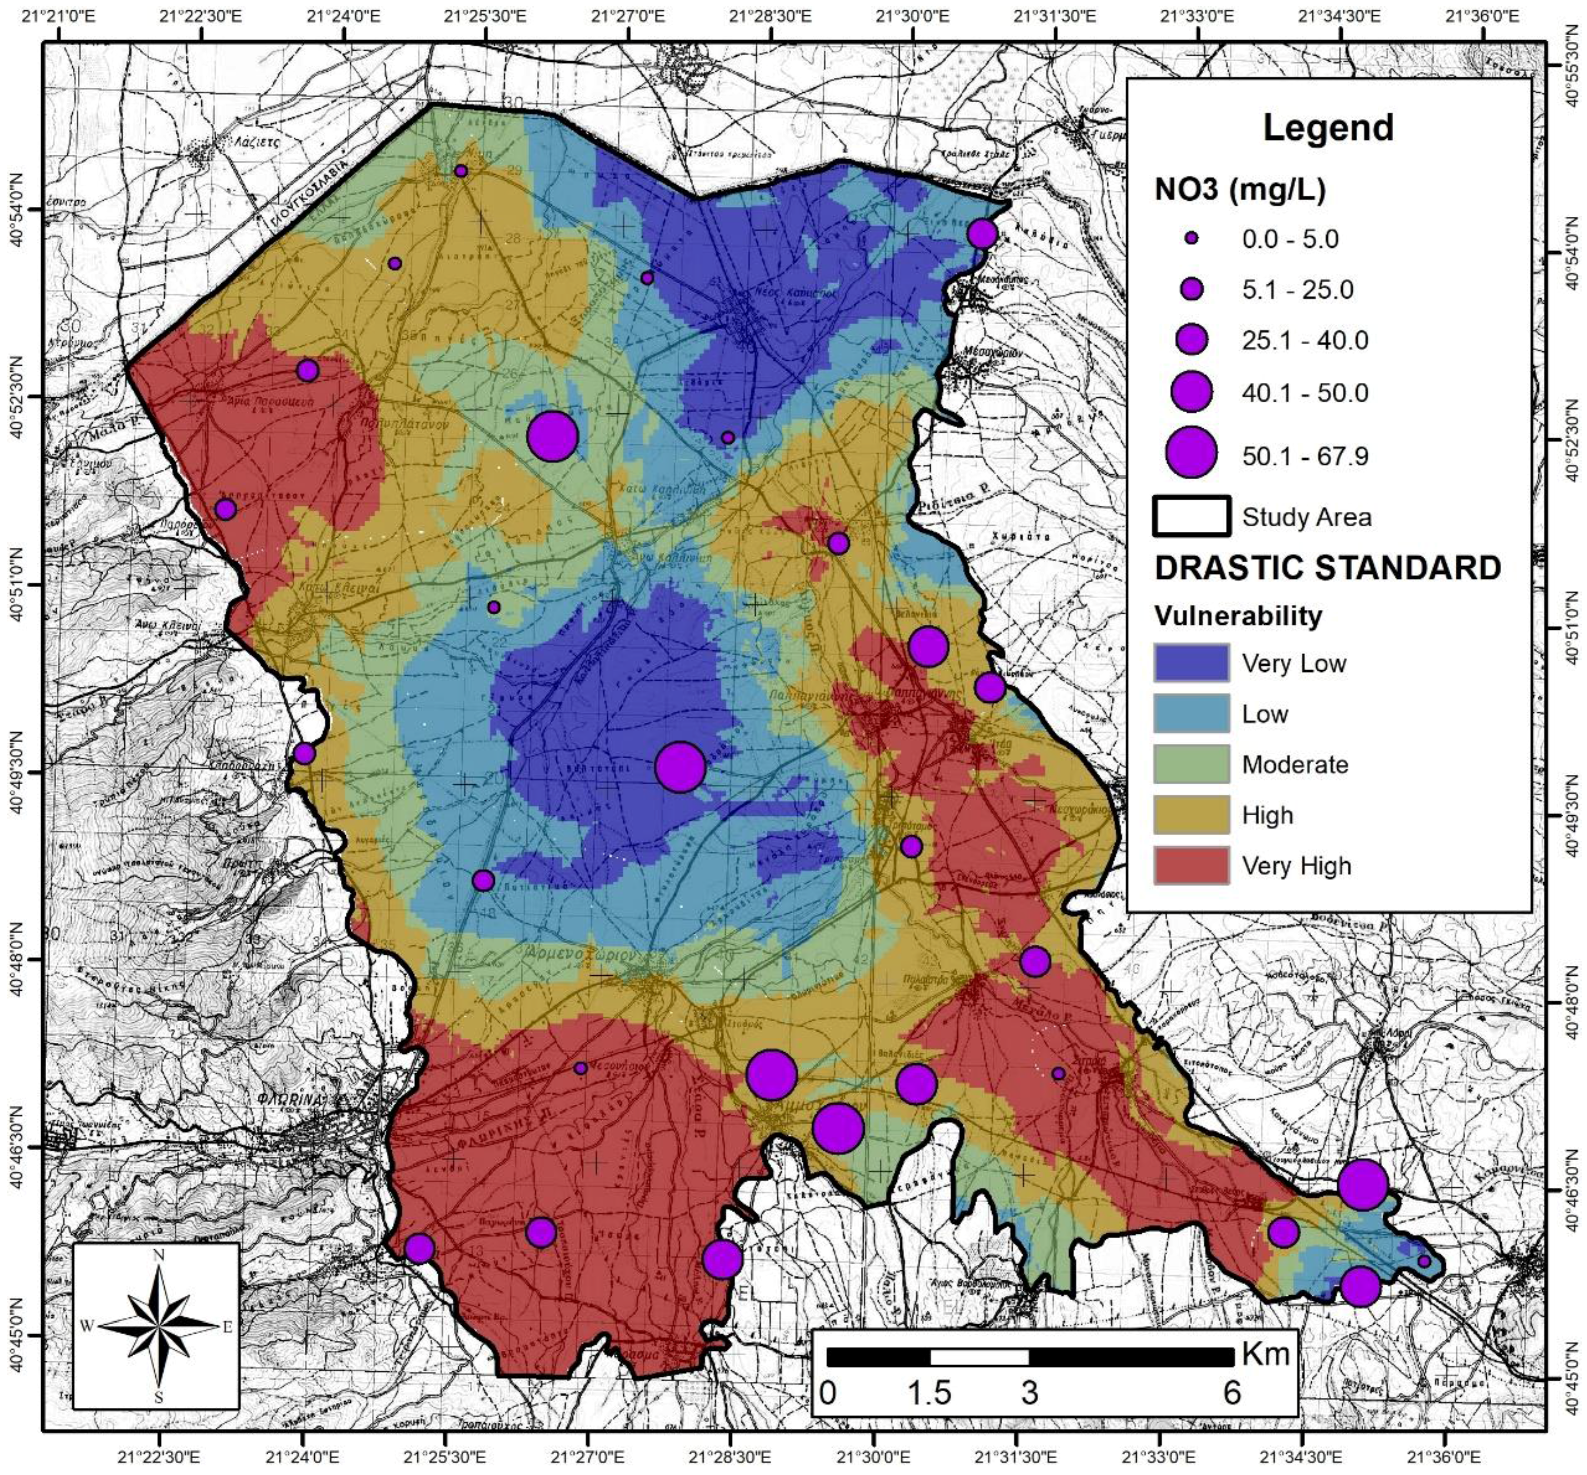
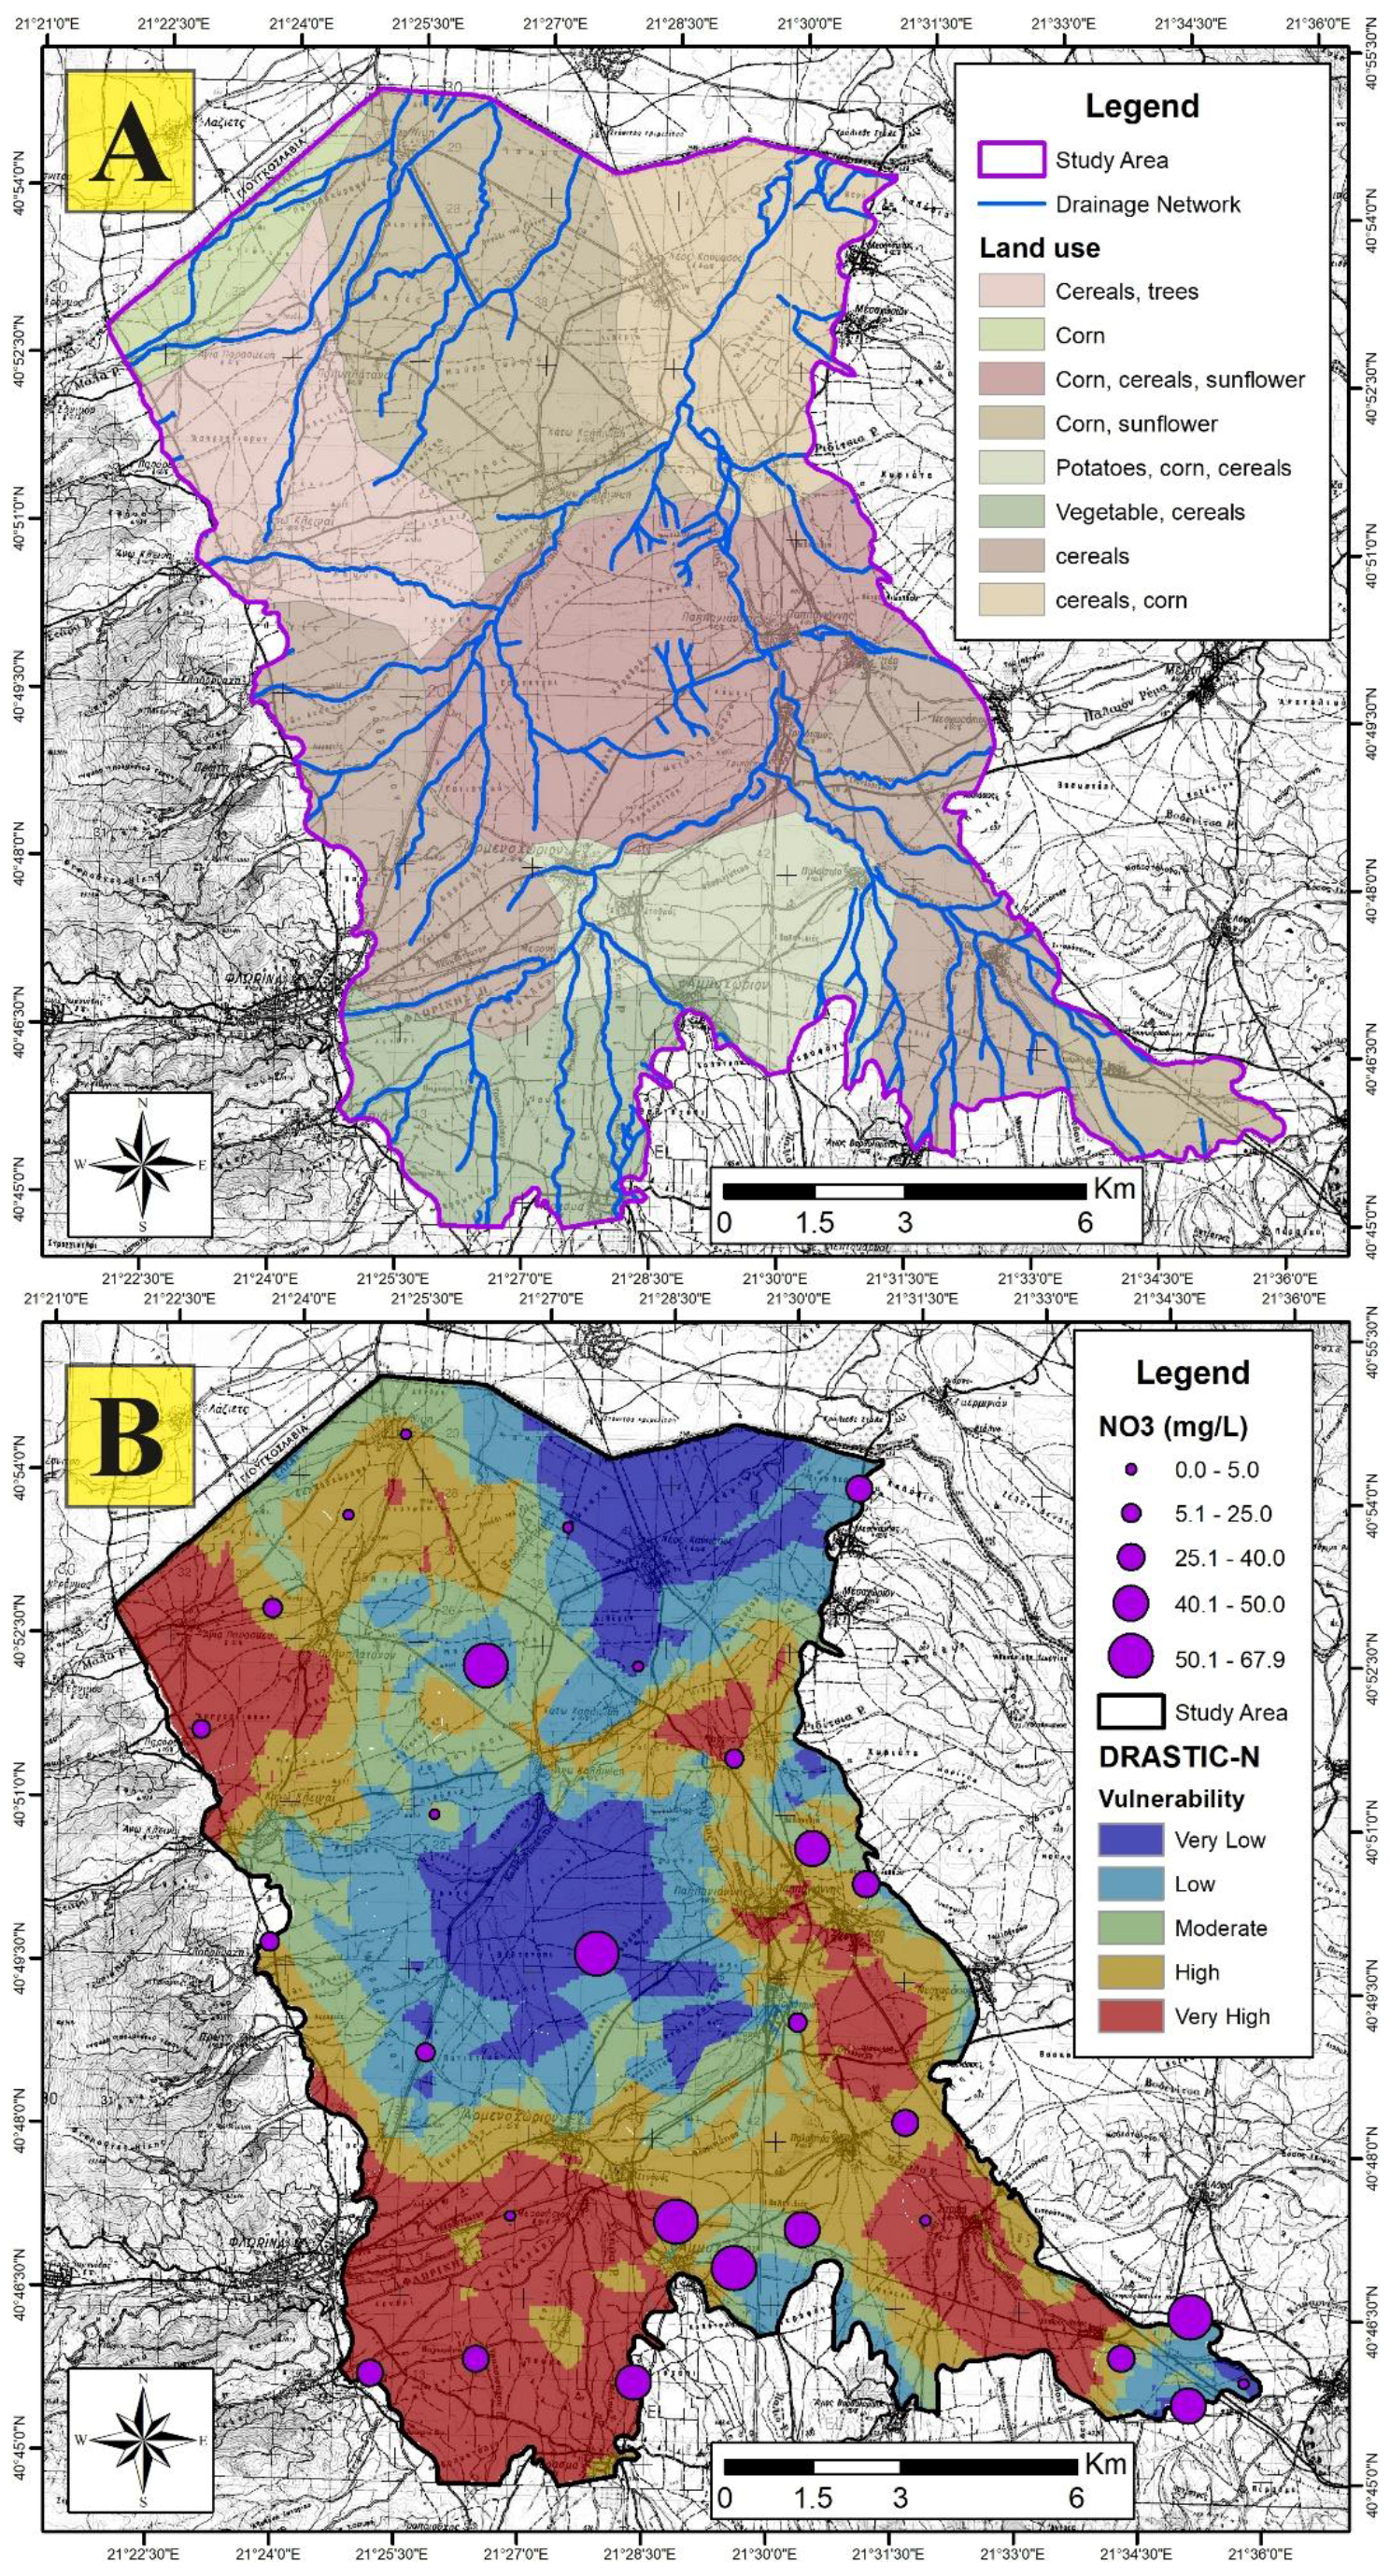
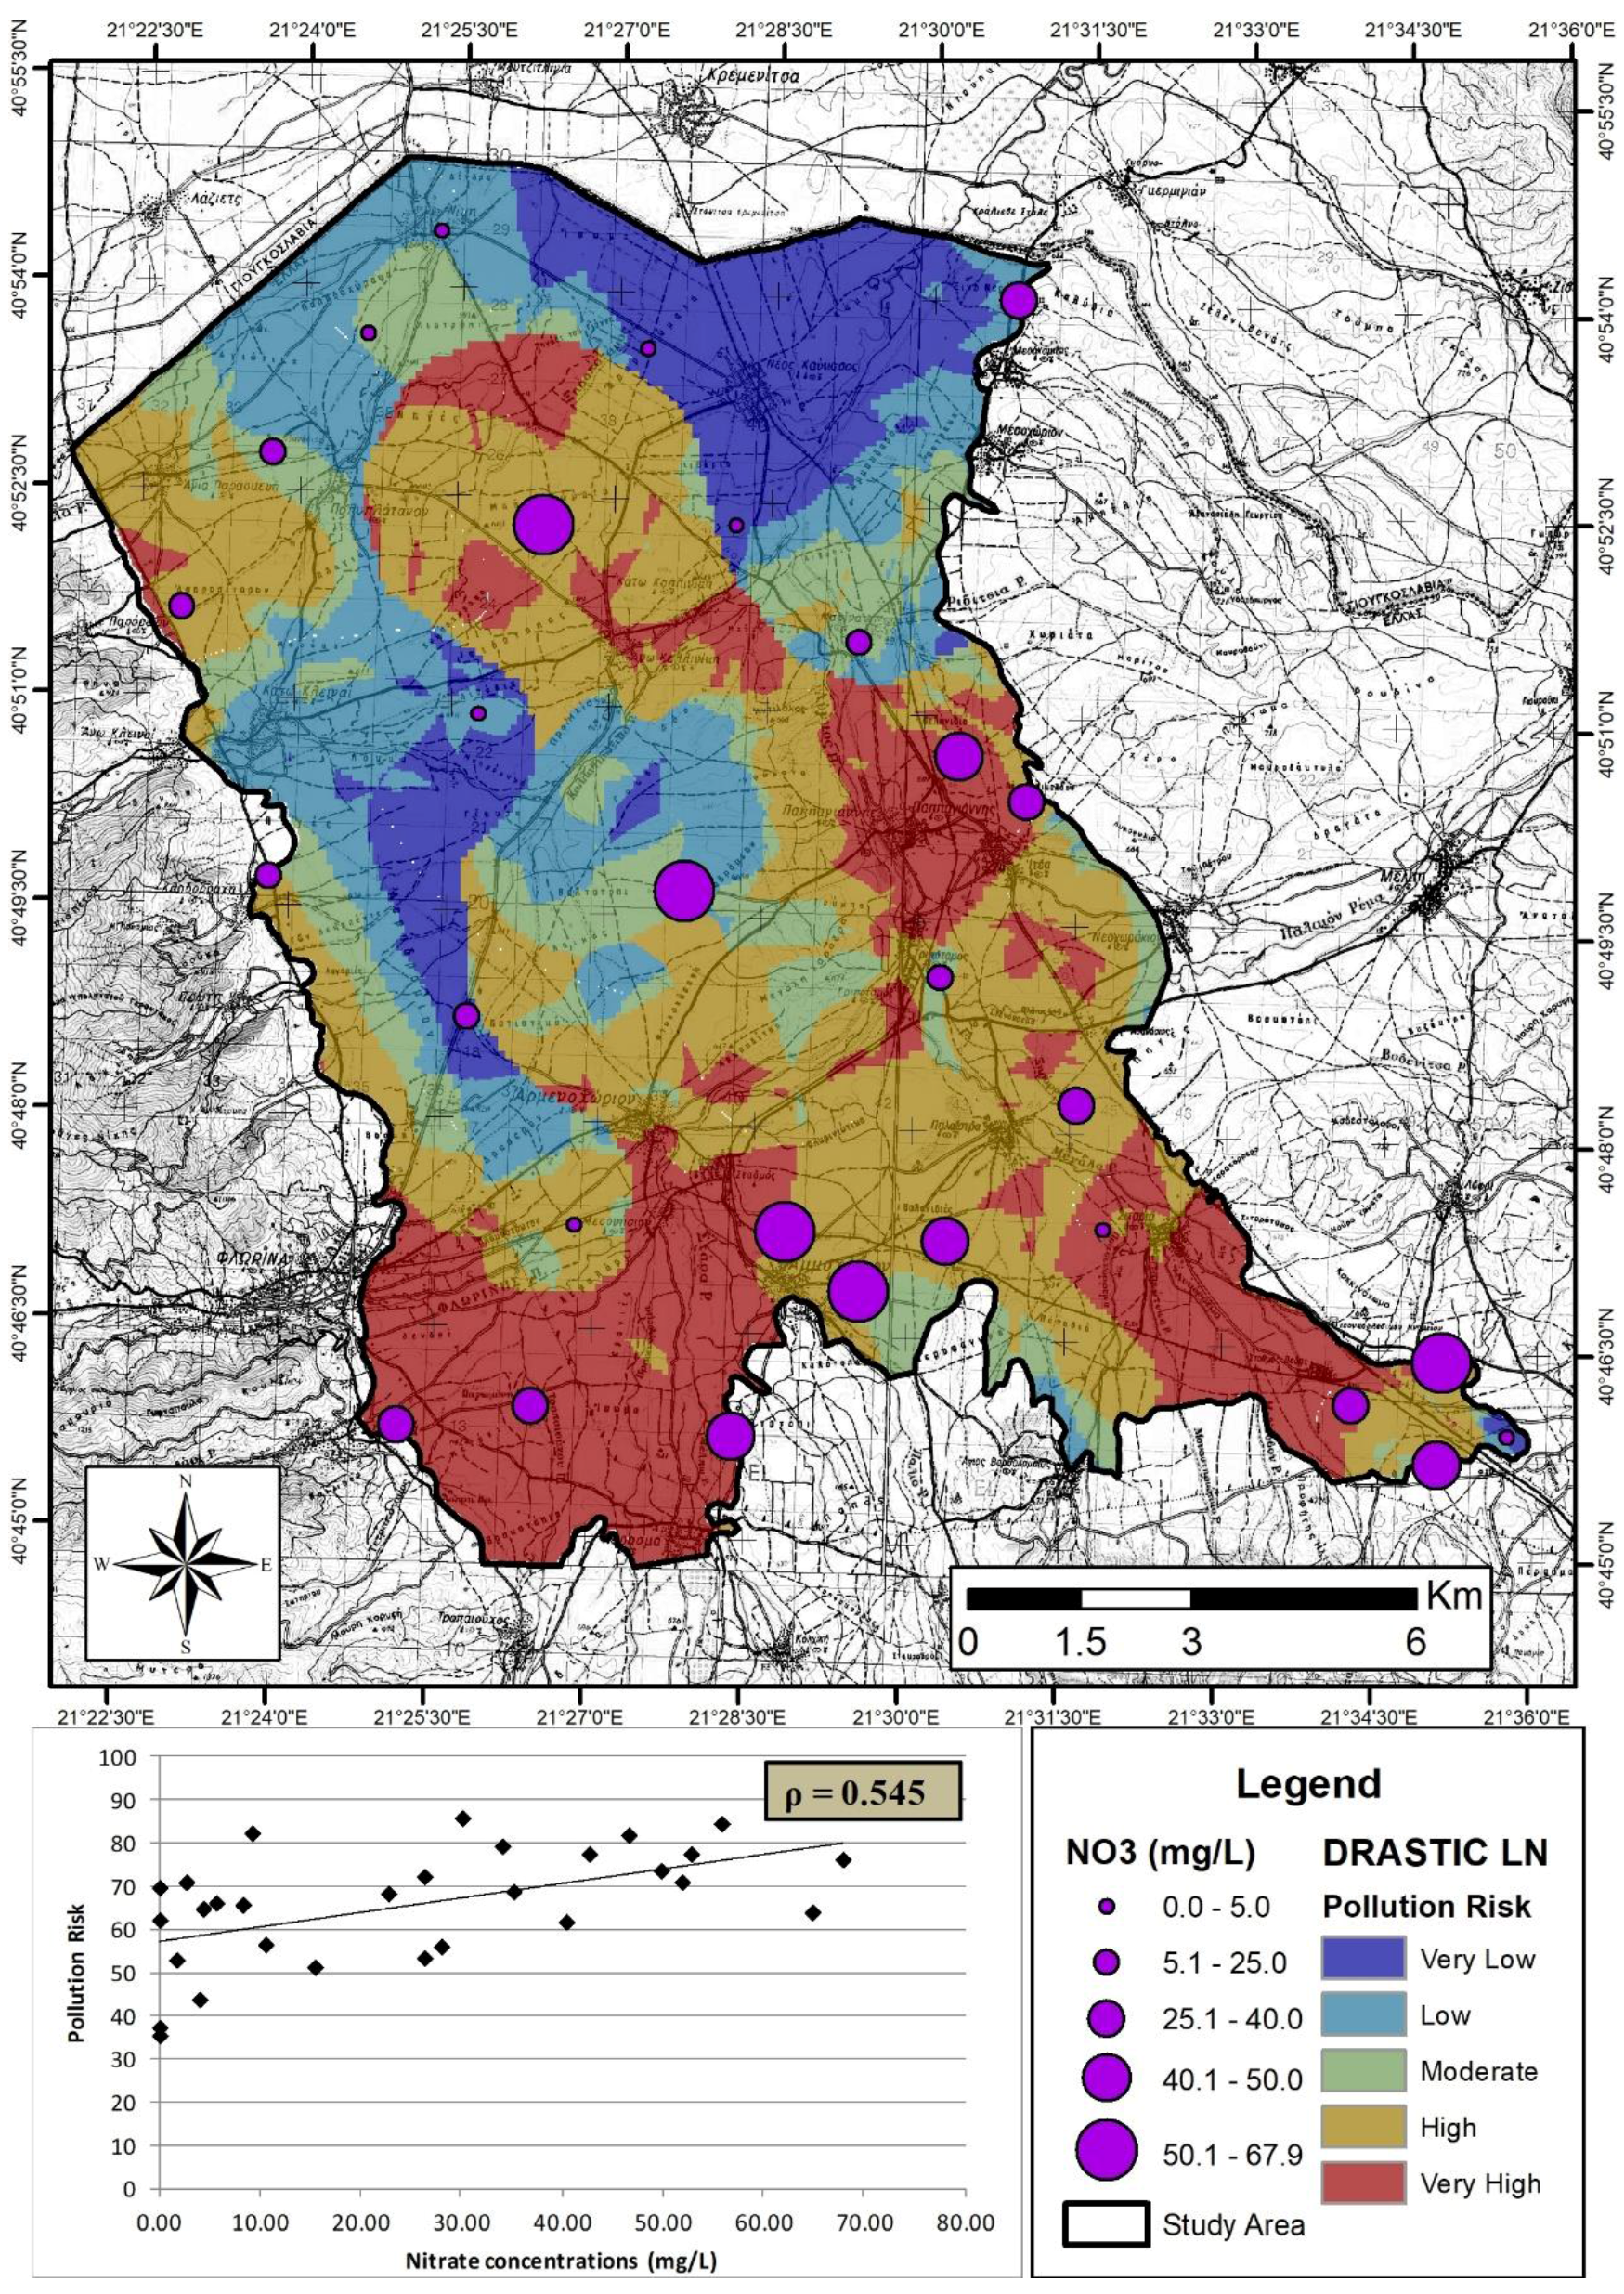
3.3. Groundwater Vulnerability and Risk Mapping
4. Conclusions
Acknowledgments
Author Contributions
Conflicts of Interest
References
- Suthar, N.; Bishnoi, P.; Singh, S.; Mutiyar, P.K.; Nema, A.K.; Patil, N.S. Nitrate contamination in groundwater of some rural areas of Rajasthan India. J. Hazard. Mater. 2009, 171, 189–199. [Google Scholar] [CrossRef] [PubMed]
- Puckett, L.J.; Tesoriero, A.J.; Dubrovsky, N.M. Nitrogen contamination of surficial aquifers—A growing legacy. Environ. Sci. Technol. 2011, 45, 839–844. [Google Scholar] [CrossRef] [PubMed]
- Kroeze, C.; Mosier, A.; Bouwman, L. Closing the global N2O budget: A retrospective analysis 1500–1994. Glob. Biogeochem. Cycles 1999, 13, 1–8. [Google Scholar] [CrossRef]
- Howden, N.J.K.; Burt, T.P.; Worrall, F.; Mathias, S.A.; Whelan, M.J. Nitrate pollution in intensively farmed regions: What are the prospects for sustaining high quality groundwater. Water Resour. Res. 2011, 47. [Google Scholar] [CrossRef]
- European Environment Agency. Present Concentration of Nitrate in Groundwater Bodies in European Countries. Available online: https://www.eea.europa.eu/data-and-maps/figures/present-concentration-of-nitrate-in-groundwater-bodies-in-european-countries (accessed on 10 March 2018).
- Wang, L.; Burke, S. A catchment-scale method to simulating the impact of historical nitrate loading from agricultural land on the nitrate-concentration trends in the sandstone aquifers in the Eden Valley, UK. Sci. Total Environ. 2017, 579, 133–148. [Google Scholar] [CrossRef] [PubMed]
- Busico, G.; Kazakis, N.; Colombani, N.; Mastrocicco, M.; Voudouris, K.; Tedesco, D. A modified SINTACS method for groundwater vulnerability and pollution risk assessment in highly anthropized regions based on NO3− and SO42− concentrations. Sci. Total Environ. 2017, 609, 1512–1523. [Google Scholar] [CrossRef] [PubMed]
- Patrikaki, O.; Kazakis, N.; Voudouris, K. Vulnerability map: A useful tool for groundwater protection: An example from Mouriki basin, North Greece. Fresenius Environ. Bull. 2012, 21, 2516–2521. [Google Scholar]
- Aller, L.; Bennet, T.; Lehr, J.H.; Petty, R.J.; Hackett, G. DRASTIC: A Standardized System for Evaluating Groundwater Pollution Potential Using Hydrogeological Setting; United States Environmental Protection Agency: Washington, DC, USA, 1987.
- Huan, H.; Jinsheng, W.; Yanguo, T. Assessment and validation of groundwater vulnerability to nitrate based on a modified DRASTIC model: A case study in Jilin City of northeast China. Sci. Total Environ. 2012, 440, 14–23. [Google Scholar] [CrossRef] [PubMed]
- Voudouris, K. Assessing groundwater pollution risk in Sarigkiol basin, NW Greece. In River Pollution Research Progress; Gallo, M., Herrari, M., Eds.; Nova Science Publishers Inc.: New York, NY, USA, 2009; Chapter 7; pp. 265–281. ISBN 978-1-60456-643-7. [Google Scholar]
- Uricchio, V.F.; Giordano, R.; Lopez, N. A fuzzy knowledge-based decision support system for groundwater pollution and risk evaluation. J. Environ. Manag. 2004, 73, 189–197. [Google Scholar] [CrossRef] [PubMed]
- Institute of Geological and Mineral Exploration (IGME). Geological Map of Greece, Scale 1:50,000, 1 Sheet; Institute of Geological and Mineral Exploration (IGME): Florina, Greece, 1960. [Google Scholar]
- Rice, E.W.; Baird, R.B.; Eaton, A.D.; Clesceri, L.S. Standard Methods for the Examination of Water and Wastewater; American Water Works Association/American Public Works Association/Water Environment Federation: Washington, DC, USA, 1999. [Google Scholar]
- Piper, A.M. A graphical procedure in the geochemical interpretation of water analysis. Trans. Am. Geophys. Union 1944, 25, 914–928. [Google Scholar] [CrossRef]
- Kazakis, N.; Voudouris, K. Comparison of three applied methods of groundwater vulnerability mapping: A case study from the Florina basin, Northern Greece. Advances in the research of aquatic environment. In Proceedings of the 9th International Conference on Hydrogeology, Kalavrita, Greece, 5–8 October 2011; Lambrakis, N., Stournaras, G., Katsanou, K., Eds.; Springer: Berlin, Germany, 2011; Volume 2, pp. 359–367. [Google Scholar]
- Panagopoulos, G.; Antonakos, A.; Lambrakis, N. Optimization of the DRASTIC method for groundwater vulnerability assessment via the use of simple statistical methods and GIS. Hydrogeol. J. 2006, 14, 894–911. [Google Scholar] [CrossRef]
- Passarella, G.; Vurro, M.; D’Agostino, V.; Giuliano, G.; Barcelona, M.J. A probabilistic methodology to assess the risk of groundwater quality degradation. Environ. Monit. Assess. 2002, 79, 57–74. [Google Scholar] [CrossRef] [PubMed]
- Bossard, M.; Feranec, J.; Otahel, J. The Revised and Supplemented Corine Land Cover Nomenclature; European Environment Agency Technical Report; European Environment Agency: Copenhagen K, Denmark, 2000; Volume 38, p. 110. [Google Scholar]
- Diagnosis and Improvement of Saline and Alkaline Soils. Available online: https://www.ars.usda.gov/ARSUserFiles/20360500/hb60_pdf/hb60complete.pdf (accessed on 10 March 2018).
- Abbasi, T.; Abbasi, S.A. Water Quality Indices; Elsevier: Oxford, UK, 2012. [Google Scholar]
- Lumb, A.; Sharma, T.C.; Bibeault, J.F. A review of genesis and evolution of water quality index (WQI) and some future directions. Water Qual. Expo. Health 2011, 3, 1–24. [Google Scholar] [CrossRef]
- Sutadian, A.D.; Muttil, N.; Yilmaz, A.G.; Perera, B.J.C. Development of river water quality indices—A review. Environ. Monit. Assess. 2016, 188, 58. [Google Scholar] [CrossRef] [PubMed]
- Giri, S.; Singh, G.; Gupta, S.K.; Jha, V.N.; Tripathi, R.M. An evaluation of metal contamination in surface and groundwater around a proposed uranium mining site, Jharkhand, India. Mine Water Environ. 2010, 29, 225–234. [Google Scholar] [CrossRef]
- Machiwal, D.; Jha, M.K.; Mal, B.C. GIS-based assessment and characterization of groundwater quality in a hard-rock hilly terrain of Western India. Environ. Monit. Assess. 2011, 174, 645–663. [Google Scholar] [CrossRef] [PubMed]
- Margat, J. Groundwater Vulnerability Maps, Conception-Estimation-Mapping; EEC Institut Europeen de l’ Eau: Paris, France, 1968. (In French) [Google Scholar]
- Kazakis, N.; Oikonomidis, D.; Voudouris, K. Groundwater vulnerability and pollution risk assessment with disparate models in karstic, porous and fissured rock aquifers using remote sensing techniques and GIS in Anthemountas basin, Greece. Environ. Earth Sci. 2015, 74, 6199–6209. [Google Scholar] [CrossRef]
- Rupert, M.G. Calibration of the DRASTIC ground water vulnerability mapping method. Ground Water 2001, 39, 625–630. [Google Scholar] [CrossRef] [PubMed]
- Antonakos, A.K.; Lambrakis, N.J. Development and testing of three hybrid methods for the assessment of groundwater vulnerability to nitrates, based on the drastic method, an example from N.E. Korinthia, Greece. J. Hydrol. 2007, 333, 288–304. [Google Scholar] [CrossRef]
- Saida, S.; Tarik, H.; Abdellah, A.; Farid, H.; Hakim, B. Assessment of groundwater vulnerability to nitrate based on the optimised DRASTIC models in the GIS Environment (Case of Sidi Rached Basin, Algeria). Geosciences 2017, 7, 20. [Google Scholar] [CrossRef]
- Mastrocicco, M.; Colombani, N.; Palpacelli, S.; Castaldelli, G. Large tank experiment on nitrate fate and transport: The role of permeability distribution. Environ. Earth Sci. 2011, 63, 903–914. [Google Scholar] [CrossRef]
- Mastrocicco, M.; Colombani, N.; Palpacelli, S. Fertilizers mobilization in alluvial aquifer: Laboratory experiments. Environ. Geol. 2009, 56, 1371–1381. [Google Scholar]
- Sieczka, A.; Koda, E. Kinetic and equilibrium studies of sorption of Ammonium in the soil-water environment in agricultural areas of central Poland. Appl. Sci. 2016, 6, 269. [Google Scholar] [CrossRef]
- Mastrocicco, M.; Colombani, N.; Salemi, E.; Castaldelli, G. Reactive modeling of denitrification in soils with natural and depleted organic matter. Water Air Soil Pollut. 2011, 222, 205–215. [Google Scholar] [CrossRef]
- Thirumalaivasan, D.; Karmegam, M.; Venugopal, K. AHP-DRASTIC: Software for specific aquifer vulnerability assessment using DRASTIC model and GIS. Environ. Model. Softw. 2003, 18, 645–656. [Google Scholar] [CrossRef]
- Dixon, B. Applicability of neuro-fuzzy techniques in predicting groundwater vulnerability: A GIS-based sensitivity analysis. J. Hydrol. 2005, 309, 17–38. [Google Scholar] [CrossRef]
- Javadi, S.; Hashemy, S.M.; Mohammadi, K.; Howard, K.W.F.; Neshat, A. Classification of aquifer vulnerability using K-means cluster analysis. J. Hydrol. 2017, 549, 27–37. [Google Scholar] [CrossRef]
- Kazakis, N.; Voudouris, K. Groundwater vulnerability and pollution risk assessment of porous aquifers to nitrate: Modifying the drastic method using quantitative parameters. J. Hydrol. 2015, 525, 12–25. [Google Scholar] [CrossRef]
- Kim, H.-S.; Park, S.-R. Hydrogeochemical characteristics of groundwater highly polluted with nitrate in an agricultural area of Hongseong, Korea. Water 2016, 8, 345. [Google Scholar] [CrossRef]


| Parameters | Units | Min | Max | Mean | Median | Standard Deviation |
|---|---|---|---|---|---|---|
| pH | - | 5.6 | 7.7 | 6.4 | 6.9 | 6.2 |
| T | °C | 15.6 | 22.7 | 18.6 | 18.8 | 1.8 |
| EC | μS/cm | 320 | 1960 | 770 | 620 | 408 |
| TDS | mg/L | 160 | 990 | 388 | 310 | 222.9 |
| Ca2+ | mg/L | 27 | 252 | 89 | 77 | 53.7 |
| Mg2+ | mg/L | 1 | 74 | 17 | 15 | 15.1 |
| Na+ | mg/L | 7 | 209 | 39 | 20 | 49.6 |
| K+ | mg/L | 1 | 21 | 2.7 | 1.7 | 3.7 |
| Cl− | mg/L | 2 | 46 | 11 | 8 | 10.4 |
| NO3− | mg/L | 2 | 68 | 25 | 26 | 21.8 |
| SO42− | mg/L | 13 | 1020 | 130 | 95 | 129.7 |
| HCO3− | mg/L | 88 | 840 | 235 | 198 | 153.6 |
| Ionic Ratios | ||||||
| Na+/K+ | 3.8 | 393.8 | 44.6 | 21.1 | 77.6 | |
| Mg2+/Ca2+ | 0.01 | 1.1 | 0.43 | 0.37 | 0.3 | |
| Na+/Cl− | 1.5 | 179.7 | 12.1 | 3.9 | 32.9 | |
| (Ca2+ + Mg2+)/(Na+ + K+) | 0.7 | 22.8 | 5.6 | 3.8 | 5.1 | |
| (Ca2+ + Mg2+)/HCO3− | 0.9 | 7.0 | 1.7 | 1.5 | 1.1 | |
| SO42−/Cl− | 1.0 | 419.9 | 22.4 | 6.0 | 76.8 | |
| Water Quality Index | ||||||
| SAR | 0.2 | 4.4 | 1.1 | 1.1 | 1.1 | |
| (Na%) | 4.2 | 59.2 | 21.7 | 19.8 | 12.4 | |
| Potential Salinity | 0.3 | 10.7 | 1.7 | 1.8 | 2.0 | |
| Kelly Index | 0.04 | 1.5 | 0.3 | 0.3 | 0.3 | |
| Chlorinity Index | 1.8 | 46.4 | 11.2 | 11.4 | 10.4 | |
| Parameter | Standard Weights | Modified Weights |
|---|---|---|
| D—Depth of groundwater | 5 | 2.08 |
| R—Recharge | 4 | 1.33 |
| A—Aquifer type | 3 | 2.65 |
| S—Soil media | 2 | 2.41 |
| T—Topography | 1 | 0.03 |
| I—Impact of the Vadose zone | 5 | 1.32 |
| C—Conductivity | 3 | 0.16 |
| L—Land use | - | 2.66 |
| Vulnerability Pollution Risk | DRASTIC | DRASTIC-N | DRASTIC-LN |
|---|---|---|---|
| Area (km2) | |||
| Very Low | 23.7 | 26.0 | 21.6 |
| Low | 31.0 | 34.7 | 31.1 |
| Moderate | 29.2 | 30.9 | 24.0 |
| High | 51.4 | 48.5 | 63.1 |
| Very High | 50.0 | 45.4 | 45.1 |
© 2018 by the authors. Licensee MDPI, Basel, Switzerland. This article is an open access article distributed under the terms and conditions of the Creative Commons Attribution (CC BY) license (http://creativecommons.org/licenses/by/4.0/).
Share and Cite
Voudouris, K.; Mandrali, P.; Kazakis, N. Preventing Groundwater Pollution Using Vulnerability and Risk Mapping: The Case of the Florina Basin, NW Greece. Geosciences 2018, 8, 129. https://doi.org/10.3390/geosciences8040129
Voudouris K, Mandrali P, Kazakis N. Preventing Groundwater Pollution Using Vulnerability and Risk Mapping: The Case of the Florina Basin, NW Greece. Geosciences. 2018; 8(4):129. https://doi.org/10.3390/geosciences8040129
Chicago/Turabian StyleVoudouris, Konstantinos, Paschalia Mandrali, and Nerantzis Kazakis. 2018. "Preventing Groundwater Pollution Using Vulnerability and Risk Mapping: The Case of the Florina Basin, NW Greece" Geosciences 8, no. 4: 129. https://doi.org/10.3390/geosciences8040129
APA StyleVoudouris, K., Mandrali, P., & Kazakis, N. (2018). Preventing Groundwater Pollution Using Vulnerability and Risk Mapping: The Case of the Florina Basin, NW Greece. Geosciences, 8(4), 129. https://doi.org/10.3390/geosciences8040129