Shape and Size Complexity of Deep Seafloor Mounds on the Canary Basin (West to Canary Islands, Eastern Atlantic): A DEM-Based Geomorphometric Analysis of Domes and Volcanoes

 , , , , , , and
Abstract
:1. Introduction
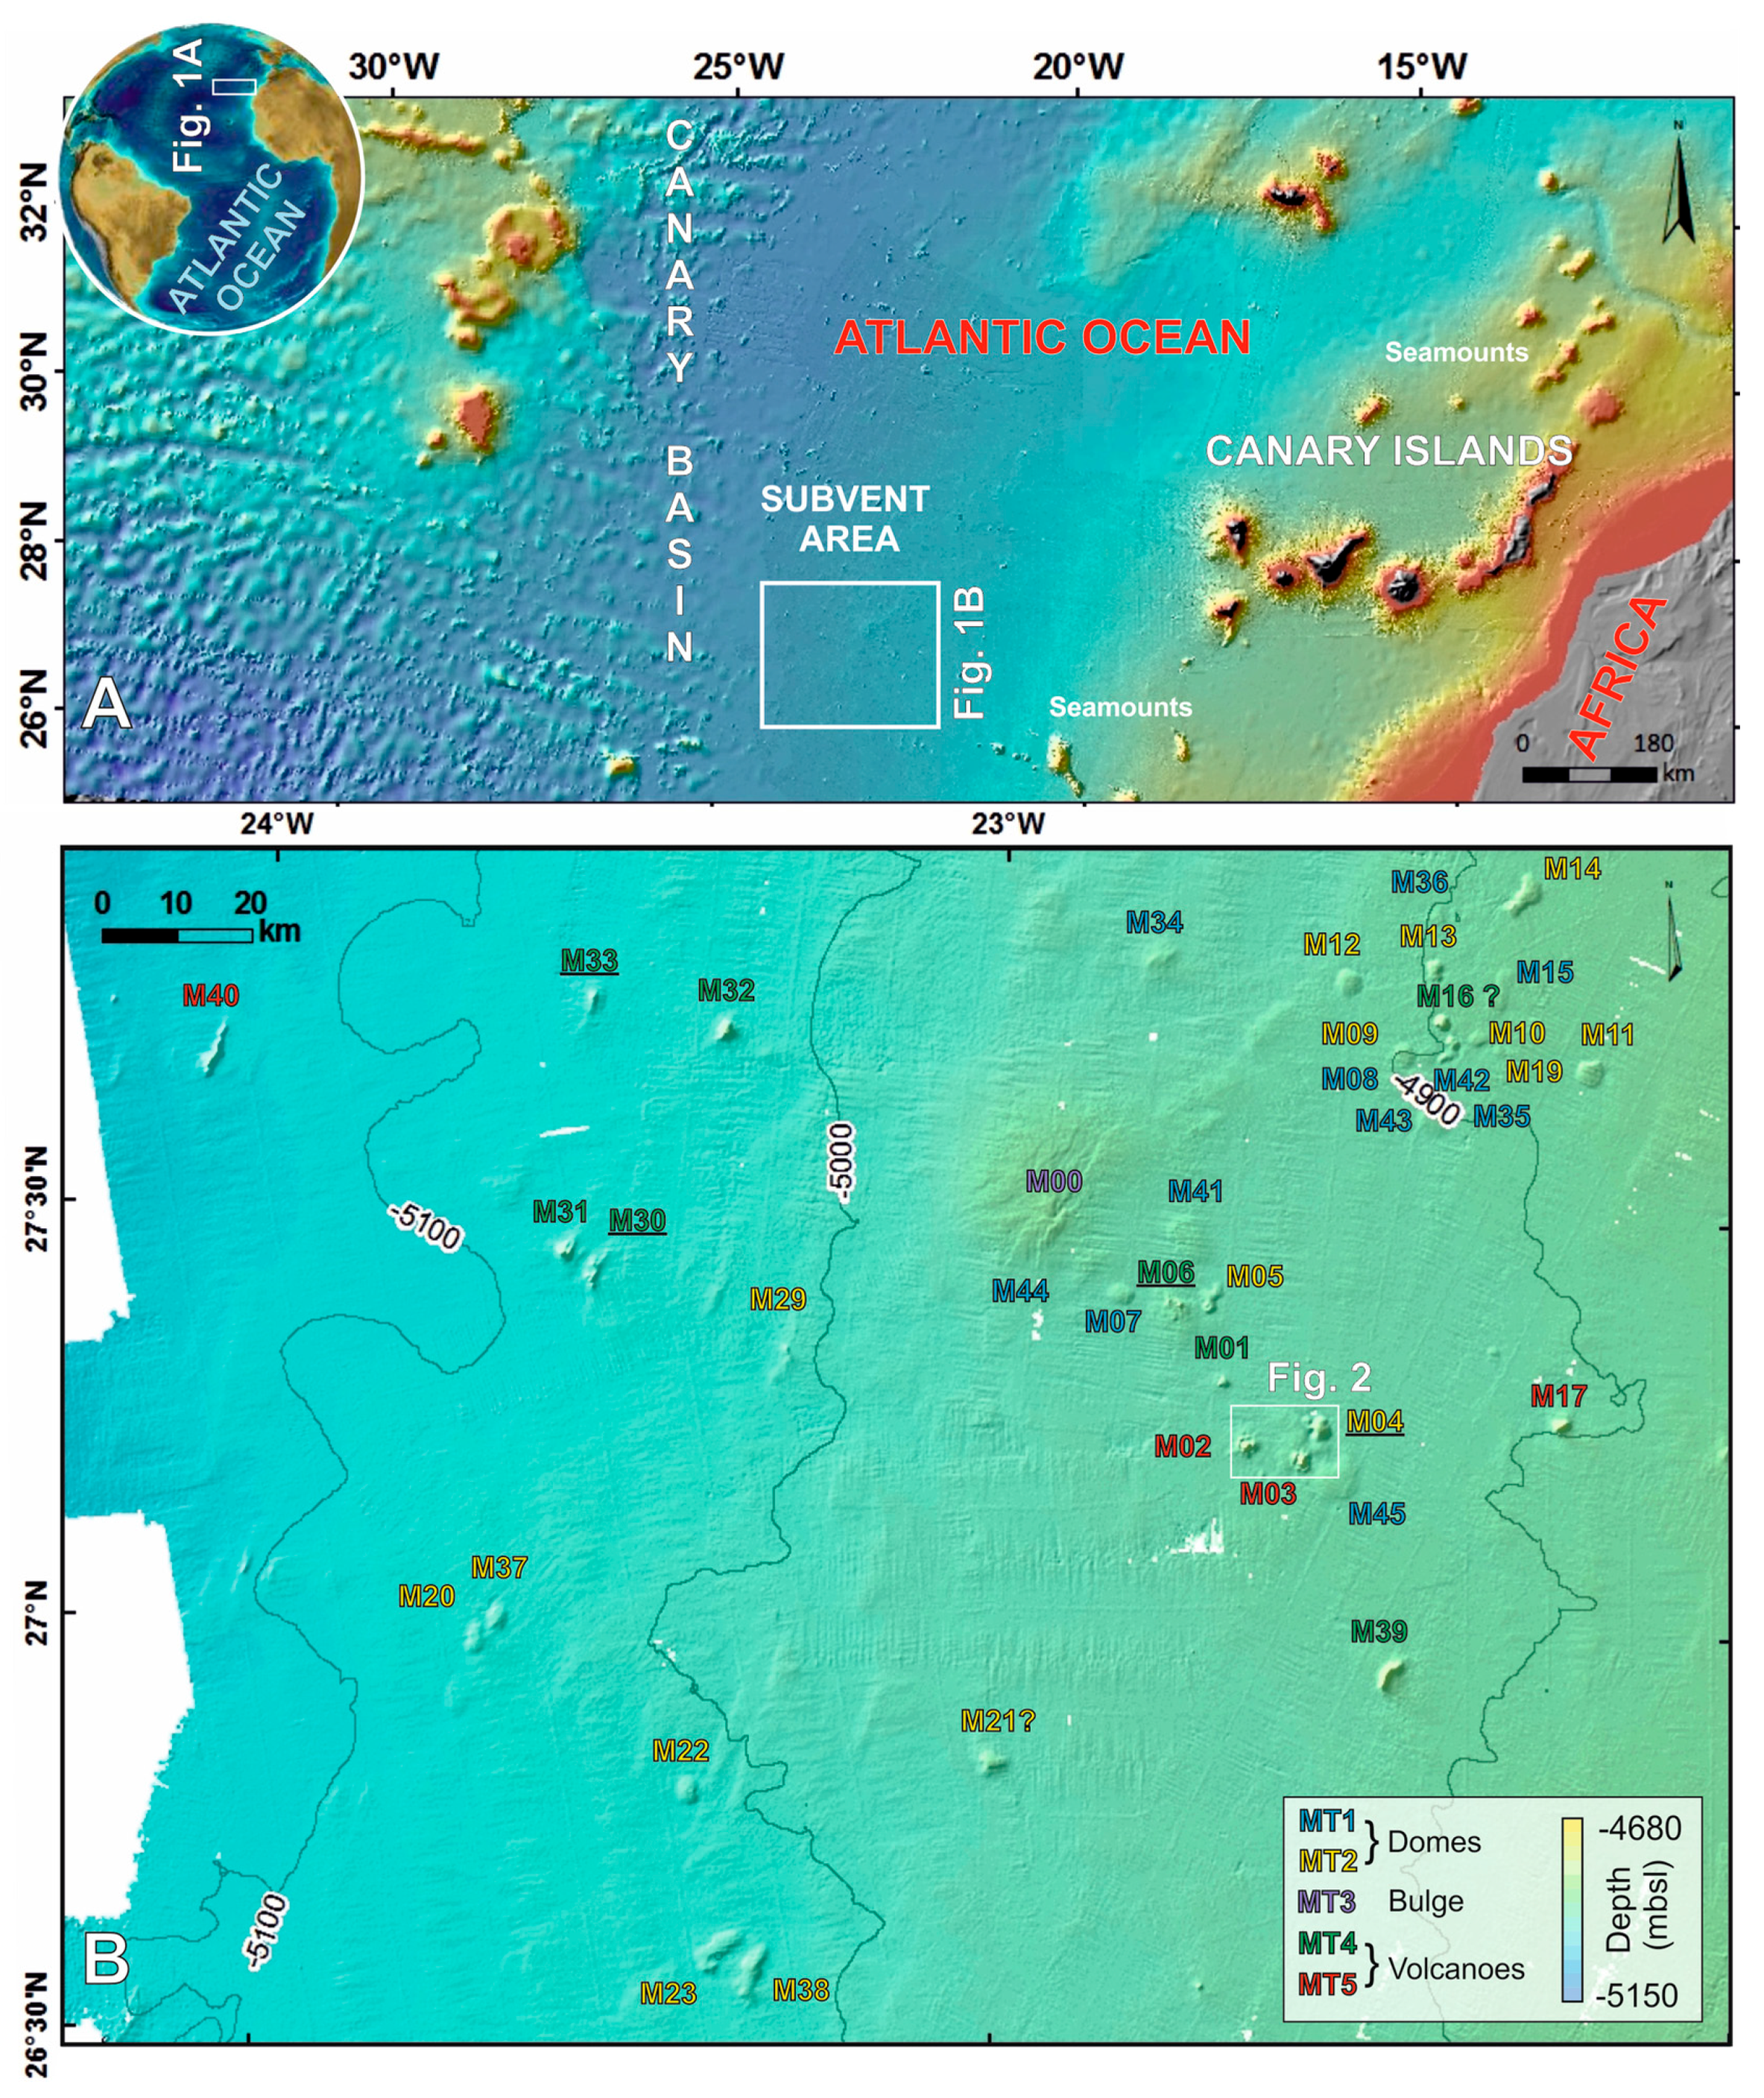
2. Study Area
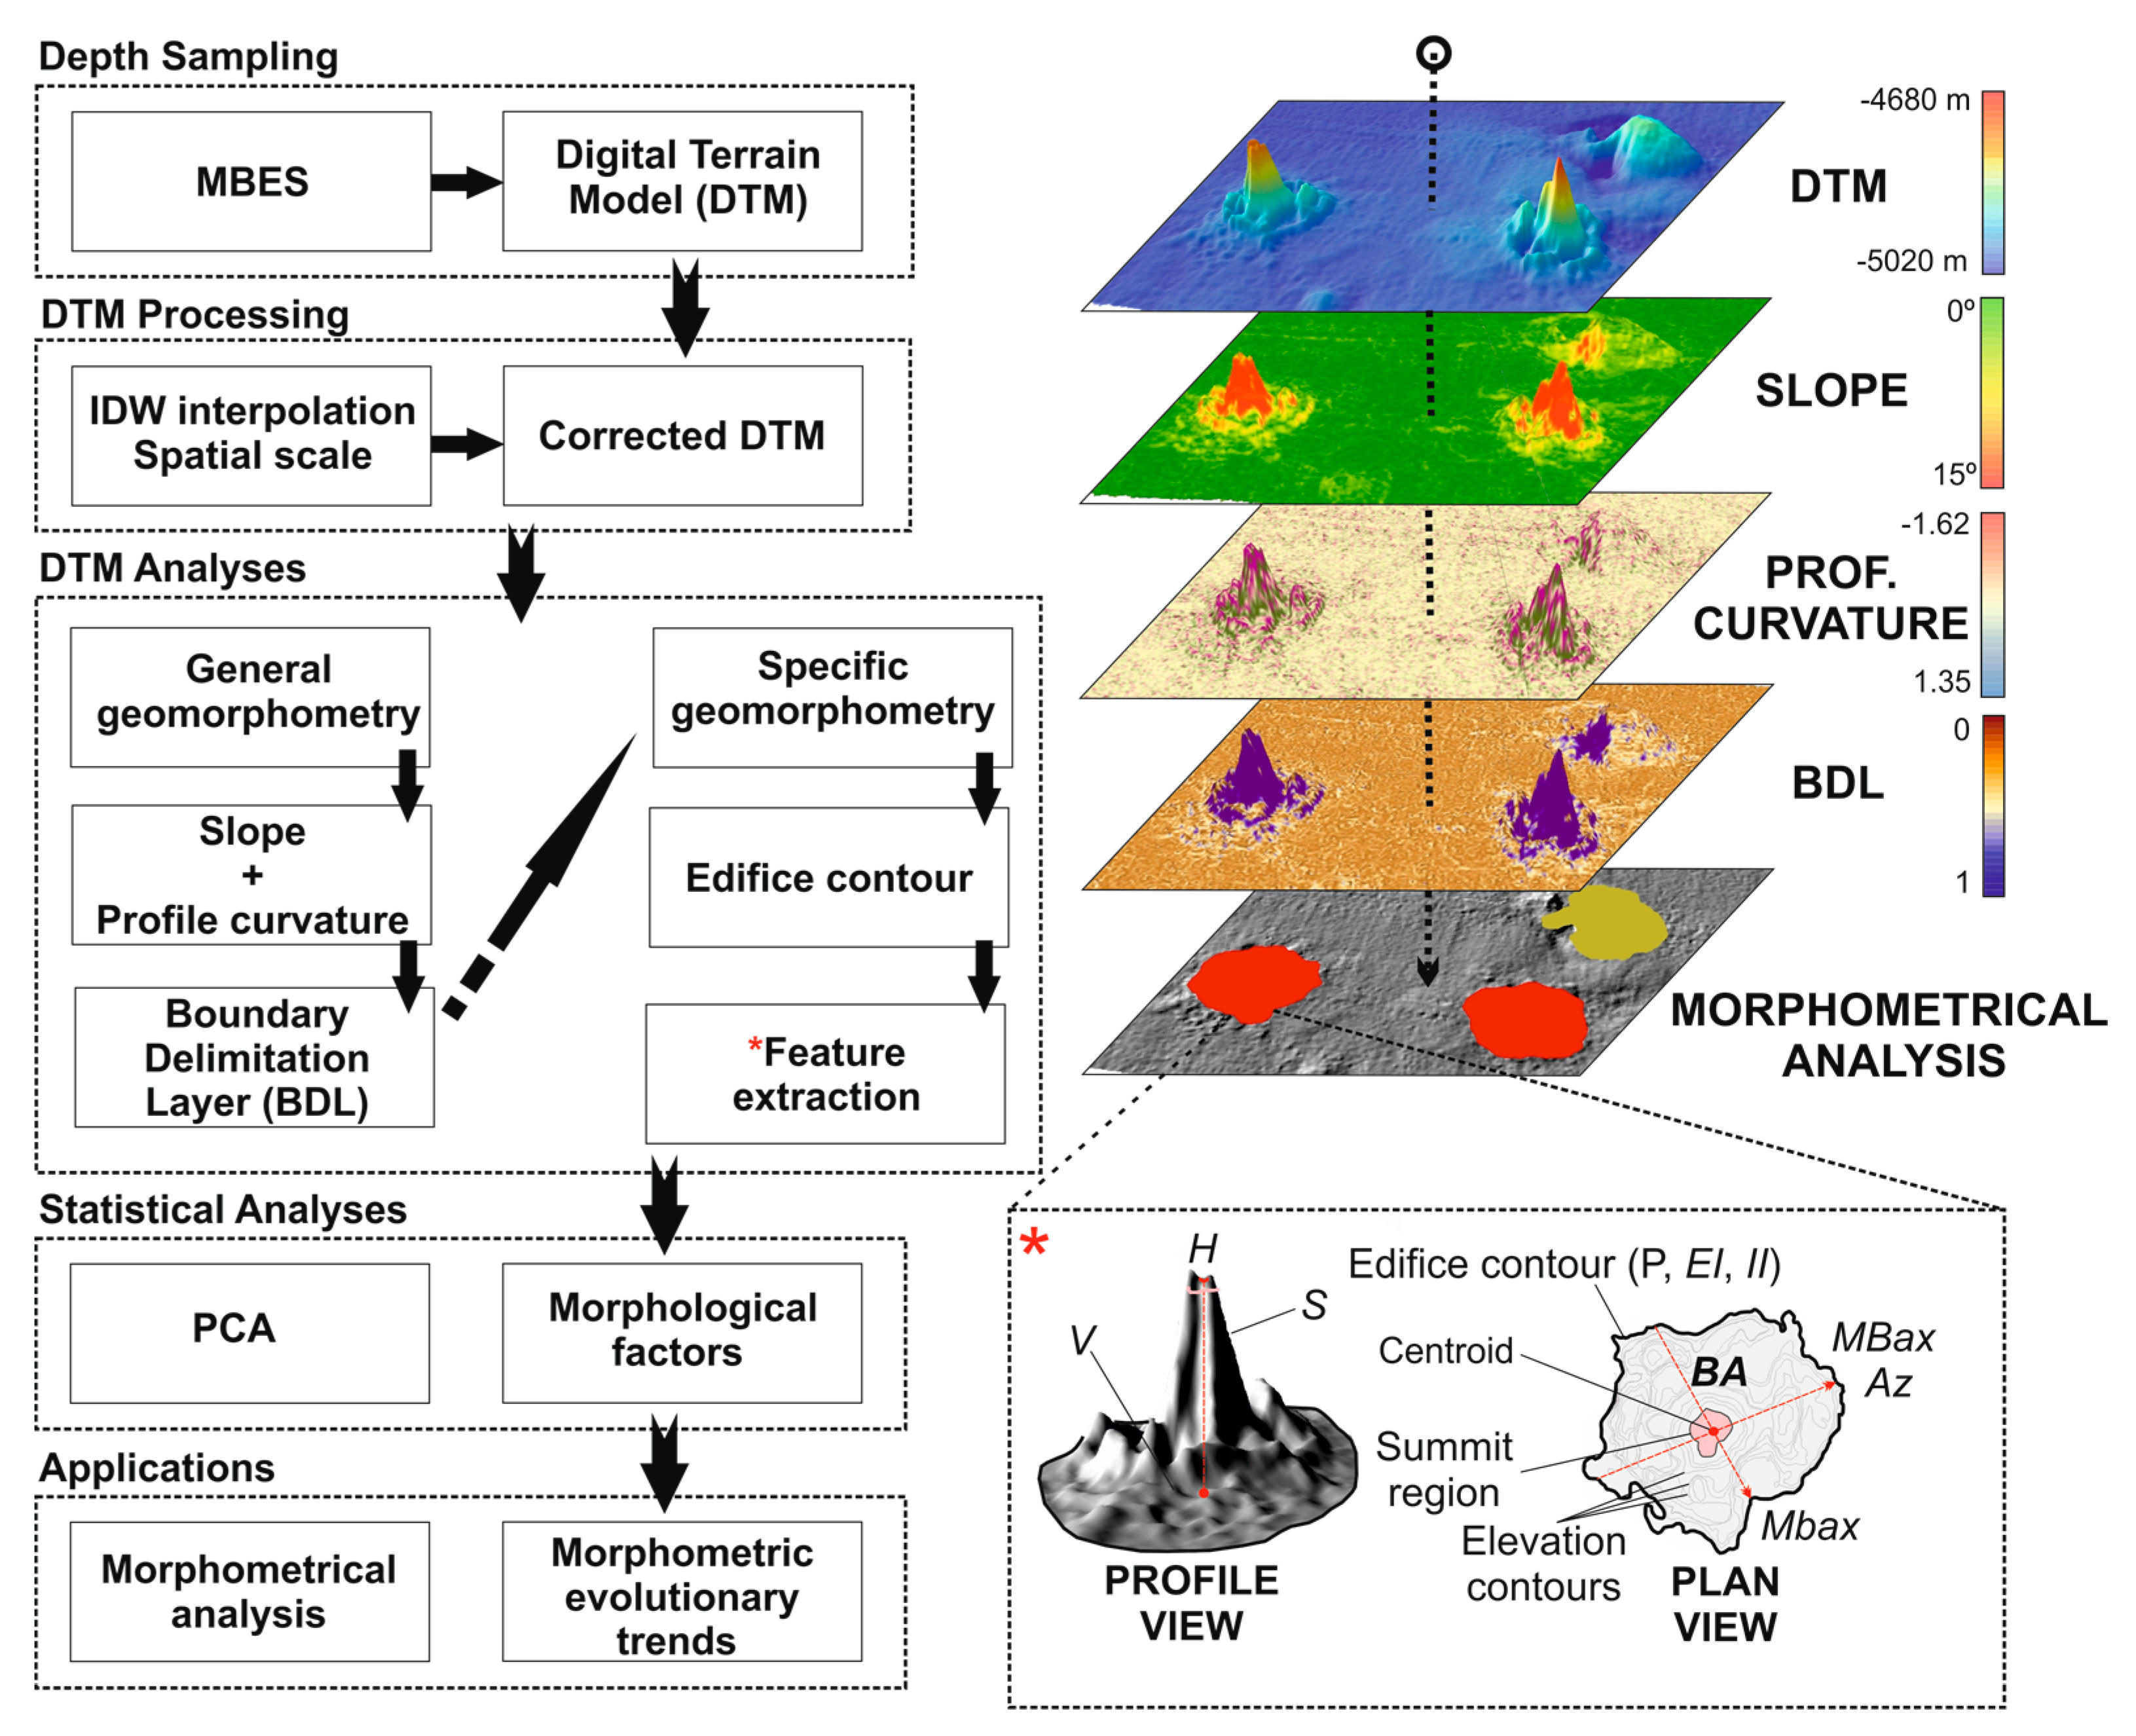
3. Method
3.1. Dataset Sampling and Processing
3.2. DEM Analyses: Delimiting the Contour and Morphometric Variables
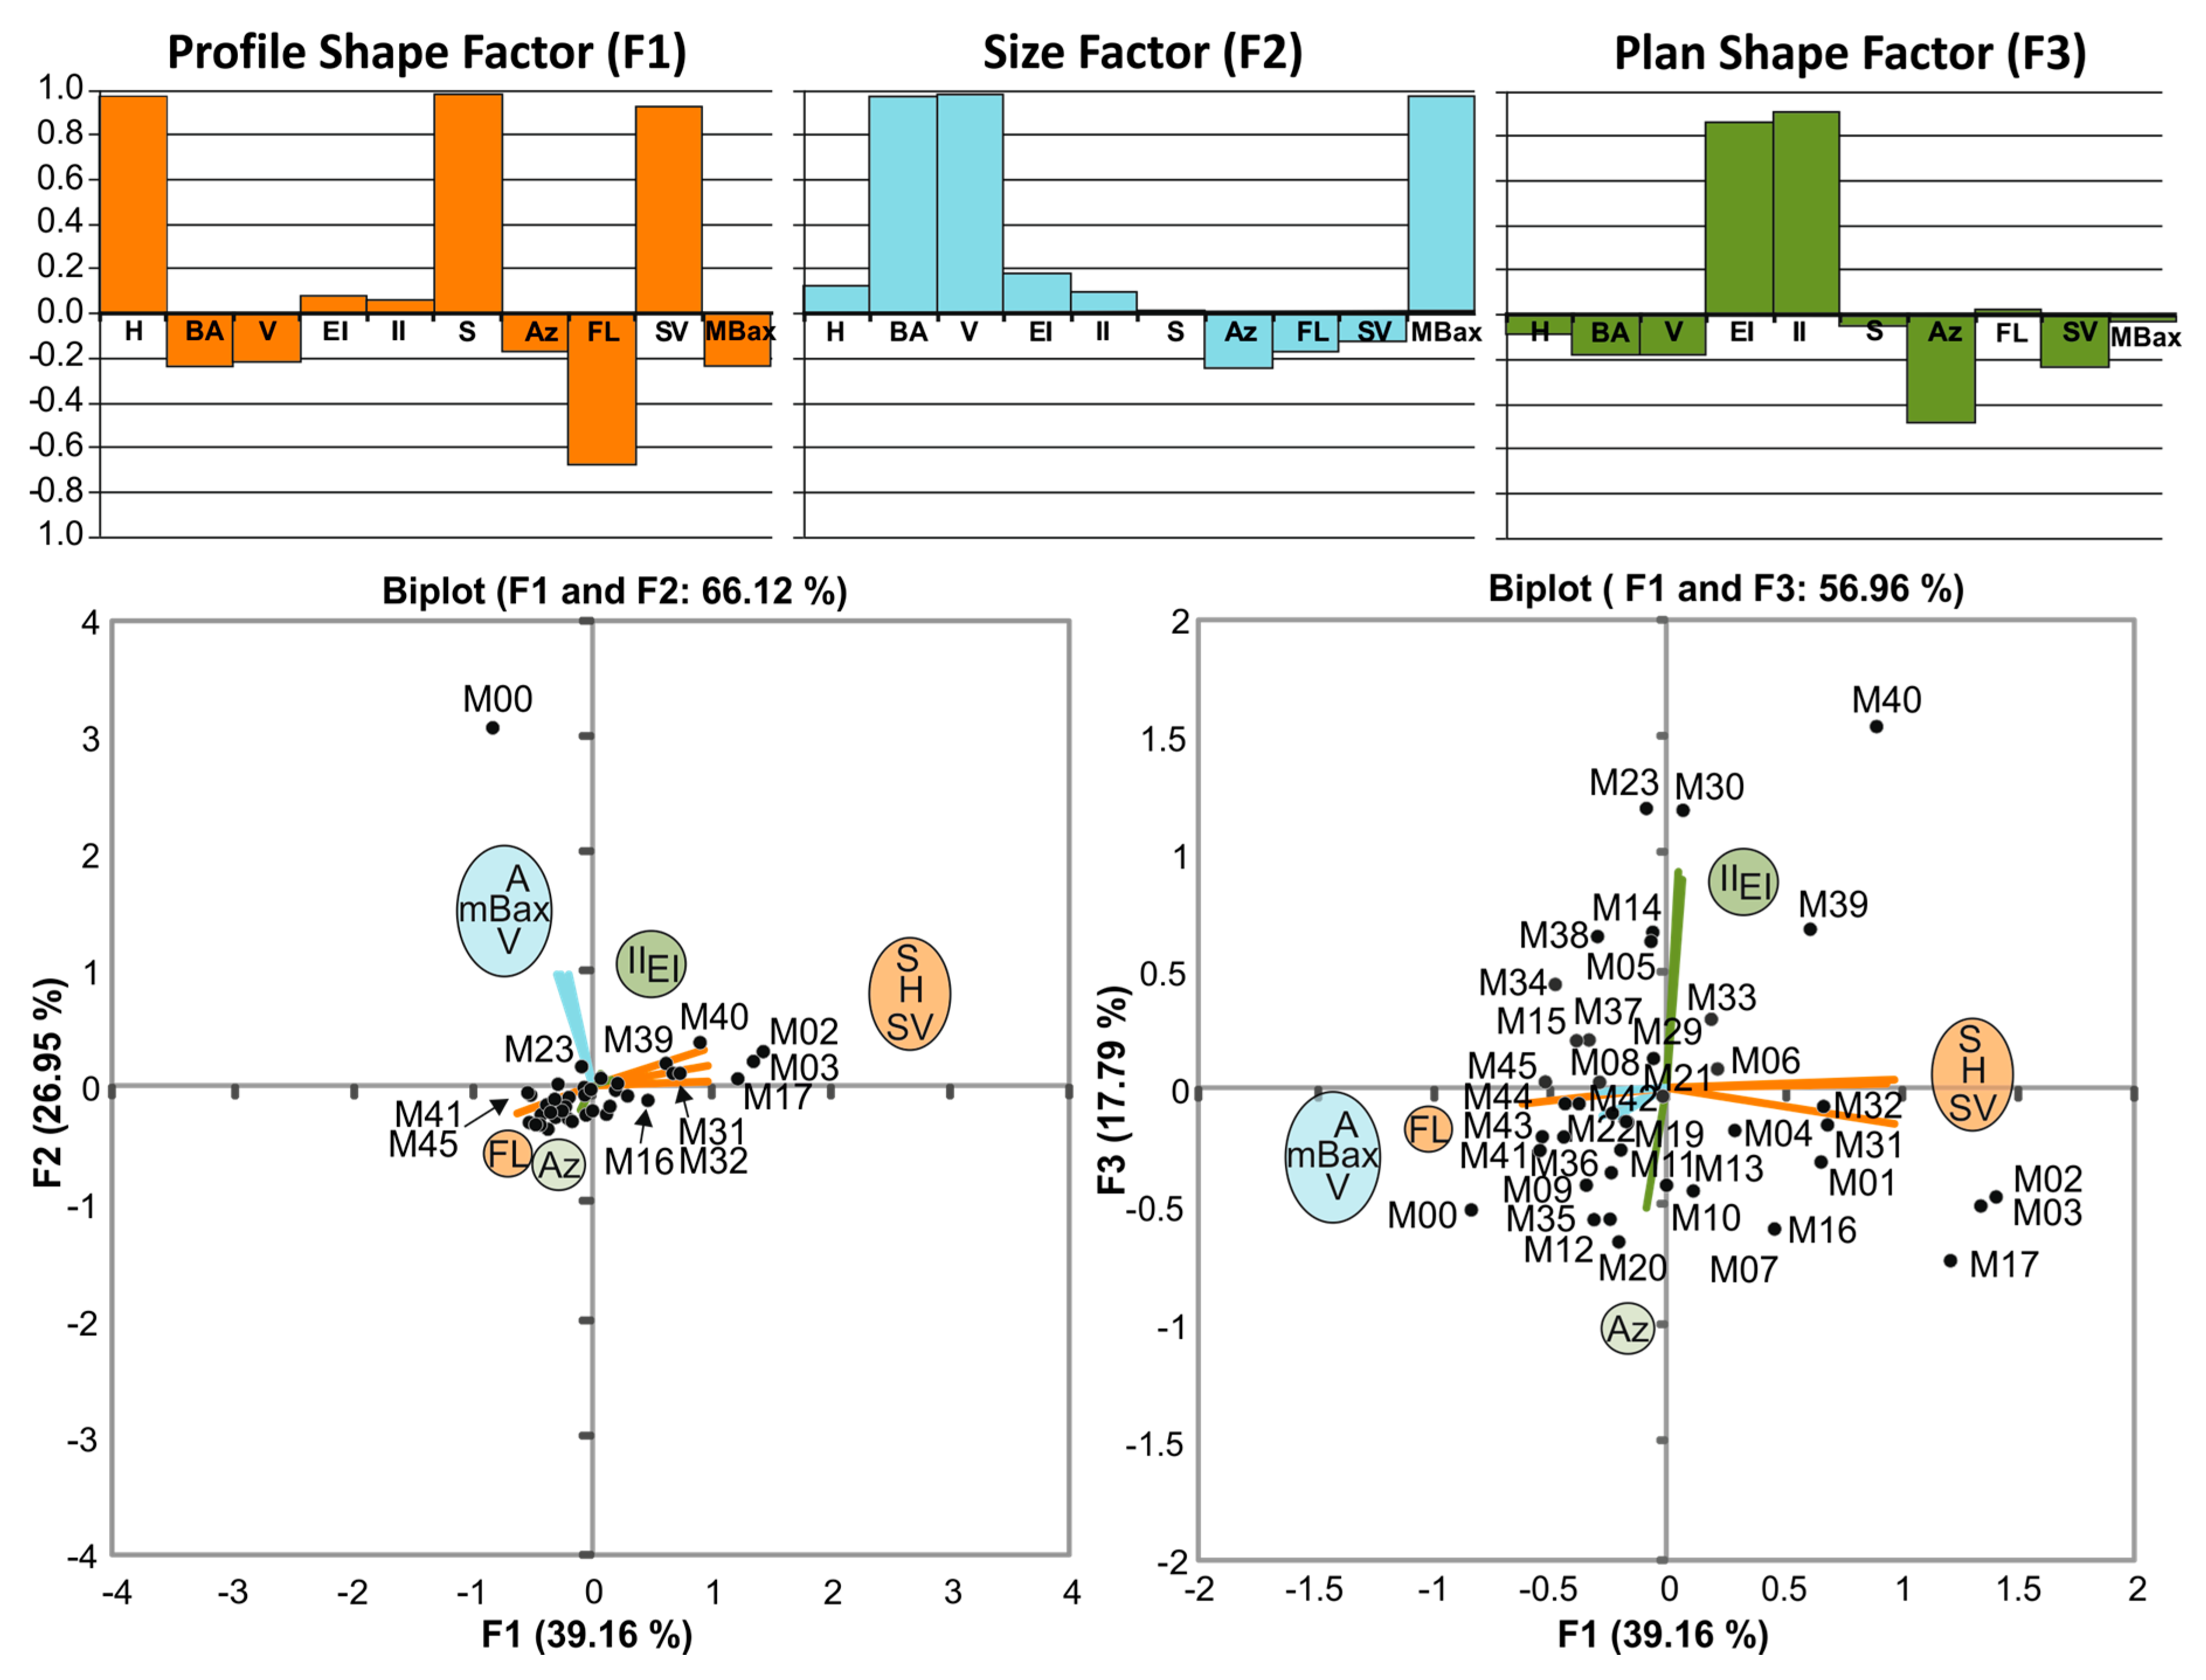
3.3. Principal Components Analysis
4. Results
4.1. Main Morphometric Variables
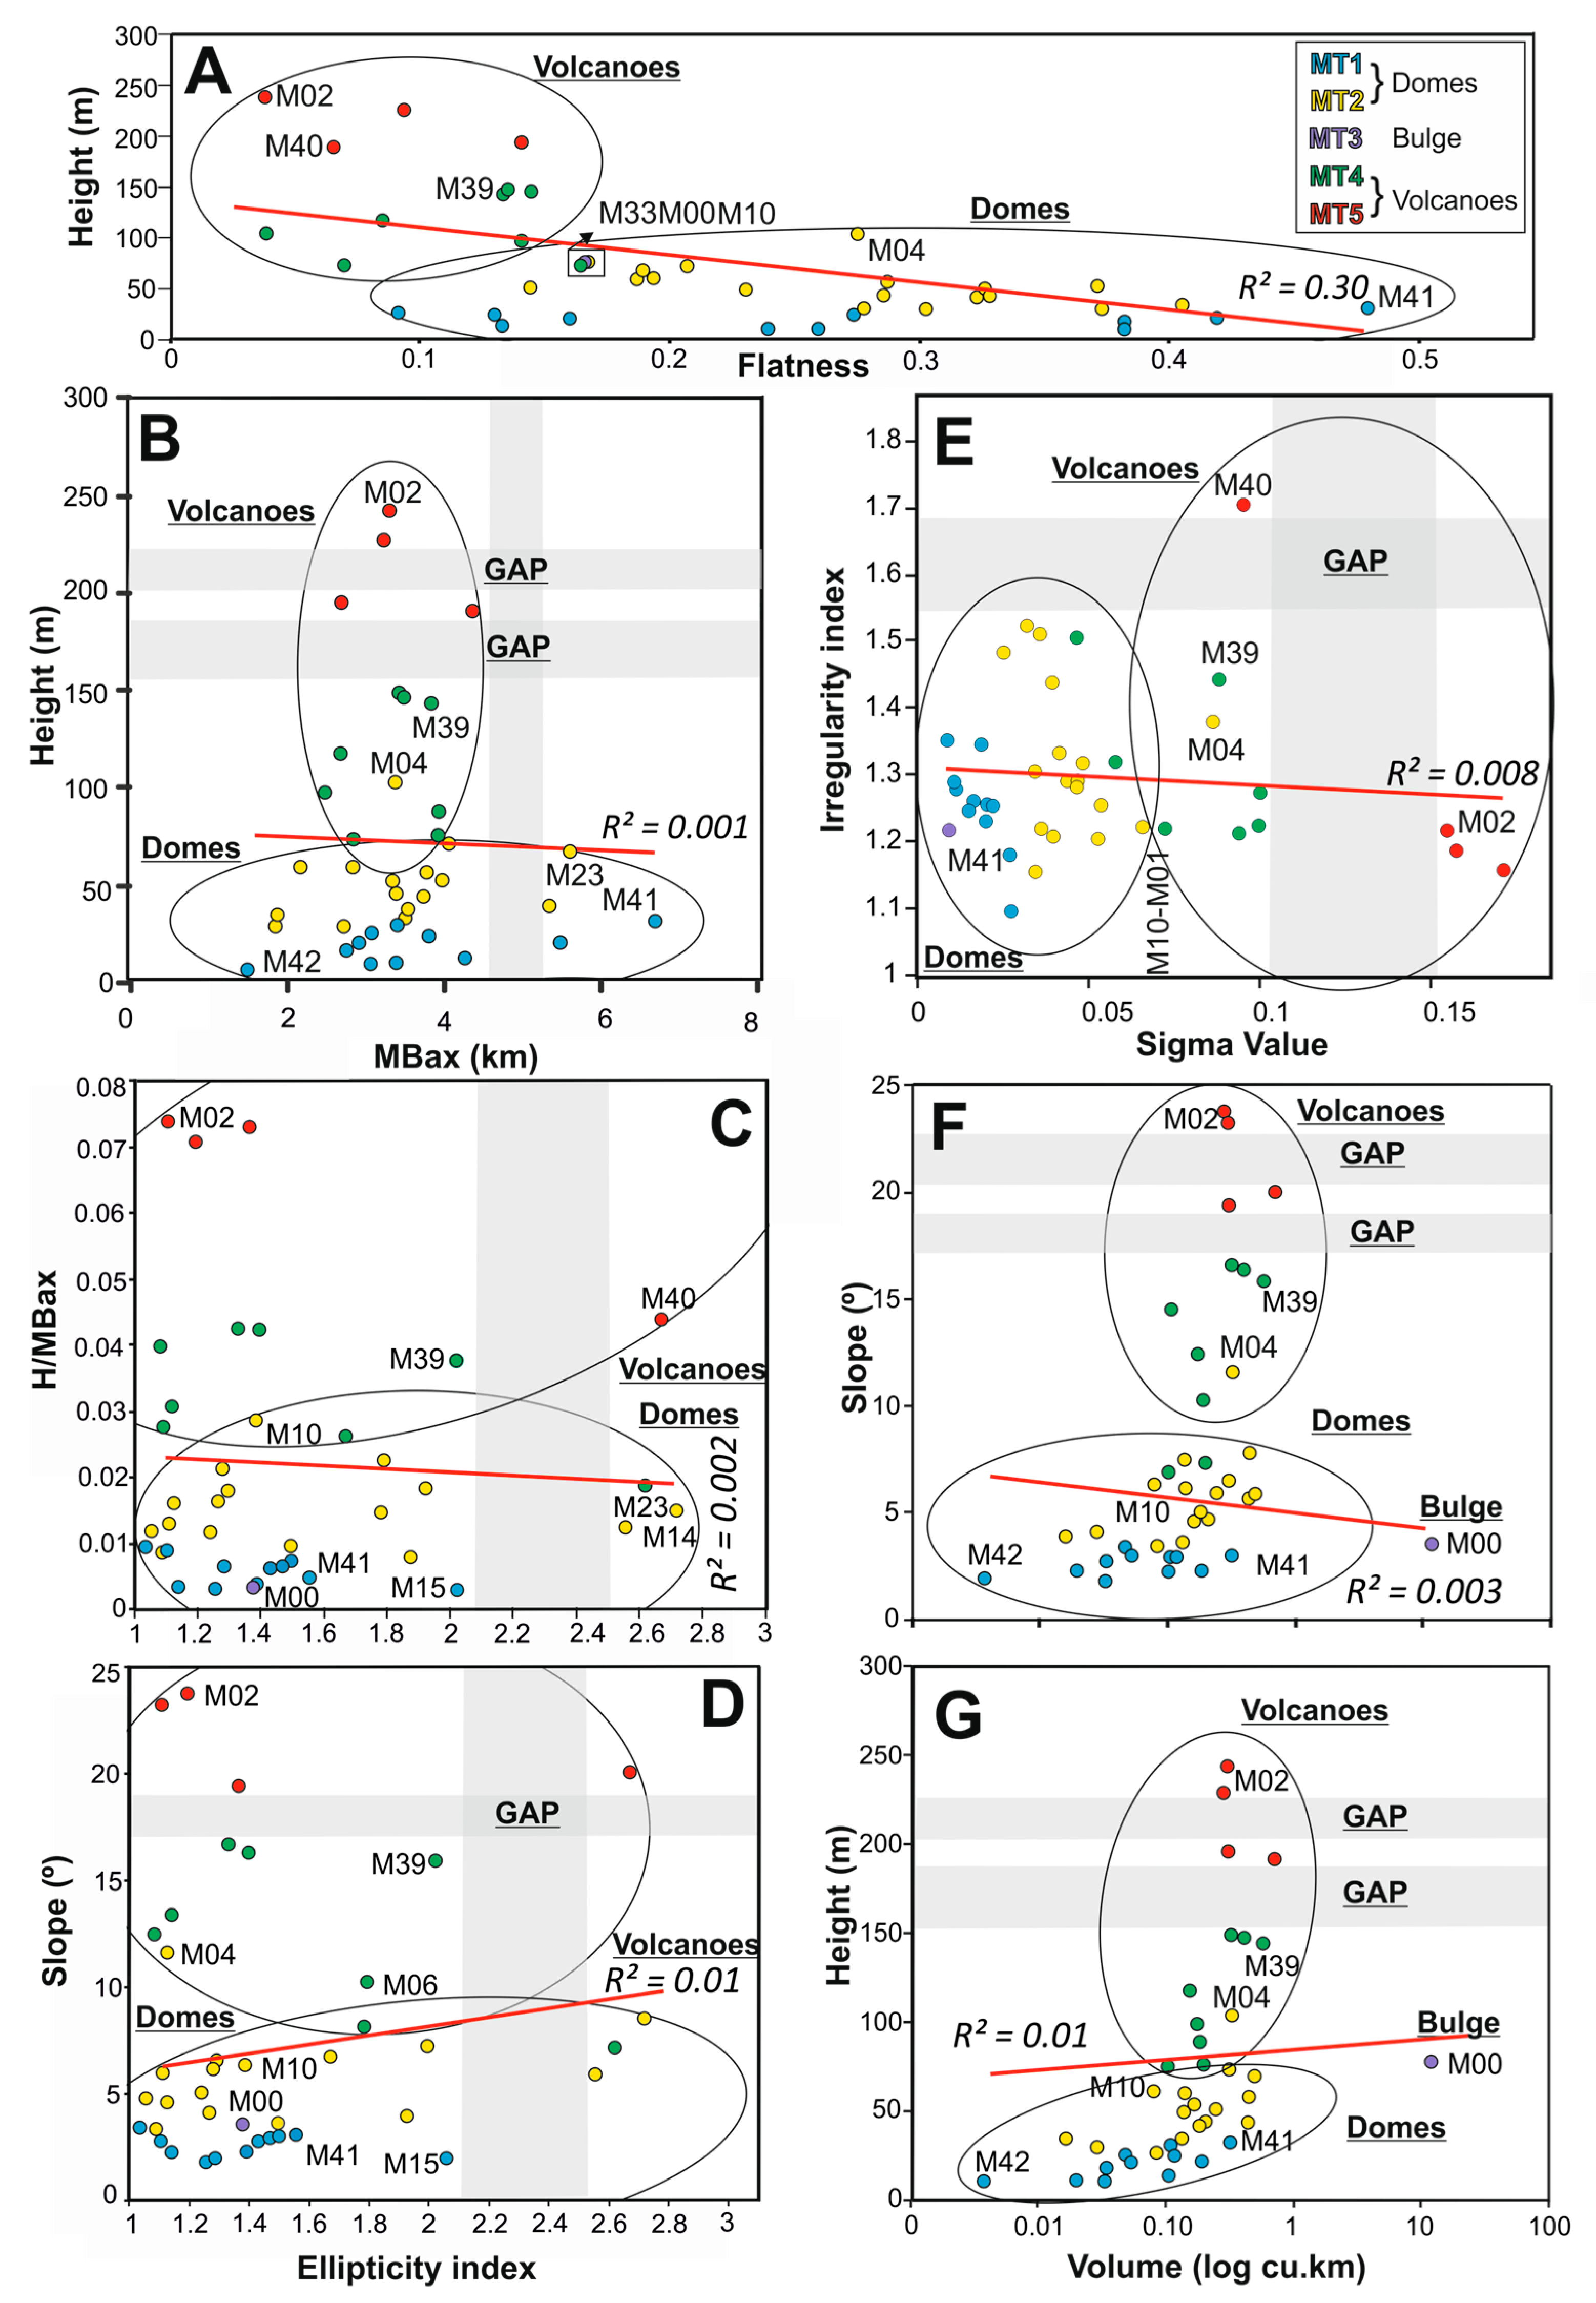
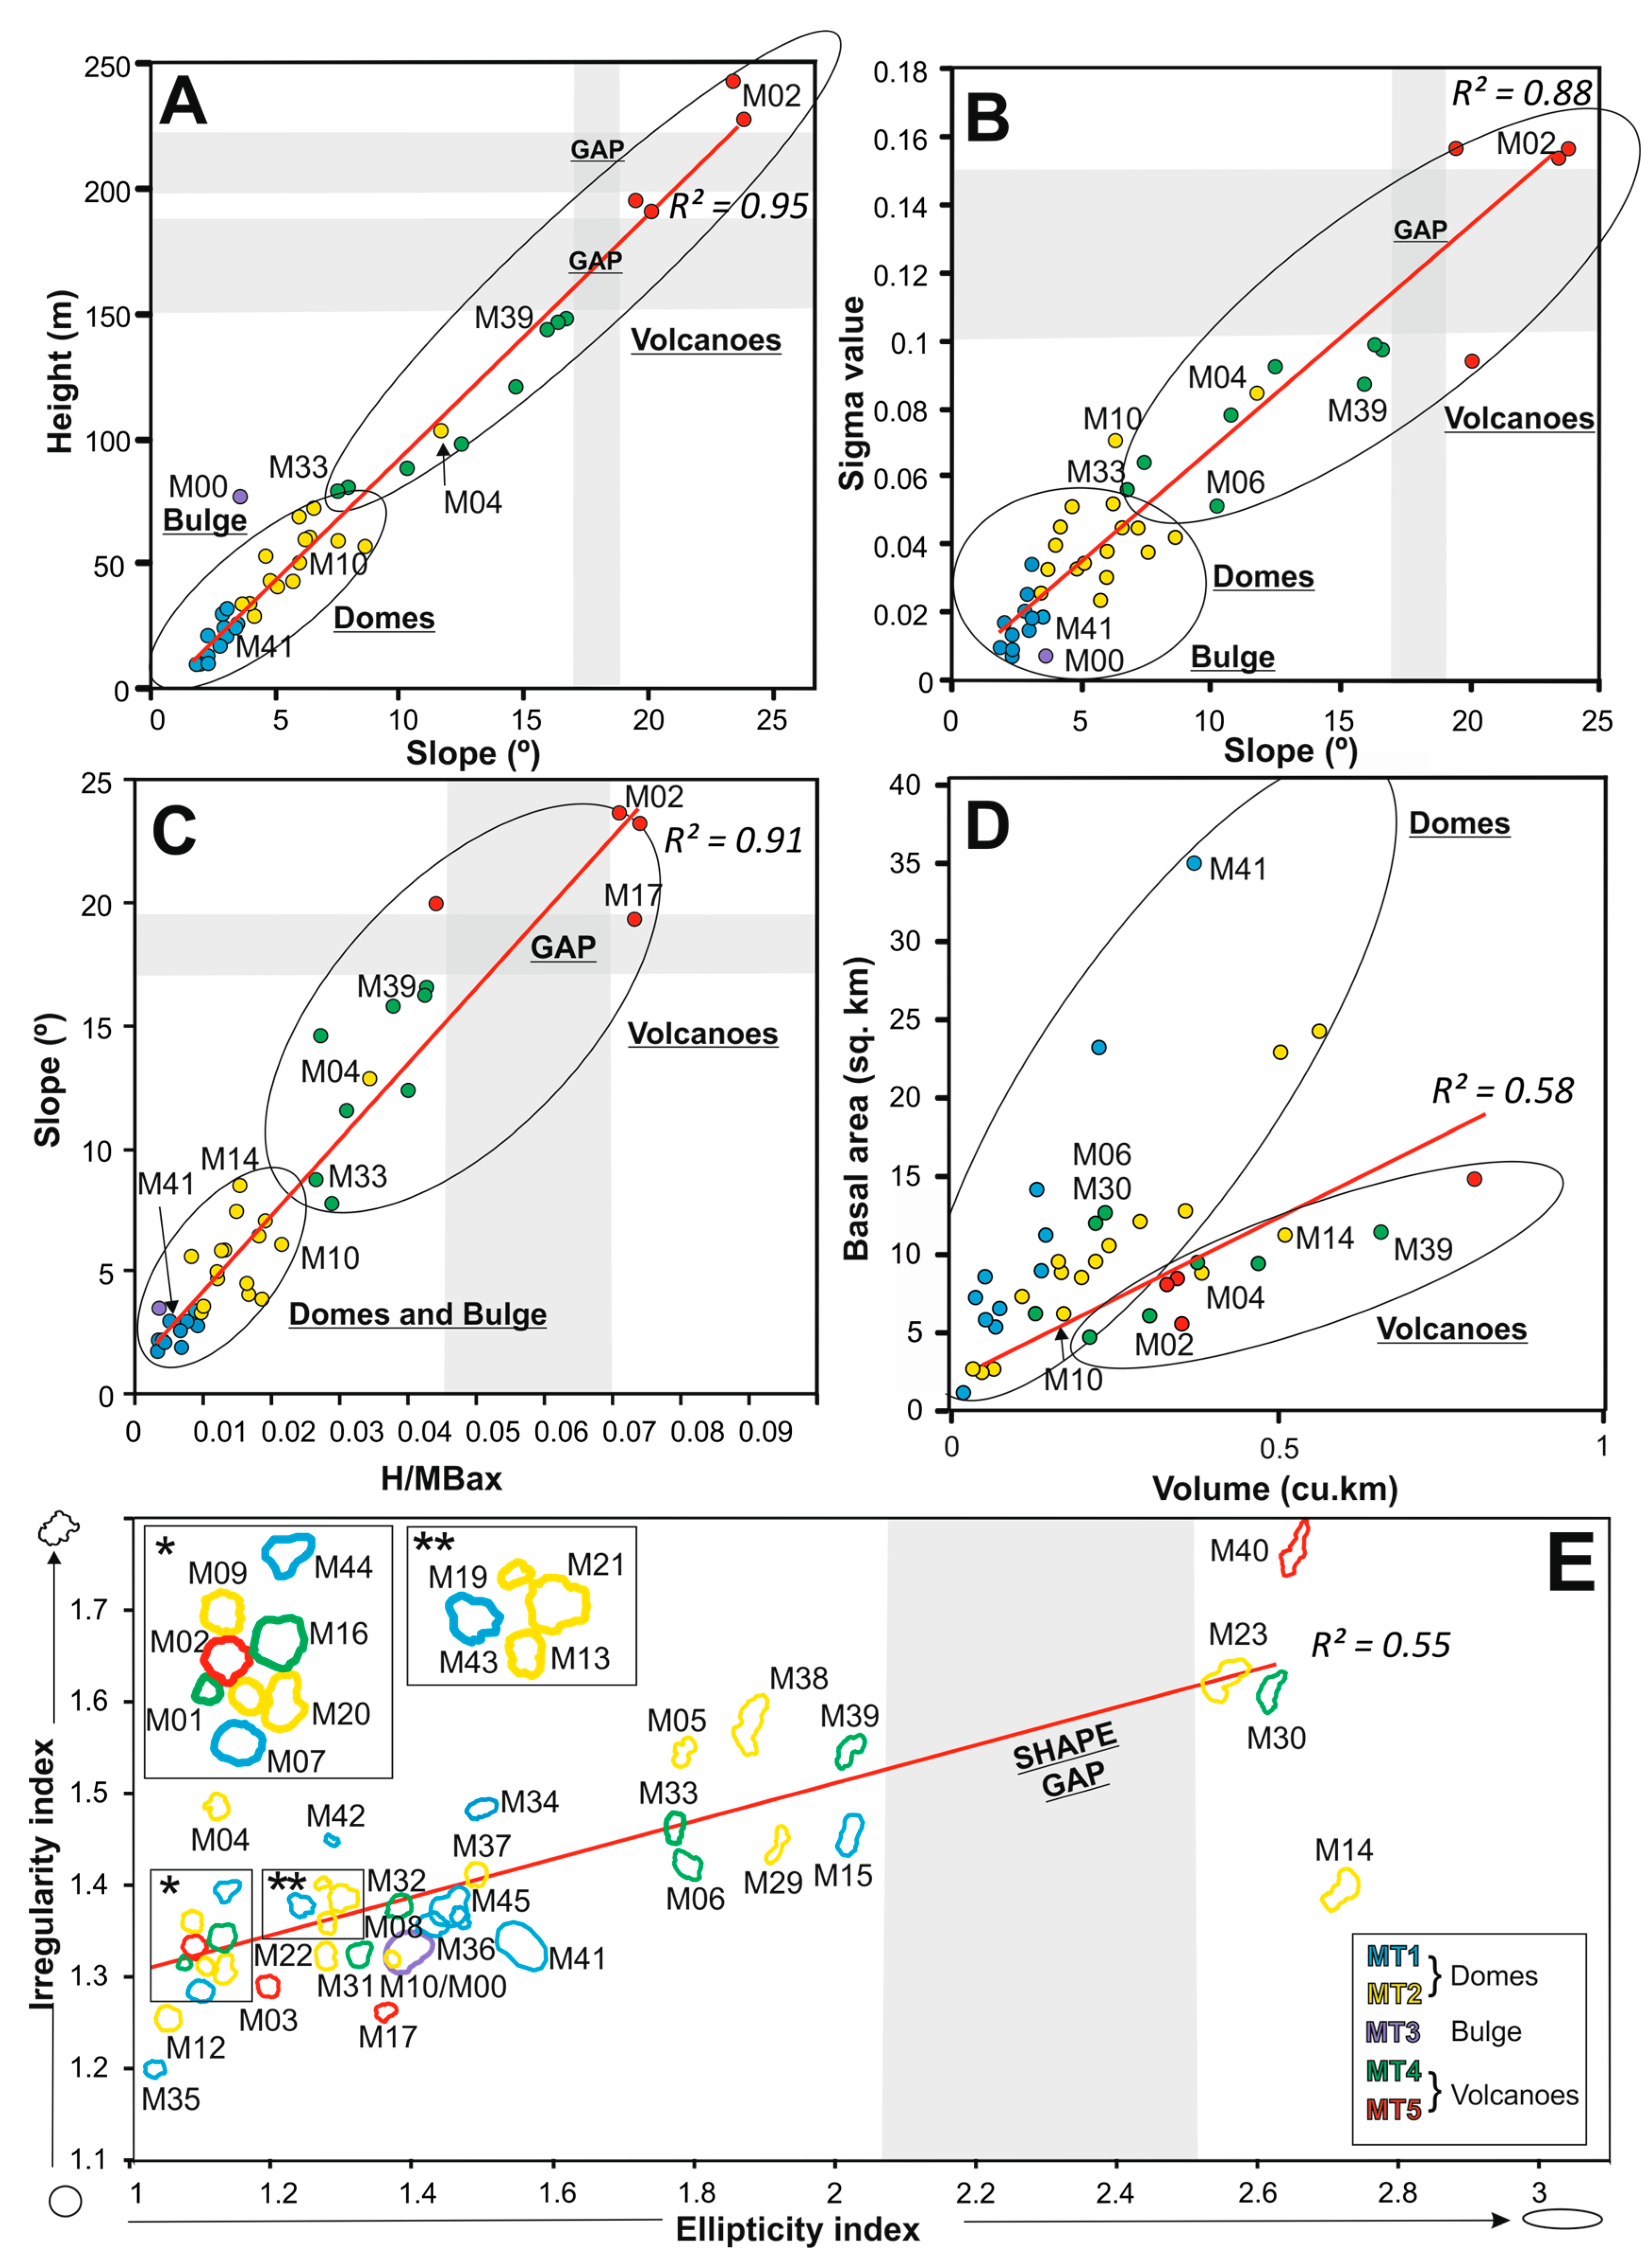
4.2. Relationships between the Main Morphometric Variables
4.2.1. Profile Shape Factor (F1)
4.2.2. Size Factor (F2)
4.2.3. Basal Shape Factor (F3)
4.2.4. Other Morphometric Relationships
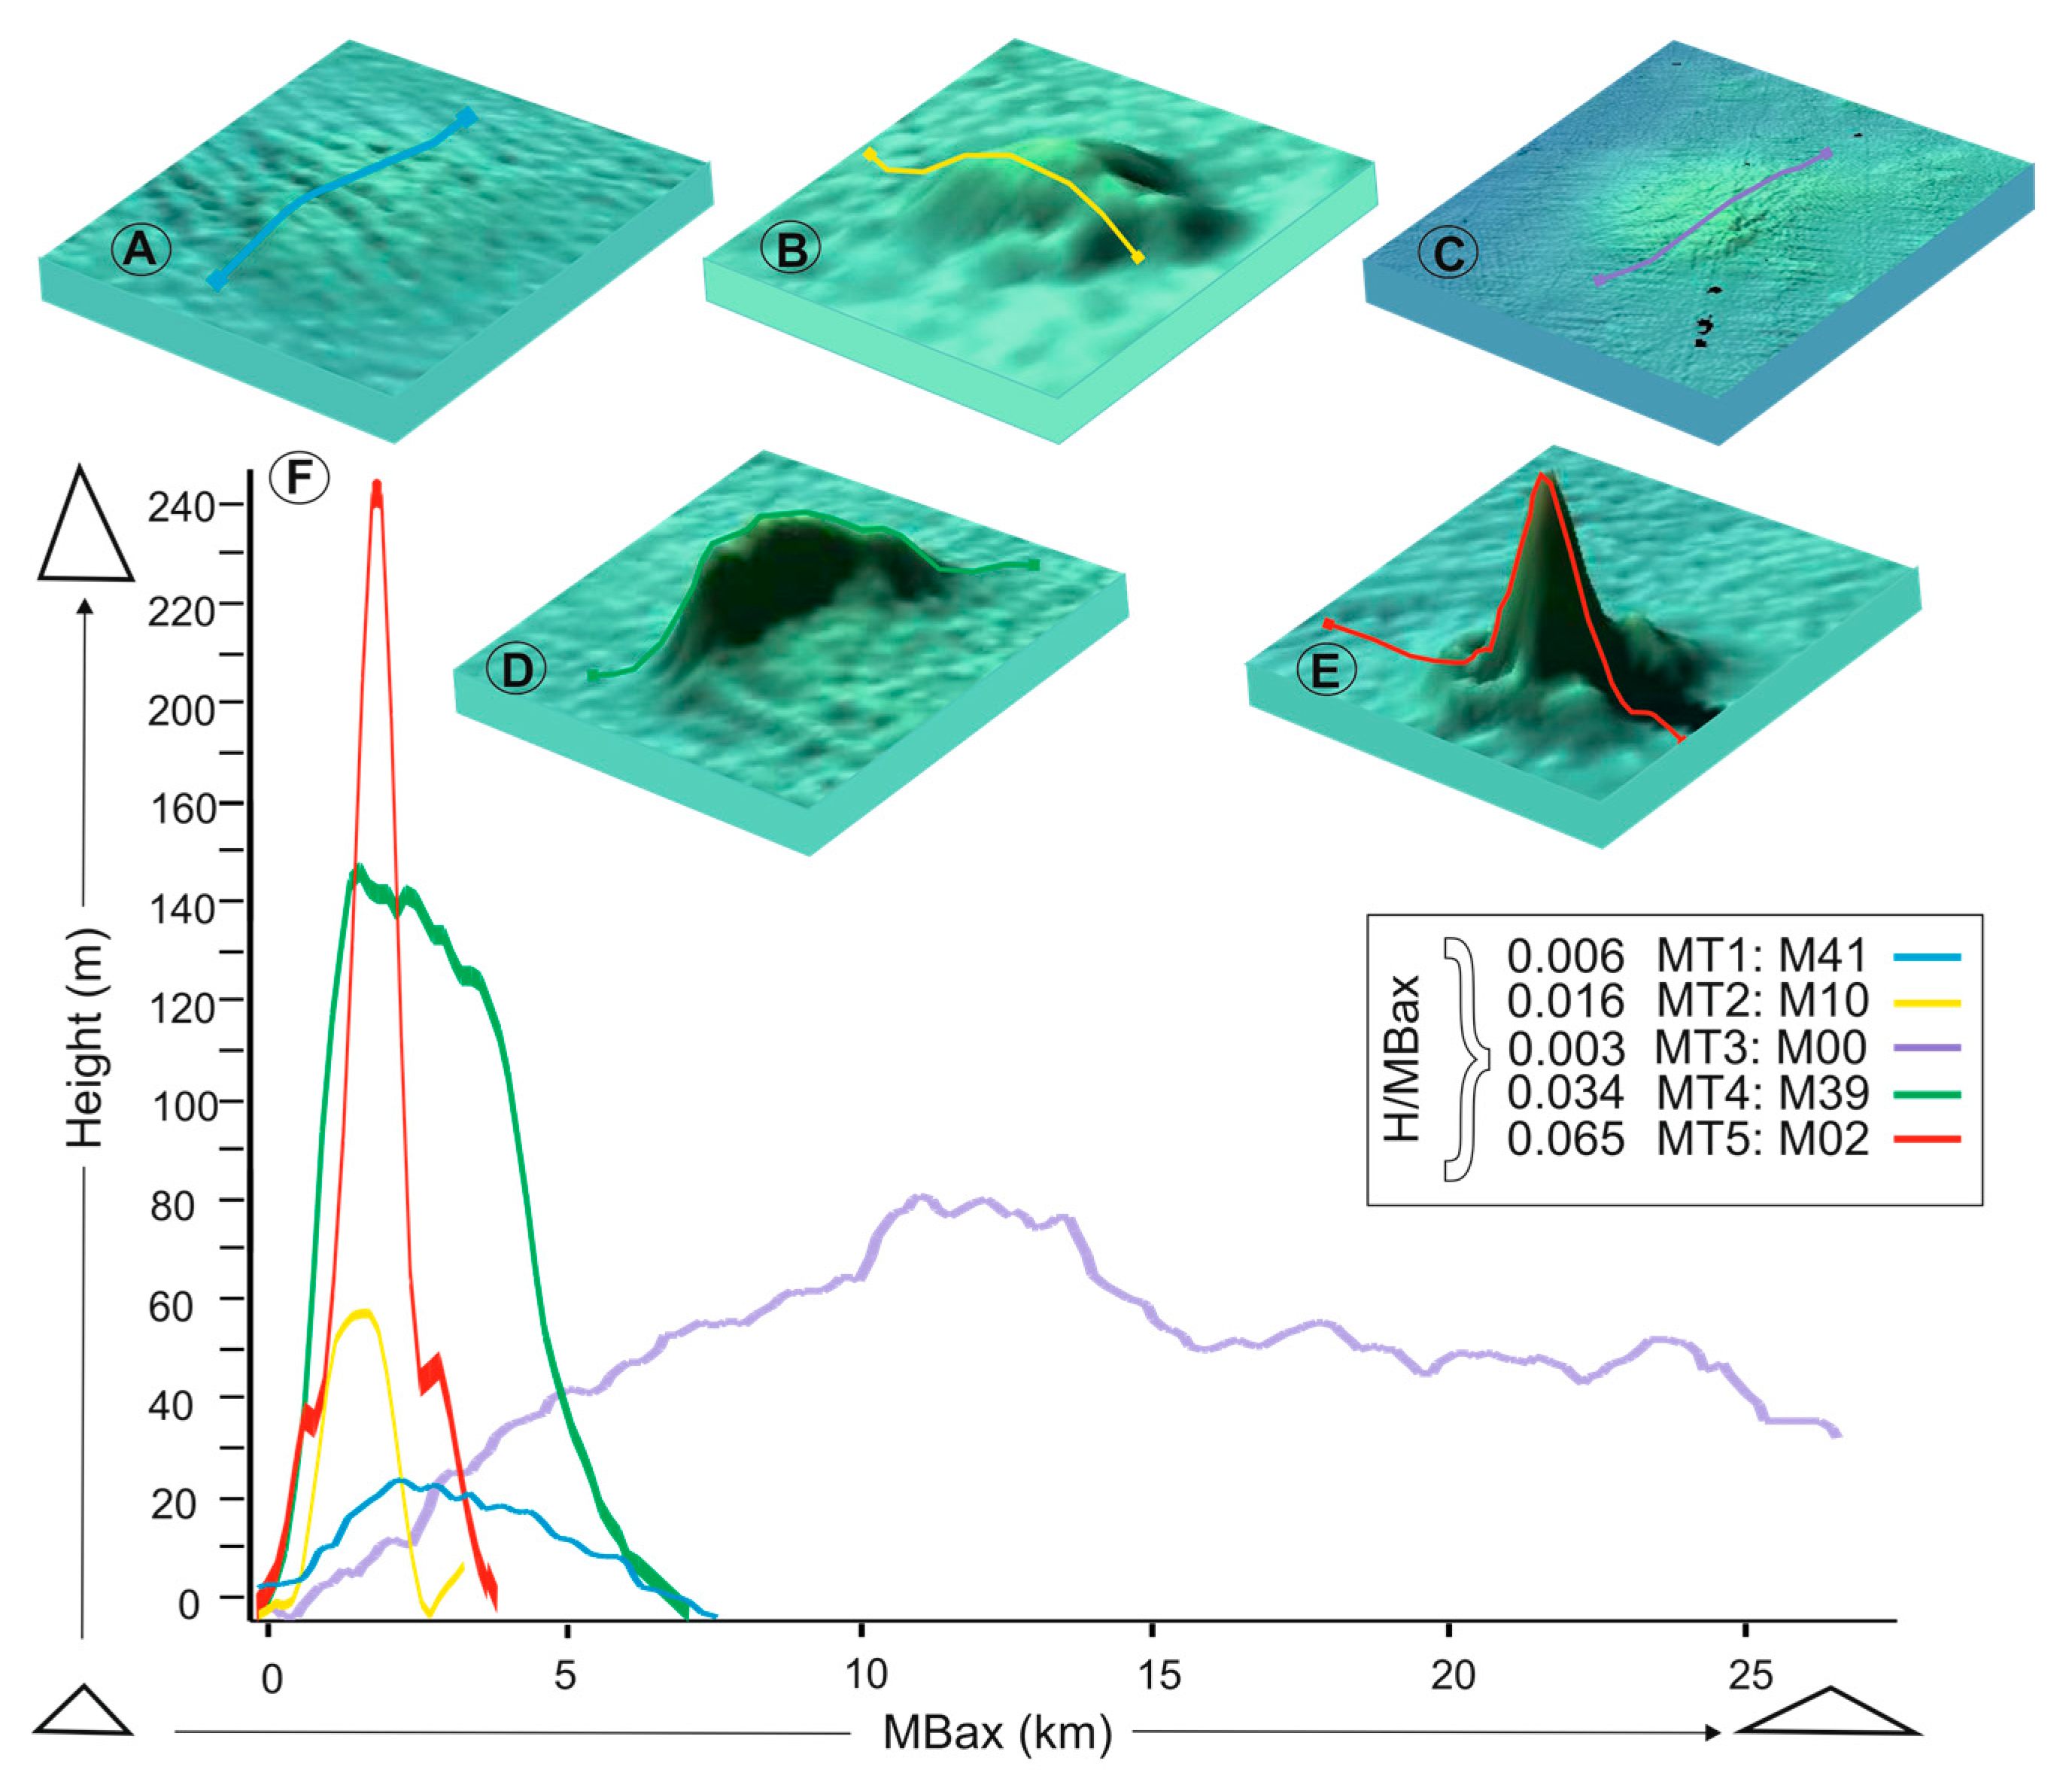
4.3. Geomorphometric Observations on the Morphological Types
5. Discussion
5.1. Relevance of Morphological Variables in the Geomorphometry of the Mounds
5.2. Morphometry of the Domes
5.3. Morphometry of the Volcanoes
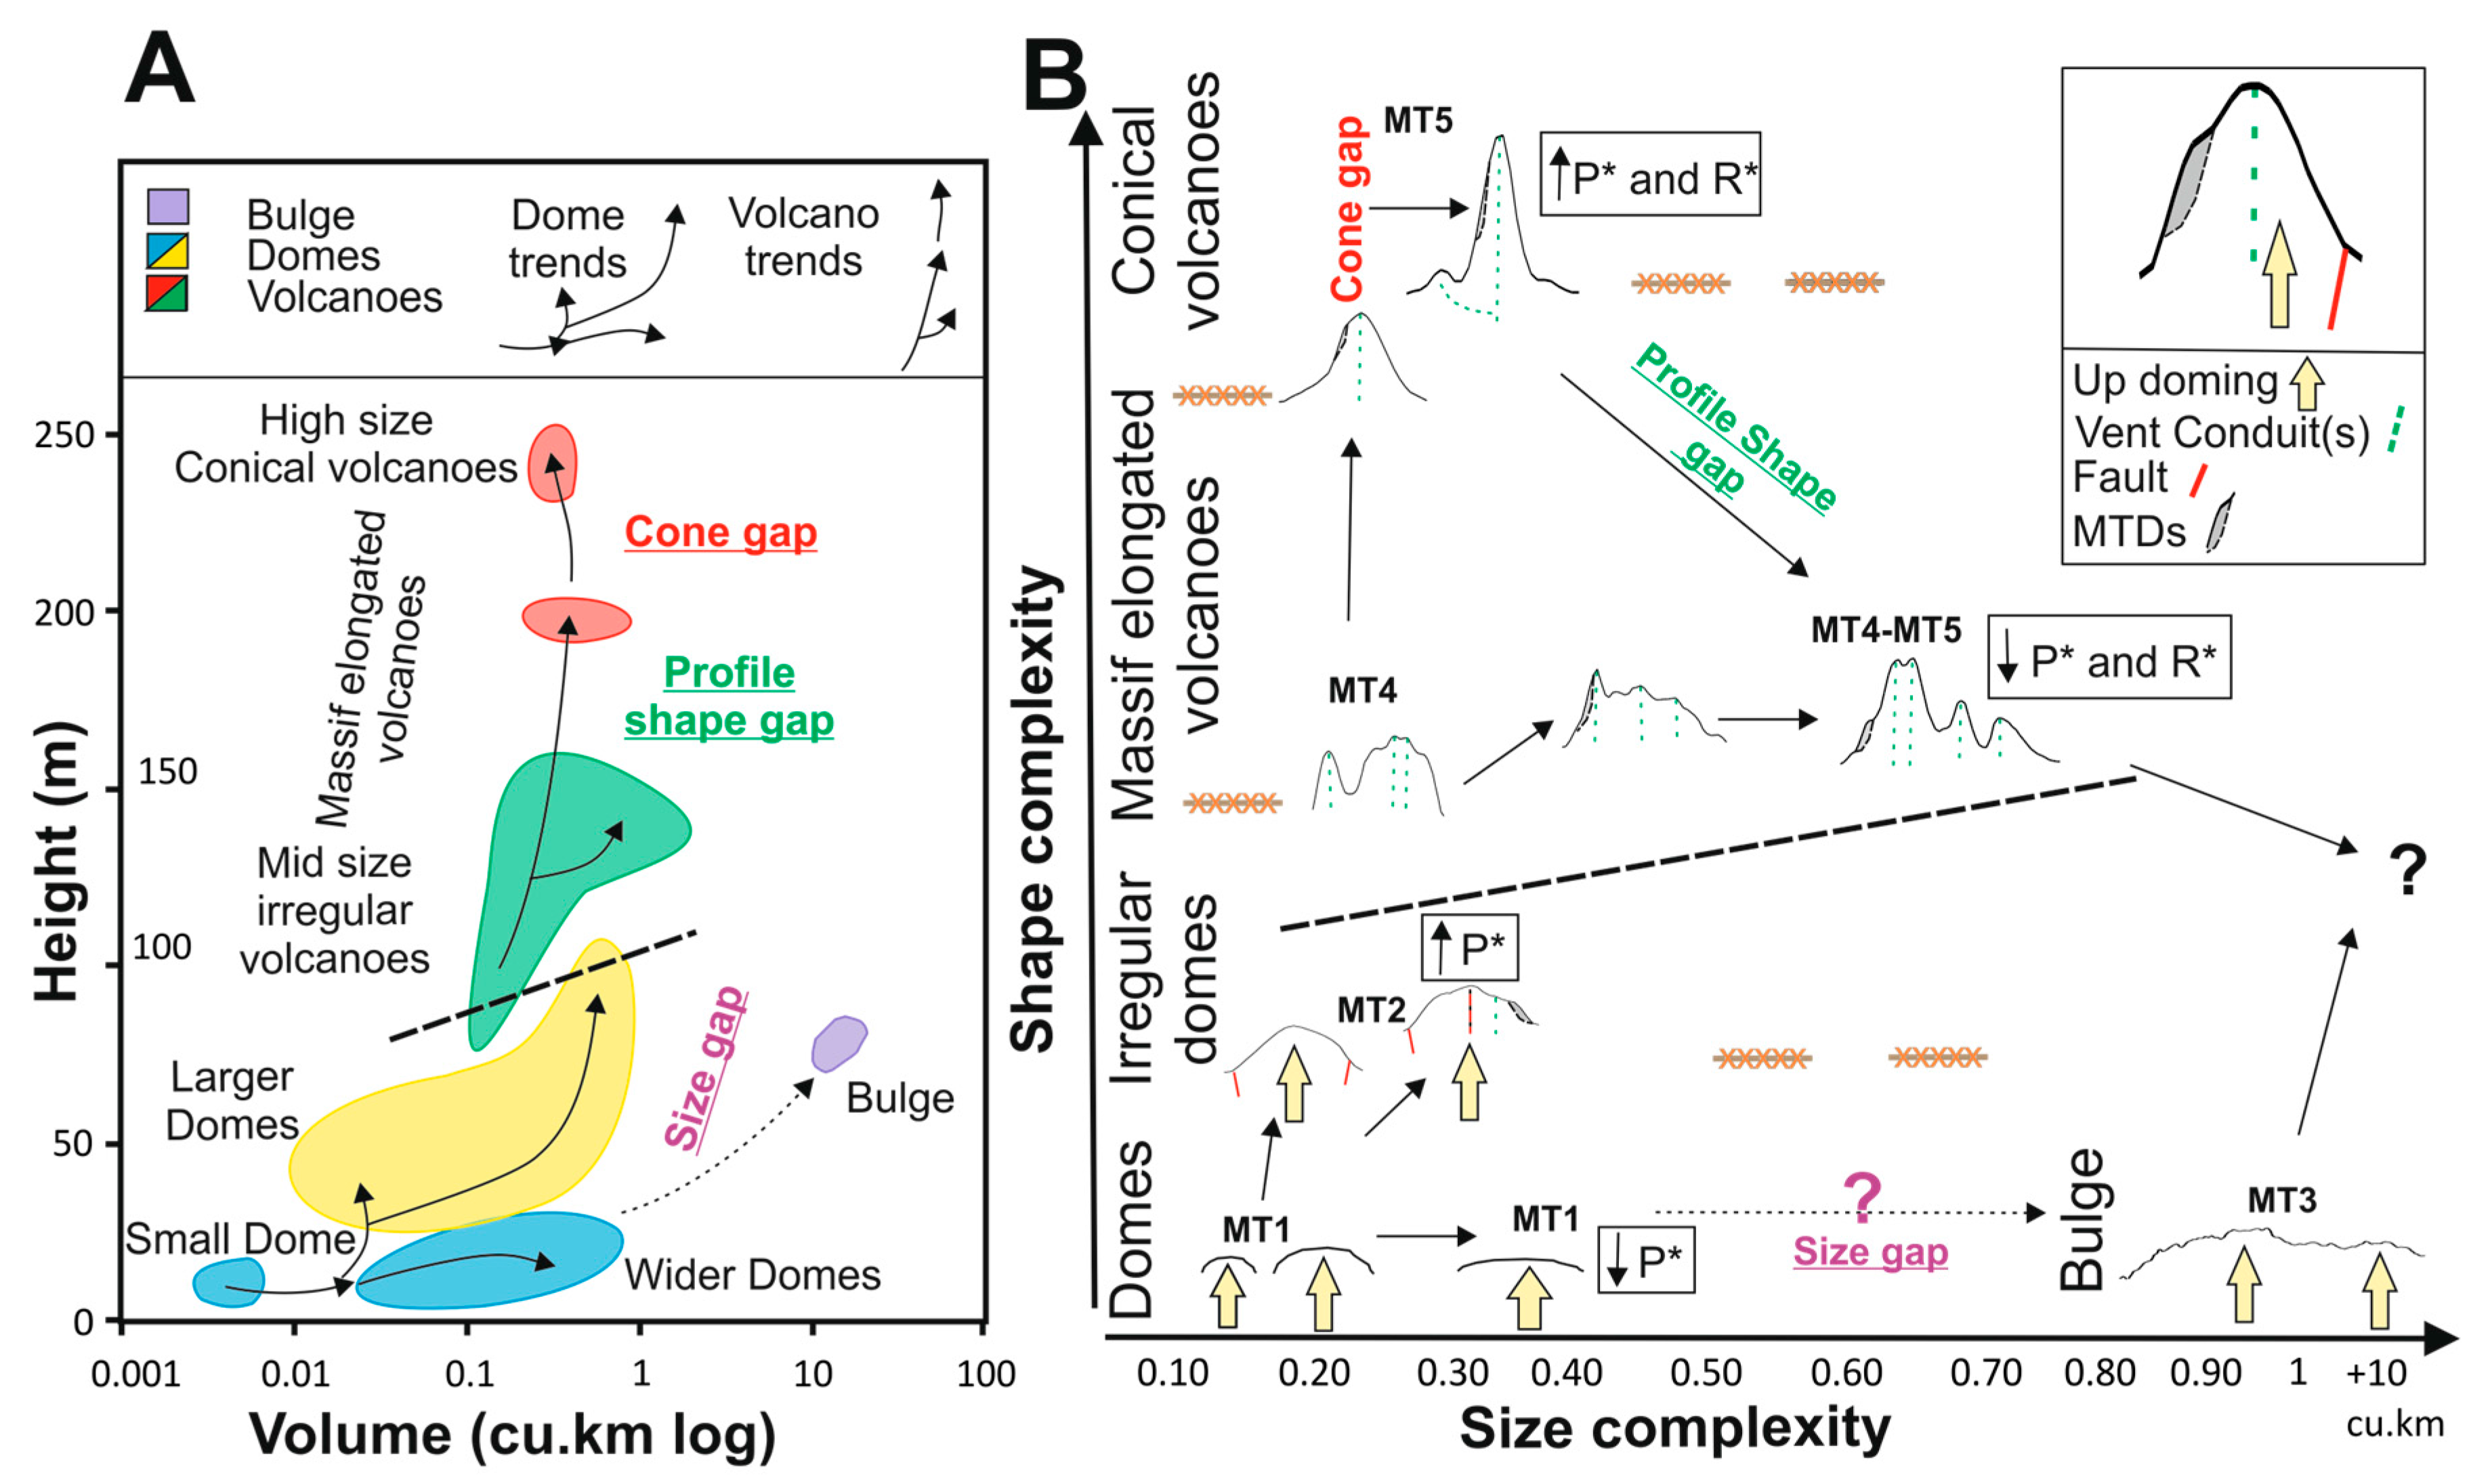
5.4. A Morphometric Evolution Model for the Seafloor Edifices
6. Conclusions and Outlook
Acknowledgments
Author Contributions
Conflicts of Interest
References
- Pike, R.J. Geomorphometry—Diversity in quantitative surface analysis. Prog. Phys. Geogr. 2000, 24, 1–20. [Google Scholar]
- Krause, D.C.; Menard, H.W. Depth distribution and bathymetric classification of some seafloor profiles. Mar. Geol. 1965, 3, 169–193. [Google Scholar] [CrossRef]
- Lecours, V.; Dolan, M.F.J.; Micallef, A.; Lucieer, V.L. A review of marine geomorphometry, the quantitative study of the seafloor. Hydrol. Earth Syst. Sci. 2016, 20, 3207–3244. [Google Scholar] [CrossRef]
- Fox, C.G.; Hayes, D.E. Quantitative methods for analyzing the roughness of the seafloor. Rev. Geophys. 1985, 23, 1–48. [Google Scholar] [CrossRef]
- Gorini, M.A.V. Physiographic classification of the ocean floor: A multiscale geomorphometric approach. In Proceedings of the geomorphometry, Zurich, Switzerland, 31 August–2 September 2009. [Google Scholar]
- Harris, P.T.; Macmillan-Lawler, M.; Rupp, J.; Baker, E.K. Geomorphology of the oceans. Mar. Geol. 2014, 352, 4–24. [Google Scholar] [CrossRef]
- Wilson, M.F.J.; O’Connell, B.; Brown, C.; Guinan, J.C.; Grehan, A.J. Multiscale Terrain Analysis of Multibeam Bathymetry Data for Habitat Mapping on the Continental Slope. Mar. Geodesy 2007, 30, 3–35. [Google Scholar] [CrossRef]
- Micallef, A.; Berndt, C.; Masson, D.G.; Stow, D.A.V. A technique for the morphological characterization of submarine landscapes as exemplified by debris flows of the Storegga Slide. J. Geophys. Res. 2007, 112, F02001. [Google Scholar] [CrossRef]
- Orpin, A.R.; Kostylev, V.E. Towards a statistically valid method of textural sea floor characterization of benthic habitat. Mar. Geol. 2006, 225, 209–222. [Google Scholar] [CrossRef]
- Lucieer, V.; Lucieer, A. Fuzzy clustering for seafloor classification. Mar. Geol. 2009, 264, 230–241. [Google Scholar] [CrossRef]
- Sandwell, D.T.; Gille, S.T.; Smith, W.H.F. Bathymetry from Space: Oceanography, Geophysics, and Climate; Geoscience Professional Service: Bethesda, MD, USA, 2002. [Google Scholar]
- Gille, S.T.; Metzger, E.J.; Tokmakian, R. Seafloor topography and ocean circulation. Oceanography 2004, 17, 47–54. [Google Scholar] [CrossRef]
- Micallef, A.; Le Bas, T.P.; Huvenne, V.A.I.; Blondel, P.; Hühnerbach, V.; Deidun, A. A multi-method approach for benthic habitat mapping of shallow coastal areas with high resolution multibeam data. Cont. Shelf Res. 2012, 39, 14–26. [Google Scholar] [CrossRef] [Green Version]
- Rovere, M.; Gamberi, F.; Mercorella, A.; Leidi, E. Geomorphometry of a submarine mass-transport complex and relationships with active faults in a rapidly uplifting margin (Gioia Basin, NE Sicily margin). Mar. Geol. 2014, 356, 31–43. [Google Scholar] [CrossRef]
- Porter-Smith, R.; Lyne, V.D.; Kloser, R.J.; Lucieer, V.L. Catchment-based classification of Australia’s continental slope canyons. Mar. Geol. 2012, 303, 183–192. [Google Scholar] [CrossRef]
- Ismail, K.; Huvenne, V.A.I.; Masson, D.G. Objective automated classification technique for marine landscape mapping in submarine canyons. Mar. Geol. 2015, 362, 17–32. [Google Scholar] [CrossRef] [Green Version]
- Andrews, B.D.; Brothers, L.L.; Barnhardt, W.A. Automated feature extraction and spatial organization of seafloor pockmark, Belfast Bay, ME, USA. Geomorphology 2010, 124, 55–64. [Google Scholar] [CrossRef]
- Harrison, R.; Bellec, V.K.; Mann, D.; Wang, W. A new approach to the automated mapping of pockmarks in multi-beam bathymetry. IEEE Image Proc. 2011, 18, 2777–2780. [Google Scholar]
- León, R.; Somoza, L.; Medialdea, T.; González, F.J.; Giménez-Moreno, C.J.; Pérez-López, R. Pockmarks on either side of the Strait of Gibraltar: Formation from overpressured shallow contourite gas reservoirs and internal wave action during the last glacial sea—Level lowstand? Geo-Mar. Lett. 2014, 34, 131–151. [Google Scholar] [CrossRef]
- Mitchell, N.C. Susceptibility of mid-ocean ridge volcanic islands and seamounts to large-scale landsliding. J. Geophys. Res. 2003, 108, 2397–2419. [Google Scholar] [CrossRef]
- Passaro, S.; Milano, G.; D’Istanto, C.; Ruggieri, S.; Tonielli, R.; Bruno, P.P.; Sprovieri, M.; Marsella, E. DTM-based morphometry of the Palinuro seamount (Eastern Tyrrhenian Sea): Geomorphological and volcanological implications. Geomorphology 2010, 115, 129–140. [Google Scholar] [CrossRef]
- Wormald, S.C.; Wright, I.C.; Bull, J.M.; Lamarche, G.; Sanderson, D.J. Morphometric analysis of the submarine arc volcano Monowai (Tofua-Kermadec Arc) to decipher tectono-magmatic interactions. J. Volcanol. Geotherm. Res. 2012, 239, 69–82. [Google Scholar] [CrossRef]
- Caress, D.W.; Clague, D.A.; Paduan, J.B.; Martin, J.F.; Dreyer, B.M.; Chadwick, W.W.; Denny, A.; Kelley, D.S. Repeat bathymetric surveys at 1-metre resolution of lava flows erupted at Axial Seamount in April 2011. Nat. Geosci. 2012, 5, 483–488. [Google Scholar] [CrossRef] [Green Version]
- Mitchell, N.C.; Tivey, M.A.; Gente, P. Seafloor slopes at mid ocean ridges from submersible observations and implications for interpreting geology from seafloor topography. Earth Planet. Sci. Lett. 2000, 183, 543–555. [Google Scholar] [CrossRef]
- Mitchell, N.C.; Livermore, R.A. Speiss Ridge: An axial high on the slow-spreading Southwest Indian Ridge. J. Geophys. Res. 1998, 103, 15457–15471. [Google Scholar] [CrossRef]
- Head, J.W.; Wilson, L.; Smith, D.K. Mid-ocean ridge eruptive vent morphology and substructure: Evidence for the dike widths, eruption rates, and axial volcanic ridges. J. Geophys. Res. 1996, 101, 28265–28280. [Google Scholar] [CrossRef]
- Stretch, R.C.; Mitchell, N.C.; Portaro, R.A. A morphometric analysis of the submarine volcanic ridge south-east of Pico Island, Azores. J. Volcanol. Geotherm. Res. 2006, 156, 35–54. [Google Scholar] [CrossRef]
- Macdonald, G.A. Volcanoes; Prentice-Hall: Upper Saddle River, NJ, USA, 1972; p. 510. [Google Scholar]
- Francis, P.W. Volcanoes. A planetary Perspective; Oxford University Press: Oxford, UK, 1993; p. 443. [Google Scholar]
- Rowden, A.A.; Clark, M.R.; Wright, I.C. Physical characterization and a biologically focused classification of “seamounts” in the New Zealand region. N. Z. J. Mar. Freshw. Res. 2005, 39, 1039–1059. [Google Scholar] [CrossRef]
- Clark, M.R.; Watling, L.; Rowden, A.A.; Guinotte, J.M.; Smith, C.R. A global seamount classification to aid the scientific design of marine protected area networks. Ocean Coast Manag. 2011, 54, 19–36. [Google Scholar] [CrossRef]
- Florinsky, I.V. Digital Terrain Analysis in Soil Science and Geology; Elsevier: London, UK, 2012; pp. 7–30. [Google Scholar]
- Camiz, S.; Poscolieri, M.; Roverato, M. Geomorphometric comparative analysis of Latin-American volcanoes. J. S. Am. Earth Sci. 2017, 76, 47–62. [Google Scholar] [CrossRef]
- Favalli, M.; Fornaciai, A. Visualization and comparison of DEM-derived parameters. Application to volcanic areas. Geomorphology 2017, 290, 69–84. [Google Scholar] [CrossRef]
- Grosse, P.; van Wyk de Vries, B.; Petrinovic, I.A.; Euillades, P.A.; Alvarado, G. Morphometry and evolution of arc volcanoes. Geology 2009, 37, 651–654. [Google Scholar] [CrossRef]
- Grosse, P.; van Wyk de Vries, B.; Euillades, P.A.; Kervyn, M.; Petrinovic, I.A. Systematic morphometric characterization of volcanic edifices using digital elevation models. Geomorphology 2012, 136, 114–131. [Google Scholar] [CrossRef]
- Di Traglia, F.; Morelli, S.; Casagli, N.; Garduño-Monroy, V. Semi-automatic delimitation of volcanic edifice boundaries: Validation and application to the cinder cones of the Tancitaro Nueva Italia region (Michoacán-Guanajuato Volcanic Field, Mexico). Geomorphology 2014, 219, 152–160. [Google Scholar] [CrossRef]
- Pedersen, G.B.M.; Grosse, P. Morphometry of subaerial shield volcanoes and glaciovolcanoes from Reykjanes Peninsula, Icealnd: Effects of eruption environment. J. Volcanol. Geotherm. Res. 2014, 282, 115–133. [Google Scholar] [CrossRef] [Green Version]
- Grosse, P.; Euillades, P.A.; Euillades, L.D.; de Vries, B.V.W. A global database of composite volcano morphometry. Bull. Volcanol. 2014, 76, 784. [Google Scholar] [CrossRef]
- Sanchez-Guillamón, O.; Vázquez, J.T.; Somoza, L.; Palomino, D.; Fernández-Salas, L.M.; Medialdea, T.; León, R.; López-Gonzalez, N.; y González, F.J. Morphological characteristics and superficial structure of submarine mounds in the lower slope of the Canary continental margin (W of Canary Islands). In Volumen de Comunicaciones Presentadas en el VIII Simposio Sobre el Margen Ibérico Atlántico; del Río, V.D., Barcenas, P., Fernández-Salas, L.M., López-Gonzalez, N., Palomino, D., Rueda, J., Sánchez-Guillamón, O., Vázquez, J.T., Eds.; Ediciones Sia Graf: Málaga, Spain, 2015; pp. 177–180. [Google Scholar]
- Medialdea, T.; Somoza, L.; González, F.J.; Vázquez, J.T.; de Ignacio, C.; Sumino, H.; Sánchez-Guillamón, O.; Orihashi, Y.; León, R.; Palomino, D. Evidence of a modern deep-water magmatic hydrothermal system in the Canary Basin (Eastern Central Atlantic Ocean). Geochem. Geophys. Geosyst. 2017, 18. [Google Scholar] [CrossRef]
- Sánchez-Guillamón, O.; Vázquez, J.T.; Palomino, D.; Medialdea, T.; Fernández-Salas, L.M.; León, R.; Somoza, L. Morphology and shallow structure of seafloor mounds in the Canary Basin (Central Eastern Atlantic Ocean). Geomorphology 2018. under revision. [Google Scholar]
- Ranero, C.R.; Banda, E. The crustal structure of the Canary Basin: Accretion processes 1064 at slow spreading centers. J. Geophys. Res. 1997, 102, 10185–10201. [Google Scholar] [CrossRef]
- Palomino, D.; Vázquez, J.T.; Somoza, L.; León, R.; López-González, N.; Medialdea, T.; Fernández-Salas, L.M.; González, F.J.; Rengel, J.A. Geomorphological features in the southern Canary Island Volcanic Province: The importance of volcanic processes and massive slope instabilities associated with seamounts. Geomorphology 2016, 255, 125–139. [Google Scholar] [CrossRef]
- Smith, D.K. Shape analysis of Pacific seamounts. Earth Planet. Sci. Lett. 1988, 90, 457–466. [Google Scholar] [CrossRef]
- Das, P.; Iyer, S.D.; Kodagali, V.N. Morphological characteristics and emplacement mechanism of the seamounts in the Central Indian Ocean Basin. Tectonophysics 2007, 443, 1–18. [Google Scholar] [CrossRef]
- Clague, D.A.; Moore, J.G.; Reynolds, J.R. Formation of flat topped volcanic cones in Hawaii. Bull. Volcanol. 2000, 62, 214–233. [Google Scholar] [CrossRef]
- Wood, J.D. The Geomorphological Characterisation of Digital Elevation Models. Ph.D. Thesis, University of Leicester, Leicester, UK, 1996. [Google Scholar]
- Jolliffe, I.T. Principal Component Analysis, 2nd ed.; Springer Series in Statistics: New York, NY, USA, 2002. [Google Scholar]
- Lebart, L.; Piron, M.; Morineau, A. Statistique Exploratoire Multidimensionnelle, Visualisation et Inférence en Fouille de Données; Dunod: Paris, France, 2006; 464p. [Google Scholar]
- Kabacoff, R.I. R in Action, 2nd ed.; Manning Publication: Shelter Island, NY, USA, 2013; pp. 378–380. [Google Scholar]
- Al-Hamdani, Z.; Reker, J. Towards Marine Landscapes in the Baltic Sea. BALANCE Interim Report #10. 2007. Available online: http://balance-eu.org/ (accessed on 10 November 2017).
- Pain, C.F. Size does matter: Relationships between image pixel size and landscape process scales. In MODSIM 2005 International Congress on Modelling and Simulation Modelling and Simulation Society of Australia and New Zealand; Zerger, A., Argent, R.M., Eds.; MSSANZ: Perth, Australia, 2005; pp. 1430–1436. [Google Scholar]
- Eaton, J.P.; Murata, K.J. How volcanoes grow? Science 1960, 132, 925–938. [Google Scholar] [CrossRef] [PubMed]
- Bolongaro-Crevenna, A.; Torres-Rodríguez, V.; Sorani, V.; Frame, D.; Ortiz, M.A. Geomorphometric analysis for characterizing landforms in Morelos State, Mexico. Geomorphology 2005, 67, 407–422. [Google Scholar] [CrossRef]
- Rossi, M.J. Morphology and mechanism of eruption of postglacial shields in Iceland. Bull. Volcanol. 1996, 57, 530–540. [Google Scholar] [CrossRef]
- Smellie, J.L. Quaternary volcanism: Subglacial landforms. In Encyclopedia of Quaternary Sciences; Elias, S.A., Ed.; Elsevier: Amsterdam, The Netherlands, 2007; pp. 784–798. [Google Scholar]
- Schmiedel, T.; Galland, O.; Breitkreuz, C. Dynamics of sill and laccolith emplacement in the brittle crust: Role of host rock strength and deformation mode. J. Geophys. Res. Solid Earth 2017, 122. [Google Scholar] [CrossRef]
- Smith, D.K. Comparison of the shapes and sizes of seafloor volcanoes on Earth and “pancake” domes on Venus. J. Volcanol. Geotherm. Res. 1996, 73, 47–64. [Google Scholar] [CrossRef]
- Judd, A.G.; Hovland, M. Seabed Fluid Flow: The Impact of Geology, Biology and the 1182 Marine Environment; Cambridge University Press: Cambridge, UK, 2007; 475p. [Google Scholar]
- Fornari, D.J.; Ryan, W.B.F.; Fox, P.J. The evolution of craters and calderas on young seamounts: Insights from Sea MARC I and Sea Beam sonar surveys of a small seamount group near the axis of the East Pacific Rise at ~10°N. J. Geophys. Res. 1984, 89, 11069–11083. [Google Scholar] [CrossRef]
- Mukhopadhyay, R.; Iyer, S.D.; Ghosh, A.K. The Indian Ocean nodule field: Petrotectonic evolution and ferromangenese deposits. Earth-Sci. Rev. 2002, 60, 67–130. [Google Scholar] [CrossRef]
- Smith, D.K.; Jordan, T.H. Seamount statistics in the Pacific Ocean. J. Geophys. Res. 1988, 93, 2899–2918. [Google Scholar] [CrossRef]
- Chaytor, J.D.; Keller, R.A.; Duncan, R.A.; Dziak, R.P. Seamount morphology in the Bowie and Cobb hot spot trails, Gulf of Alaska. Geochem. Geophys. Geosyst. 2007, 8, 9. [Google Scholar] [CrossRef]
- McGuire, W.J. Volcano instability: A review of contemporary themes. In Volcano Instability on the Earth 200 and Other Planets; McGuire, W.J., Jones, A.P., Neuberg, J., Eds.; Geological Society of London Special Publications: London, UK, 1996; pp. 1–23. [Google Scholar]
- Tempera, F.; Hipolito, A.; Madeira, J.; Vieira, S.; Campos, A.S.; Mitchell, N.C. Condor seamount (Azores, NE Atlantic): A morpho-tectonic interpretation. Deep-Sea Res. 2013, 98, 7–23. [Google Scholar] [CrossRef]
- Fisher, A.T.; Wheat, C.G. Seamounts as conduits for massive fluid, heat, and solute fluxes on ridge flanks. Oceanography 2010, 23, 74–87. [Google Scholar] [CrossRef]
- Davison, J.; De Silva, S. Composite volcanoes. In Encyclopedia of Volcanoes; Sigurdsson, H., Ed.; Academic Press: New York, NY, USA, 2000; pp. 663–681. [Google Scholar]
- Vezzoli, L.; Tibaldi, A.; Renzulli, A.; Menna, M.; Flude, S. Faulting-assisted lateral collapses and influence on shallow magma feeding system at Ollagüe volcano (Central Volcanic Zone, Chile-Bolivia Andes). J. Volcanol. Geotherm. Res. 2008, 171, 137–159. [Google Scholar] [CrossRef]


© 2018 by the authors. Licensee MDPI, Basel, Switzerland. This article is an open access article distributed under the terms and conditions of the Creative Commons Attribution (CC BY) license (http://creativecommons.org/licenses/by/4.0/).
Share and Cite
Sánchez-Guillamón, O.; Fernández-Salas, L.M.; Vázquez, J.-T.; Palomino, D.; Medialdea, T.; López-González, N.; Somoza, L.; León, R. Shape and Size Complexity of Deep Seafloor Mounds on the Canary Basin (West to Canary Islands, Eastern Atlantic): A DEM-Based Geomorphometric Analysis of Domes and Volcanoes. Geosciences 2018, 8, 37. https://doi.org/10.3390/geosciences8020037
Sánchez-Guillamón O, Fernández-Salas LM, Vázquez J-T, Palomino D, Medialdea T, López-González N, Somoza L, León R. Shape and Size Complexity of Deep Seafloor Mounds on the Canary Basin (West to Canary Islands, Eastern Atlantic): A DEM-Based Geomorphometric Analysis of Domes and Volcanoes. Geosciences. 2018; 8(2):37. https://doi.org/10.3390/geosciences8020037
Chicago/Turabian StyleSánchez-Guillamón, Olga, Luis Miguel Fernández-Salas, Juan-Tomás Vázquez, Desirée Palomino, Teresa Medialdea, Nieves López-González, Luis Somoza, and Ricardo León. 2018. "Shape and Size Complexity of Deep Seafloor Mounds on the Canary Basin (West to Canary Islands, Eastern Atlantic): A DEM-Based Geomorphometric Analysis of Domes and Volcanoes" Geosciences 8, no. 2: 37. https://doi.org/10.3390/geosciences8020037