Morphodynamics Assessment by Means of Mesoforms and Video-Monitoring in a Dissipative Beach
by
 , and
, and
Juan Montes
1,* ,
,
Gonzalo Simarro
2,
Javier Benavente
1, 
Theocharis A. Plomaritis
1,3,4 and
Laura Del Río
1 1
Department of Earth Sciences, International Campus of Excellence of the Sea (CEI·MAR), University of Cádiz, Avda. República Saharaui s/n, 11510 Puerto Real, Cádiz, Spain
2
Department of Marine Geosciences, Institute of Marine Sciences, Passeig Marítim de la Barceloneta 37-49, 08003 Barcelona, Spain
3
CIMA, University of Algarve, Campus of Gambelas, 8005-135 Faro, Portugal
4
Department of Applied Physics, International Campus of Excellence of the Sea (CEI·MAR), University of Cádiz, Avda. República Saharaui s/n, 11510 Puerto Real, Cádiz, Spain
*
Author to whom correspondence should be addressed.
Geosciences 2018, 8(12), 448; https://doi.org/10.3390/geosciences8120448
Submission received: 31 October 2018
/
Revised: 18 November 2018
/
Accepted: 24 November 2018
/
Published: 30 November 2018
(This article belongs to the Special Issue Coastal Geomorphology)
Abstract
:In this study a video-monitoring system was used to analyze the presence of mesoforms during a time period of five years in the urban beach of La Victoria, Cádiz, Spain. This technique allowed the generation of plan views using an improved version of ULISES software. The presence and spatiotemporal variability of the most common mesoforms, such as bars and cusps, was identified in all the plan views. Furthermore, the morphodynamic state of the beach was investigated in combination with local hydrodynamic data. The cusp systems were also studied by means of wavelet analyses and different theories on cusps formation were tested. The presence of the investigated features was related to the wave energy and its seasonal variations. The behavior of the mesoforms demonstrated the important role of a subtidal rocky outcrop in the nearshore processes. The results also show that bars and cusps as indicators of the nearshore processes are a useful tool for the macroscopic analysis of surf zone dynamics in dissipative beaches.
Keywords:
mesoforms; bars; cusps; rip currents; video-monitoring system; ULISES; wavelet; Gulf of Cadiz1. Introduction
Mesoscale features are common in many beaches, showing spatial scales between a few meters to kilometers and temporal scales from minutes to hours, hours to days, or even centuries to millennia [1]. Among these features there are rhythmic beach cusps and bars, and rip currents often appear associated to them. Their formation and disappearance is associated with different nearshore processes and hydrodynamic conditions (e.g., swash, currents, wave breaking, etc.); however, these processes are not always clearly understood [2]. The presence of tide has also shown to be able to modulate the morphological characteristics of cusps and bars, such as position and height [3]. The mesoforms can serve as indexes of the physical and sedimentary processes that govern the morphodynamic evolution of a beach. The type, form, and size of such features, together with their temporal variations, provide valuable information on a beach system. On the other hand, mesoforms are good indicators of the spatial variability of nearshore processes. The persistence and appearance of features in certain areas can provide useful information on the processes that predominate those areas.
Sand bars appear on beaches all over the world, and their formation derives from the interaction between the hydrodynamic conditions and sediment transport, being the most dynamic morphologies in the surf zone [4]. Beach morphodynamics is closely linked with the presence of bars, which can trigger wave breaking and associated sediment transport [5]. They can also influence beach width [6], change the shoreline shape with their pattern [7], interact with drift currents [8], or induce rip currents caused by normal waves resulting in rip channels over the bar [9]. Furthermore, as wave energy-driven features, they may vary their position with respect to shoreline according to wave energy conditions; after storms, they tend to be located far away from the coast (outer bars) and they move shoreward under low energy conditions (inner bars) [6]. The inner and outer bars can display different behaviors. Moreover, rapid changes occur in bar morphology and position during storms, while low-energy changes are notably slower [10]. Classification of bars is difficult due to the large number of criteria that can be used, such as shape, length, orientation, or hydro-morphological environment [11]. In general, there can be a differentiation between shore-parallel bars (straight or crescentic) and transverse bars (transverse bar and rip or finger bars) [1].
Regarding beach cusps, they are defined by most authors as rhythmic patterns with a crescentic shape on the shoreline and consist of cusp horns that extend seaward with steep slopes, and cusp embayments, located landward and with gentle slopes [3,12,13]. Over recent decades, the mechanisms regarding the formation of cusp systems have been widely debated. At first, the most accepted theory was the edge wave theory by Guza and Inman [14]. According to this theory, edge waves impose their pattern on the beach, creating cusps; the cusp wavelength and spacing would be determined by the incident wave period and the beach slope. Further hypotheses arose, among which the theory of self-organization [15] is the most accepted by the scientific community. In this case, the cusps would form as a consequence of the interaction between the bathymetry and the waves, and the cusp spacing would relate to the swash excursion. Details about the differences between both theories can be found in the review by Ribas et al. [1]. Various authors have analyzed connections between both theories, with different conclusions. Werner and Fink [15] argued that they are incompatible, while Komar [16] stated that edge waves act as a template on the initial development phase and the self-organization allows wavelength expansion. Coco et al. [17] consider that they can coexist under specific conditions, while Masselink et al. [18] conclude that edge waves are not required for the initial development of these rhythmic morphologies. In fact, the way in which cusp systems are created is still not clear and many assumptions about their formation, proposed by different authors, are contradictory. However, good predictions of beach cusp spacing were also achieved using different relations and parameters [19].
The use of video-monitoring systems (VMS) for the study of coastal processes and features is increasingly widespread. VMS are relatively cost-effective techniques (in comparison with other methods such as LiDAR, terrestrial laser scanner, or RTK-DGPS) able to acquire data automatically, continuously, and periodically, even with bad weather conditions. The use of these types of systems significantly reduces field work efforts with respect to traditional coastal monitoring methods (e.g., RTK-DGPS) and allows coverage of wide regions with high spatiotemporal resolution. The first video-monitoring systems were developed in the 1990s [20], and ever since they have been used mainly for the study of shoreline changes, sand bars, and rip currents [21]. They have also been applied for the analysis of nearshore bathymetry [22,23,24], coastal zone management [25,26,27], and run-up measurement [28,29], amongst others. The ability of the VMS to cover large areas depends on their location (height and distance to the shore) and camera characteristics.
Contrary to other monitoring methods which are unable to solve short-term coastal processes (daily processes) such as the formation of bars and cusps, VMS provide hourly information, allowing for observation and better understanding of these processes. Several authors have used VMS to assess the presence, characteristics, and behavior of coastal mesoforms such as bars [11,30,31] and beach cusps [12,32] throughout the world, proving it to be a valid tool for this type of work.
The purpose of this paper is to study the spatiotemporal and spatial variability of mesoforms, namely cusps and bars, and nearshore processes associated with them on a mesotidal beach in southern Spain (La Victoria beach) through one of the most temporally extensive datasets acquired by a VMS for this purpose in a dissipative beach. Even though environmental conditions in this area are not optimal for the formation of such features because low slopes and small grain sizes are predominant, data recorded over five years from a 3-camera system looking at this beach were used to investigate the temporal distribution of cusps and bars. Different morphodynamic indices were calculated to determine the beach state. Beach cusp systems were digitized to analyze their position, and wavelet analyses were performed to study their wavelengths as well as their spatial distribution along the shoreline. Finally, the different theories on cusp formation were analyzed to investigate the possible causes of the presence of cusps in La Victoria beach.
2. Study Zone
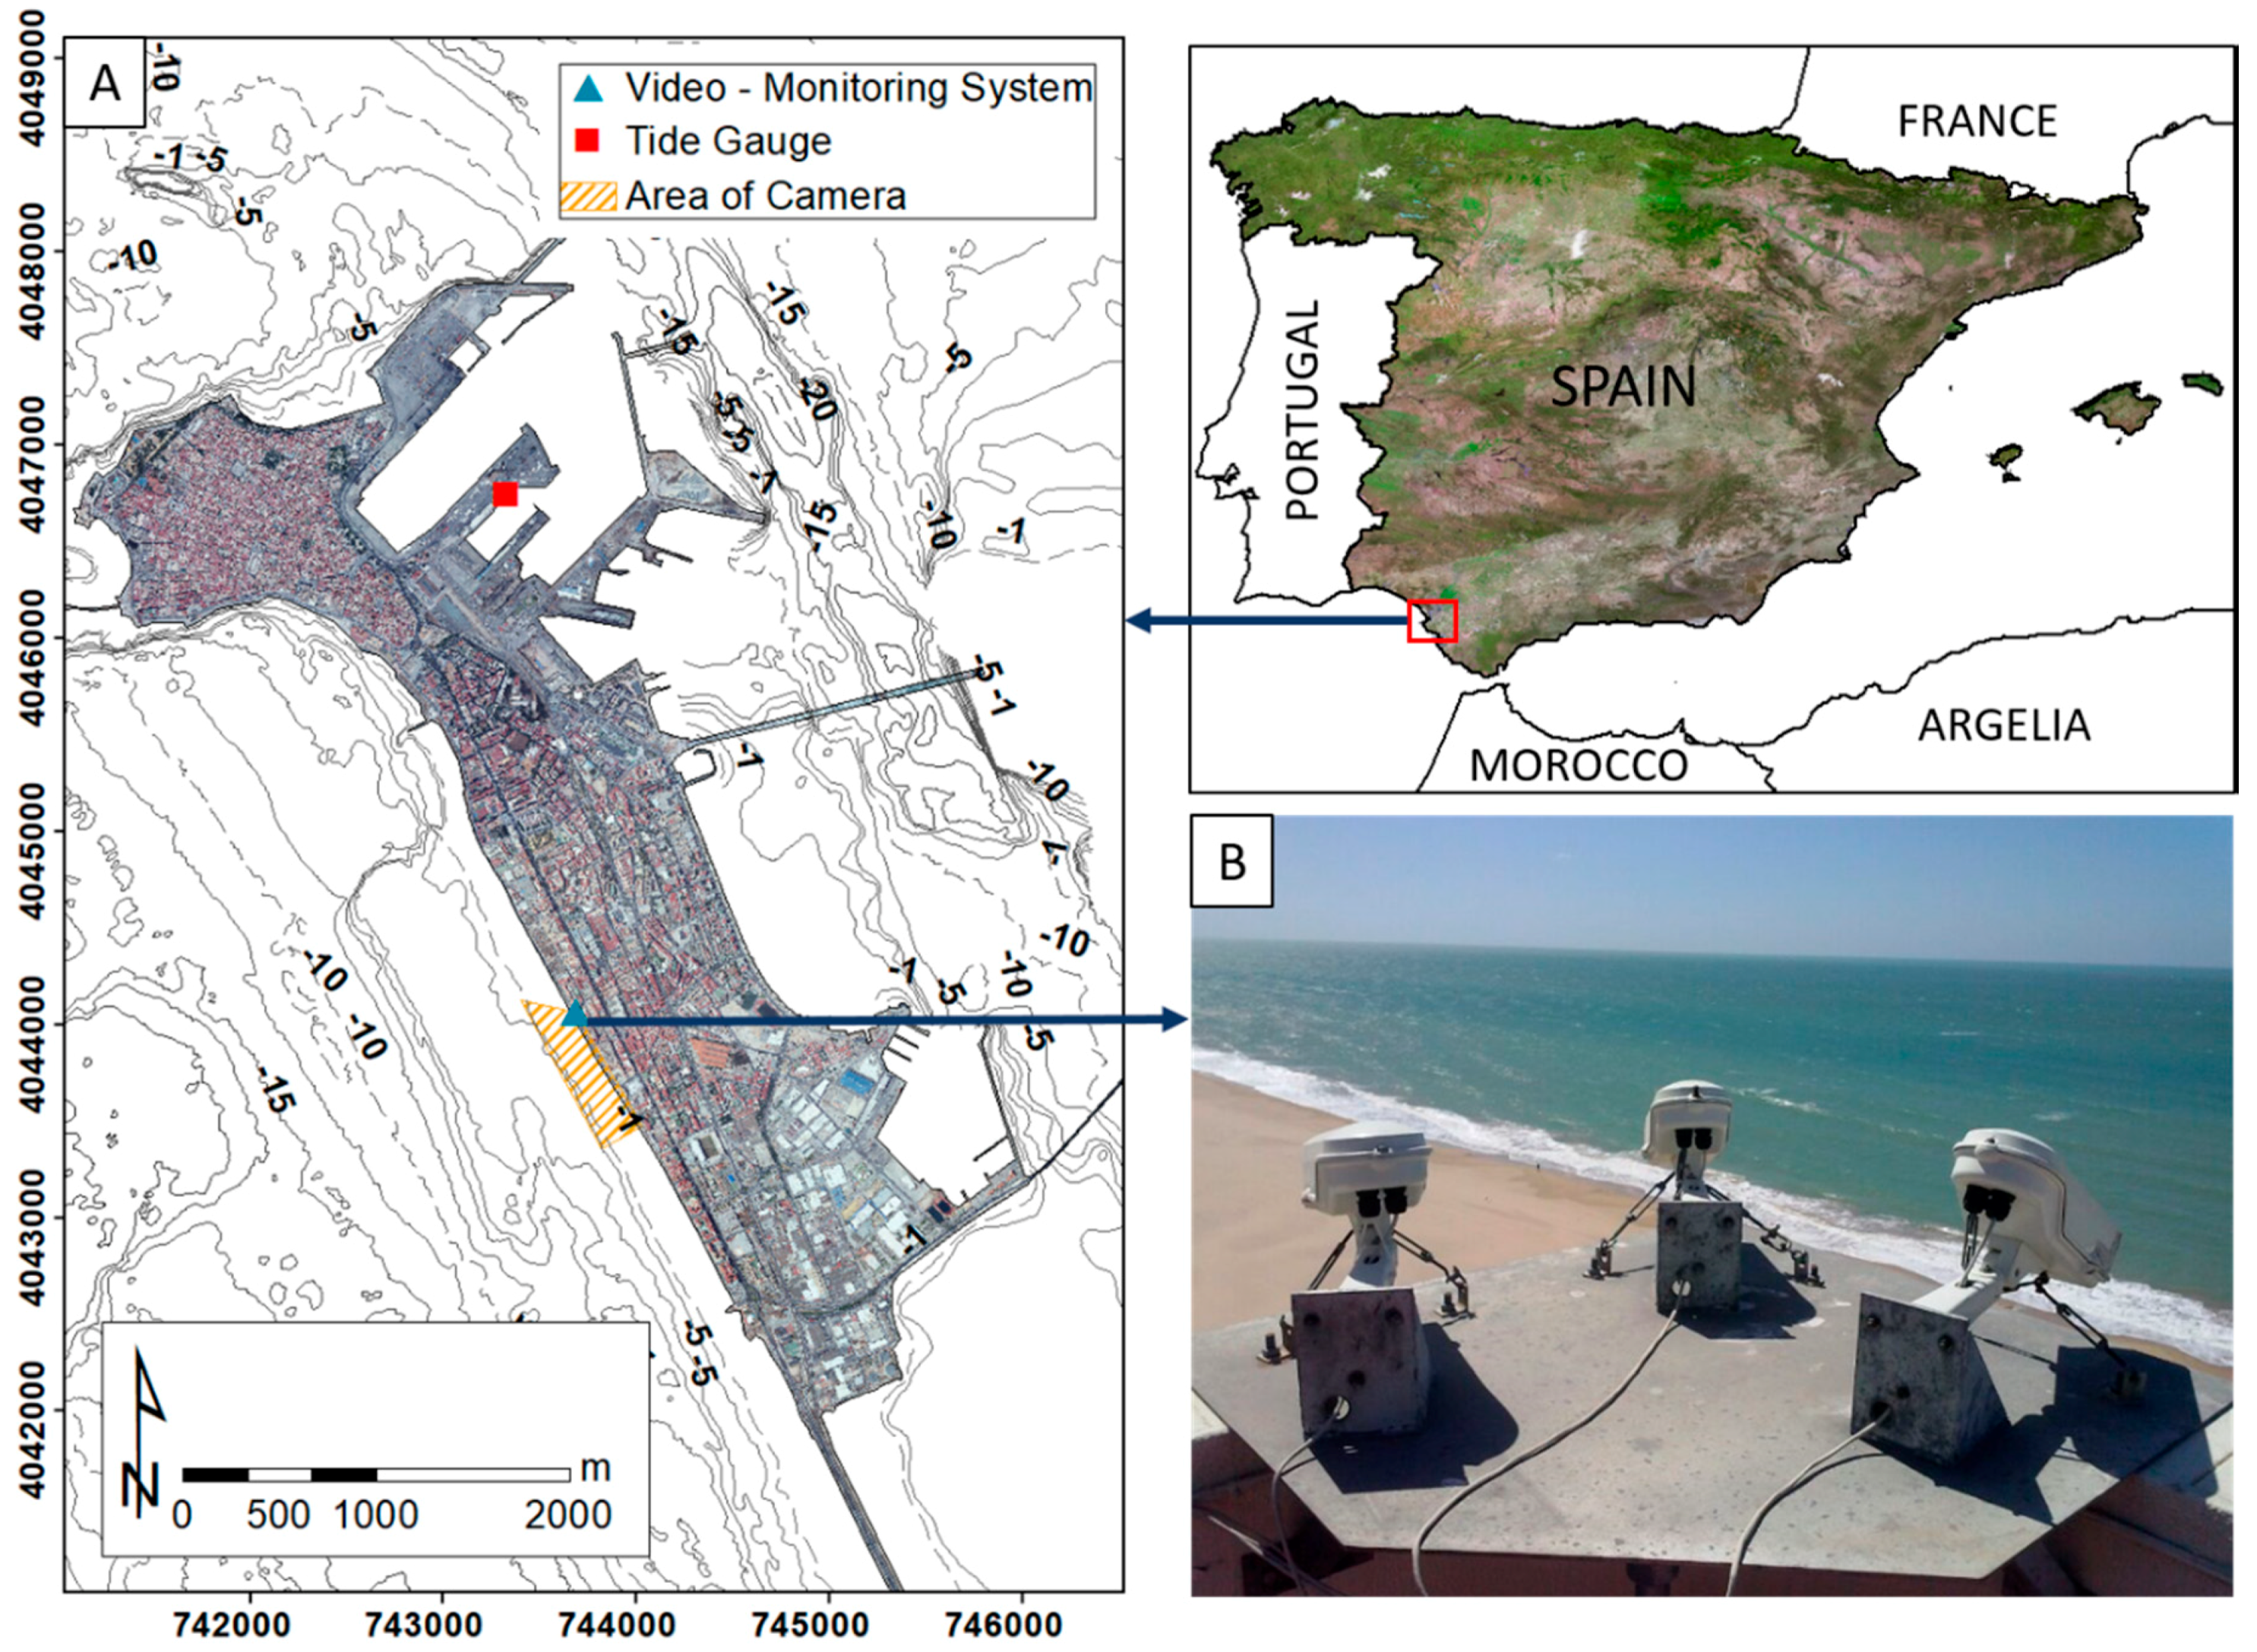
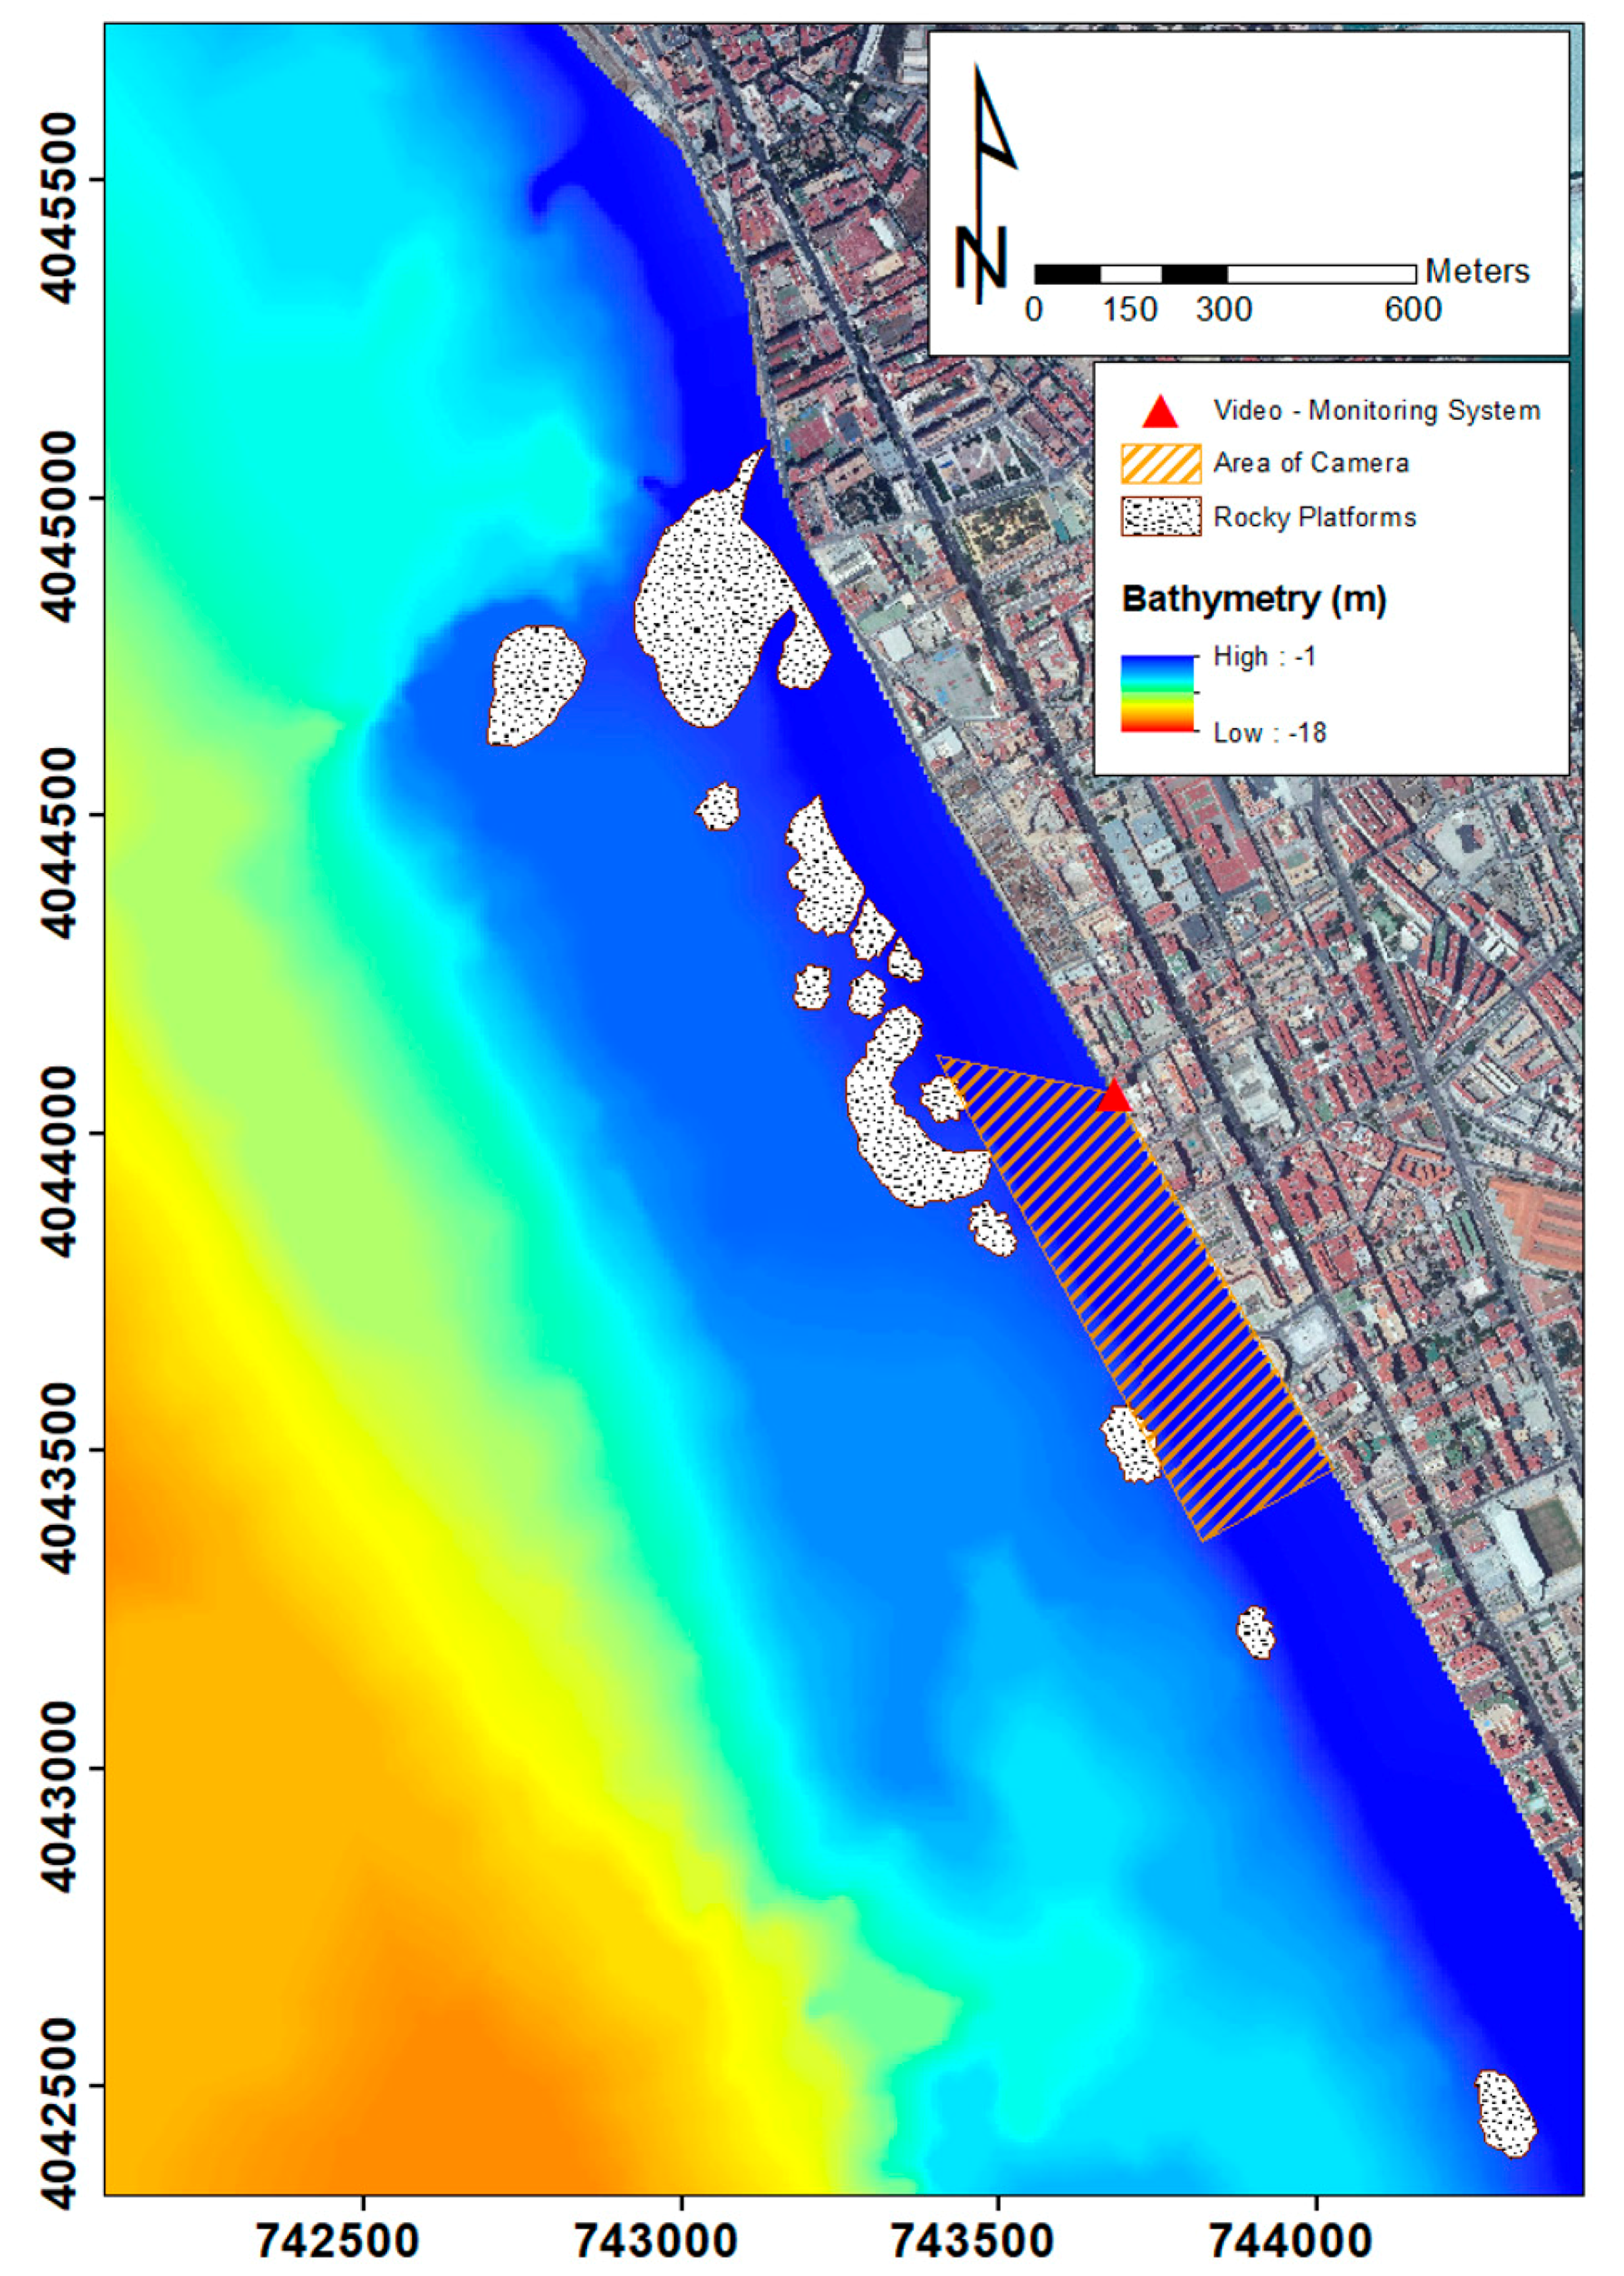
The study site is the urban beach of La Victoria, in the city of Cádiz, Spain (Figure 1). The beach is located in the outer part of the Bay of Cádiz, following a NNW-SSE orientation and extending approximately 3 km. It belongs to a sandy barrier system that extends 8.5 km and separates the Atlantic Ocean from the inner area of the Bay of Cádiz.
La Victoria beach is strongly influenced by the presence of different structures. Its northern limit is constituted by groins and an intertidal rocky shore platform, while the whole beach is backed by a promenade built upon the ancient dune system. There is also a submerged rocky shore platform that extends discontinuously along the shoreline, constituted by sandstones and quarzitic conglomerate; the highest part is exposed in spring low tides [33].
Anthropogenic influence on La Victoria beach, as seen in other beaches nearby, is also related to the decrease of sediment supply to the coast since the 1960s due to dam construction in rivers such as Guadalquivir and Guadalete, which are the main source of sediment in the Eastern Gulf of Cádiz [34]. As a consequence of the anthropogenic influence, most beaches in the area have shown an erosive trend over the last decades [35]. This erosive trend has been addressed by carrying out numerous artificial beach nourishments, generally after winters with strong storms. In fact, La Victoria beach was nourished in 1991, 2004, 2010, and 2015, pouring a total of about 2,400,000 m3 of sediment [36,37].
Regarding the hydrodynamic regime, tides in La Victoria beach are semi-diurnal and of a mesotidal range according to the classification by Davis [38], with a Mean Spring Tidal Range (MSTR) of 3.06 m. In high energy conditions, due to the effect of low atmospheric pressure and wind, storm surge can contribute close to 15% of the MSTR [34]. Prevailing winds blow mainly from the E-SE (Levante) and W-SW (Poniente), with contrasting characteristics and influence on coastal dynamics [34]. Levante winds are more intense, but due to their short fetch and the orientation of the coast, their incidence in wave generation is very low [39]. Poniente winds, to which La Victoria is fully exposed, are less intense but have a much longer fetch and are thus of great importance in the generation of waves in this area [34]. Storms usually occur between November and March, reaching in some cases significant wave heights above 7 m [40] with an associated return period of five years [41]. Nevertheless, average wave heights are around 1 m and the area is considered a low-energy coast according to the classification by Davis and Hayes [38].
From a morphological point of view, La Victoria beach is composed of fine sands and shows an intermediate-dissipative slope. The presence of wide and flat swash bars is recurrent, and beach cusps sometimes appear along the shoreline.
3. Materials and Methods
3.1. Image Acquisition and Rectification
The video monitoring system located at La Victoria beach was installed in September 2013, and it has been operating quasi-continuously until the present day (except for short intervals due to technical issues). It consists of three IP cameras (VIVOTEK IP7160) (VIVOTEK, Taiwan, China) of 2 MegaPixel (1600 × 1200 pixels resolution) connected to a computer used to configure the system and store the data. The cameras are installed on the roof of a residential building 49 m above mean sea level (Figure 1) and point towards the beach, covering approximately 750 m along-shore and 200 m cross-shore including the surf zone, the intertidal zone, the dry beach, the promenade, and a road located behind it.
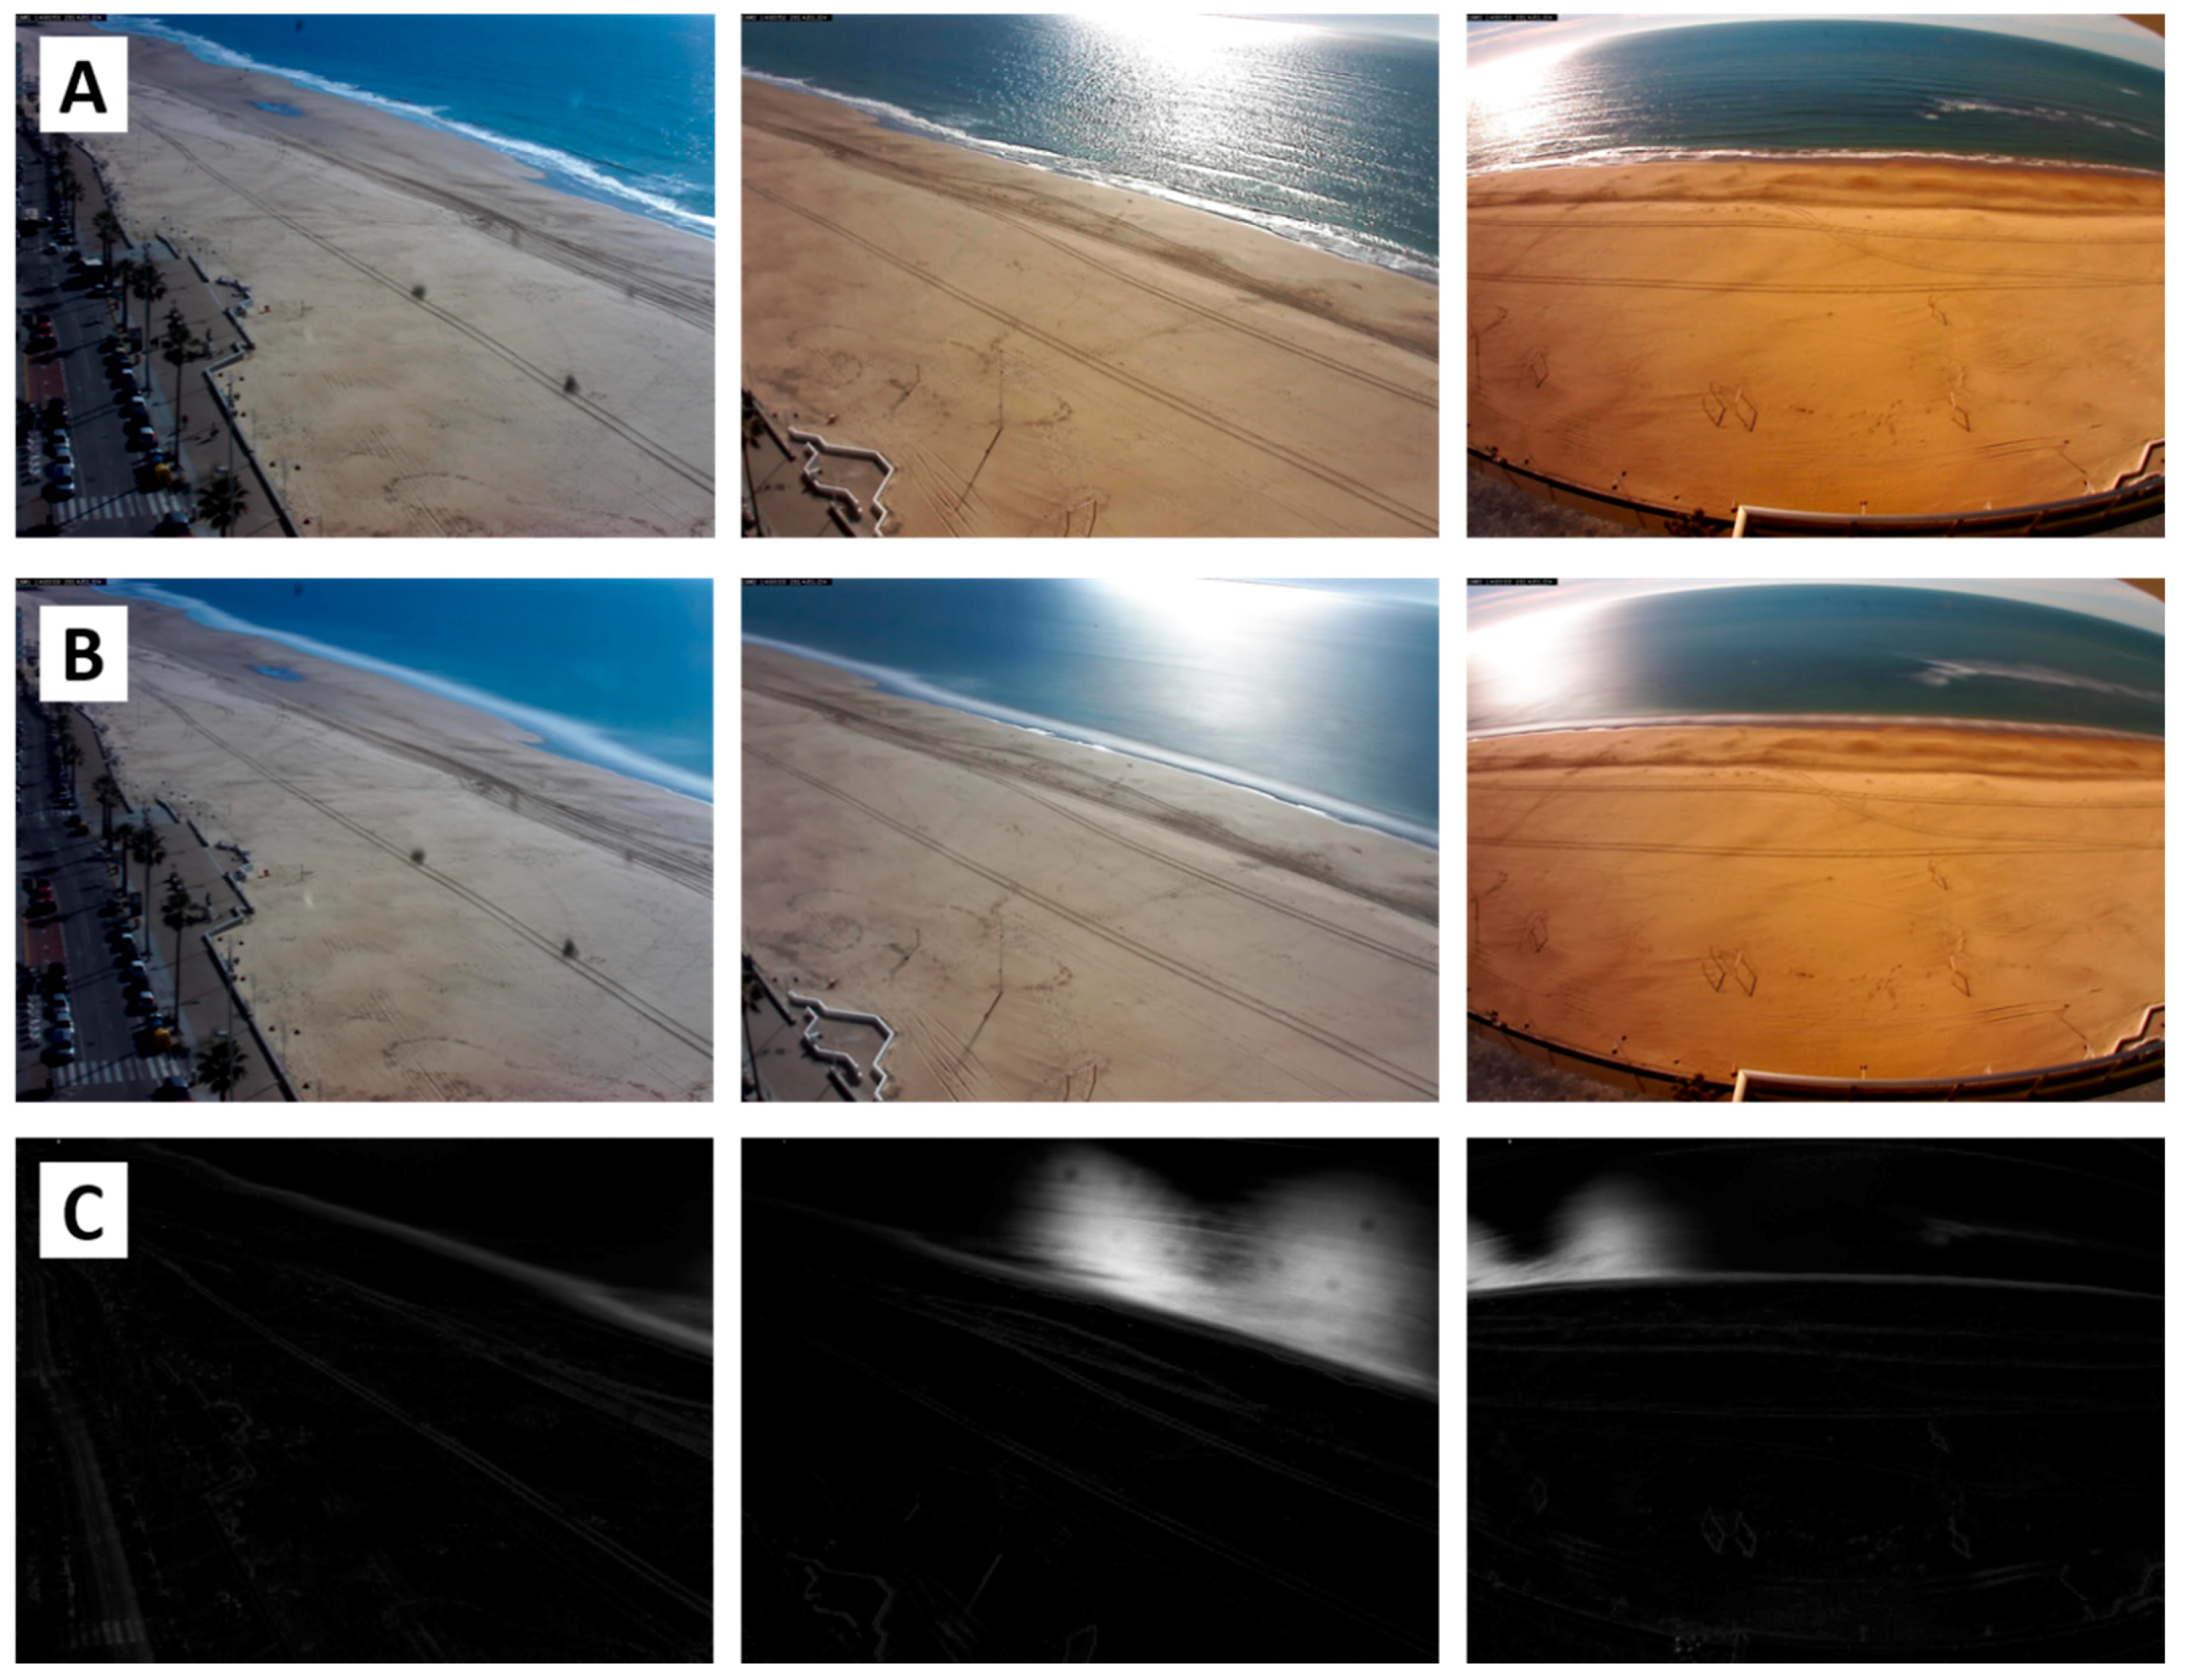
The system records 10 min of video in MPEG-4 format (Moving Picture Experts Group) every hour during daylight with a frequency of 4 Hz. Each video is decomposed into images to generate different basic products: Snap images (snapshot image), Timex images (time average image), and Sigma images (greyscale variance image) [42] (Figure 2). This process is carried out by means of the free software Orasis [23] and is completely automated. When the system completes the acquisition of the 10 min of video, it begins to process them to obtain the aforementioned products.
The intrinsic and extrinsic calibrations of the cameras and the generation of plan views were performed through an improved version of the open source software ULISES [43]. This software was originally created to be used with SIRENA video-monitoring stations [44], but it is capable of processing data from any other system. Intrinsic calibration parameters include the focal length and distortion and decentering the lens of each camera [20], while extrinsic calibration parameters account for the camera position and orientation. The calibration of a camera allows it to relate pixels to real world coordinates. The calibrations (intrinsic and extrinsic parameters) were performed from an estimation of the position of the camera, the ground control points (GCPs), and the horizon line. The position of each camera was obtained through a Real-Time Kinematic and Differential Global Positioning System (RTK-DGPS). To obtain the GCPs, ten beach surveys were carried out on different dates by evaluating the specific movements that the cameras had suffered, caused by maintenance tasks or by bad weather conditions. At least two surveys were performed every year, except in 2015, when only one survey was done. The position of the GCPs was measured with the RTK-DGPS (Leica Geosystems, Switzerland) during the night hours, marking their position with an artificial light (to identify the corresponding pixel in the image). This procedure minimized possible errors in the location of the GCPs in the farthest areas, since the low resolution of the system and the compression of the images hindered an accurate determination of the point taken with the RTK-DGPS. It also prevented possible interferences caused by the presence of people on the beach. In addition, different permanent structures were used as GCPs (mainly street lamps and promenade corners) in order to improve the quality of the calibration. The horizon line was only used on cameras 2 and 3 because of the orientation of the cameras.
3.2. Image Processing
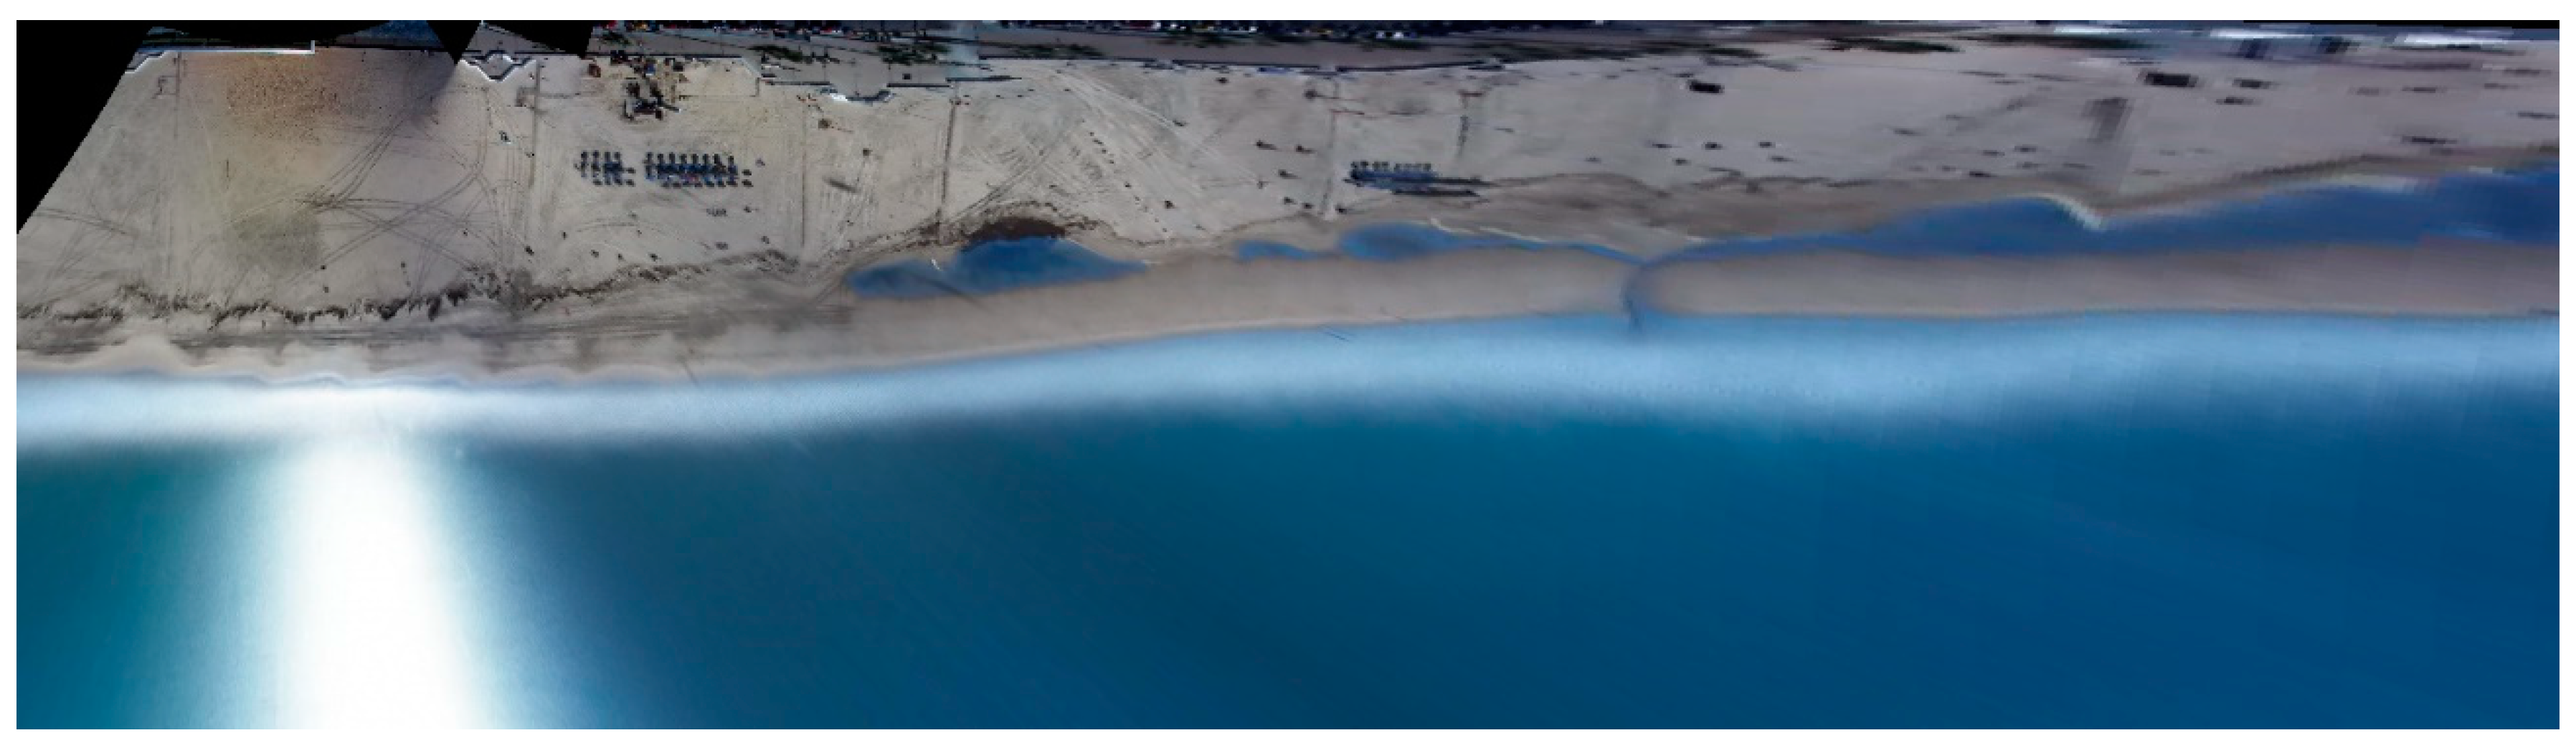
All the plan views were manually analyzed to identify the periods of time when different mesoforms (bars, beach cusps) or rip channels were observed (Figure 3). The percentage of times that they appeared in the images was calculated in relation to the total monthly plan views to avoid overestimating or underestimating the results (because not every month had the same number of plan views due to the above mentioned interruptions). With this procedure it was possible to characterize the temporal distribution of the different mesoforms throughout the year. Both bars and cusps were difficult to appreciate on the plan views at certain moments of the tidal cycle, particularly the cuspate systems in low tide conditions, an aspect to be considered when analyzing the results.
3.3. Morphodynamic Indices
After the image processing, a series of morphodynamic indices were calculated from the hydrodynamic conditions to study the theoretical beach state and compare it to the results observed in the plan views. The model proposed by Masselink and Short [45], which considers modal breaking wave height and period, sediment characteristics, and relative tidal range, was used to classify the morphodynamic state of the beach and to estimate the presence/absence of bars. The parameters used for this model are the dimensionless fall velocity (Ω) (Equation (1)) and the relative tidal range (RTR) (Equation (2)).
where represents the average wave breaking height, is the sediment fall velocity, is the wave period and is the mean spring tide range.
According to Wright and Short [7], values of Ω less than 1 indicate that the beach has a reflective state, while values greater than 6 indicate a dissipative state.
The bar parameter [46] (Equation (3)), designed to predict the number of bars on the beach, was also calculated. It is given by the expression
where tanβ represents beach slope, considered up to a constant depth at a distance from the shoreline. In this case, a 200 m value was used for , which is the width covered by the video-monitoring system.
The set of plan views generated was used to detect and digitize the cusp systems during high tide, when these were easily identified. These were corrected to real world coordinates and used to measure cusp spacing, considering the mean sea level. Finally, several wavelet analyses were performed. This technique was developed by Grinsted et al. [47] for predicting intermittent periodicities (non-stationary) from a time series. The method is based on the convolution between the time series and the fix function (wavelet) with the given shape and variable wavelengths. When the length of the wavelet coincides with the wavelength of the time series, higher power is revealed in the spectrum. In this work, wavelet was applied for determining the wavelengths of the measured cusps, their spatial distribution and variability, and their signal intensities.
The wave data were extracted from a regional hindcast model developed by the National Port Authority [48]. Beach slope was extracted from previous works, from which a mean value of 0.02 was used, since at La Victoria beach the slope shows similar values during summer and winter seasons [49]. Regarding sediment grain size, a D50 value of 0.25 mm was used based on previous works [34,50].
The average hydrodynamic conditions (wave height, peak period, direction of wave approach, and height of the tide) were also computed for each case since these will have the greatest influence on the formation of the cusps [18], measured at high tide 2 and 5 days prior to the formation of the cusp system. High tide conditions were those with sea level heights above 2.5 m, which corresponds to the Mean High Water Neaps (MHWN) in the study area.
Lastly, the main theories of cusp generation were tested to find out which would better fit the observed cusp systems found in La Victoria beach. According to the sub-harmonic theory, the wavelength of the cuspate forms, lambda, is given by
where is the incoming wave time period. The synchronous hypothesis gives half of the above value, with the following expression:
The above two equations correspond to the standing edge wave theory. According to the self-organization theory, the wavelength is given by
where f is a constant coefficient with value 1.6 in field observations [17] and S is the horizontal swash excursion. The values of S were calculated from the plan views for every cusp system. In addition, the formulation by Sunamura [19] was studied. This formulation predicts cusp spacing based on wave and sediment parameters, defined as
Above, H is the nearshore wave height, A value is 1.35, and is a dimensionless parameter which introduces the effect of grain size (D, expressed in mm).
The relative errors of cusp spacing according to each hypothesis were also calculated as
where and are the wavelength calculated by the different theories and the wavelength measured in the planviews, respectively.
4. Results
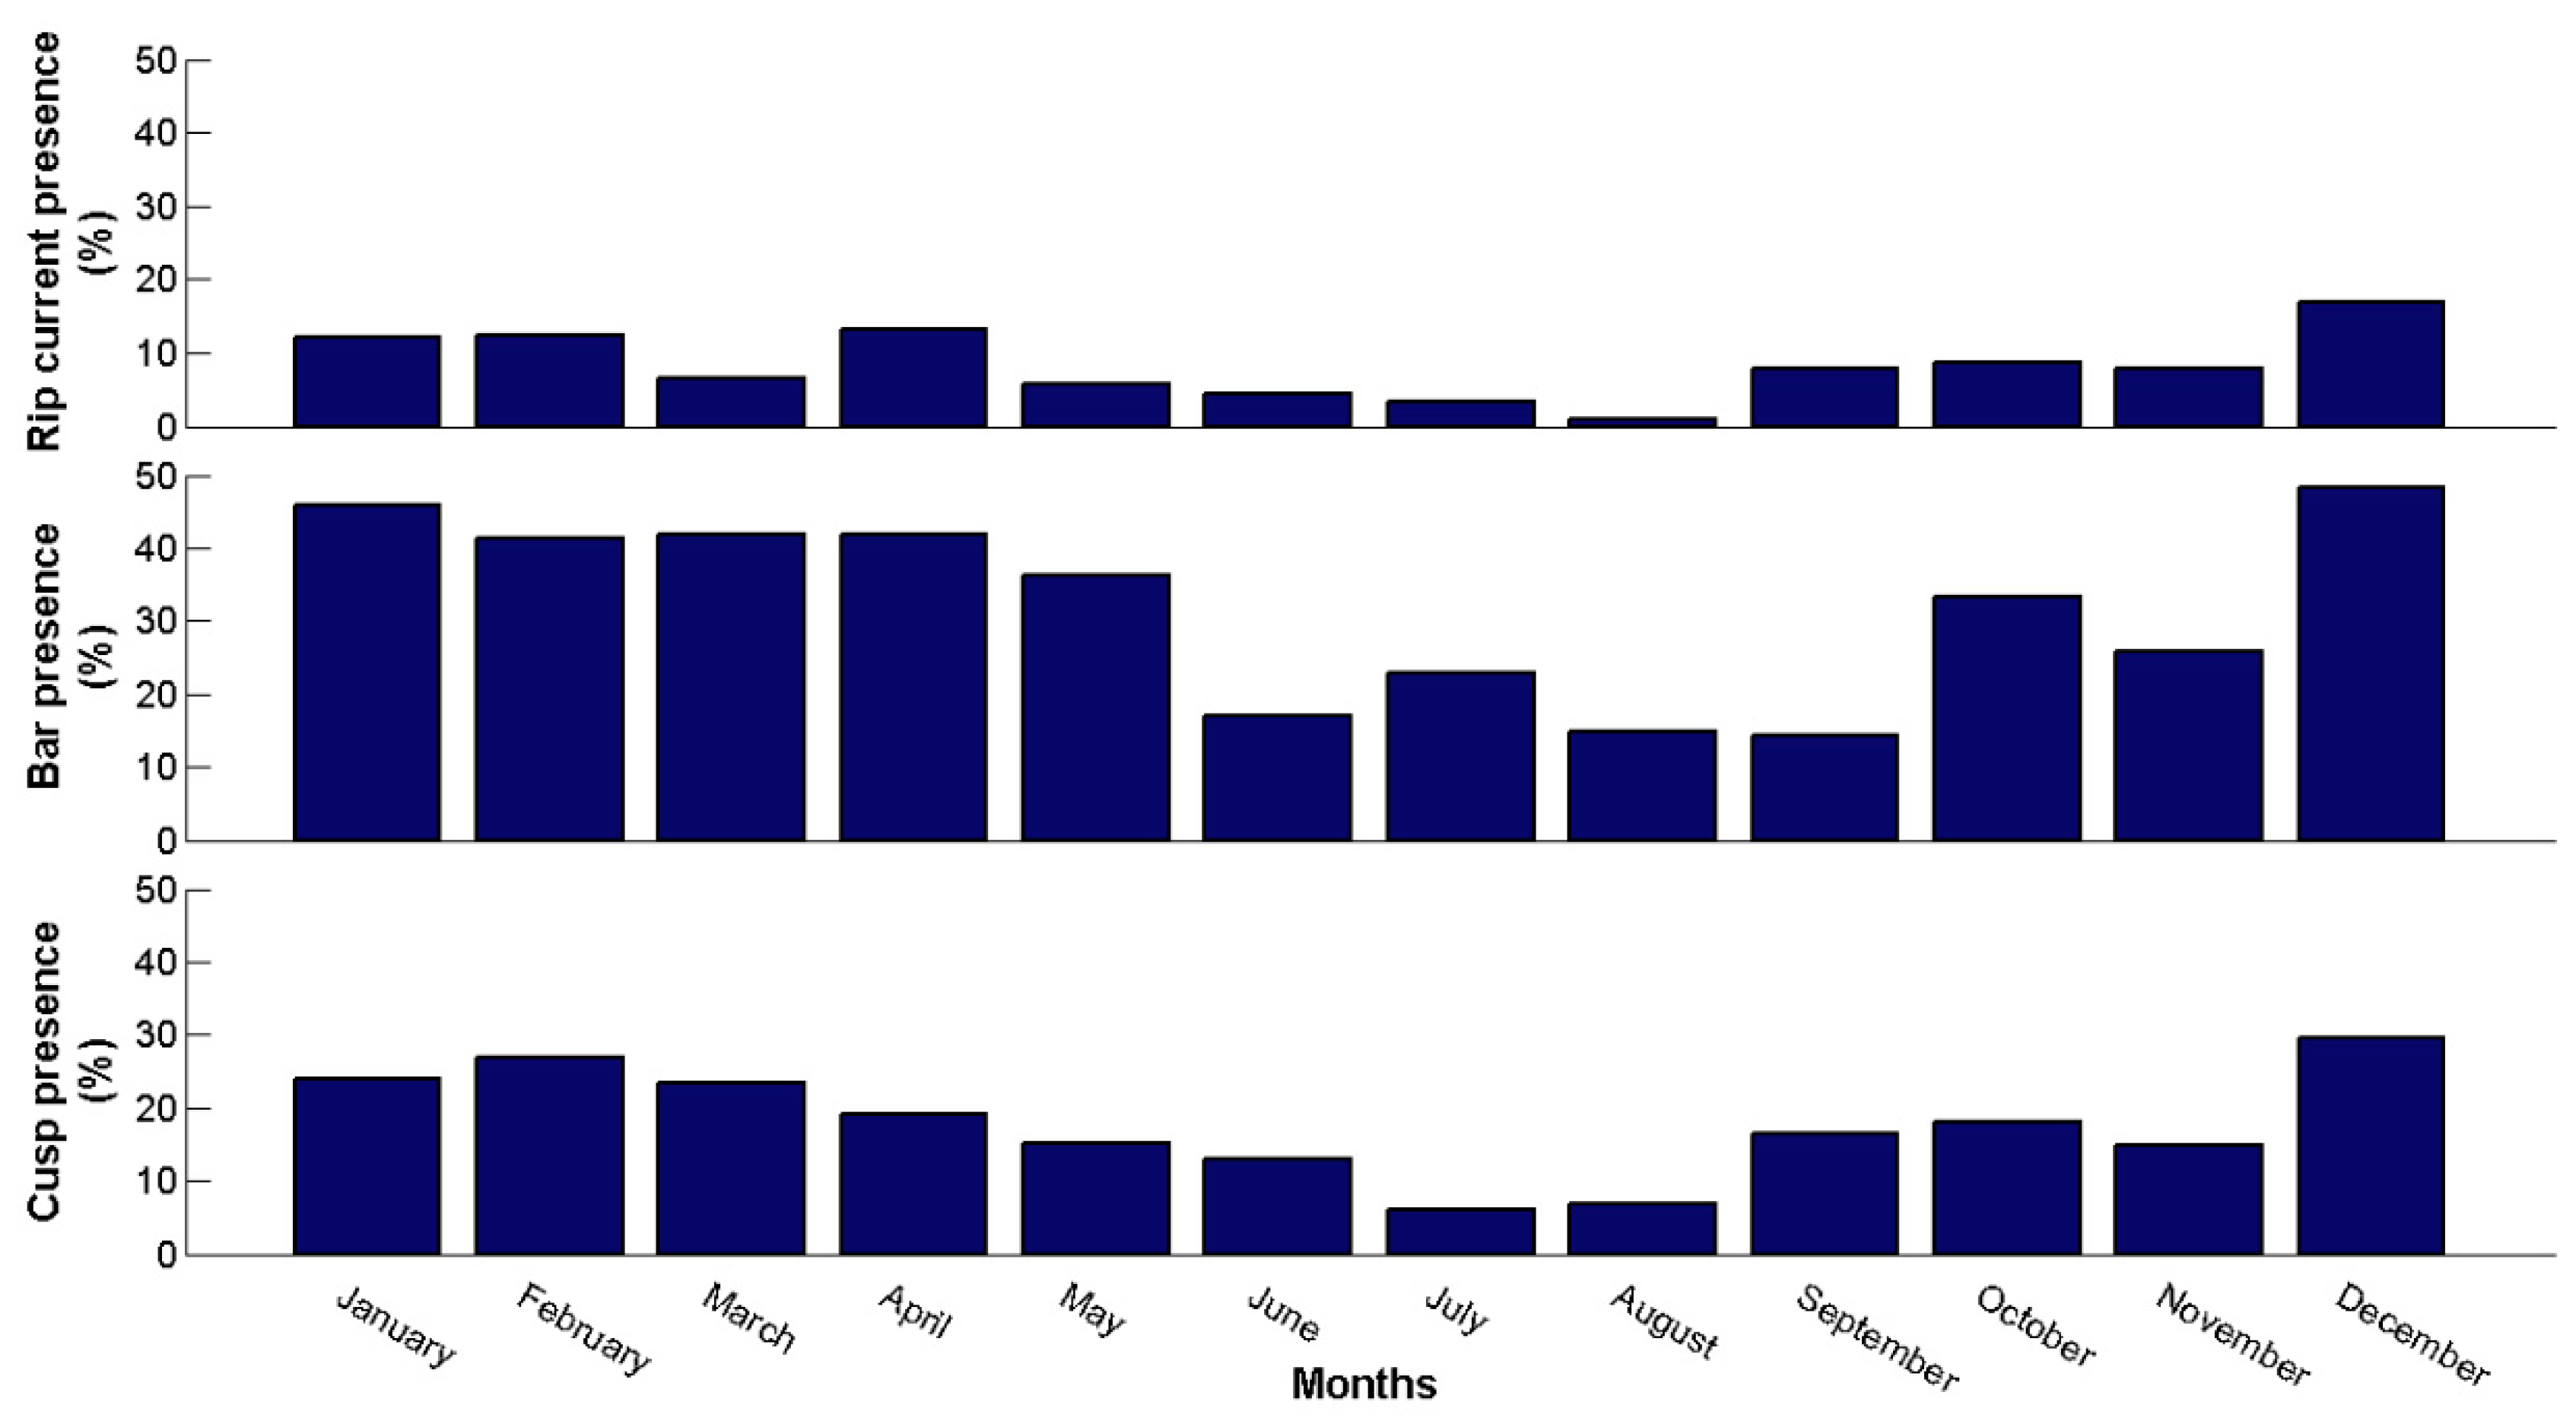
From the analysis of the plan view images generated by the video-monitoring system, the temporal and spatial distribution of the different mesoforms present in La Victoria beach is shown in Figure 4. Intertidal bars are the most abundant features, as they appeared on more than 40% of the analyzed plan views in months such as December and January, when they are more frequent. The presence of bars gradually decreased as the summer period approached, with the minimum presence occurring between June and September (around 20% of the plan views). The presence of bars increased again later towards the winter months (Figure 4). This pattern is found every year along the studied period (Figure 4 shows the average through the five analyzed years).
Beach cusps followed a similar trend, as their presence was more dominant between December and February before decreasing towards the summer, with minimum presence between June and August. Again, their number progressively increased after these months. The percentage of images in which cusps were observed is notably lower than that of the bars, with a maximum of about 30% and a minimum of 10% in summer months (Figure 4).
Rip currents were usually observed associated to the rip channel appearing between the bars, where water flowed into the sea during ebb tide after having accumulated in the landward trough during high tide. However, their presence was not common in the studied period, barely exceeding 10% of the plan views during December, January, and February, and even lower in the rest of the year. They followed a temporal distribution similar to that of the bars, with their minimum in summer.
Results of the morphodynamic analysis regarding the presence of bars indicated that La Victoria beach followed a barred-dissipative behavior according to the classification of Masselink and Short [45], with a RTR (Relative Tide Range) of 1.6. This morphodynamic state occurred both in summer and winter, with small differences between both periods. In fact, and as mentioned above, straight shore-parallel bars interrupted by rip channels were commonly observed in the plan views. The values of the dimensionless fall velocity (Ω) parameters are between 5.67 and 6.25 in the analyzed summers, and between 6.32 and 7.08 in the winters. These values indicate a dissipative behavior of the beach throughout the year, being more pronounced during the winter. During the study period, the bar parameter oscillated between 32–39 in the winter time, leading to the possible formation of a single bar. Conversely, these values varied from 46 to 52 in the summer time, increasing the beach capacity to accommodate even two bars according to Short and Aagaard [46].
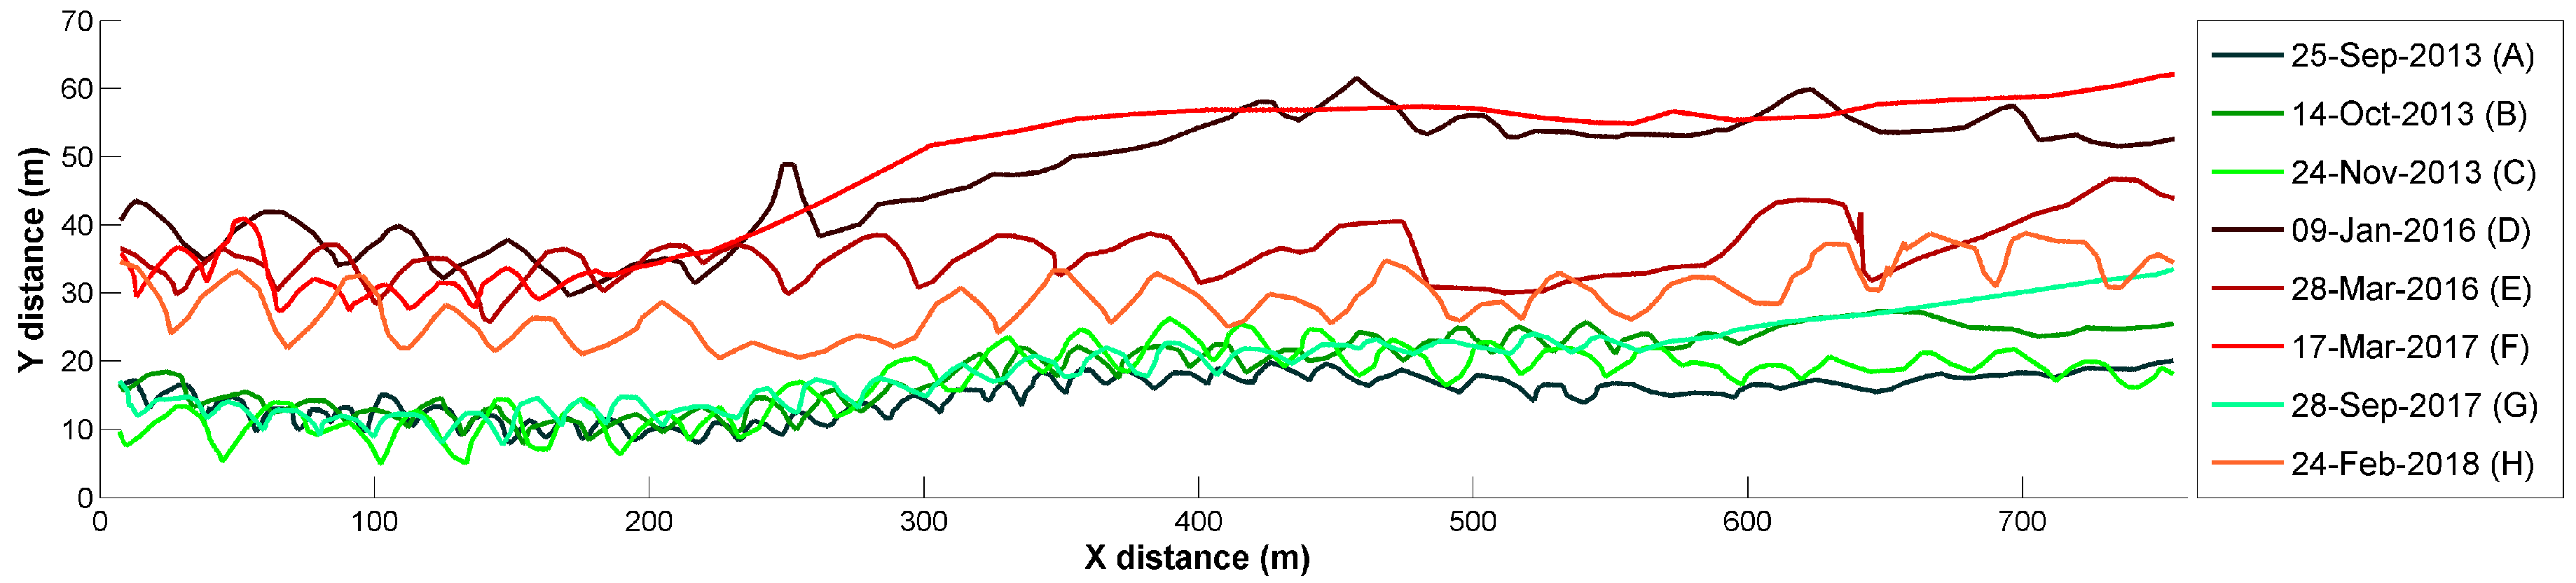
Eight cusp systems were identified at La Victoria beach over the study period on different seasons and with different characteristics (Table 1). As shown in Figure 5, there were two well differentiated sets of beach cusps. The first one (green lines) was located offshore, the second one (red lines) presented smaller and more uniform cusps, developing along almost the entire investigated stretch of coast. All of them were observed between the months of September and November. The second set of cusps, landwards, showed a wider spacing between the horns, which smoothed towards the southern part of the study area, or even disappeared in some cases. These systems were observed between the months of January and March. Based on the position and the morphological characteristics mentioned above, both sets were differentiated for the analysis (Table 1).
The hydrodynamic conditions present in the generation of the different cusp systems (Table 1) revealed that the first set, i.e., the systems with a smaller spacing between horns, was generated by lower wave heights (around 1 m) and shorter wave periods (between 7–8 s). The cusp episode of September 2017, which belongs to this first set, was related to a higher peak period but wave height during the previous days was 0.8 m, the lowest value observed. The second set of beach cusps was generated by higher wave heights (above 2 m in some cases) and longer periods (exceeding 10 s). The only exception was the March 2017 episode, with peak periods around 7 s and wave heights around 2.5 m (the highest). Regarding the direction of the incident waves, the waves generating the cusp systems with smaller spacing approached from a wide range of directions, between 166° and 280°, while the cusp episodes with a greater spacing were associated to a lower range of wave approach directions, between 265° and 285°, except in the system of March 2017. The normal angle of wave incident on La Victoria was 240°. In the set of smaller cusps, the hydrodynamic conditions between 5 and 2 days before the characterization of the cusps showed higher oscillations than in the set of larger cusps, mainly regarding the direction of wave approach, which was nearly constant in the cusp systems with longer wavelength (Table 1).
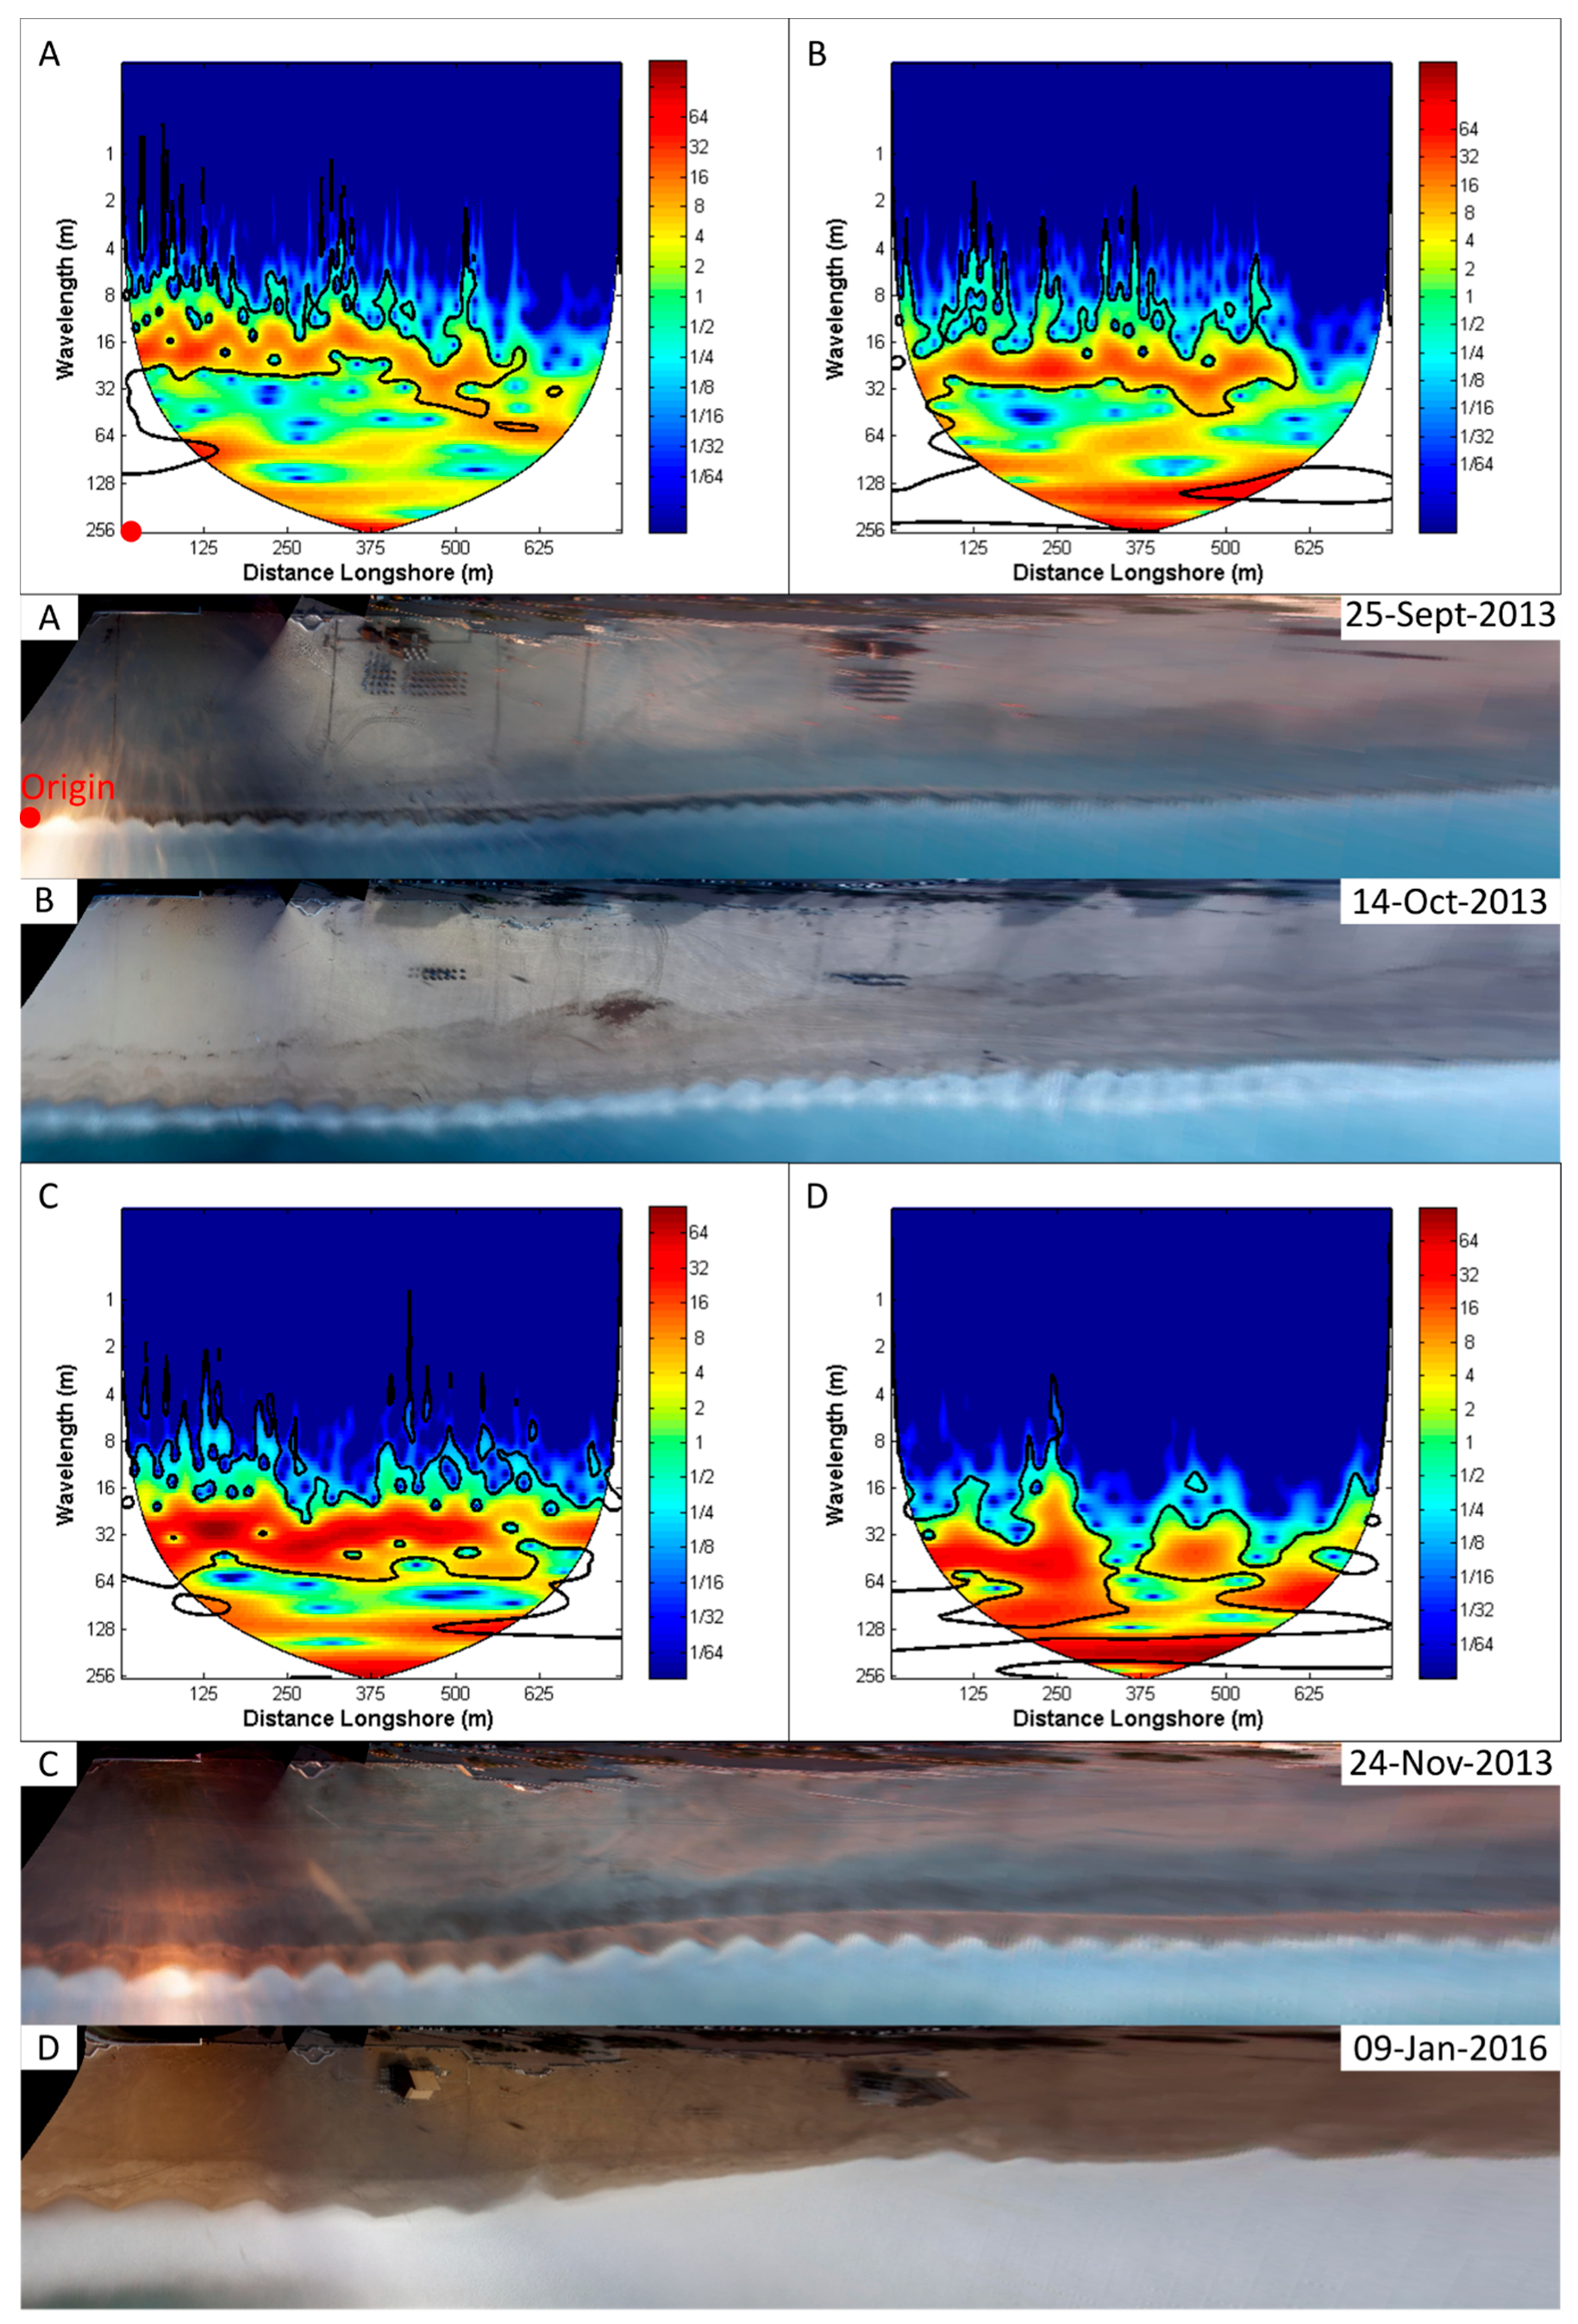
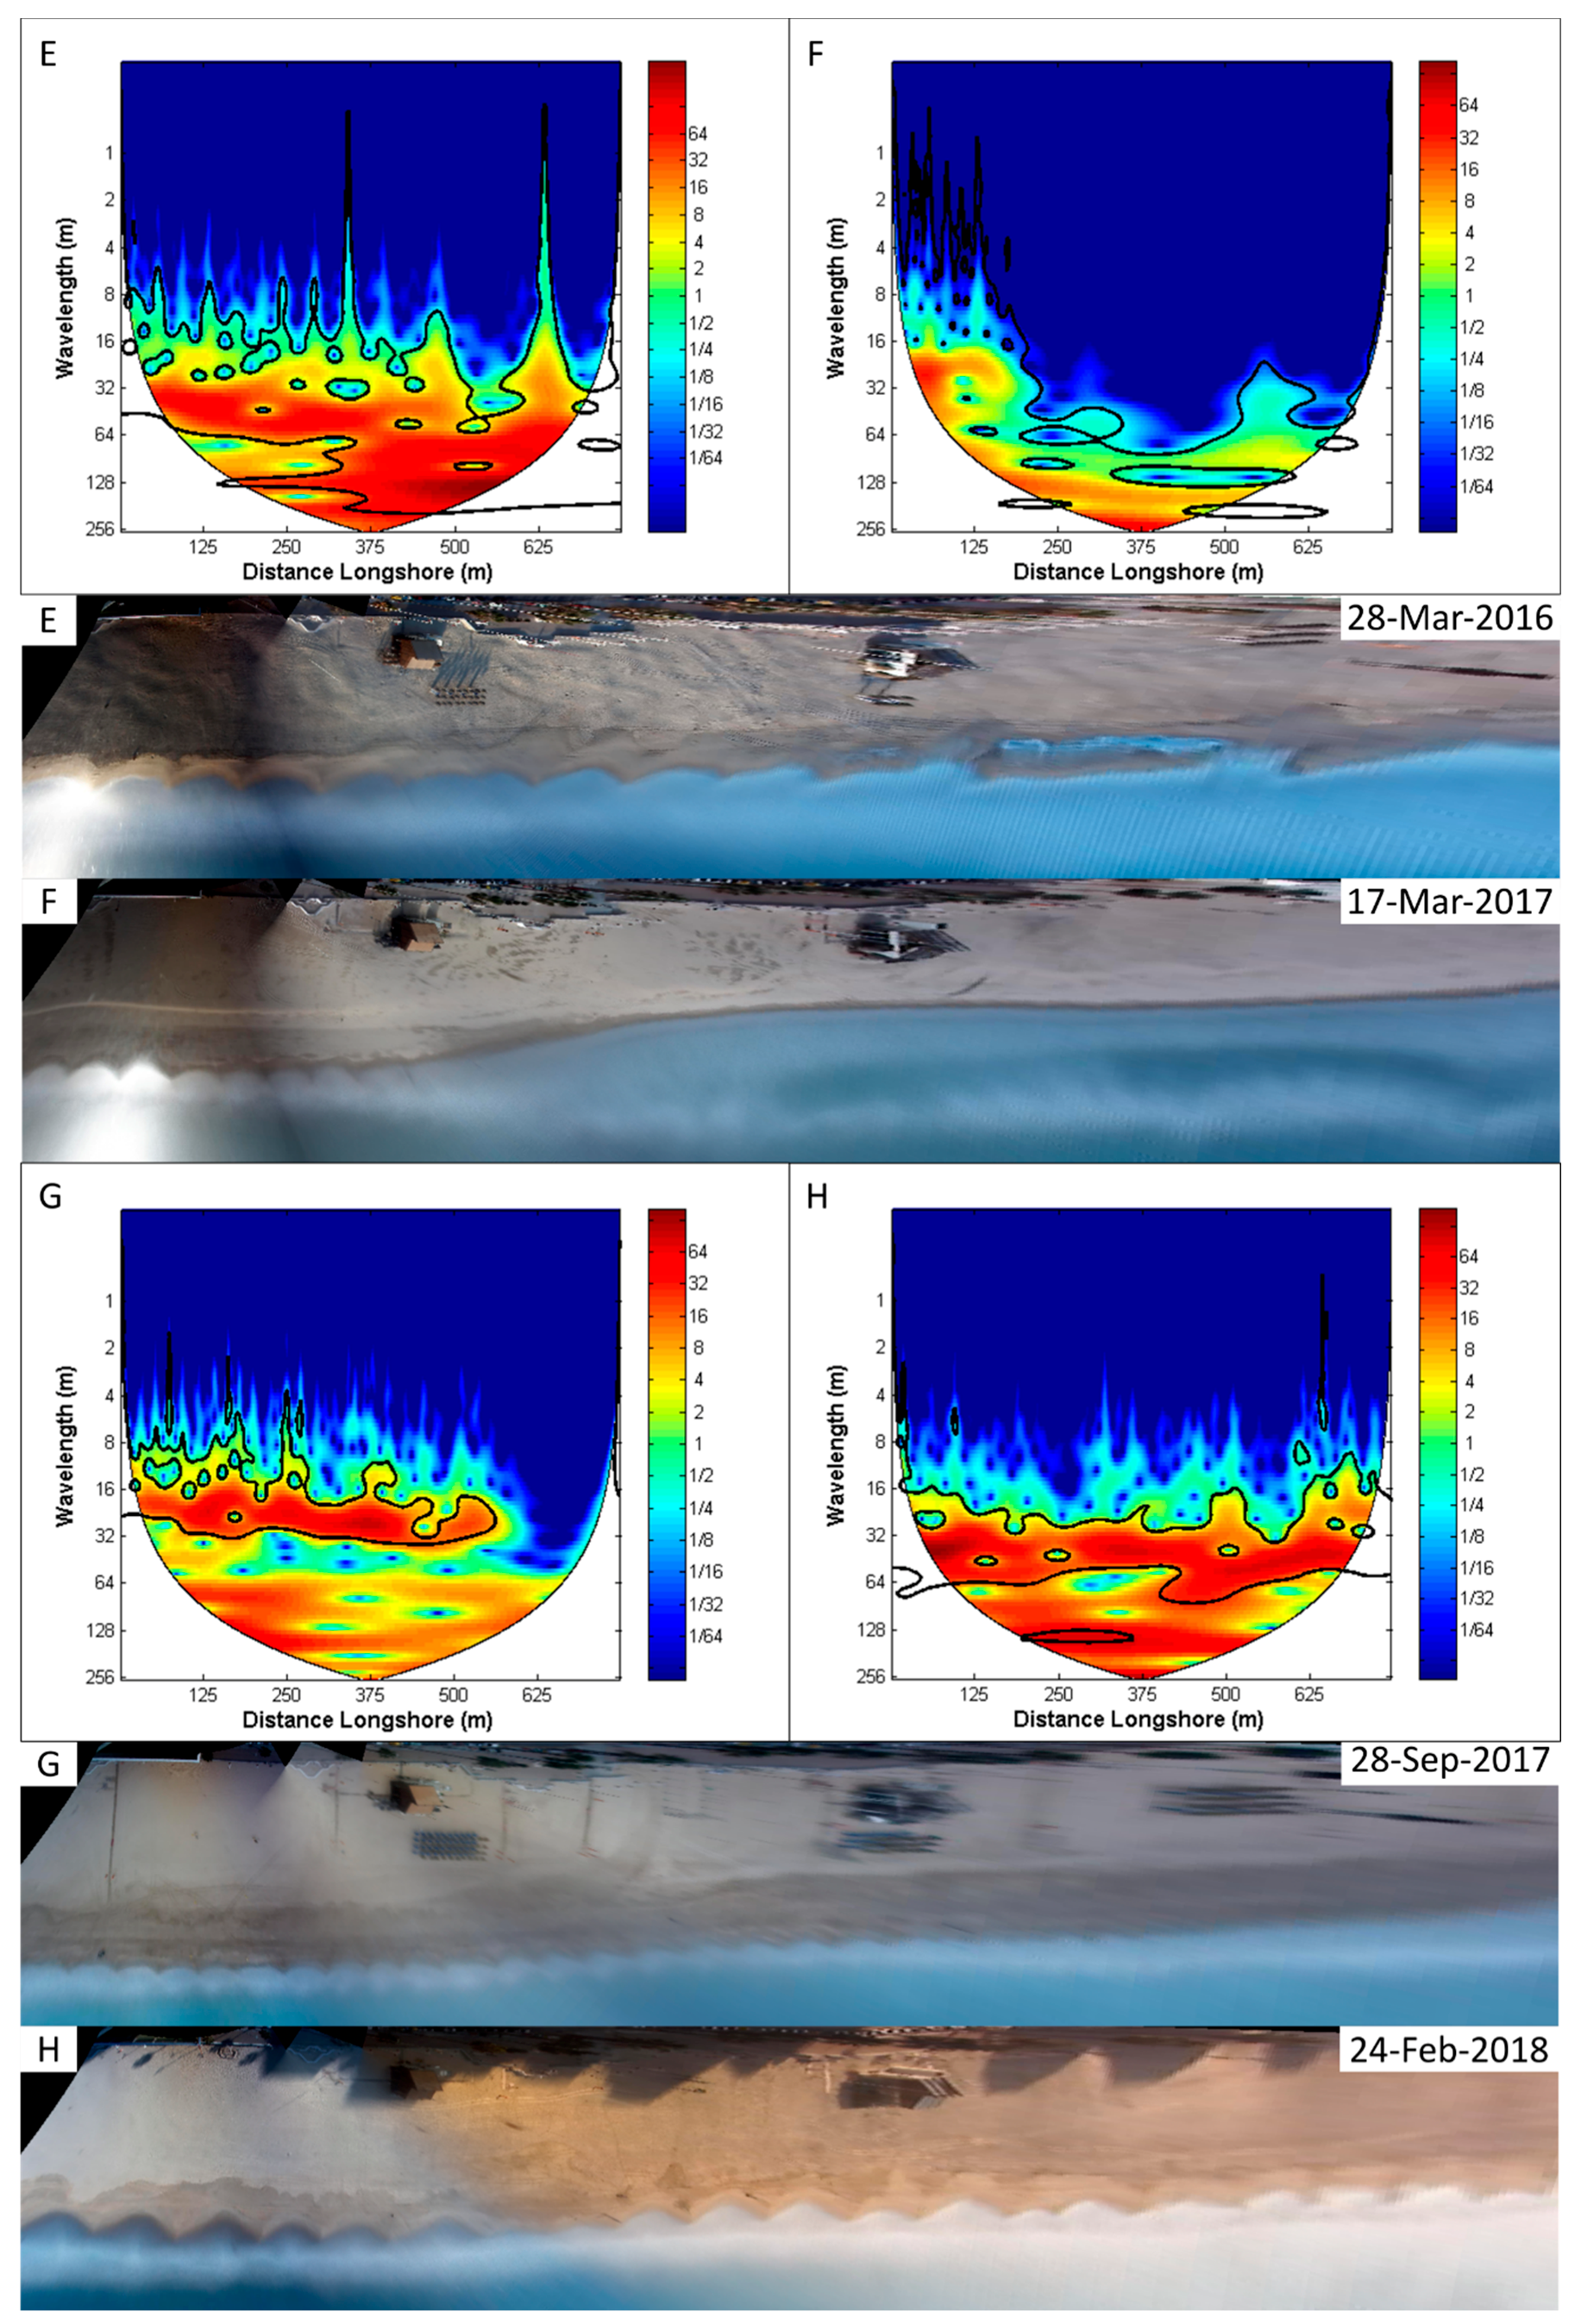
A wavelet analysis was performed to study the origin and end of the cusp systems and their possible spatial variability. In this respect, the varying wavelength and the location of the cusps can be appreciated in Figure 6 and Figure 7. The first type of cuspate episodes (A, B, C in Figure 6 and G in Figure 7) presented a wavelength between 19 and 23 m. Only in one of the cases, C, the cusp system covered the entire investigated stretch of coast, while the other systems extended about 600 m from the origin. The second type of cusp episodes (D in Figure 6 and E, F, and H in Figure 7) showed a wavelength between 40 and 45 m. In most of these cases the cusps were concentrated in the first 200 m from the origin, except for episode H, where they extended regularly along the studied coastal stretch.
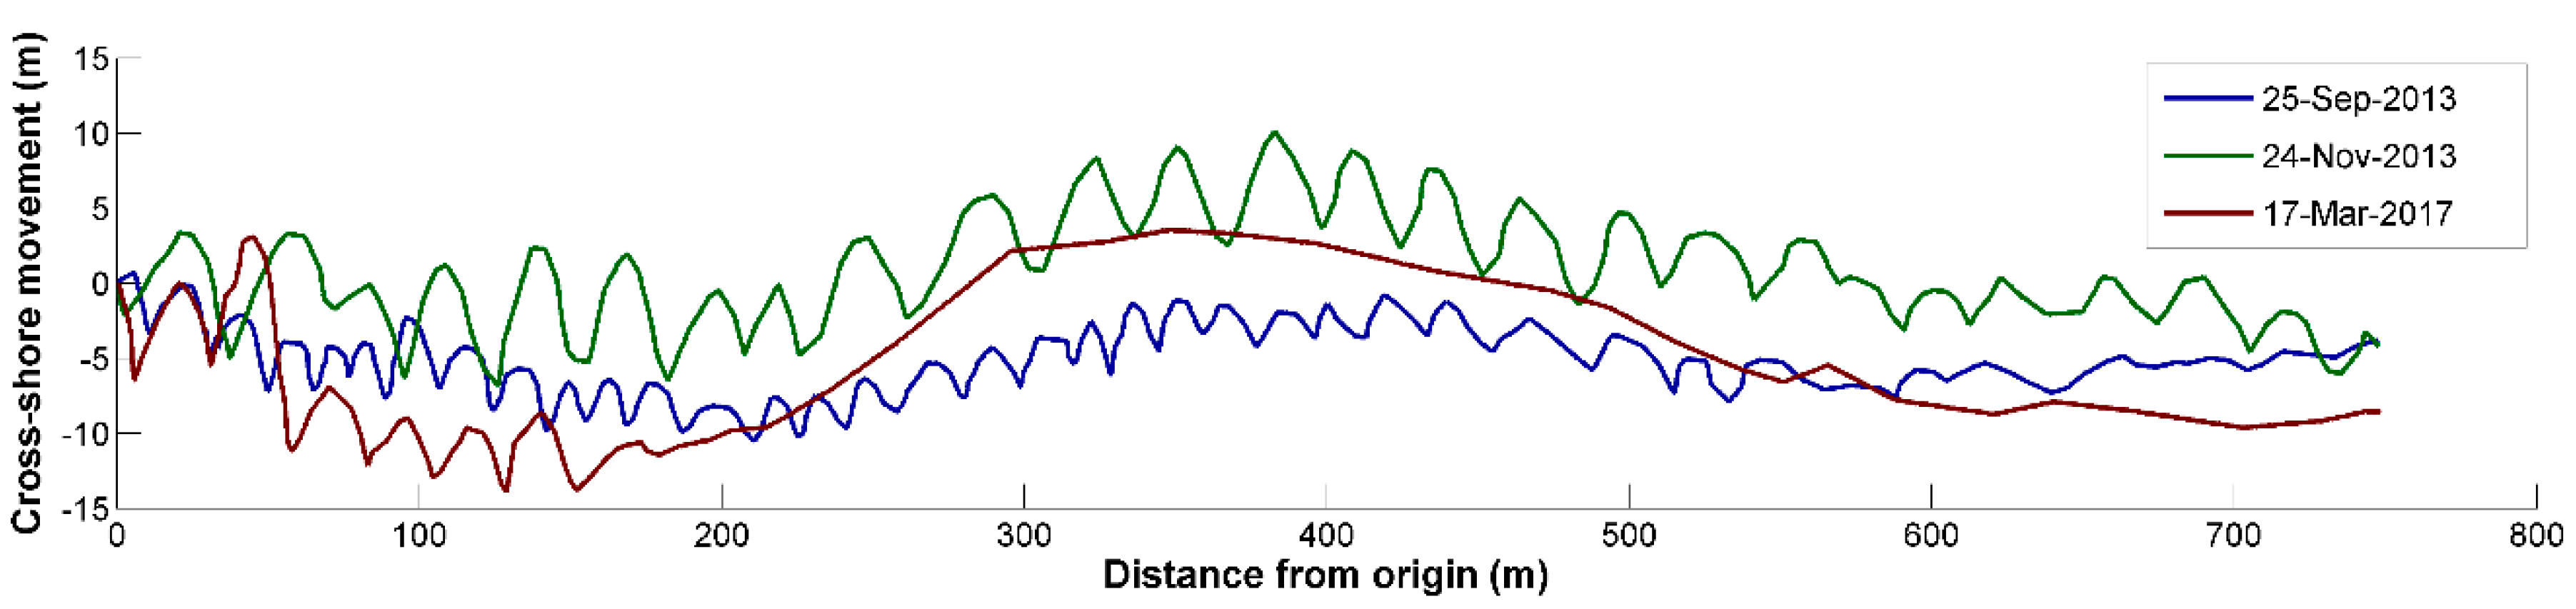
Apart from the aforementioned wavelengths of each cusp system, the wavelet analysis also allowed the detection of a wave signal of bigger magnitude (Figure 6 and Figure 7). The signal had a wavelength between 250 and 300 m, and it appeared on most of the digitized shorelines. In some of the wavelet analyses this signal could be observed in the longer wavelengths (Figure 8).
Regarding the possible mechanisms behind the generation of cusp systems, the theoretical wavelengths were calculated (see Methods section) and were compared with the observed wavelengths identified on the plan views (Table 2). Both hypotheses of standing edge waves theory (sub-harmonic and synchronous theories) presented a high relative error of 0.78 and 0.89, respectively. The results showed significant differences between the observed and the predicted spacing, which were over 15 m and 25 m for the systems with smaller and greater wavelengths, respectively. Regarding the self-organization hypothesis, these differences were lower than 5 m in most of the cases. However, they reached around 10 m in some of the systems with a longer wavelength (Table 2). In this hypothesis, the relative error was 0.13. Regarding the results after applying the Sunamura equation, the differences between the observed and the predicted spacing were between 8–25 m. The largest differences using this equation were found in the systems with a longer wavelength. The relative error associated to this equation was 0.51.
5. Discussion
The temporal distribution of intertidal bars in La Victoria beach is explained by the bar migrations experienced throughout the year. The greatest presence is observed in winter, between October and March, when there is a higher probability of storm occurrence in this area [40]. The beach erodes during this period, acquiring a more dissipative profile, and the bar migrates seaward, causing the waves to break and dissipating the energy that reaches the beach. In the subsequent fair weather months, between April and September, there is a landward migration of the bar, which is finally attached to the berm in some cases causing the beach to recover part of the sediment lost during storms [48]. As a consequence, the bars are not observed in the plan views. This onshore migration of the bar and its attachment to the berm makes it disappear from the plan view, and in this period wave energy is low and not capable of transporting new sand bars to the coast.
Rip currents in La Victoria beach appear associated with the rip drainage channels existing between the bars, so that their temporal distribution follows the same pattern as the bars. As a result, rip currents rarely appear in summer and they are usually weak. As such they do not pose a threat for beach recreation except in a few cases.
The formation of the cusps is linked to surf zone bars [49], so this can explain the similar distribution of the two mesoforms with minimum presence in the summer months, during which the average wave height is lower and there are few episodes when the swell increases enough to generate the swash necessary to produce these systems.
The temporal distribution of the mesoforms in La Victoria beach may also be influenced by the EA (East Atlantic Pattern) index, since it was observed that positive values of EA affect the swell waves approach making them more westerly directed [40]. This would result in a seaward migration of the bar due to the greater erosion or the impossibility of forming cusps with these conditions during the winter season.
The bars observed through the monitoring system were mainly straight shore-parallel bars or swash bars, since swash processes are the ones mostly controlling bar dynamics at La Victoria beach. Bars appeared more frequently in the southern sector of the study zone, where the offshore rocky platform near the coast is located at deeper areas [50] (Figure 9). As a result, the sediment has no obstacles to migrate landward or seaward. In addition, the strong longshore drift to the southeast existing in the area [34] provides a low amount of sediment in the northern section, where the city coastline is constituted by sea walls and the beach is located between groins and several rocky outcrops which prevents the normal flow of sediments.
Regarding the beach morphodynamic state, results obtained for Ω indicate a dissipative behavior in La Victoria, which would be classified as barred-dissipative according to Masselink and Short [45]. The results are in accordance with other studies that were carried out in the area such as Benavente et al. [39]. This beach shows a clear dissipative behavior during winter, while low-energy waves in summer provide sediment to the beach and its behavior ranges between intermediate-dissipative and dissipative. According to Short and Aagaard [46], the winter behavior is clear, with capacity for the development of one single bar. However, the parameter is on the limit between one and two bars during summer, which would explain that the closest bar to the coast was attached to the berm, and another deeper bar continues its landward migration as previously mentioned.
In the various cusp systems analyzed, two clearly differentiated behaviors can be observed, both in the analysis of their position (Figure 5) and in the hydrodynamic conditions forming them (Table 1), as well as in the wavelet analysis (Figure 6 and Figure 7). The presence of several cusp systems located at different positions on a beach was already seen in other studies [32,51,52]. The first set coincides with less energetic conditions, with wave heights around 1 m and with periods around 7–8 s, which produces a reduced swash that results in a lower spacing than the other systems. In turn, after summer the beach has a steeper slope so the penetration capacity of the swash is reduced. On the other hand, the second set coincides with more energetic conditions. The height of the wave exceeds 2 m in some cases and there are periods above 10 s, sometimes coinciding with the days prior to or during a storm. The lower slope of the beach after winter, the swell, and longer wave periods increase the penetration capacity of the swash, placing the cusps in a more landward position and with a longer wavelength.
To study the hydrodynamic conditions under which the cusp systems were formed, the wave height, peak period, direction of wave, and tide were analyzed during times when the tide was greater than MHWN in the periods of two and five days before the cusps were identified. The analysis of the hydrodynamic conditions two days before the digitization of the cusp system was chosen because these systems form rapidly [1], and the interval of five days before the digitization was used to study the different behaviors between the aforementioned two sets of systems. It was observed that the formation of the cusp systems with longer wavelengths needs constant conditions for a longer time, while in the days before the generation of the smaller systems the conditions are more variable, except in the March 2017 system (Figure 7F). In this case, the wave height and the peak period were similar on the days before the system was digitized, but the wave direction turned to the east. This system was the only one with a large wavelength that was formed with waves from the southeast (126°), originating only in the northern part. This fact highlights the importance of the rocky platform in the formation of the cusps at La Victoria beach (Figure 9), because these systems are formed more easily when the waves are perpendicular to the coast [53]. In this case, the rocky platform refracts the wave fronts causing them to reach the coast in a parallel way. With the approach of waves in the days prior to the March 2017 system, this only occurs in the northern part, since in the rest of the coast the waves arrive at the beach without the effect of the rocky platform. In the other systems with longer wavelengths the waves approach from the west, between 265° and 285°, increasing the shadow zone of the rocky platform and distributing the cusps more widely. The effect of the rocky platform would also explain the presence of these forms on the beach. In fact, these systems usually appear on beaches which are quite different to La Victoria, especially intermediate-reflective beaches with a medium-coarse grain size (due to the breaking wave type in these beaches [19]) as in most natural systems analyzed by Coco et al. [17].
In previous studies on beach cusps [3] there is a great discrepancy about whether they form during periods of erosion or accretion. On La Victoria beach two behaviors can be differentiated resulting from the conditions in which they developed. The smaller cusps may be associated with recovery (accretionary) periods after storms, while larger cusps under higher energetic conditions may be associated with erosive patterns. In the latter case, the cusps are formed and if the storm persists, they are erased from the shoreline. The study carried out by Almar et al. [12] clearly established that cusp systems that disappear with storms are related to erosive events, while those that disappear with the formation of a berm coincided with accretionary events.
A longer wave was observed in the plan views and in the wavelet analysis. This wave appeared in all digitized systems used and its node was always in the same location. Given the aforementioned influence of the rocky platform on the cuspate systems and the fixed position of the wave node, it can be derived that this effect was produced by the presence of the rocky platform, which dissipates the energy during the storms and prevents erosion processes. In the section where the platform is absent, the coastline is located more inland because the beach is more exposed to the energy of incoming waves.
As for the causes of the formation of cusp systems in La Victoria beach, the theory of self-organization is the one that best predicts the cusp characteristics. With a relative error of 0.13, it can explain the cusps development considerably better than the other theories analyzed in this work and would highlight the importance of the swash excursion on a dissipative beach. The edge wave theory, with relative errors of 0.78 for the sub-harmonic hypothesis and 0.89 for the synchronous hypothesis, and Sunamura equation, with a relative error of 0.51, are not capable of predicting the behavior of these systems in an acceptable way. According to these results, the most important mechanisms to explain the behavior of the cusps in La Victoria beach are the positive feedback between the existing morphology and the flow, which originates the systems, and the negative feedback that occurs due to the circulation in the cusps embayments, which stabilizes them [15]. This explains that the cusps of La Victoria beach show a long wavelength, since the gentle slope of the beach facilitates the swash excursion. However, this does not exclude the presence of edge waves in the process of cusp formation. In fact, none of the analyzed theories can fully explain the behavior of these systems, with important differences between real and theoretical values according to the theory of self-organization in some events, so it is likely that they are influenced by other mechanisms as some authors previously accepted [17]. It seems reasonable that the relative error in the cusp wavelength spacing calculated with the Sunamura equation will decrease if the values used for the main parameters are modified by determining mean sediment grain size in each cusp event and obtaining the nearshore waves, taking into account the irregular bathymetry of the area. However, for this study, mean grain size values have been used for the entire study area, and wave propagation has not been carried out.
6. Conclusions
The video-monitoring system output was used to generate plan views of La Victoria beach. The plan views together with the hydrodynamic data of the studied period allowed to analyze the spatial and temporal variability of different mesoforms (bars and cusps) present in the beach.
The use of mesoforms as indicators of the spatiotemporal variability of the beach provided a useful tool and helped with the identification of nearshore processes responsible for their formation. The presence of the rocky shore platform had a great influence on the spatial variability of mesoforms in La Victoria beach. It controls the evolution of the bars, preventing their landward motion in the northern zone where it is located at a higher level. At the same time, it refracts and modulates the wave energy resulting in more shore-parallel incident waves, facilitating cusp formation in conditions in which they do not usually appear. When the wave direction is more easterly, this results in cusps forming only at the northern part. Finally, the rocky platform is responsible for an alongshore gradient in wave energy resulting in a more exposed southern part and the subsequent differential erosion of the beach. This is shown by the presence of a coastline waveform with lengths of 250–300 m, especially in the stormy season.
Two types of cusps systems were observed. In general terms, cusps with large wavelengths (more than 40 m) were associated with wave periods longer than 10 s, while smaller cusp systems (approx. 20 m) were associated with wave periods below 10 s. The cusp systems were always observed around mean high water. However, their relative position varied depending on the seasonal shoreline position. The self-organization theory was able to accurately predict the cusp wavelength, suggesting that the cusps were formed due to the interaction between the bathymetry and the swash dynamics. The small relative errors found with this theory could be attributed to smaller scale processes or measurement uncertainty in the determination of environmental parameters.
As proven by this work, video-monitoring systems are one of the most appropriate tools for analyzing mesoscale processes, as they provide high temporal sampling (from hours to days) over large areas. In terms of wavelet analysis, it has proved to be an adequate technique for the identification of cusps. Different wavelengths were correctly identified for each system together with their intensities and spatial extent throughout the shoreline.
Author Contributions
This work was conceptualized by L.d.R., J.B., and J.M. Camera installation, image processing, and data analysis was undertaken by T.A.P., G.S., and J.M. All authors contributed to writing, reviewing, and editing of the document. L.d.R. and J.B. were responsible of the project.
Funding
This research was funded by the Spanish Ministry of Economy and Competitiveness under ADACOSTA research project, grant number CGL2014-53153-R. J. Montes was supported by the FPI contract (BES-2015-073218) associated with the project above and by the mobility grant associated with FPI contract.
Acknowledgments
This work is a contribution to the research group RNM-328 of the Andalusian Research Plan (PAI). The authors are grateful to Spanish Port Authorities (Puertos del Estado) for providing the wave data, as well as M. Puig, M. Aranda, L. Talavera, and P. Zarandona for assistance in field work, and A. Joseph for assistance in image processing. The authors are grateful to M.I. Vousdoukas for providing the ORASIS video-monitoring video software to extract the basic image products.
Conflicts of Interest
The authors declare no conflict of interest.
References
- Ribas, F.; Falqués, A.; de Swart, H.E.; Dodd, N.; Garnier, R.; Calvete, D. Understanding coastal morphodynamic patterns from depth-averaged sediment concentration. Rev. Geophys. 2015, 53, 362–410. [Google Scholar] [CrossRef] [Green Version]
- Caballeria, M.; Coco, G.; Falqués, A.; Huntley, D.A. Self-organization mechanisms for the formation of nearshore crescentic and transverse sand bars. J. Fluid Mech. 2002, 465, 379–410. [Google Scholar] [CrossRef]
- Coco, G.; Burnet, T.K.; Werner, B.T. The role of tides in beach cusp development. J. Geophys. Res. C Oceans 2004, 109, 1–12. [Google Scholar] [CrossRef]
- Aagaard, T.; Masselink, G. The surf zone. In Handbook of Beach and Shoreface Morphodynamics; Short, A.D., Ed.; John Wiley & Sons: New York, NY, USA, 1999; pp. 72–118. ISBN 0-471-96570-7. [Google Scholar]
- Radermacher, M.; De Schipper, M.A.; Price, T.D.; Huisman, B.J.A. Behaviour of subtidal sandbars in response to nourishments. Geomorphology 2018, 313, 1–12. [Google Scholar] [CrossRef]
- Athanasiou, P.; de Boer, W.; Yoo, J.; Ranasinghe, R.; Reniers, A. Analysing decadal-scale crescentic bar dynamics using satellite imagery: A case study at Anmok beach, South Korea. Mar. Geol. 2018, 405, 1–11. [Google Scholar] [CrossRef]
- Wright, L.; Short, A. Morphodynamic variability of surf zones and beaches: A synthesis. Mar. Geol. 1984, 56, 93–118. [Google Scholar] [CrossRef]
- Ruessink, B.; van Enckevort, I.M.; Kingston, K.; Davidson, M. Analysis of observed two- and three-dimensional nearshore bar behaviour. Mar. Geol. 2000, 169, 161–183. [Google Scholar] [CrossRef]
- Orzech, M.D.; Thornton, E.B.; MacMahan, J.H.; O’Reilly, W.C.; Stanton, T.P. Alongshore rip channel migration and sediment transport. Mar. Geol. 2010, 271, 278–291. [Google Scholar] [CrossRef]
- Van de Lageweg, W.I.; Bryan, K.R.; Coco, G.; Ruessink, B.G. Observations of shoreline–sandbar coupling on an embayed beach. Mar. Geol. 2013, 344, 101–114. [Google Scholar] [CrossRef]
- Pellón, E.; Garnier, R.; Medina, R. Intertidal finger bars at El Puntal, Bay of Santander, Spain: Observation and forcing analysis. Earth Surf. Dyn. 2014, 2, 349–361. [Google Scholar] [CrossRef] [Green Version]
- Almar, R.; Coco, G.; Bryan, K.R.; Huntley, D.A.; Short, A.D.; Senechal, N. Video observations of beach cusp morphodynamics. Mar. Geol. 2008, 254, 216–223. [Google Scholar] [CrossRef]
- Van Gaalen, J.F.; Kruse, S.E.; Coco, G.; Collins, L.; Doering, T. Observations of beach cusp evolution at Melbourne Beach, Florida, USA. Geomorphology 2011, 129, 131–140. [Google Scholar] [CrossRef]
- Guza, R.T.; Inman, D.L. Edge waves and beach cusps. J. Geophys. Res. 1975, 80, 2997–3012. [Google Scholar] [CrossRef]
- Werner, B.T.; Fink, T.M. Beach cusps as self-organized patterns. Science 1993, 260, 968–971. [Google Scholar] [CrossRef] [PubMed]
- Komar, P.D. Beach Processes and Sedimentation, 2nd ed.; Prentice-Hall: Englewood Cliffs, NJ, USA, 1998. [Google Scholar]
- Coco, G.; O’hare, T.J.; Huntley, D.A. Beach Cusps: A Comparison of Data and Theories for Their Formation. Source J. Coast. Res. J. Coast. Res. 1999, 15, 741–749. [Google Scholar]
- Masselink, G.; Russell, P.; Coco, G.; Huntley, D. Test of edge wave forcing during formation of rhythmic beach morphology. J. Geophys. Res. Oceans 2004, 109. [Google Scholar] [CrossRef] [Green Version]
- Sunamura, T. A predictive relationship for the spacing of beach cusps in nature. Coast. Eng. 2004, 51, 697–711. [Google Scholar] [CrossRef]
- Holland, K.T.; Holman, R.A.; Lippmann, T.C.; Stanley, J.; Plant, N. Practical use of video imagery in nearshore oceanographic field studies. IEEE J. Ocean. Eng. 1997, 22, 81–92. [Google Scholar] [CrossRef]
- Bracs, M.A.; Turner, I.L.; Splinter, K.D.; Short, A.D.; Lane, C.; Davidson, M.A.; Goodwin, I.D.; Pritchard, T.; Cameron, D. Evaluation of Opportunistic Shoreline Monitoring Capability Utilizing Existing “Surfcam” Infrastructure. J. Coast. Res. 2016, 319, 542–554. [Google Scholar] [CrossRef]
- Stockdon, H.F.; Holman, R.A. Estimation of wave phase speed and nearshore bathymetry from video imagery. J. Geophys. Res. Oceans 2000, 105, 22015–22033. [Google Scholar] [CrossRef] [Green Version]
- Vousdoukas, M.I.; Ferreira, P.M.; Almeida, L.P.; Dodet, G.; Psaros, F.; Andriolo, U.; Taborda, R.; Silva, A.N.; Ruano, A.; Ferreira, Ó.M. Performance of intertidal topography video monitoring of a meso-tidal reflective beach in South Portugal. Ocean Dyn. 2011, 61, 1521–1540. [Google Scholar] [CrossRef]
- Holman, R.; Plant, N.; Holland, T. cBathy: A robust algorithm for estimating nearshore bathymetry. J. Geophys. Res. Oceans 2013, 118, 2595–2609. [Google Scholar] [CrossRef] [Green Version]
- Davidson, M.A.; Aarninkhof, S.G.J.; Van Koningsveld, M.; Holman, R.A. Developing Coastal Video Monitoring Systems in Support of Coastal Zone Management. J. Coast. Res. 2006, 39, 49–56. [Google Scholar]
- Kroon, A.; Davidson, M.A.; Aarninkhof, S.G.J.; Archetti, R.; Armaroli, C.; Gonzalez, M.; Medri, S.; Osorio, A.; Aagaard, T.; Holman, R.A.; et al. Application of remote sensing video systems to coastline management problems. Coast. Eng. 2007, 54, 493–505. [Google Scholar] [CrossRef]
- Jiménez, J.A.; Sancho-García, A.; Bosom, E.; Valdemoro, H.I.; Guillén, J. Storm-induces damages along the Catalan coast (NW Mediterranean) during the period 1958–2008. Geomorphology 2012, 143–144, 24–33. [Google Scholar] [CrossRef]
- Vousdoukas, M.I.; Wziatek, D.; Almeida, L.P. Coastal vulnerability assessment based on video wave run-up observations at a mesotidal, steep-sloped beach. Ocean Dyn. 2012, 62, 123–137. [Google Scholar] [CrossRef]
- Simarro, G.; Bryan, K.R.; Guedes, R.M.C.; Sancho, A.; Guillen, J.; Coco, G. On the use of variance images for runup and shoreline detection. Coast. Eng. 2015, 99, 136–147. [Google Scholar] [CrossRef]
- Armaroli, C.; Ciavola, P. Dynamics of a nearshore bar system in the northern Adriatic: A video-based morphological classi fi cation. Geomorphology 2011, 126, 201–216. [Google Scholar] [CrossRef]
- Splinter, K.D.; Gonzalez, M.V.G.; Oltman-shay, J.; Rutten, J.; Holman, R. Observations and modelling of shoreline and multiple sandbar behaviour on a high-energy meso-tidal beach. Cont. Shelf Res. 2018, 159, 33–45. [Google Scholar] [CrossRef]
- Vousdoukas, M.I. Erosion/accretion patterns and multiple beach cusp systems on a meso-tidal, steeply-sloping beach. Geomorphology 2012, 141–142, 34–46. [Google Scholar] [CrossRef]
- Gracia, F.J.; Rodríguez-Vidal, J.; Cáceres, L.M.; Belluomini, G.; Benavente, J.; Alonso, C. Diapiric uplift of an MIS 3 marine deposit in SW Spain: Implications for Late Pleistocene sea level reconstruction and palaeogeography of the Strait of Gibraltar. Quat. Sci. Rev. 2008, 27, 2219–2231. [Google Scholar] [CrossRef]
- Del Río, L.; Gracia, F.J.; Benavente, J. Shoreline change patterns in sandy coasts. A case study in SW Spain. Geomorphology 2013, 196, 252–266. [Google Scholar] [CrossRef] [Green Version]
- Gracia, F.J.; Del Río, L.; Alonso, C.; Benavente, J.; Anfuso, G. Historical evolution and present state of the coastal dune systems in the Atlantic coast of Cadiz (SW Spain): Palaeoclimatic and environmental implications. J. Coast Res. 2006, 55–63. [Google Scholar]
- Muñoz-Perez, J.J.; Lopez De San Roman-Blanco, B.; Gutierrez-Mas, J.M.; Moreno, L.; Cuena, G.J. Cost of beach maintenance in the Gulf of Cadiz (SW Spain). Coast. Eng. 2001, 42, 143–153. [Google Scholar] [CrossRef]
- Muñoz-Perez, J.J.; Roman-Sierra, J.; Navarro-Pons, M.; da Graça Neves, M.; del Campo, J.M. Comments on “Confirmation of beach accretion by grain-size trend analysis: Camposoto beach, Cádiz, SW Spain” by E. Poizot et al. (2013) Geo-Marine Letters 33(4). Geo-Mar. Lett. 2014, 34, 75–78. [Google Scholar] [CrossRef]
- Davis, R.A.; Hayes, M.O. What is a Wave-Dominated Coast? Mar. Geol. 1984, 60, 313–329. [Google Scholar] [CrossRef]
- Benavente, J.; Plomaritis, T.A.; del Río, L.; Puig, M.; Valenzuela, C.; Minuzzi, B. Differential short- and medium-term behavior of two sections of an urban beach. J. Coast. Res. 2014, 621–626. [Google Scholar] [CrossRef]
- Plomaritis, T.A.; Benavente, J.; Laiz, I.; Del, L. Variability in storm climate along the Gulf of Cadiz: The role of large scale atmospheric forcing and implications to coastal hazards. Clim. Dyn. 2015, 2499–2514. [Google Scholar] [CrossRef]
- Del Río, L.; Plomaritis, T.A.; Benavente, J.; Valladares, M.; Ribera, P. Establishing storm thresholds for the Spanish Gulf of Cádiz coast. Geomorphology 2012, 143–144, 13–23. [Google Scholar] [CrossRef]
- Holman, R.A.; Stanley, J. The history and technical capabilities of Argus. Coast. Eng. 2007, 54, 477–491. [Google Scholar] [CrossRef]
- Simarro, G.; Ribas, F.; Álvarez, A.; Guillén, J.; Chic, Ò.; Orfila, A. ULISES: An Open Source Code for Extrinsic Calibrations and Planview Generations in Coastal Video Monitoring Systems. J. Coast. Res. 2017, 335, 1217–1227. [Google Scholar] [CrossRef]
- Nieto, M.A.; Garau, B.; Balle, S.; Simarro, G.; Zarruk, G.A.; Ortiz, A.; Tintoré, J.; Álvarez-Ellacuría, A.; Gómez-Pujol, L.; Orfila, A. An open source, low cost video-based coastal monitoring system. Earth Surf. Process. Landf. 2010, 35, 1712–1719. [Google Scholar] [CrossRef] [Green Version]
- Masselink, G.; Short, A.D. The effect of tide range on beach morphodynamics, a conceptual beach model. J. Coast. Res. 1993, 9, 785–800. [Google Scholar]
- Short, A.D.; Aagaard, T. Single and Multi-Bar Beach Change Models. J. Coast. Res. 1993, 15, 141–157. [Google Scholar]
- Grinsted, A.; Moore, J.C.; Jevrejeva, S. Application of the cross wavelet transform and wavelet coherence to geophysical time series. Nonlinear Process. Geophys. 2004, 11, 561–566. [Google Scholar] [CrossRef] [Green Version]
- Benavente, J.; Gracia, F.; López-Aguayo, F. Empirical model of morphodynamic beachface behaviour for low-energy mesotidal environments. Mar. Geol. 2000, 167, 375–390. [Google Scholar] [CrossRef]
- Falqués, A.; Dodd, N.; Garnier, R.; Ribas, F.; MacHardy, L.C.; Larroudé, P.; Calvete, D.; Sancho, F. Rhythmic surf zone bars and morphodynamic self-organization. Coast. Eng. 2008, 55, 622–641. [Google Scholar] [CrossRef]
- Guillemot, E.; Palma Silgado, M. Diagnóstico de cambios recientes ocurridos en la Bahía de Cádiz (1956–1984). In Evolución de Los Paisajes y Ordenación del Territorio en Andalucía Occidental; Montaner, J., Fourneau, F., Lleo, J., Paredes, J., Acosta, G., Ceballos, R., Eds.; Instituto del Territorio y Urbanismo: Madrid, Spain, 1986; p. 237. [Google Scholar]
- Masselink, G.; Hughes, M.G. An Introduction to Coastal Processes and Geomorphology; Masselink, G., Hughes, M.G., Eds.; Arnold, Hodder Headline Group: London, UK, 2003; ISBN 0340764112. [Google Scholar]
- Carter, R.W.G. Coastal Environments: An Introduction to the Physical, Ecological, and Cultural Systems of Coastlines, 2nd ed.; Academic Press Limited: London, UK, 2013; ISBN 0-12-161855-2. [Google Scholar]
- Coco, G. Test of self-organization in beach cusp formation. J. Geophys. Res. 2003, 108, 3101. [Google Scholar] [CrossRef]
- Ministerio para la Transición Ecológica, Gobierno de España. Available online: https://www.miteco.gob.es/es/costas/temas/proteccion-costa/ecocartografias/ecocartografia-cadiz.aspx (accessed on 1 February 2018).
Figure 1.
Location of the video-monitoring system at La Victoria beach, indicating the bathymetric contours and the area covered by the cameras (A) and an image of the system (B).
Figure 1.
Location of the video-monitoring system at La Victoria beach, indicating the bathymetric contours and the area covered by the cameras (A) and an image of the system (B).

Figure 2.
Examples of images recorded by the video-monitoring station: Snap (A), Timex (B), and Sigma (C), all of them dated 01 January 2018. From left to right, camera 1, camera 2, and camera 3.
Figure 2.
Examples of images recorded by the video-monitoring station: Snap (A), Timex (B), and Sigma (C), all of them dated 01 January 2018. From left to right, camera 1, camera 2, and camera 3.

Figure 3.
Example of plan view showing the presence of bars with a rip channel on La Victori beach.

Figure 4.
Percentage of cusps, bars, and rip currents observed with respect to the total plan views of each month.
Figure 4.
Percentage of cusps, bars, and rip currents observed with respect to the total plan views of each month.

Figure 5.
Location and shape of different cusp systems in La Victoria beach. Note that the Y axis is exaggerated for better representation.
Figure 5.
Location and shape of different cusp systems in La Victoria beach. Note that the Y axis is exaggerated for better representation.

Figure 6.
Wavelet analysis of La Victoria for the cusp systems A to D. (A) 25 September 2013 (B) 14 October 2013 (C) 24 November 2018 (D) 09 January 2016. The systems are arranged chronologically, as in Table 2. On the x axis, distance in meters from the origin (NW end). On the y axis, wavelength in meters. The thick contour designates a 5% significance level, and the white area is the cone of influence, where the edge effects can distort the results.

Figure 7.
Wavelet analysis of La Victoria for the cusp systems E to H. (E) 28 March 2016, (F) 17 March 2017 (G) 28 September 2017 (H) 24 February2018. The systems are arranged chronologically, as in Table 2. On the x axis, distance in meters from the origin (NW end). On the y axis, wavelength in meters. The thick contour designates a 5% significance level, and the white area is the cone of influence, where the edge effects can distort the results.

Figure 8.
Cross-shore movement of shoreline from a common origin. Note the wave signal of longer wavelength.
Figure 8.
Cross-shore movement of shoreline from a common origin. Note the wave signal of longer wavelength.


Table 1.
Average hydrodynamic conditions 5 and 2 days prior to the extraction of the well-developed cusp systems shown in Figure 5. The wavelength column also indicates the standard deviation. Grey lines highlight the seaward formed set of cusps; white lines highlight the landward formed set of cusps.
| Code | Date | Wavelength | Hs (m) | Tp (s) | Dir (°) | Tide (m) |
|---|---|---|---|---|---|---|
| 5–2 Days | 5–2 Days | 5–2 Days | 5–2 Days | |||
| A | 25 September 2013 | 19.2 ± 1.92 | 1.14–0.91 | 7.25–7.6 | 182–222 | 3.10–2.94 |
| B | 14 October 2013 | 23.8 ± 3.27 | 1.06–0.97 | 8.33–8.45 | 224–283 | 2.88–2.68 |
| C | 24 November 2013 | 30.7 ± 1.79 | 1.13–1.96 | 8.06–8.03 | 247–166 | 2.82–2.70 |
| D | 09 January 2016 | 43.4 ± 5.27 | 2.17–2.13 | 10.66–11.09 | 271–267 | 2.84–2.96 |
| E | 28 March 2016 | 40.1 ± 4.63 | 1.21–1.52 | 12.23–13.87 | 284–282 | 2.92–2.83 |
| F | 17 March 2017 | 25.1 ± 1.44 | 2.32–2.54 | 6.92–7.62 | 181–126 | 3.06–2.98 |
| G | 28 September 2017 | 23.2 ± 2.80 | 0.85–0.72 | 10.41–9.89 | 250–279 | 2.84–2.66 |
| H | 24 February 2018 | 40.1 ± 5.66 | 1.15–1.27 | 14.74–14.81 | 284–266 | 2.91–2.79 |
Table 2.
Mean wavelength from the different cusp systems, estimated wavelength with each generation hypothesis, and associated mean relative error ().
Table 2.
Mean wavelength from the different cusp systems, estimated wavelength with each generation hypothesis, and associated mean relative error ().
| Date | on Plan View (m) | sub-Harmonic Hypothesis (m) | Synchronous Hypothesis (m) | Self-Organization (m) | Sunamura Equation (m) |
|---|---|---|---|---|---|
| 25 September 2013 | 19.2 | 3.61 | 1.8 | 16.8 | 27.5 |
| 14 October 2013 | 23.8 | 4.46 | 2.23 | 24 | 31.6 |
| 24 November 2013 | 30.7 | 4 | 2 | 30.4 | 42.7 |
| 09 January 2016 | 43.4 | 7.56 | 3.78 | 56 | 61.5 |
| 28 March 2016 | 40.1 | 11.89 | 5.95 | 48.8 | 65 |
| 17 March 2017 | 25.1 | 3.63 | 1.81 | 26.4 | 46.1 |
| 28 September 2017 | 23.2 | 6.11 | 3.05 | 24 | 31.9 |
| 24 February2018 | 40.1 | 13.7 | 6.85 | 53.6 | 63.4 |
| - | 0.78 | 0.89 | 0.13 | 0.51 |
© 2018 by the authors. Licensee MDPI, Basel, Switzerland. This article is an open access article distributed under the terms and conditions of the Creative Commons Attribution (CC BY) license (http://creativecommons.org/licenses/by/4.0/).
Share and Cite
MDPI and ACS Style
Montes, J.; Simarro, G.; Benavente, J.; Plomaritis, T.A.; Del Río, L. Morphodynamics Assessment by Means of Mesoforms and Video-Monitoring in a Dissipative Beach. Geosciences 2018, 8, 448. https://doi.org/10.3390/geosciences8120448
AMA Style
Montes J, Simarro G, Benavente J, Plomaritis TA, Del Río L. Morphodynamics Assessment by Means of Mesoforms and Video-Monitoring in a Dissipative Beach. Geosciences. 2018; 8(12):448. https://doi.org/10.3390/geosciences8120448
Chicago/Turabian StyleMontes, Juan, Gonzalo Simarro, Javier Benavente, Theocharis A. Plomaritis, and Laura Del Río. 2018. "Morphodynamics Assessment by Means of Mesoforms and Video-Monitoring in a Dissipative Beach" Geosciences 8, no. 12: 448. https://doi.org/10.3390/geosciences8120448
Note that from the first issue of 2016, this journal uses article numbers instead of page numbers. See further details here.