Alongshore Variability in the Response of a Mixed Sand and Gravel Beach to Bimodal Wave Direction


Department of Life and Environmental Sciences, Bournemouth University, Fern Barrow, Poole BH12 5BB, UK
*
Author to whom correspondence should be addressed.
Geosciences 2018, 8(12), 488; https://doi.org/10.3390/geosciences8120488
Submission received: 9 November 2018
/
Revised: 7 December 2018
/
Accepted: 10 December 2018
/
Published: 14 December 2018
(This article belongs to the Special Issue Coastal Geomorphology)
Abstract
:Characterising spatial and temporal variations in coastal behaviour is essential for the management of beach systems. Recent studies have shown that beach response is more complex in coasts subjected to bimodal wave directions. Despite being pervasive at higher latitudes, relatively little is known about the spatial variability in the response of mixed sand and gravel beaches. This work presents evidence that the response of mixed sand and gravel beaches to bimodal wave directions can be highly variable (both in magnitude and direction of change) even within short shoreline stretches. The analyses focused on beach topography data collected between 2009 and 2018 along five cross-shore transects within a 2-km-long shoreline in Suffolk (East England) and offshore wave data recorded at the West Gabbard Smart buoy. The dominant offshore wave direction oscillates between the southwest and the northeast from year to year, and the bimodal beach sediment has modes at 0.35 mm and 16 mm. Analyses were undertaken considering two timeframes: Biannual surveys from January 2009 to February 2018, and more intensive surveying (from seasonal to pre- and post-storm) from July 2016 to March 2018. Results highlighted large differences in beach response even between transects 350 m apart and no clear seasonal pattern of change. Instead, response seemed to depend on a complex interaction between wave power, dominant wave direction, and local settings. Although correlations were identified between indicators of beach change and wave conditions, these varied across transects. Divergence of longshore transport may occur locally, likely influencing the high alongshore variability.
1. Introduction
Understanding how beaches change in space and time and how they respond to driving forces is crucial for coastal planning and risk management [1,2,3]. Alongshore variability in beach morphology and response to storms occurs due to variations in hydrodynamic forcing and local characteristics, including beach type and local geology [4,5]. Although the effects of different drivers of coastal change and local conditions are relatively well-explored in sandy [6,7] and gravel [8,9,10] coasts, considerably less evidence is available for mixed sand and gravel (MSG) beaches. Gravel and sand behave differently with hydrodynamic forcing, adding complexity to the beach response in comparison to pure sand or gravel systems [11]. Therefore, sediment transport and morphodynamic models are dominantly designed and validated for sandy [12,13,14,15,16] and gravel [17,18] coasts and rarely for applications in MSG beaches [19].
Significant changes in sedimentary coasts are often associated with extreme storms [4,20], storm clusters [21,22], storm surges [23], and their interaction with complex nearshore bathymetry [15,24]. Recent studies have investigated the effects of both bimodal seas and bimodal wave directions. Bimodal seas refer to swell and sea waves simultaneously occurring, forming a bimodal wave energy spectrum [25]. Bimodal seas may cause a larger impact on coasts due to a combination of higher wave heights from sea waves and a longer period from swell waves, leading to longer run-up and the potential for overtopping [26]. Bimodal wave directions refer to locations where the dominant wave direction oscillates through time, causing significant changes in the direction of longshore sediment transport and associated shoreline changes [27,28,29].
MSG beaches are common at high latitudes, including along the coastlines of the United Kingdom (UK), Canada, New Zealand, southern South Africa, Argentina, and Chile. Typically, MSG beaches contain sediment sizes ranging from fine sand (0.063 mm, 4φ) to cobbles (256 mm, −8φ) and a bimodal distribution with one mode in sand and the other in gravel. Mostly, the conceptual understanding of morphological behaviour of MSG beaches was gained in the 1970s–1980s through studies of New Zealand beaches [11,30,31,32]. Since the 1990s, the focus of MSG research has seemed to be driven by the need to improve management of both natural and artificially replenished beaches [19,33,34,35,36,37,38,39]. However, still little is known about the spatial and temporal variations in the morphology of MSG beaches and how they respond to driving forces [29,39].
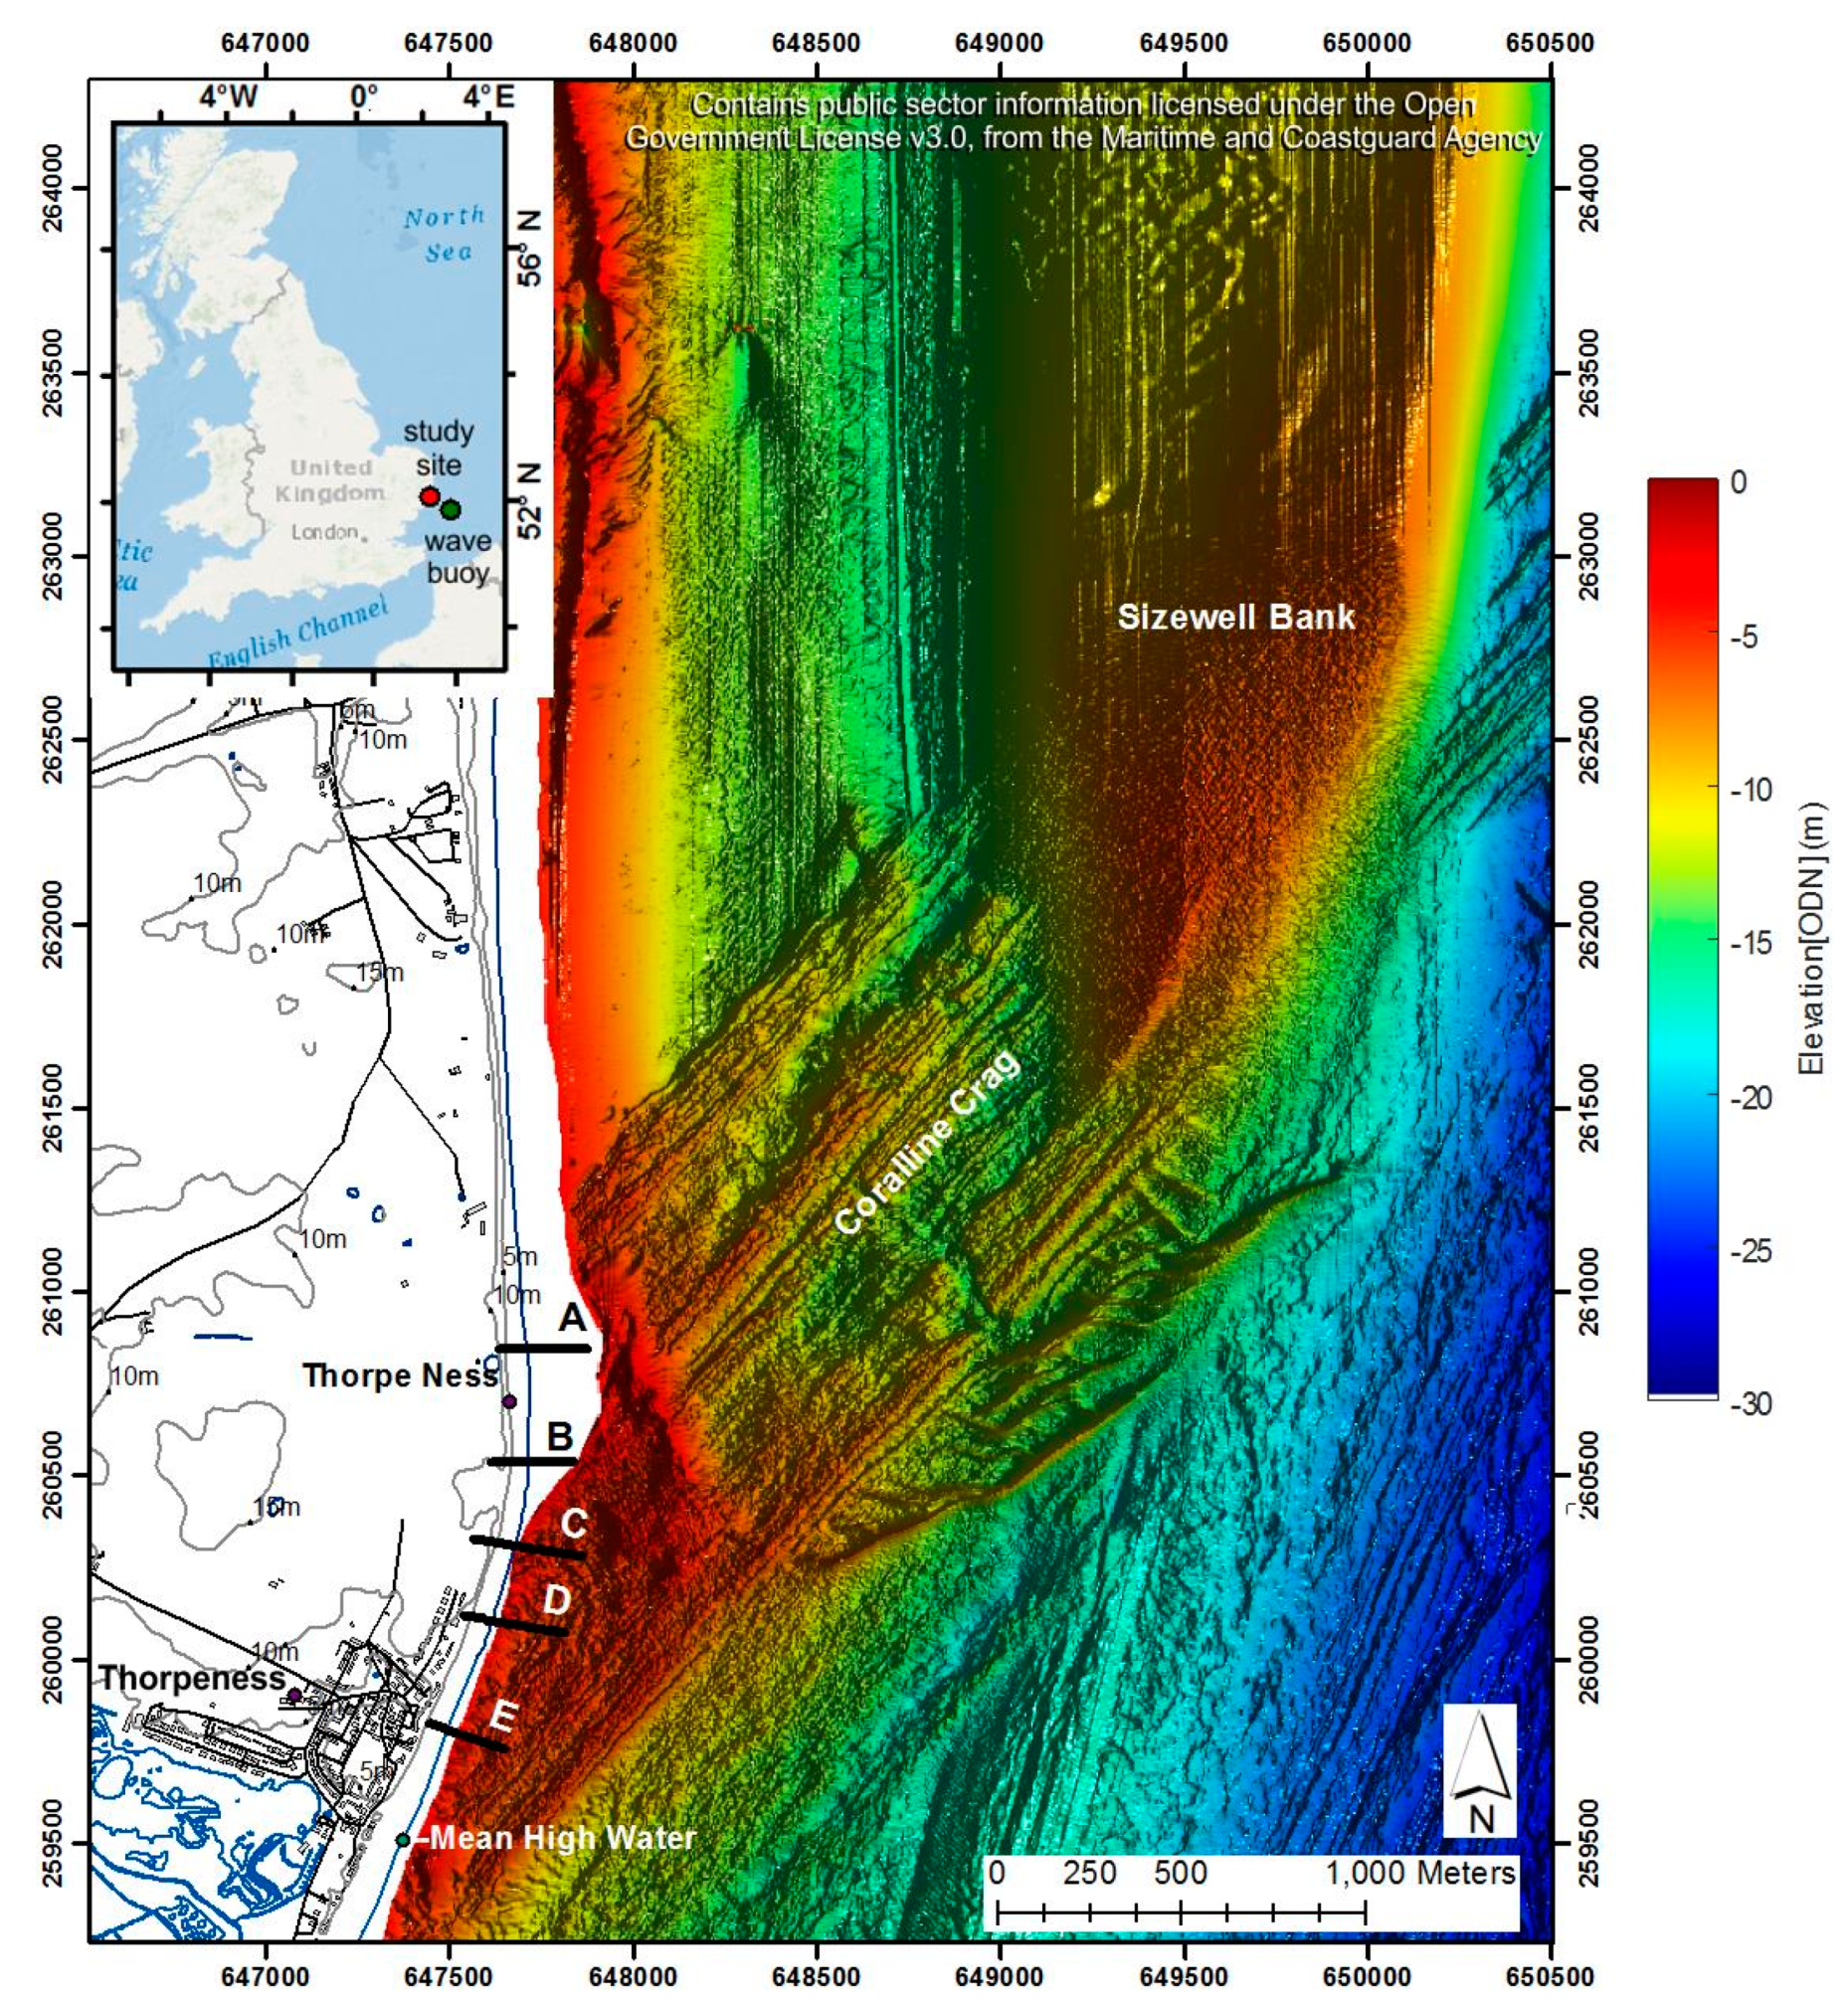
This study advances the knowledge of the spatial variability in MSG beach morphology and the effects of bimodal wave direction on beach mobility in a very complex coastal setting in Suffolk (East Anglia, England). In Suffolk, the interaction of bimodal wave directions with nearshore features (e.g., sand banks) increases the longshore variability of beach response [29], as parts of the coast may be more sheltered from one wave direction and exposed to others. Changes in beach morphology measured between 2009 and 2018 were analysed along five cross-shore transects within a 2-km-long shoreline between Thorpeness and the Sizewell nuclear power station (Figure 1). Particularly, the analyses focused on: (1) identifying alongshore variability in beach mobility based on biannual topography surveys from 2009 and 2018 and at shorter time periods based on 11 surveys between 2016 and 2018, and (2) establishing possible relationships between beach mobility and wave conditions through statistical analyses.
2. Study Area
This study focused on 2 km of the Suffolk coast (East England) extending from the sea frontage of Thorpeness village to the cuspate gravel foreland (hereafter called the ness) south of the Sizewell nuclear power station (Figure 1). The beach morphology is quite variable (as described in Section 4.1), in parts influenced by a rapidly eroding sandy cliff and in other parts by the presence of coastal protection works (see Section 3.2). This location has a complex underlying geology, with the Pliocene Coralline Crag formation (cemented fine sands and silts rich in bryozoan and bivalve shells formed in a shallow shelf environment) forming underwater ridges [40] of around 12 km long and 2 km wide, which extends SW–NE offshore from Thorpeness.
The area is under a semidiurnal mesotidal regime (peak astronomical range ~2.5 m) and susceptible to storm surges exceeding 2 m, which can result in high water levels reaching 3.78 m above Ordnance Datum Newlyn (ODN) [20]. Based on the West Gabbard buoy (51°57′.17 N 002°06′.53 E, 41 m depth) the peak wave direction (DirP) oscillates between SW and NE, varying in duration and energy year to year and within the years, although not necessarily reflecting a strong seasonal signal. The mean significant wave height (Hs) and peak period (Tp) are 1.08 m and 5.4 s, respectively, for both periods of analysis (7-Jan-2009, to 27-Mar-2018, and 2-Feb-2016, to 27-Mar-2018). The maximum significant wave height recorded in these periods reached 5.06 m on 17-Dec-2009, coinciding with a Tp of 8.6 s and a DirP of 28°.
Although the coastline in which the study area is located is considered to be in a period of relative stability [41], historical analysis indicates a longer-term trend of shoreline erosion and beach steepening [29]. Locally, the effects from complex shore and nearshore morphology can result in erosion “hot spots”. Numerical modelling simulating offshore wave climate at West Gabbard buoy from 2009 to 2016 showed a regional net longshore sediment transport dominantly southwards with localised reversals in some locations, including Thorpeness [29]. In the study area, the Sizewell bank (just north of the ness) is likely to influence conditions of waves approaching the coast and is a sink for fine and medium sand transported by tidal currents and waves from the north and the south [42].
In the last 10 years, critical erosion has caused damage to old and new coastal protection structures in Thorpeness. Gabions built in the 1970s to reduce cliff erosion were exposed due to erosion after a storm in the spring of 2010, mobilising the local government and residents to invest in new coastal protection. Geobags were placed in front of the gabions in 2011 and covered by gravel nourishment. The geobags were exposed and damaged by a storm in December 2013, particularly at the north end of the structure. With no maintenance works, exposure and degradation of the geobags continue to the present day.
3. Materials and Methods
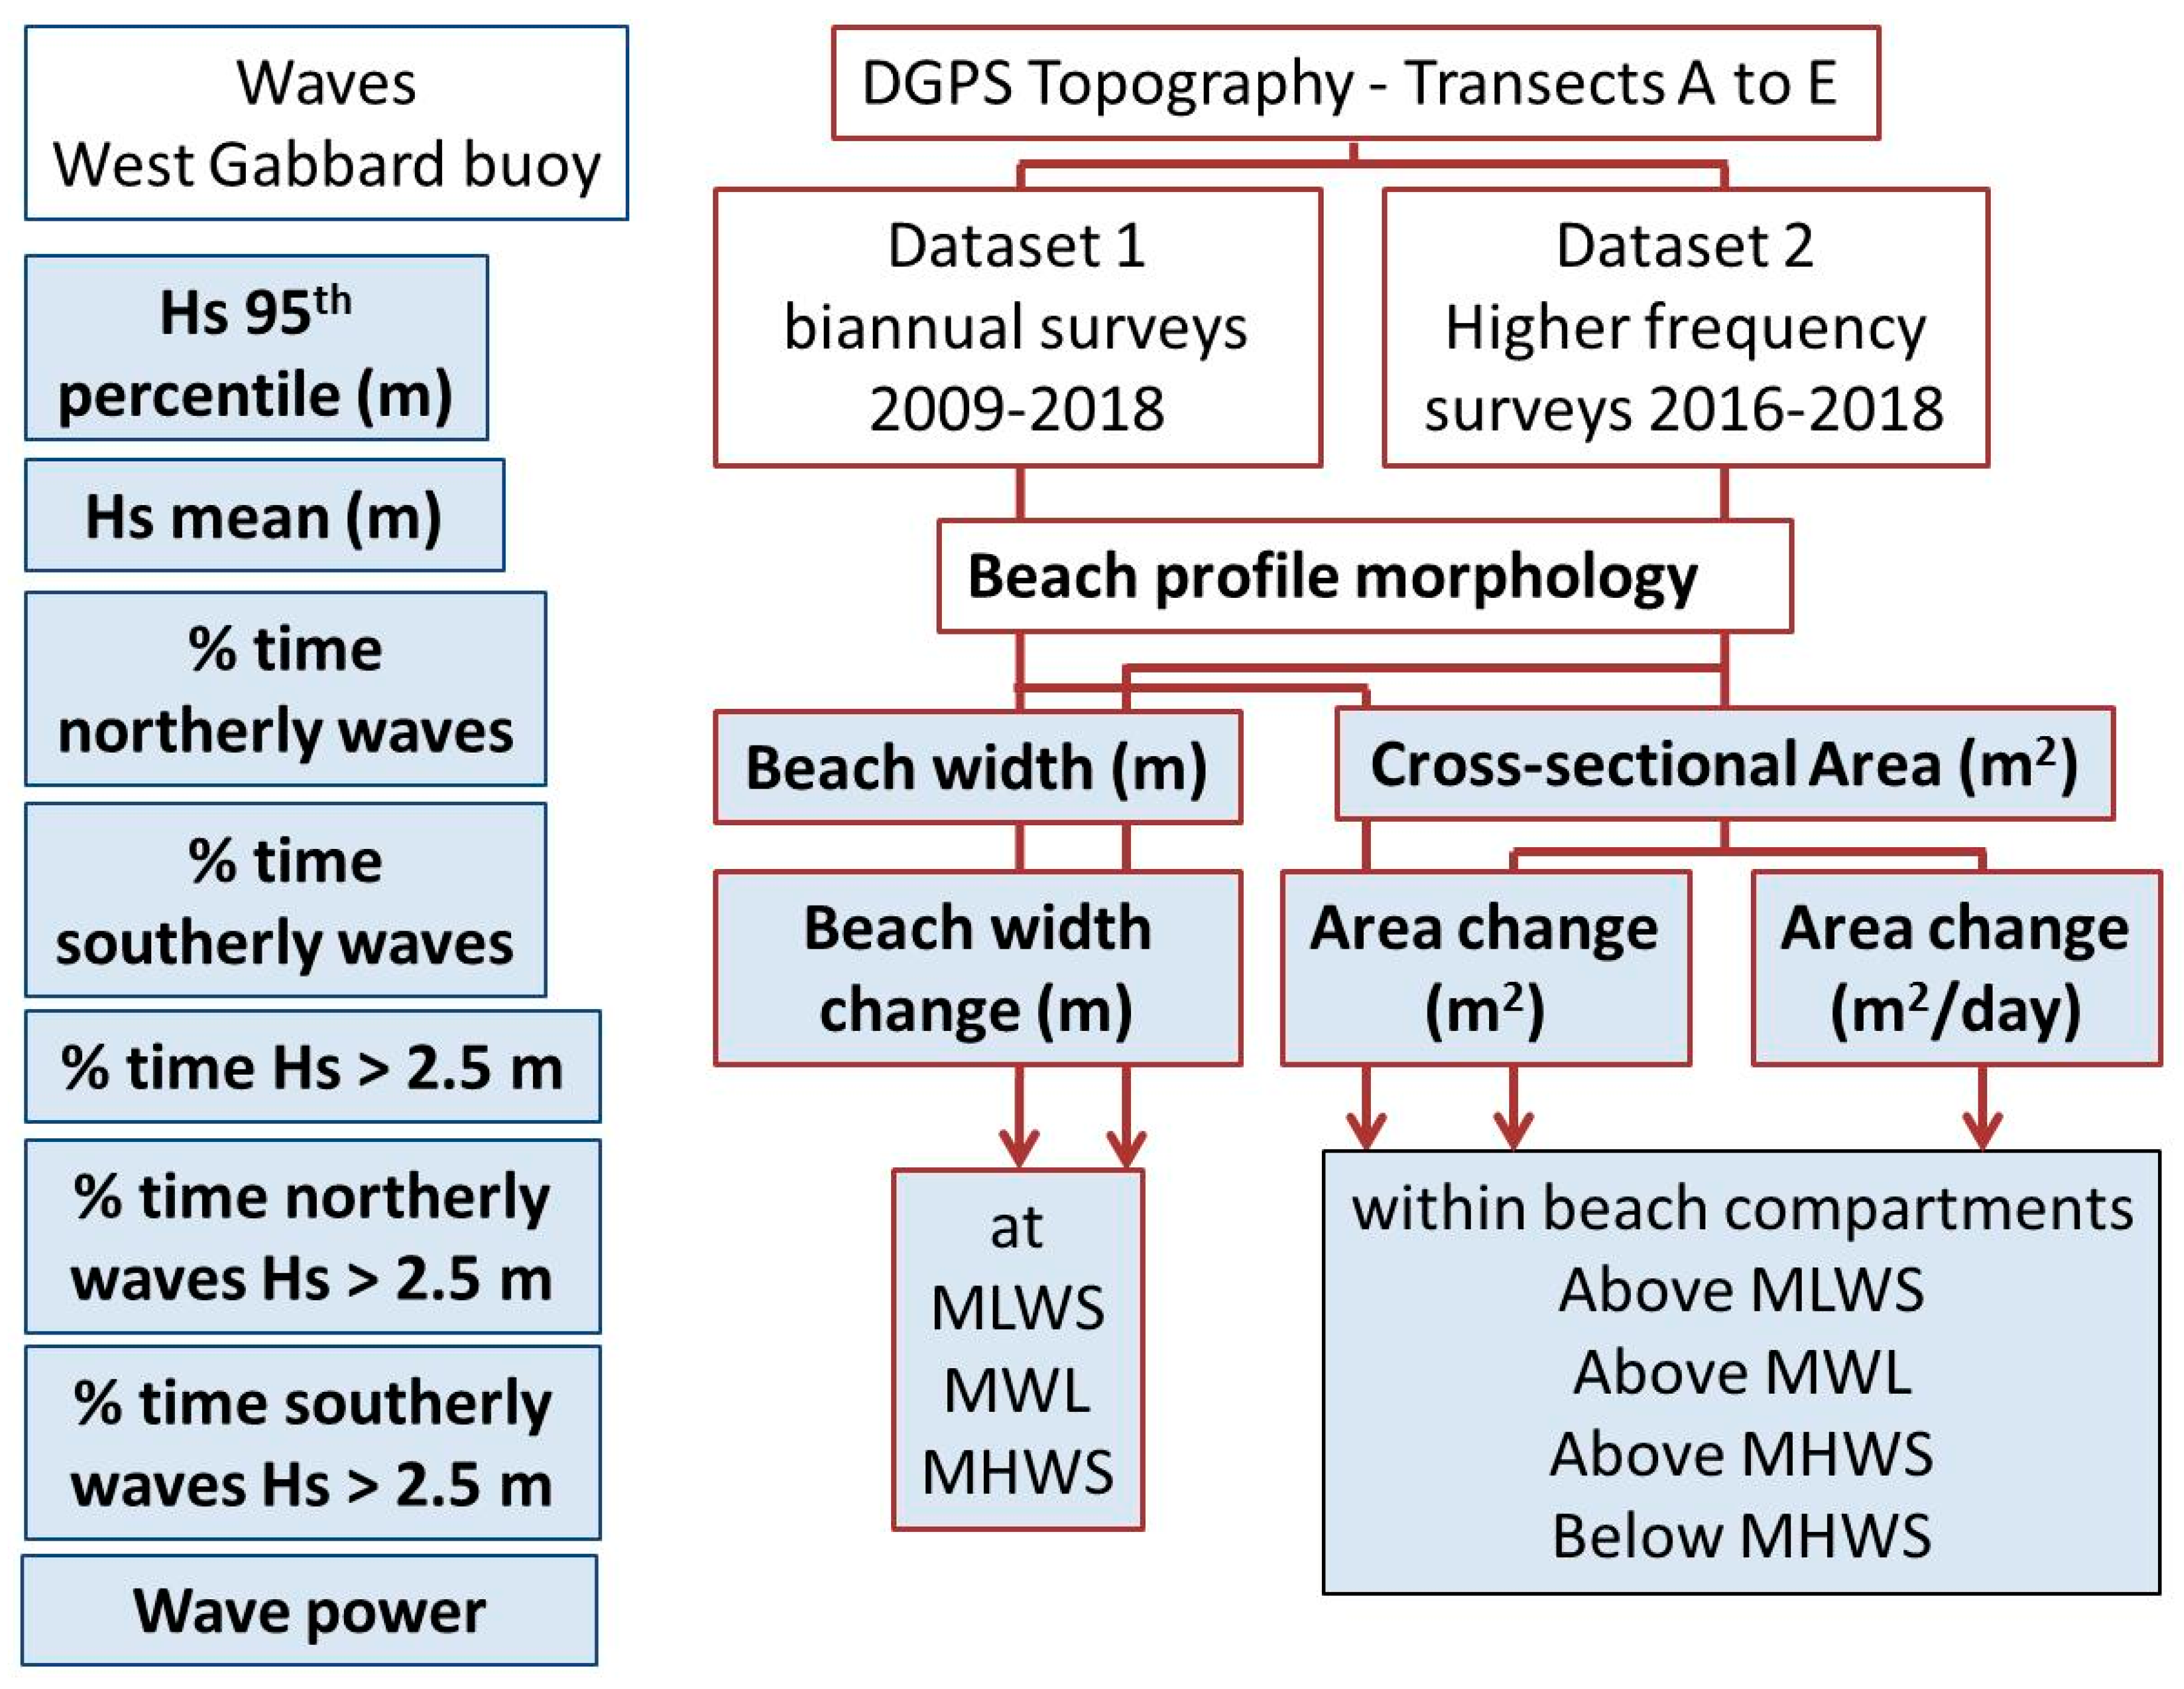
Data analysed in this work included offshore wave conditions and beach topography data obtained along five cross-shore transects (Figure 1) between January 2009 and March 2018. Beach topography data were analysed to understand temporal changes in morphology and variations alongshore. Beach profile area, width, and indicators of beach change were calculated for each transect. Correlation analysis was then undertaken to identify relationships between wave conditions and beach response. A schematic representation of the methods and the resulting variables analysed in this study is presented in Figure 2.
Considering the temporal distribution of the beach topography data, analyses were undertaken on two sets of data: (1) Dataset 1 consisted of 19 biannual monitoring surveys conducted by the Environment Agency (EA) from 2009 to 2018, and (2) dataset 2 consisted of 15 beach surveys conducted at variable intervals between July 2016 and March 2018 (Table 1). Dataset 1 provided a longer-term context, in which interannual variability and the effects of shorter-term changes could be analysed, including beach recharge works and the stormy winter of 2013–2014. Dataset 2 included seasonal, monthly, and pre- and post-storm surveys aiming to better understand beach response, magnitudes of change, and spatial variability that are not captured through regular biannual monitoring.
3.1. Calculation of Wave Parameters
Offshore wave data were obtained from the Cefas West Gabbard (2009–2016, 51°58.88′ N 002°04.73′ E) and West Gabbard 2 (2016–2018, 51°57.17′ N 002°06.53′ E) Datawell Directional Waverider III, ~40 km southeast of the field site. To assess the influence of the two dominant wave directions on beach response, the following parameters were calculated for the time periods between beach surveys in dataset 1 and dataset 2:
- mean deep-water significant wave height measured in meters (Hs);
- 95th percentile of Hs;
- mean wave power (Wp), calculated using Equation (1) [43], where Tp is the peak period measured in seconds,Wp = Hs2·Tp
- percentage of time of northerly waves (DirP: 300–60°);
- percentage of time of southerly waves (DirP: 120–240°);
- percentage of time wave heights exceeded 2.5 m, following a storm threshold suggested by [44];
- percentage of time wave heights exceeding 2.5 m approached from the north (300–60°); and
- percentage of time wave heights exceeding 2.5 m approached from the south (120–240°).
3.2. Beach Topography
The EA has undertaken biannual surveys along a number of transects in the study area since 2009. Five of the transects monitored by the EA were selected to be surveyed in this study, as they reflect the range of beach morphology in the study area (Figure 3):
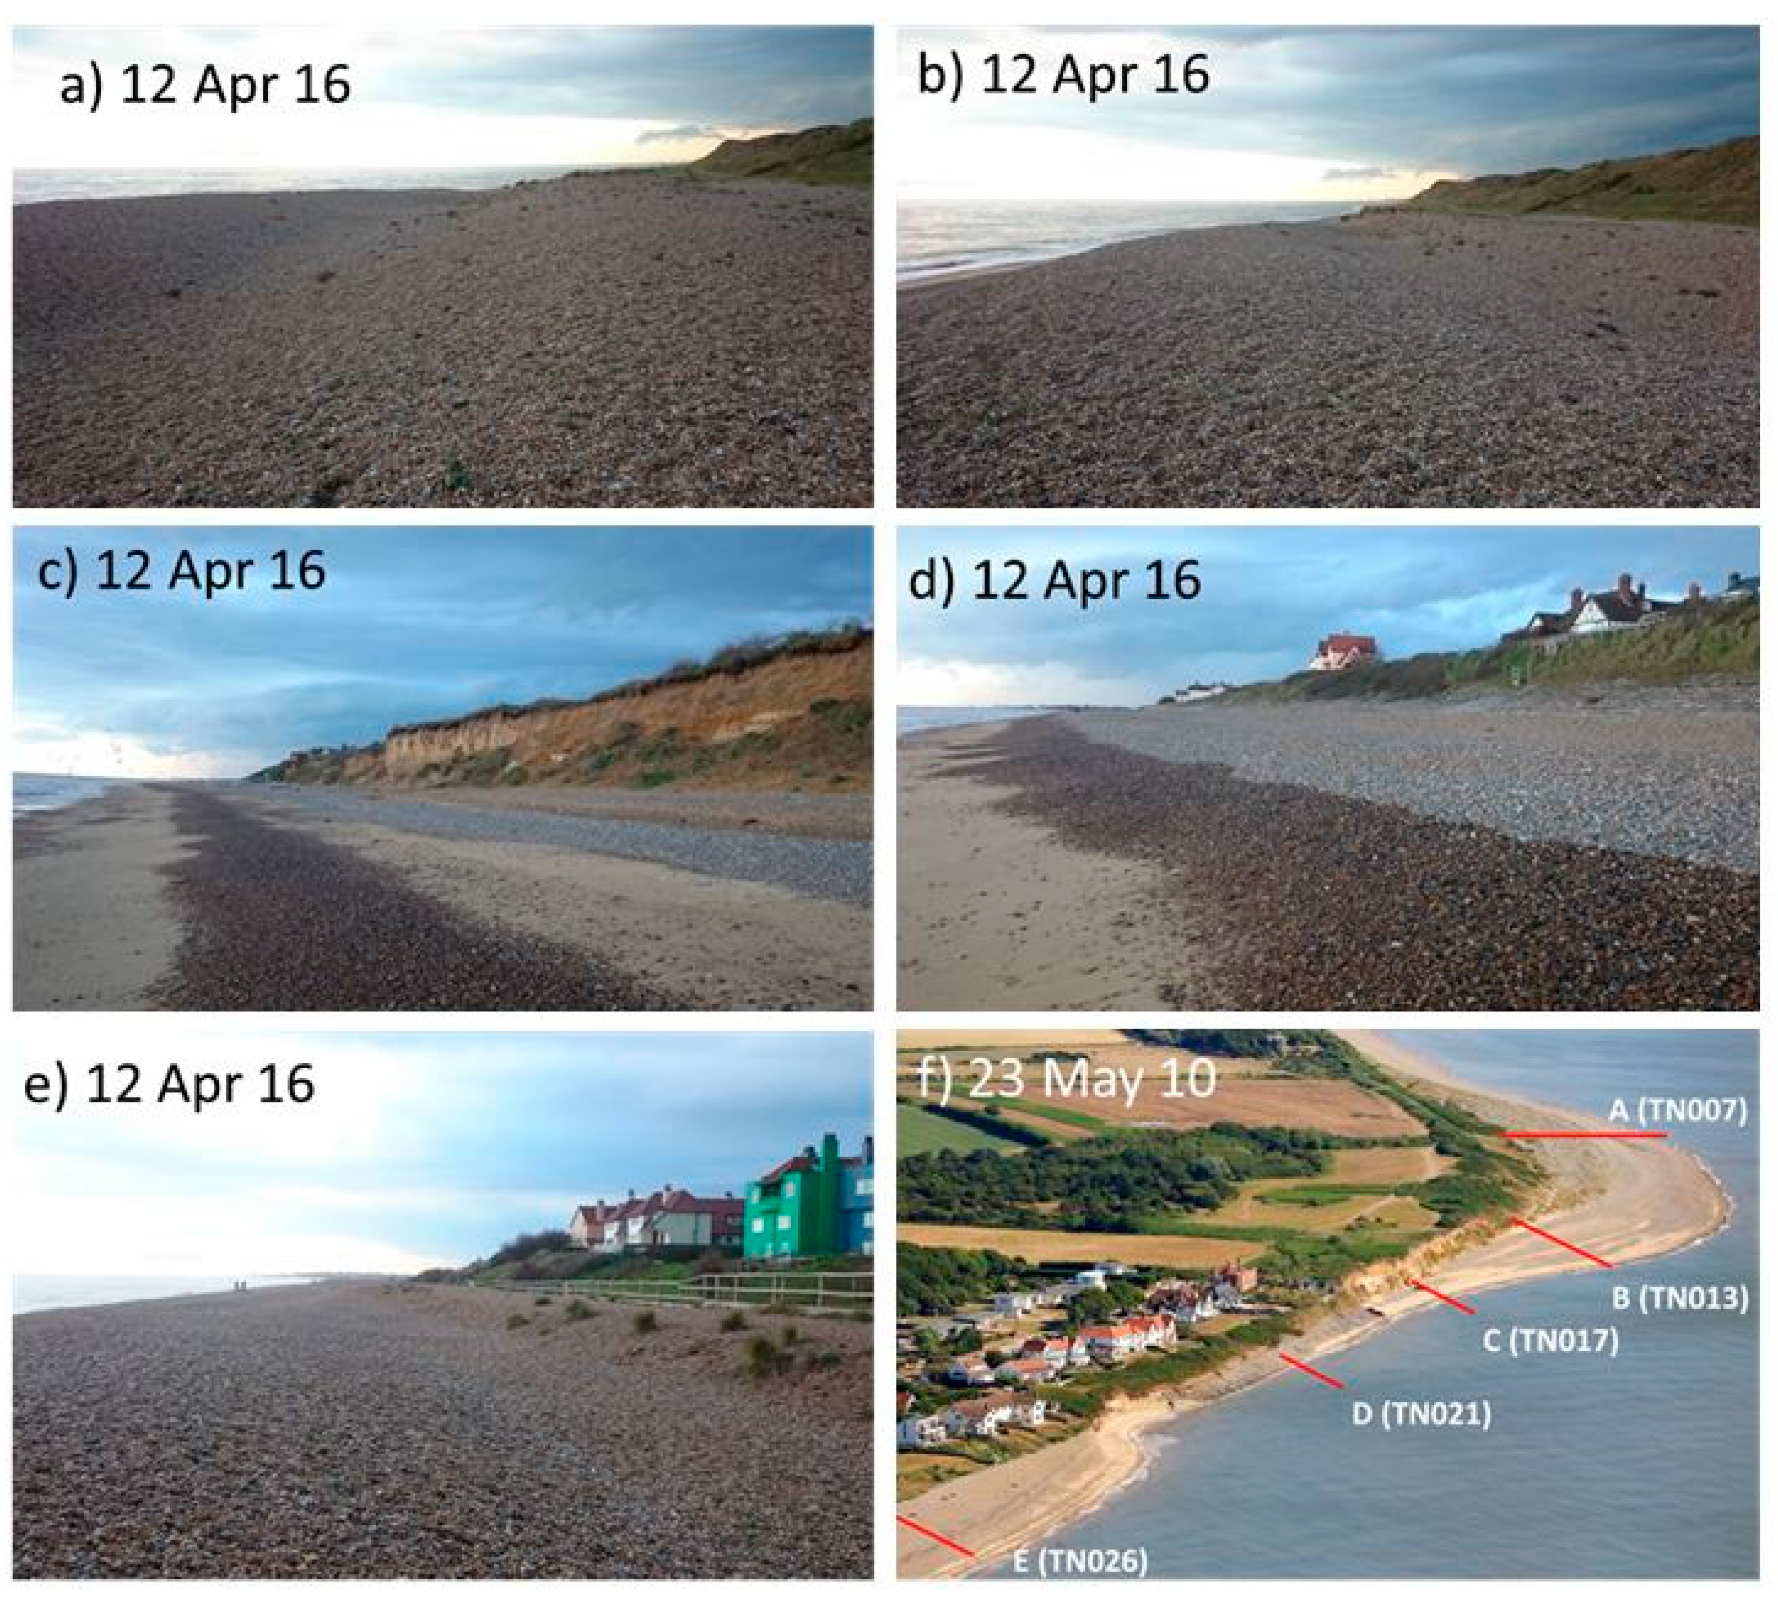
- Transect A (EA profile TN007) is located at the north end of the study area crossing the gravel ridges of the ness (Figure 3a).
- Transect B (EA profile TN013) crosses the south flank of the ness, where a gravel berm is often prominent and backed by a vegetated and eroding cliff talus (Figure 3b).
- Transect C (EA profile TN017) is characterised by the presence of a rapidly retreating soft cliff (Figure 3c), a gravel upper beach, and a sandy lower beach (although temporal variations occur).
- Transect D (EA profile TN021) crosses a local erosion “hot spot”, where the beach profile is influenced by gabions, geobags, and gravel nourishment. The gabions were placed in the 1970s and the geobags in 2011, after a storm exposed and damaged the gabions in the spring of 2010 (Figure 3f). These structures are periodically exposed during storms, with gravel nourishment occasionally used to restore the beach profile and cover the structures.
- Transect E (EA profile TN026) is located south of the coastal protection structures, approximately at the centre of the village’s seafront housing.
Topography along the five selected cross-shore transects were measured using a Real-Time Kinematic Differential Geographical Positioning System (DGPS, Leica Viva GS15 Rover, and GS10 GNSS receiver), enabling a vertical and horizontal accuracy of 0.8 cm and 1.5 cm, respectively. To enable a larger coverage of the beach profile, field surveys were conducted at low tide and during spring tides (daylight hours permitting).
For each transect and survey date, the beach width at mean low water springs (MLWS), mean water level (MWL), and mean high water springs (MHWS) were estimated. These tidal levels were defined relative to ODN: MHWS = 1.22 m, MSL = 0.16 m, and MLWS = −1.01 m [45]. Similarly, for each transect and survey date, the profile area above and between MLWS, MWL, and MHWS was estimated using the trapezoidal approximation (0.25 m cross-shore interpolations). For consistency, beach widths and profile areas were calculated using a fixed landward boundary that encapsulated the area of change observed in each transect across the period of analysis (see Figure 4). Additionally, where required (i.e., when surveys were undertaken at higher tidal levels), profiles were linearly extended to intersect the MLWS. The changes in beach width and profile area between consecutive surveys in each dataset, and the respective changes per day, were also calculated.
3.3. Statistical Analysis
Correlation analyses were used to assist the identification of patterns of beach response between transects and their relationship with wave conditions. Pearson’s correlation coefficient (r) was calculated only when the assumptions for parametric tests were met by the data. Otherwise, Spearman’s rank correlation coefficient (rs) was used. Analyses were undertaken in IBM SPSS Statistics 24® and Matlab®.
4. Results
4.1. Alongshore Variations in Beach Mobility
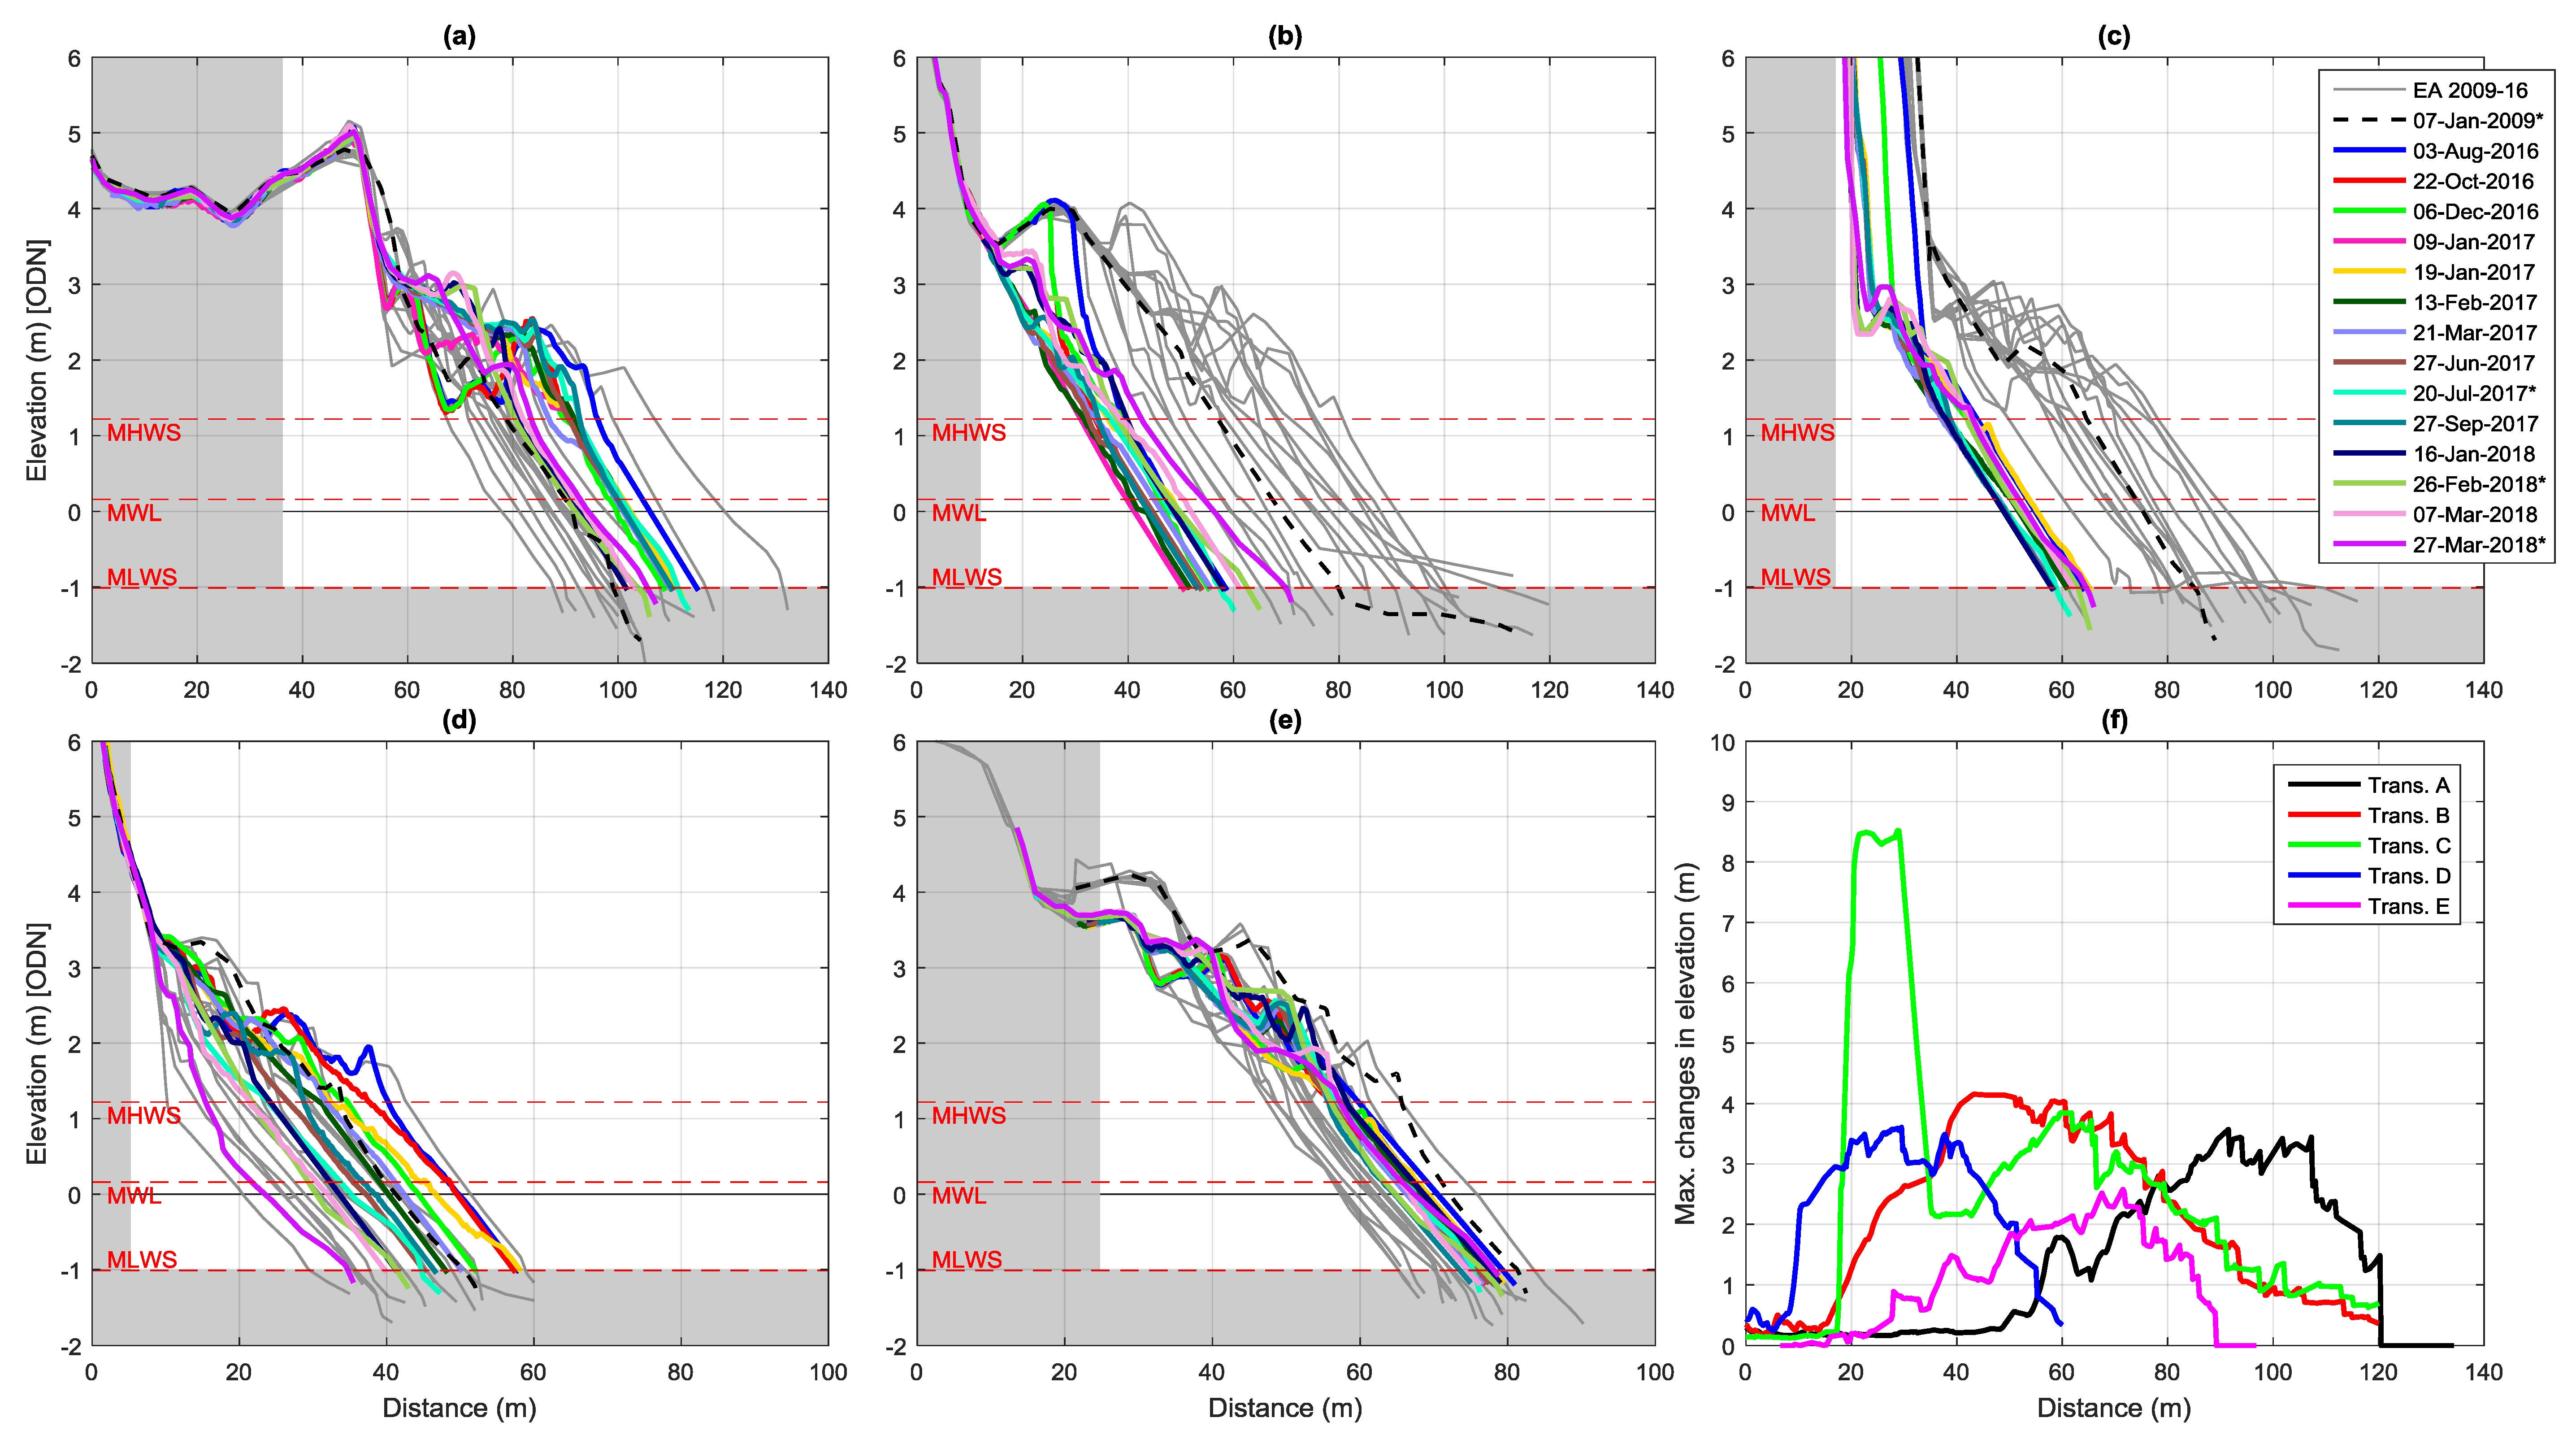
The analysis of all cross-shore profiles measured between January 2009 and February 2018 (Figure 4) indicated a very dynamic system with large variations in the magnitudes and direction of changes within the 2-km-long shoreline covered by the five transects. The beach width at the MWL varied as little as 18.0 m in Transect E and 48.8 m in Transect B. In both locations the mean beach width is about 68 m (Table 2). The largest change in elevation (~8.5 m) was observed in Transect C (Figure 4f) as a result of a 12-m cliff retreat in the 2016–2017 winter. Maximum changes in beach elevation (around 4 m) occurred in the upper beach in Transect B, toward the central part of the profile in Transects C and D and in the lower beach in Transects A and E. As with beach width, Transect E showed the smallest changes in beach elevation (a maximum of 2.5 m). Profiles measured in 2016–2018 (dataset 2) tended to be positioned seaward of earlier measurements in Transects A and E and landward in Transects B and C (Figure 4), suggesting relative accretion and erosion, respectively. However, these trends were not continuous through time and seemed to have reversed in the period 2016–2018 (Figure 5). In Transect D there was a greater overlap in the position of profiles through time.
Summarising beach change through descriptive statistics of key indicators (Table 2) provided a general overview of differences and similarities across transects. For example, it is evident that the largest erosion (i.e., reduction in area) in all transects occurred between July (summer) and January or February (winter), but the largest beach retreat (i.e., landward movement of the shoreline position) showed variation of this pattern in Transects A and C. The largest accretion (i.e., increase in area) and beach growth (i.e., increase in beach width) occurred between the winter and the summer, except in Transect A. The maximum and minimum values of both beach width and area did not always result from the largest growth and accretion and retreat and erosion, respectively, suggesting that gradual changes can have significant effects. The range (i.e., the difference between the maximum and the minimum values) of both beach width and area suggests that Transect D showed the highest relative mobility (i.e., the range was relatively high in relation to the mean value). However, descriptive statistics provided little insight into the temporal and spatial variability in beach mobility.
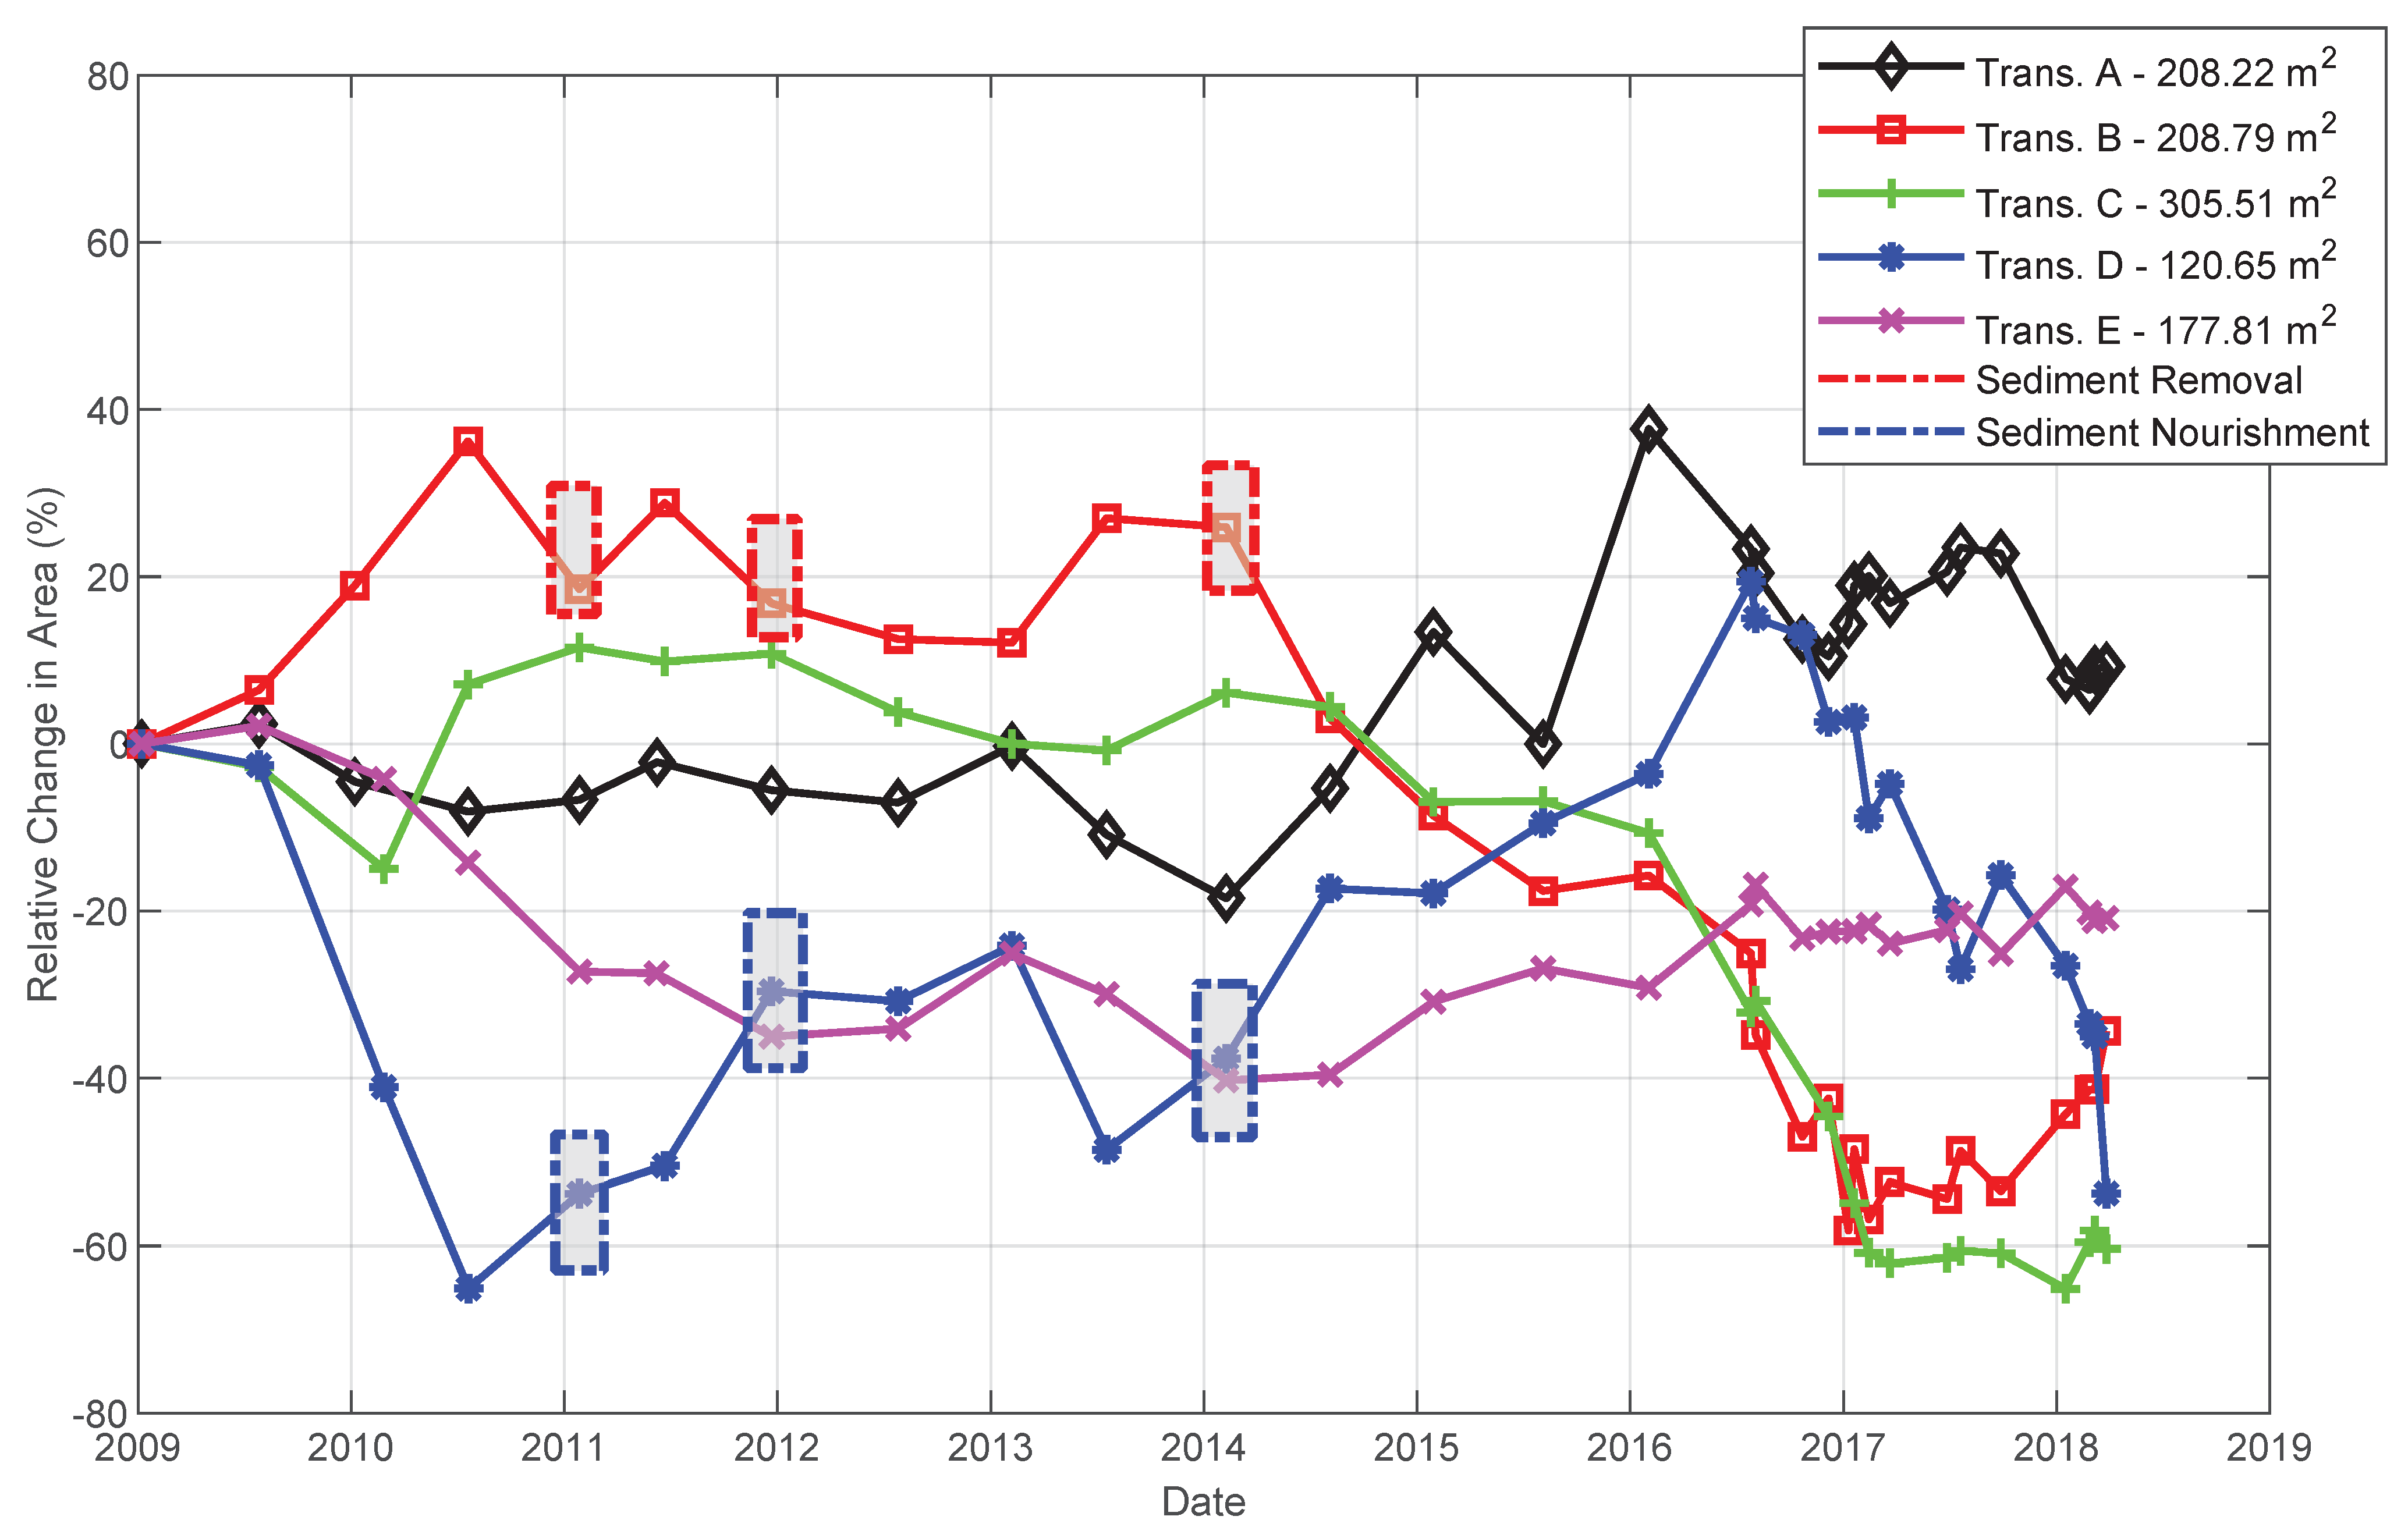
There were large differences in beach width and area between the transects, where Transect A was the widest, Transect D was the narrowest, and Transect C had the largest cross-sectional area (Table 2) due to the presence of the cliff. Therefore, assessing temporal changes in relation to the initial profile area facilitated visualisation of alongshore variations (Figure 5). An end-point type of assessment would indicate overall erosion, more pronounced in Transects C (−184.4 m2, a 60.4% reduction in area) and D (−64.8 m2, a 53.7% reduction in area), with accretion observed only in Transect A (19.3 m2, a 9.3% increase in area). However, patterns of change varied in the period, with periods of relative erosion, stability, and accretion that did not necessarily coincide for the five transects (Figure 5). The spatial variability was evidenced by the lack of correlation in patterns of beach change between transects. In dataset 1, significant correlations were found only between transects B and D, which showed a significant moderate negative correlation for changes in area above MLWS (rs = −0.581, p = 0.011, N = 18), above MWL (rs = −0.511, p = 0.030, N = 18), and below MHWS (rs = −0.606, p = 0.008, N = 18). In dataset 2, a negative significant correlation was found for Transects D and E for changes in area above MLWS (r = −0.560, p = 0.046, N = 13), and a strong positive significant correlation was found for Transects A and B for changes in area below MHWS (rs = 0.600, p = 0.023, N = 14).
Broadly, patterns of change seem to shift every 2–3 years as a response to major storms. The storms that exposed the 1970s gabions (along Transect D) in October 2010 seemed to have slowed or reversed the accretion and erosion trends observed until then along Transects B (accretion), C, D (erosion), and E (Figure 5). Afterwards, despite temporal and spatial variations, Transects B and C were roughly in a state of relative stability or accretion, and Transects D and E were in a state of erosion up to mid-2013. The extended stormy period from October 2013 to February 2014 (which exposed the geobags installed in 2011) seemed to have triggered another shift in the patterns of change. Transects A, D, and E responded with accretion and Transects B and C with erosion (Figure 5). The ness (Transect A) was not greatly affected by these storms, remaining relatively stable after the storms in 2010, with considerable accretion (116.9 m2) observed between February 2014 and February 2016, after minor erosion during the 2013–2014 winter. At different times in 2016, trends changed once again, with erosion starting in Transects A and D and accretion or stability in Transects B, C, and E. In 2016, the loss of area in Transect C was due to cliff retreat, while the beach remained relatively stable.
Interestingly, in 2010 the 1970s gabions were exposed when Transect D was the most eroded (42 m2 cross-sectional area, 65% less than the initial area). Since then and up to mid-2016, an overall accretion trend was observed in that area (Figure 5), with exposure of the geobags in 2013 occurring when the area was considerably more accreted (75 m2 cross-sectional area) than in 2010. The geobags were more exposed to waves as they were placed seaward of the gabions, resulting in a narrower beach and, therefore, less natural dissipation of wave energy. Additionally, in 2013 there were prolonged periods of waves higher than 2.5 m, and they were dominantly from a southerly direction, while in 2010 higher waves were lower, less frequent, and dominantly from the northeast. Small-scale nourishment works occurred in the area of Transect D after storms in 2010, 2011, and 2013 with materials (around 1000–1500 m3) sourced from the area of Transect B. Although these works might have helped in protecting the already damaged protection structures, they caused only a small and temporary effect, not affecting the overall trend either in Transect B or D. However, the area of Transect B has experienced considerable erosion since 2014, despite some recovery since 2017 (Figure 5), which may preclude further extraction of material to nourish areas further south. It is also concerning that the last survey (March 2018) at Transect D showed a state of erosion almost as critical as the one observed after the 2010 storm (Figure 5). Therefore, identifying suitable and sustainable sources for beach nourishment requires better understanding of the longer-term trends and variability of beach responses.
4.2. Temporal Changes in Beach Morphology
The temporal evolution of the beach morphology along each of the five transects can be easily visualised in the animations provided in the Supplementary Materials (Figures S1–S5). The analysis of profile evolution is particularly useful in understanding cross-shore variations in beach change. In the study area, most often and in all transects, the profile showed a parallel displacement seawards or landwards (i.e., no major changes to the overall shape). However, sometimes changes differed below and above the MHWS, affecting the profile morphology, mainly as a result of movement of gravel, particularly gravel ridges. Gravel ridges were observed in all transects (except C), but there were alongshore differences in their size, response and movement time-frame, and the effects on profile morphology. Although the analysis of profile changes based on biannual data (dataset 1) was useful to visualise general patterns of change, the more frequent surveys in dataset 2 helped in understanding the movement of gravel ridges and their effect on beach morphology.
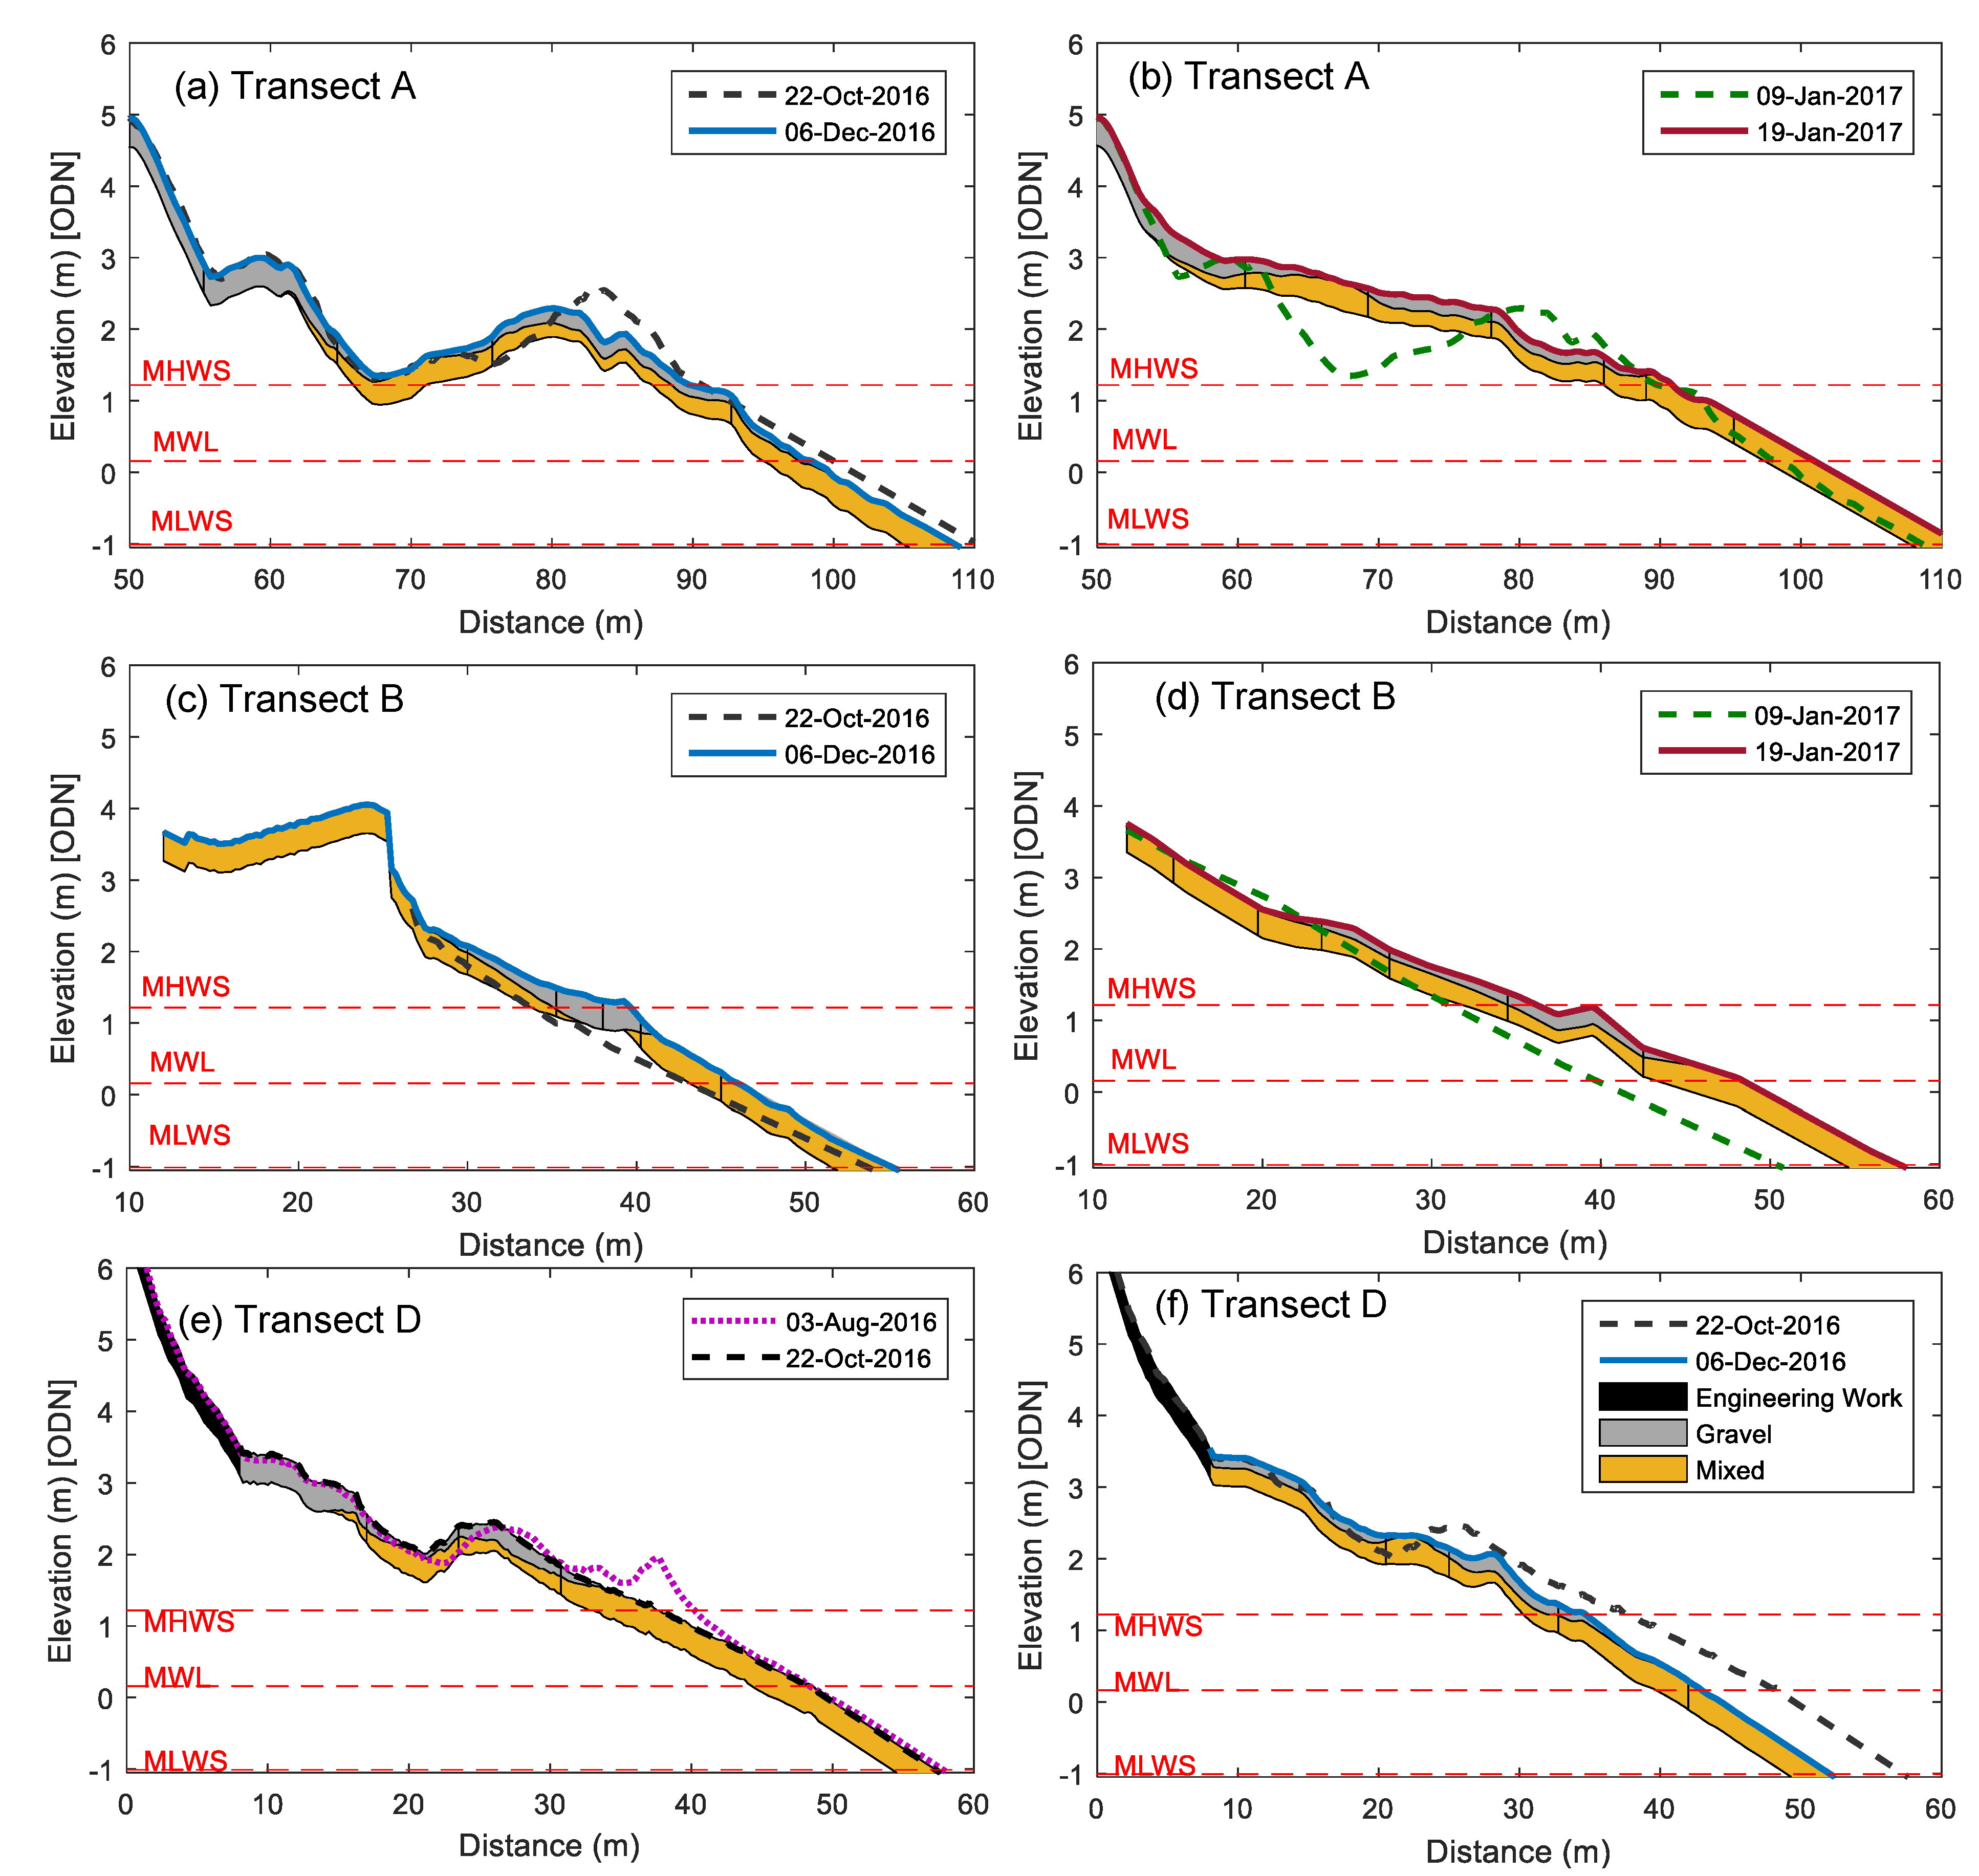
The ness (Transect A) is characterised by the presence of (sometimes multiple) gravel ridges above MHWS (Figure 3a and Figure 6a), which can have steep flanks and be over 1 m high (higher if further up the beach). Here beach retreat occurs as the gravel ridge closest to the waterline migrates up the beach, as observed between late July 2016 and January 2017 and also in the following year (Supplementary Material Figure S1). Although the beach slope below MHWS remained unchanged, the ridge became narrower and steeper above MHWS, where the retreat was largest. The retreat below MHWS halted when the ridge above MHWS spread out landwards, becoming flatter and wider as it welded to the next gravel ridge (Figure 6b). This migration continued until all ridges coalesced, resulting in a higher and flatter beach above MHWS, as seen in 19-Jan-2017 (Figure 6b). Below MHWS, the beach became a less steep and featureless sandy surface. The existing data suggested the presence of a single gravel ridge from late winter to the spring, with others forming during the summer (as evident from June–September 2017).
The gravel movement observed in Transect B, although similar to Transect A, seemed to occur in shorter time frames. A well-developed gravel berm present at MHWS in early December 2016 (Figure 6c) had completely disappeared by 9-Jan-2017 (Figure 6d), when the profile was greatly eroded (an area loss of 33 m2). After erosion, the gravel that was dominantly above MHWS was observed to be more evenly distributed across the profile. Just 10 days later, a gravel ridge had formed just below MHWS (Figure 6d), with the profile recovering 20 m2. By 13-Feb-2017, almost all this gain had been lost when the gravel ridge migrated well above the MHWS (around 2.5 m ODN), resulting in a flattened and retreated sandy profile below MHWS. Only minor changes were observed between late winter and early summer (Supplementary Material Figure S2). Over the summer 2017, the featureless profile remained, with gravel ridges apparent in September. A similar pattern of erosion and accretion associated with gravel ridge migration was observed between January and March 2018.
In Transect C, the cliff face retreated 6 m between 3-Aug and 6-Dec-2016, and a further 5 m by 19-Jan-2017 (Supplementary Material S3), with tragic consequences. Just a few meters from this transect, the cliff failure resulted in the death of a man who was walking his dog along the beach close to the cliff face (probably due to high tide) on 14-Jan-2017. The beach had been more or less stable since July 2016, with no significant change in area below MHWS. Gravel tends to remain on the upper beach.
Multiple gravel ridges occurred above MHWS in Transect D (Figure 3d and Figure 6e), and they influenced changes in morphology, similar to those observed in Transect A. Here, the gravel ridge closest to the waterline seemed to control changes further up the beach. Multiple gravel ridges seemed to develop during the summer, with the topography becoming flatter across the winter (Supplementary Material S4). During summer (26-Jul to 3-Aug-2016), the gravel ridge closest to the waterline migrated up the beach (Figure 6e), becoming wider and less defined until it coalesced with other ridges in late autumn and early winter. Without the gravel ridge, the profile below MHWS eroded, while changes above MHWS were negligible (Figure 6f). The upper beach is fixed by the presence of gabions. The pattern of ridge formation in the summer and migration and fading in the autumn and early winter seemed to occur in 2017.
In the period 2016–2018, Transect E was relatively stable despite showing a gravel ridge migration similar to Transect B. Here the ridges remained well-formed, showing little change during the summer and persisting during the winter (Supplementary Material Figure S5), albeit much less developed. It is worth noting that the beach below MHWS retreated in early autumn and showed little change or slight accretion during the winter.
4.3. The Influence of Bimodal Wave Direction
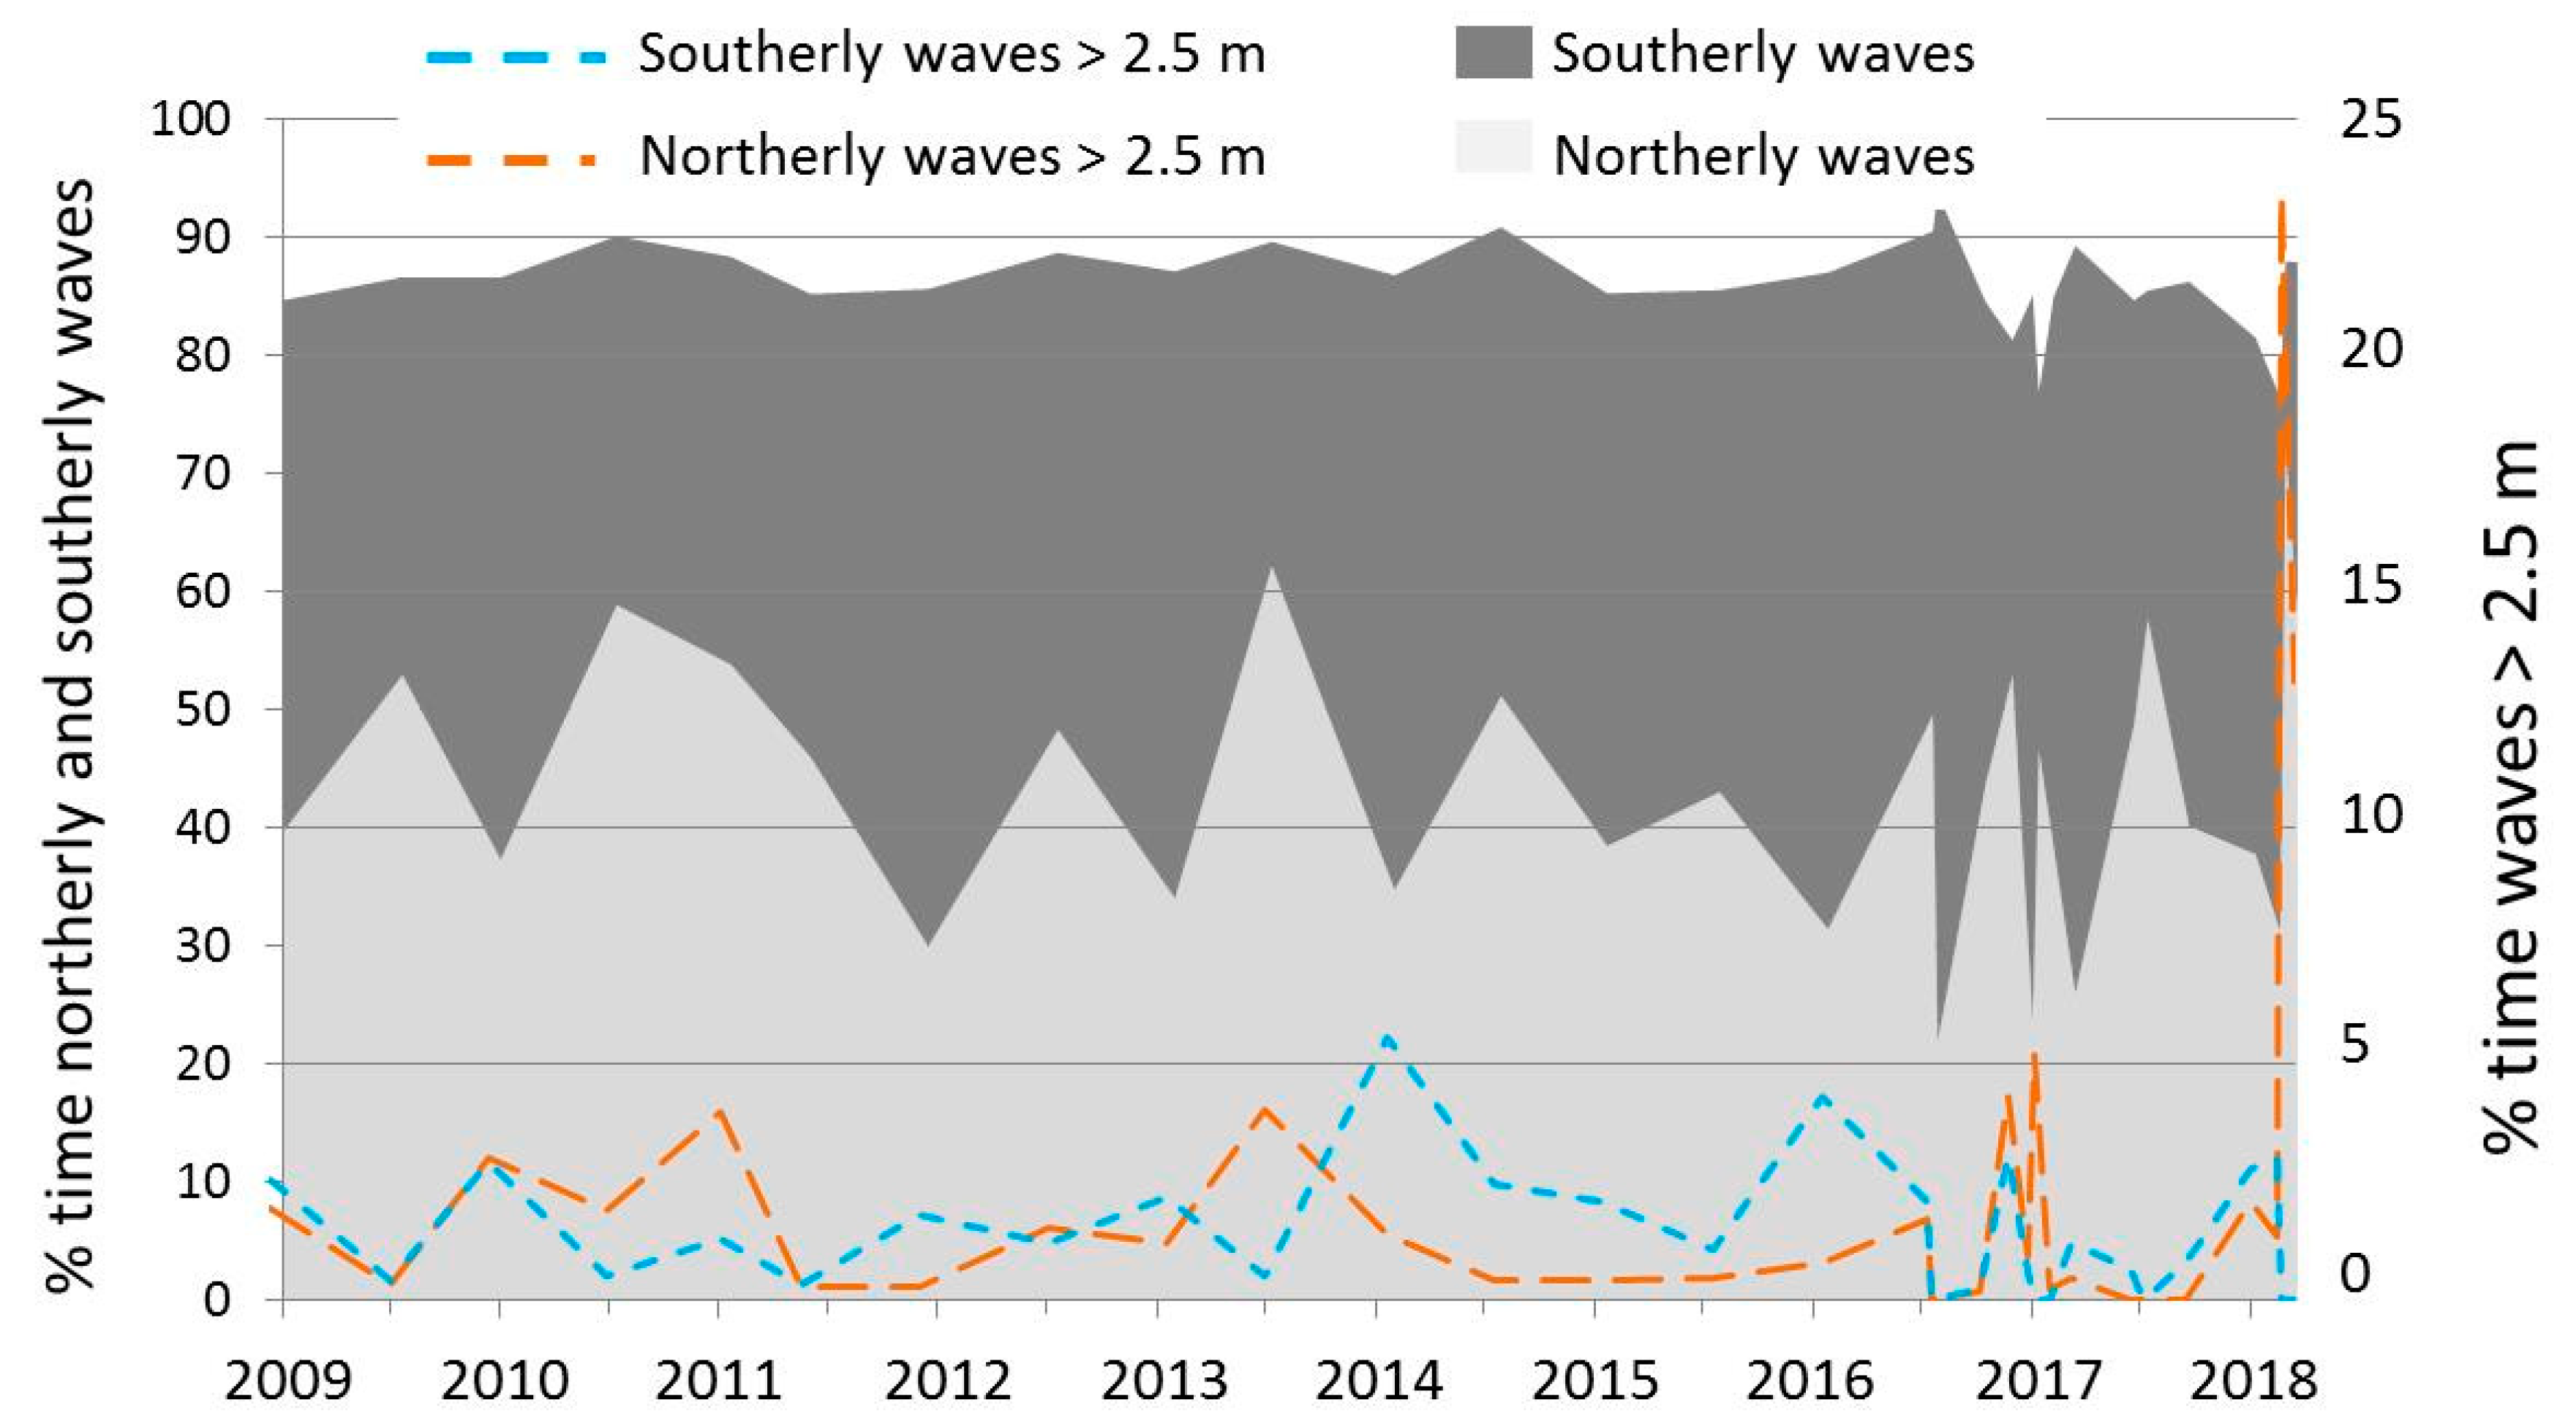
About 80%–90% of the time, offshore waves approached from a northerly or southerly direction, generally with the former dominating from January to July and the latter dominating from July to January (Figure 7), with exceptions. At times, northerly and southerly waves could dominate for extended periods (~18 months), as observed between January 2010 and June 2011 and from August 2014 to February 2016, respectively (see Supplementary Materials S6). Deviations from this pattern occurred when shorter periods of time were considered (dataset 2, 2016–2018) (e.g., northerly waves dominated from early August to early December 2016 and southerly waves from 19-Jan to 21-Mar-2017). Additionally, waves higher than 2.5 m could be dominantly from a southerly direction in periods when waves were predominantly from a northerly direction, and vice versa. Waves exceeding 2.5 m in height could have a dominant southerly or northerly direction for long periods (~3 years), such as from the winter of 2013–2014 to the summer of 2016, when they were southerly dominant (Figure 7). Considering the biannual surveys (dataset 1), waves higher than 2.5 m from all directions could occur as little as 0.58% of the time (January–June 2011) or as much as 7.12% of the time (July 2013–February 2014). These high waves were usually concentrated in shorter periods of high energy lasting about a month. For example, from 26-Feb to 27-Mar-2018, waves higher than 2.5 m occurred 28.2% of the time in the first 9 days and 14% of the time in the last 20 days, dominantly from a northerly direction.
Considering the relationship usually found between shoreline changes and offshore wave power (e.g., Reference [45]), a number of indicators (Figure 2) were used to test correlations to elucidate the influence of wave energy and bimodal wave direction on the direction and magnitude of shoreline changes. Indicators of shoreline change drawn from dataset 1 (biannual surveys) showed significant correlations only for Transect A and when considering the percentage of time northerly waves exceeded heights of 2.5 m. For Transect A, significant moderate negative correlations were found between the percentage of time northerly waves exceeded heights of 2.5 m and changes in beach width (m/day) at MLWS (rs = −0.508, p = 0.031, N = 18) and changes in profile area (m/day) within all beach compartments (rs = −0.494 to −0.512, p = 0.030 to 0.037, N = 18), except above MHWS (rs = −0.398, p = 0.102, N = 18). These results suggested that erosion rates in Transect A were likely to increase with an increase in the occurrence of high northerly waves. However, a more detailed analysis of the data suggested that the relationship was less evident for the times beach accretion was observed. Accretion rates in Transect A also seemed to increase with an increase in the occurrence of high northerly waves when these occurred less than 1% of the time.
In contrast, a number of significant correlations were identified for indicators drawn from dataset 2, with variations between the five transects. Considering first the indicators of wave energy irrespective of wave direction, correlations indicated that an increase in wave energy would result in a reduction in beach width and area in all Transects, except Transect B, which showed an inverse relationship. Only the 95th percentile of Hs showed significant correlations with indicators of beach change for all transects, particularly with beach width at MLWS in Transect A (r = −0.650, p = 0.009, N = 15), Transect B (r = 0.537, p = 0.039, N = 15), and Transect D (r = −0.534, p = 0.049, N = 14); area above MHWS in Transect C (rs = −0.615, p = 0.015, N = 15); and changes in area above MWL (m2/day) in Transect E (r = −0.694, p = 0.009, N = 13). Note that for Transects C, D, and E, these were the only indicators of beach change showing significant correlations with indicators of wave energy. The strongest correlation was found between Hs and beach width at MHWS in Transect A (r = −0.752, p = 0.001, N = 15).
Correlations involving indicators reflecting wave direction suggested that the percentage of time southerly waves occurred may have had a greater influence on beach changes than other indicators. This was the only indicator showing significant correlations with all transects, except Transect C. More southerly waves tended to enhance erosion along Transects A and B and beach growth in Transects D and E. The strongest correlations were found for changes in beach width (m/day) at MHWS for both Transects A (r = −0.622, p = 0.018, N = 14) and B (r = −0.717, p = 0.004, N = 14), and at MLWS for Transect E (r = 0.585, p = 0.036, N = 13). For Transect D, moderate positive significant correlation was found between the percentage of time southerly waves occurred and beach width at MLWS (r = 0.534, p = 0.049, N = 14). These were the only significant correlations found for Transects D and E.
Interestingly, significant correlations involving the percentage of time northerly waves occurred were found only for Transect A, suggesting that more northerly waves resulted in enhanced accretion (r = 0.697, p = 0.006, N = 14 for changes in beach width, m/day). However, an increase in the proportion of time northerly waves exceeded heights of 2.5 m was likely to result in a decrease in beach profile area above MLWS (rs = −0.654, p = 0.008, N = 15), as also observed in the analysis of dataset 1. In contrast, an increase in the proportion of time northerly waves exceeded heights of 2.5 m was likely to enhance beach accretion in Transects B and C, for changes in beach width (m/day) above MWL (rs = 0.651, p = 0.012, N = 14) and for area below MHWS (rs = 0.551, p = 0.033, N = 15), respectively.
The lack of correlation with indicators based on dataset 1 was likely due to the episodic nature of large shoreline changes. The largest magnitudes of shoreline changes tended to occur within short periods of time as a response to changes in wave conditions. Therefore, commonly used indicators may not be appropriate for analysis at longer time frames. Indicators reflected either extreme values (which could have varying effects depending on whether they were evenly distributed or occurred at either end of the time period), or average conditions (which indiscriminately evened out effects across the period). Both types provided limited information on conditions throughout the period of time, restricting the identification of relationships. The effects of localised settings, such as the presence of an eroding cliff or coastal defences, also contributed to the alongshore variability of beach response at all spatial scales. Erosion of the soft cliff in Transect C could provide sand to the beach, counteracting beach retreat or area loss. The presence of gabions and geobags in Transect D seemed to enhance beach mobility, particularly erosion.
5. Discussion
The relationship between shoreline changes and indicators of wave power are widely recognised and demonstrated for sandy [5,46,47] and gravel [48,49] beaches. In the study area, this relationship was precluded or limited due to the large spatial variability in beach response observed within the 2-km-long coastline at a range of temporal scales. This large variability is likely attributed to the presence of mixed sand and gravel, the bimodal wave direction, wave interactions with nearshore features, localised settings (e.g., the presence of engineering works), or a combination of these factors.
The limited number of studies on the effects of bimodal wave directions suggests that even small differences in wave offshore direction can affect transport rates at the shoreline [28]. More often these differences are attributed to wave interactions with nearshore bathymetry [24,27,29], affecting the distribution of energy arriving at the shore [15,24]. The presence of stationary Coralline Crag ridges and the dynamic Sizewell sand bank makes the nearshore bathymetry in the study area very complex, which could result in a local divergence of longshore transport around Thorpeness [29] or a focusing of wave energy causing erosion hotspots at the coast [45]. The presence of the ness may be a result or a cause of divergence of longshore transport, as suggested at Orford ness [50] and Benacre ness [29]. At these locations, local longshore transport divergence is associated with headlands, underwater geology, or a combination of both. Results from this study showed a contrasting response between Transect A (at the ness) and B (south of the ness), which may suggest an effect of longshore transport boundaries. Transect A eroded, and Transect B accreted, with increasing wave energy, particularly due to high northerly waves. Similarly, when high southerly waves were dominant for extended periods (e.g., from 2014 to mid-2016), Transect A accreted and Transect B eroded. Targeted modelling simulations could provide further insights into the occurrence and potential influence of local divergences of longshore transport and nearshore wave focusing.
MSG beach response is modulated by the proportions of sand and gravel [51,52,53]. Additionally, the distribution of sand and gravel can show considerable variations through time both alongshore and cross-shore, making patterns of beach response less obvious [37]. However, little is known about how the proportion of sand and gravel changes temporally and spatially in MSG beaches and how the different mixes may influence beach mobility [36]. Laboratory experiments and limited observations on MSG beach nourishment have suggested enhanced beach mobility when the sediment mixture is formed by 30%–40% of sand [37,51]. Corroboration from studies on natural beaches and in a range of settings would contribute to demonstrating the validity of these suggestions.
Better understanding the role of the proportion of sand and gravel is warranted to prevent undesirable effects, such as enhancing erosion as a result of beach nourishment that has inadvertently created sediment mixtures with unfavourable proportions of sand [38,51], or to assess whether erosion of a sandy cliff may enrich the beach with a 30% sand mixture that may lead to increased erosion. Elucidating the drivers influencing the large alongshore variability observed within the 2-km-long coastline requires further investigation to adequately inform and support management decisions.
These results highlight the intricate range of factors, natural and human-derived, that interact along modern coastlines influencing beach response. The understanding of temporal and spatial variability in the response of MSG beaches is still limited, particular in complex settings, such as under the influence of bimodal wave direction. The analysis of biannual topographic surveys has proven useful in detecting longer-term trends of shoreline changes and how they vary (in magnitude and direction) alongshore and through time. However, it was only through the analysis of more frequent surveys that key aspects of beach morphology changes and how they vary alongshore could be elucidated. In particular, these surveys helped identify the role of gravel ridges in beach stability and erosion and, to some extent, the influence of bimodal wave direction on beach mobility. Therefore, there is a case to be made for more frequent surveys as part of coastal monitoring to advance the understanding of MSG beach behaviour, which is required to inform coastal management schemes.
6. Conclusions
This study demonstrated the large alongshore variability in beach response that can exist within a short stretch of a mixed sand and gravel coast subjected to the same offshore wave conditions. The analysis focused on changes in morphology along five cross-shore transects within a 2-km-long coastline of Suffolk (East England) and associated offshore wave conditions from January 2009 to March 2018 across a range of temporal scales. Here, beach mobility was influenced by the presence and movement of gravel ridges from the lower to the upper beach. The higher parts of the profile seemed to be protected by gravel ridge(s) present around mean water level. When the ridge moved up the profile, erosion was observed below mean water level, and accretion occurred above mean high water springs, where the ridge lost form when coalescing with other ridges. The timing of formation and evolution of the gravel ridges and their importance to beach mobility varied alongshore. The presence of coastal protection structures seemed to restrict the role of these gravel ridges, enhancing beach mobility and contributing to a localised “erosion hotspot”. The large spatial variability in beach response made the widely recognised relationship between shoreline changes and indicators of wave power much less clear in the study area. This large variability is likely attributed to the presence of a varying mix of sand and gravel, bimodal wave direction, wave interactions with nearshore features leading to divergence of longshore transport, localised settings (e.g., the presence of coastal protection), or a combination of these factors. Further investigation into the influence of these factors is required to inform local management decisions and to reduce risk to beachfront properties along the local “erosion hotspot”.
Supplementary Materials
The following are available online at https://www.mdpi.com/2076-3263/8/12/488/s1, Figure S1: Transect A Beach profile animation; Figure S2: Transect B Beach profile animation; Figure S3: Transect C Beach profile animation; Figure S4: Transect D Beach profile Animation; Figure S5: Transect E Beach profile animation; S6: Datasets Atkinson_Esteves_Data.xlsx.
Author Contributions
Conceptualisation, J.A. and L.S.E.; methodology, J.A. and L.S.E.; software, J.A.; validation, L.S.E.; formal analysis, J.A. and L.S.E.; investigation, J.A.; resources, J.A. and L.S.E.; data curation, J.A.; writing—original draft preparation, J.A.; writing—review and editing, L.S.E.; visualization, J.A. and L.S.E.; supervision, L.S.E.; project administration, L.S.E.; funding acquisition, L.S.E.
Funding
Thanks to Bournemouth University, Suffolk Coastal District Council (SCDC), and Mott MacDonald for funding Atkinson’s Ph.D. studentship. The fieldwork was funded by the Natural Environment Research Council (NE/M021564/1) and SCDC.
Acknowledgments
We appreciate the assistance during fieldwork of Paul Patterson, Nick Reeves, Becky Koehler, and Lucy Williams (all from SCDC), Leo Clarke, Lucy Goodman, Alex Willcocks, and James Bell.
Conflicts of Interest
The authors declare no conflict of interest.
References
- Brooks, S.M.; Spencer, T.; Christie, E.K. Storm impacts and shoreline recovery: Mechanisms and controls in the southern North Sea. Geomorphology 2017, 283, 48–60. [Google Scholar] [CrossRef]
- Prieto-Campos, A.; Díaz-Cuevas, P.; Fernandez-Nunez, M.; Ojeda-Zújar, J. Methodology for Improving the Analysis, Interpretation, and Geo-Visualisation of Erosion Rates in Coastal Beaches—Andalusia, Southern Spain. Geosciences 2018, 8, 335. [Google Scholar] [CrossRef]
- Wadey, M.P.; Haigh, I.D.; Nicholls, R.J.; Brown, J.M.; Horsburgh, K.; Carroll, B.; Gallop, S.L.; Mason, T.; Bradshaw, E. A comparison of the 31 January–1 February 1953 and 5–6 December 2013 coastal flood events around the UK. Front. Mar. Sci. 2015, 2, 84. [Google Scholar] [CrossRef]
- Burvingt, O.; Masselink, G.; Russell, P.; Scott, T. Classification of beach response to extreme storms. Geomorphology 2017, 295, 722–737. [Google Scholar] [CrossRef]
- Loureiro, C.; Ferreira, Ó.; Cooper, J.A.G. Geologically constrained morphological variability and boundary effects on embayed beaches. Mar. Geol. 2012, 329–331, 1–15. [Google Scholar] [CrossRef]
- Almeida, L.P.; Ferreira, Ó.; Vousdoukas, M.I.; Dodet, G. Historical variation and trends in storminess along the Portuguese South Coast. Nat. Hazards Earth Syst. Sci. 2011, 11, 2407–2417. [Google Scholar] [CrossRef] [Green Version]
- Castelle, B.; Marieu, V.; Bujan, S.; Splinter, K.D.; Robinet, A.; Sénéchal, N.; Ferreira, S. Impact of the winter 2013–2014 series of severe Western Europe storms on a double-barred sandy coast: Beach and dune erosion and megacusp embayments. Geomorphology 2015, 238, 135–148. [Google Scholar] [CrossRef]
- Almeida, L.P.; Masselink, G.; Russell, P.E.; Davidson, M.A. Observations of gravel beach dynamics during high energy wave conditions using a laser scanner. Geomorphology 2015, 228, 15–27. [Google Scholar] [CrossRef] [Green Version]
- Buscombe, D.; Masselink, G. Concepts in gravel beach dynamics. Earth-Sci. Rev. 2006, 79, 33–52. [Google Scholar] [CrossRef]
- McCall, R.T.; Masselink, G.; Poate, T.G.; Roelvink, J.A.; Almeida, L.P.; Davidson, M.; Russell, P.E. Modelling storm hydrodynamics on gravel beaches with XBeach-G. Coast. Eng. 2014, 91, 231–250. [Google Scholar] [CrossRef] [Green Version]
- Kirk, R.M. Mixed sand and gravel beaches: Morphology, processes and sediments. Prog. Phys. Geogr. 1980, 4, 189–210. [Google Scholar] [CrossRef]
- Ashton, A.D.; Murray, A.B. High-angle wave instability and emergent shoreline shapes: 1. Modeling of sand waves, flying spits, and capes. J. Geophys. Res. 2006, 111, F04011. [Google Scholar] [CrossRef]
- Bayram, A.; Larson, M.; Hanson, H. A new formula for the total longshore sediment transport rate. Coast. Eng. 2007, 54, 700–710. [Google Scholar] [CrossRef]
- Esteves, L.S.; Williams, J.J.; Lisniowski, M.A. Measuring and modelling longshore sediment transport. Estuar. Coast. Shelf Sci. 2009, 83, 47–59. [Google Scholar] [CrossRef]
- Limber, P.W.; Adams, P.N.; Murray, A.B. Modeling large-scale shoreline change caused by complex bathymetry in low-angle wave climates. Mar. Geol. 2017, 383, 55–64. [Google Scholar] [CrossRef]
- Van Rijn, L.; Walstra, D.J.; Grasmeijer, B.; Sutherland, J.; Pan, S.; Sierra, J. The predictability of cross-shore bed evolution of sandy beaches at the time scale of storms and seasons using process-based Profile models. Coast. Eng. 2003, 47, 295–327. [Google Scholar] [CrossRef]
- Jamal, M.H.; Simmonds, D.J.; Magar, V. Modelling gravel beach dynamics with XBeach. Coast. Eng. 2014, 89, 20–29. [Google Scholar] [CrossRef]
- Williams, J.J.; de Alegría-Arzaburu, A.R.; McCall, R.T.; Van Dongeren, A. Modelling gravel barrier profile response to combined waves and tides using XBeach: Laboratory and field results. Coast. Eng. 2012, 63, 62–80. [Google Scholar] [CrossRef]
- Bergillos, R.J.; Rodríguez-Delgado, C.; Ortega-Sánchez, M. Advances in management tools for modeling artificial nourishments in mixed beaches. J. Mar. Syst. 2017, 172, 1–13. [Google Scholar] [CrossRef]
- Spencer, T.; Brooks, S.M.; Evans, B.R.; Tempest, J.A.; Möller, I. Southern North Sea storm surge event of 5 December 2013: Water levels, waves and coastal impacts. Earth-Sci. Rev. 2015, 146, 120–145. [Google Scholar] [CrossRef]
- Dissanayake, P.; Brown, J.; Wisse, P.; Karunarathna, H. Effects of storm clustering on beach/dune evolution. Mar. Geol. 2015, 370, 63–75. [Google Scholar] [CrossRef]
- Karunarathna, H.; Pender, D.; Ranasinghe, R.; Short, A.D.; Reeve, D.E. The effects of storm clustering on beach profile variability. Mar. Geol. 2014, 348, 103–112. [Google Scholar] [CrossRef]
- Gomes, M.; Santos, L.; Pinho, J.L.; do Carmo, J.S.A. Hazard Assessment of Storm Events for the Portuguese Northern Coast. Geosciences 2018, 8, 178. [Google Scholar] [CrossRef]
- Hegermiller, C.A.; Rueda, A.; Erikson, L.H.; Barnard, P.L.; Antolinez, J.A.A.; Mendez, F.J. Controls of Multimodal Wave Conditions in a Complex Coastal Setting. Geophys. Res. Lett. 2017, 44, 12315–12323. [Google Scholar] [CrossRef]
- Coates, T.T.; Hawkes, P.J. Beach Recharge Design and Bi-modal Wave Spectra. Coast. Eng. Proc. 1998, 1, 3036–3045. [Google Scholar]
- Mason, T.; Dhoop, T. Occurrence of Bimodal Seas around the English Coastline: Technical Note TN 02; Channel Coast Observatory; National Oceanography Centre: Southampton, UK, 2018. [Google Scholar]
- Adams, P.N.; Inman, D.L.; Lovering, J.L. Effects of climate change and wave direction on longshore sediment transport patterns in Southern California. Clim. Chang. 2011, 109, 211–228. [Google Scholar] [CrossRef]
- McSweeney, S.; Shulmeister, J. Variations in wave climate as a driver of decadal scale shoreline change at the Inskip Peninsula, southeast Queensland, Australia. Estuar. Coast. Shelf Sci. 2018, 209, 56–69. [Google Scholar] [CrossRef]
- Burningham, H.; French, J. Shoreline—Shoreface Dynamics on the Suffolk Coast; The Crown Estate: London, UK, 2016; ISBN 978-1-906410-76-6. [Google Scholar]
- Kirk, R.M. Aspects of Surf and Runup Processes on Mixed Sand and Gravel Beaches. Geogr. Ann. Ser. A Phys. Geogr. 1975, 57, 117–133. [Google Scholar] [CrossRef]
- Matthews, E.R. Measurements of beach pebble attrition in Palliser Bay, southern North Island, New Zealand. Sedimentology 1983, 30, 787–799. [Google Scholar] [CrossRef]
- McLean, R.F. Variations in grain-size and sorting on two Kaikoura beaches. N. Z. J. Mar. Freshw. Res. 1970, 4, 141–164. [Google Scholar] [CrossRef]
- Bergillos, R.J.; Ortega-Sánchez, M.; Masselink, G.; Losada, M.A. Morpho-sedimentary dynamics of a micro-tidal mixed sand and gravel beach, Playa Granada, southern Spain. Mar. Geol. 2016, 379, 28–38. [Google Scholar] [CrossRef]
- Dornbusch, U. Design requirement for mixed sand and gravel beach defences under scenarios of sea level rise. Coast. Eng. 2017, 124, 12–24. [Google Scholar] [CrossRef]
- McFarland, S.; Whitcombe, L.; Collins, M. Recent shingle beach renourishment schemes in the UK: Some preliminary observations. Ocean Coast. Manag. 1994, 25, 143–149. [Google Scholar] [CrossRef]
- Horn, D.P.; Walton, S.M. Spatial and temporal variations of sediment size on a mixed sand and gravel beach. Sediment. Geol. 2007, 202, 509–528. [Google Scholar] [CrossRef]
- Mason, T.; Coates, T.T. Sediment Transport Processes on Mixed Beaches: A Review for Shoreline Management. J. Coast. Res. 2001, 17, 645–657. [Google Scholar]
- Zarkogiannis, S.D.; Kontakiotis, G.; Vousdoukas, M.I.; Velegrakis, A.F.; Collins, M.B.; Antonarakou, A. Scarping of artificially-nourished mixed sand and gravel beaches: Sedimentological characteristics of Hayling Island beach, Southern England. Coast. Eng. 2018, 133, 1–12. [Google Scholar] [CrossRef]
- Stark, N.; Hay, A.E. Pebble and cobble transport on a steep, mega-tidal, mixed sand and gravel beach. Mar. Geol. 2016, 382, 210–223. [Google Scholar] [CrossRef]
- Long, P.E.; Zalasiewicz, J.A. The molluscan fauna of the Coralline Crag (Pliocene, Zanclean) at Raydon Hall, Suffolk, UK: Palaeoecological significance reassessed. Palaeogeogr. Palaeoclimatol. Palaeoecol. 2011, 309, 53–72. [Google Scholar] [CrossRef]
- Pye, K.; Blott, S.J. Coastal Processes and Morphological Change in the Dunwich-Sizewell Area, Suffolk, UK. J. Coast. Res. 2006, 223, 453–473. [Google Scholar] [CrossRef]
- Carr, A.P. Sizewell-Dunwich Banks Field Study, Long-Term Changes in the Coastline and Offshore Banks Report No. 89; Institute of Oceanographic Sciences: Godalming, UK, 1979. [Google Scholar]
- Davidson, M.A.; Splinter, K.D.; Turner, I.L. A simple equilibrium model for predicting shoreline change. Coast. Eng. 2013, 73, 191–202. [Google Scholar] [CrossRef]
- Bennett, W.; Karunarathna, H.; Mori, N.; Reeve, D. Climate Change Impacts on Future Wave Climate around the UK. J. Mar. Sci. Eng. 2016, 4, 78. [Google Scholar] [CrossRef]
- Williams, J.J.; Herbert, L. Thorpeness Coastal Protection Options Appraisal; Mott MacDonald: London, UK, 2015. [Google Scholar]
- Angnuureng, D.B.; Almar, R.; Senechal, N.; Castelle, B.; Addo, K.A.; Marieu, V.; Ranasinghe, R. Shoreline resilience to individual storms and storm clusters on a meso-macrotidal barred beach. Geomorphology 2017, 290, 265–276. [Google Scholar] [CrossRef]
- Short, A.D. Three Dimensional Beach-Stage Model. J. Geol. 1979, 87, 553–571. [Google Scholar] [CrossRef]
- McCall, R.T.; Masselink, G.; Poate, T.G.; Roelvink, J.A.; Almeida, L.P. Modelling the morphodynamics of gravel beaches during storms with XBeach-G. Coast. Eng. 2015, 103, 52–66. [Google Scholar] [CrossRef]
- Ruiz de Alegria-Arzaburu, A.; Masselink, G. Storm response and beach rotation on a gravel beach, Slapton Sands, U.K. Mar. Geol. 2010, 278, 77–99. [Google Scholar] [CrossRef]
- HR Wallingford. Sandscaping Feasibility Assessment: Suffolk Shingle Engine, Slaughden Site; HR Wallingford Report DDR5443-RT001 for The Crown Estate; HR Wallingford: Oxfordshire, UK, 2016. [Google Scholar]
- She, K.; Horn, D.P.; Canning, P. Influence of Permeability on the Performance of Shingle and Mixed Beaches, R&D Technical Report FD1923/TR—Defra EA; Environment Agency and Defra: London, UK, 2007.
- López de San Román-Blanco, B.; Coates, T.T.; Holmes, P.; Chadwick, A.J.; Bradbury, A.; Baldock, T.E.; Pedrozo-Acuña, A.; Lawrence, J.; Grüne, J. Large scale experiments on gravel and mixed beaches: Experimental procedure, data documentation and initial results. Coast. Eng. 2006, 53, 349–362. [Google Scholar] [CrossRef]
- Mason, T. Hydrodynamics and Sediment Transport on a Macro-Tidal, Mixed (Sand and Shingle) Beach. Unpublished. Ph.D. Thesis, Department of Oceanography, University of Southampton, Southampton, UK, 1997. [Google Scholar]
Figure 1.
Location of beach transects between Thorpeness village (south) and Sizewell nuclear power station (north) in Suffolk (East Anglia, United Kingdom), and offshore bathymetry measured in January 2017.
Figure 1.
Location of beach transects between Thorpeness village (south) and Sizewell nuclear power station (north) in Suffolk (East Anglia, United Kingdom), and offshore bathymetry measured in January 2017.

Figure 2.
Schematic representation of the data collection related to topography (obtained along Transects A to E) and the wave parameters extracted from the West Gabbard Datawell Directional Waverider buoy. Shaded boxes indicate the variables used to test correlations. GDPS: Real-Time Kinematic Differential Geographical Positioning System; MLWS: mean low water springs; MWL: mean water level; MHWS: mean high water springs.

Figure 3.
(a–e) Beach morphology along transects A to E (respectively), and (f) their approximate location within the study area shown on an oblique aerial photograph taken after an intense erosion event in 2010 (photos a–e by L.S. Esteves; f by www.mike-page.co.uk).
Figure 3.
(a–e) Beach morphology along transects A to E (respectively), and (f) their approximate location within the study area shown on an oblique aerial photograph taken after an intense erosion event in 2010 (photos a–e by L.S. Esteves; f by www.mike-page.co.uk).

Figure 4.
(a–e) Cross-shore profiles measured along Transects A–E (respectively) between January 2009 and February 2018 are shown to give an indication of the profile envelope and range of variations. Biannual measurements by the Environment Agency (EA) are shown in grey (the earliest one as a black dashed line for reference), and dataset 2 measurements are shown in colour. (f) Maximum changes in elevation observed along each transect. Note that the areas shaded in grey were excluded from the calculations of profile area presented elsewhere in this paper.

Figure 5.
Relative change in profile area above MLWS for Transects A–E for the period between 7-Jan-2009, and 27-Mar-2018 (including dataset 1 and dataset 2), calculated as a proportion of the respective initial area (shown in the legend). Grey boxes indicate beach nourishment and reprofiling in the area of Transect D, with gravel taken from the area of Transect B.

Figure 6.
Examples of changes in beach morphology at (a,b) Transects A, (c,d) B, and (e,f) D at selected dates showing the presence of gravel (grey shading) and mixed sand and gravel (orange) deposits (within the upper 40 cm).
Figure 6.
Examples of changes in beach morphology at (a,b) Transects A, (c,d) B, and (e,f) D at selected dates showing the presence of gravel (grey shading) and mixed sand and gravel (orange) deposits (within the upper 40 cm).

Figure 7.
Percentage of time offshore waves recorded at West Gabbard approached from northerly (DirP: 300–60°) and southerly (DirP: 120–240°) directions and with heights above 2.5 m (calculated for periods between consecutive surveys undertaken between 7-Jan- 2009, and 27-Mar-2018).
Figure 7.
Percentage of time offshore waves recorded at West Gabbard approached from northerly (DirP: 300–60°) and southerly (DirP: 120–240°) directions and with heights above 2.5 m (calculated for periods between consecutive surveys undertaken between 7-Jan- 2009, and 27-Mar-2018).


Table 1.
Dates of topographic surveys included in dataset 1 and dataset 2.
| Date | Dataset 1 | Dataset 2 |
|---|---|---|
| 07-Jan-2009 | x | |
| 27-Jul-2009 | x | |
| 07-Jan-2010 | x | |
| 20-Jul-2010 | x | |
| 27-Jan-2011 | x | |
| 22-Jun-2011 | x a | |
| 22-Dec-2011 | x | |
| 26-Jul-2012 | x | |
| 06-Feb-2013 | x | |
| 18-Jul-2013 | x | |
| 08-Feb-2014 | x | |
| 05-Aug-2014 | x | |
| 29-Jan-2015 | x | |
| 05-Aug-2015 | x | |
| 02-Feb-2016 | x | |
| 26-Jul-2016 | x | x |
| 03-Aug-2016 | x | |
| 22-Oct-2016 | x b | |
| 06-Dec-2016 | x | |
| 09-Jan-2017 | x c | |
| 19-Jan-2017 | x | |
| 13-Feb-2017 | x | x |
| 21-Mar-2017 | x | |
| 27-Jun-2017 | x | |
| 20-Jul-2017 | x | x |
| 27-Sep-2017 | x | |
| 16-Jan-2018 | x | |
| 26-Feb-2018 | x | x |
| 07-Mar-2018 | x | |
| 27-Mar-2018 | x |
a Transect A and C measured on 8–9 June; b unavailable for Transect C; c available only for Transects A and B.
Table 2.
Descriptive statistics summarising changes in beach width and area (and respective dates where relevant) based on dataset 1 for Transects A to E.
Table 2.
Descriptive statistics summarising changes in beach width and area (and respective dates where relevant) based on dataset 1 for Transects A to E.
| Transects | A | B | C | D | E |
|---|---|---|---|---|---|
| Beach width at MWL (m) | |||||
| Mean | 91.1 | 67.8 | 70.2 | 32.6 | 67.3 |
| Range | 42.3 | 48.8 | 41.8 | 31.0 | 18.0 |
| Minimum | 76.0 8-Feb-2014 | 40.8 13-Feb-2017 | 47.8 20-Jul-2017 | 19.3 21-Jul-2010 | 61.3 22-Dec-2011 |
| Maximum | 118.3 2-Feb-2016 | 89.5 20-Jul-2010 | 89.5 27-Jan-2011 | 50.3 26-Jul-2016 | 79.3 27-Jul-2009 |
| Largest beach growth | 29.8 Aug 2015–Feb 2016 | 12.8 Feb 2013–Jul 2013 | 26.5 Feb 2010–Jul 2010 | 10.0 Feb 2016–Jul 2016 | 5.75 Feb 2016–Jul 2016 |
| Largest retreat | −11.0 Feb 2016–Jul 2016 | −14.0 Jul 2016–Feb 2017 | −15.5 Feb 2016–Jul 2016 | −12.0 Jul 2009–Feb 2010 | −5.75 Jul 2010–Jan 2011 |
| Area above MLWS (m2) | |||||
| Mean | 214.5 | 207.9 | 271.1 | 88.3 | 134.0 |
| Range | 116.9 | 194.2 | 221.1 | 101.9 | 75.4 |
| Minimum | 169.7 8–Feb-2014 | 90.1 13-Feb-2017 | 119.7 13-Feb-2017 | 42.1 21-Jul-2010 | 106.2 8-Feb-2014 |
| Maximum | 286.7 2-Feb-2016 | 284.4 20-Jul-2010 | 340.8 27-Jan-2011 | 144.1 26-Jul-2016 | 181.6 27-Jul-2009 |
| Largest accretion | 78.4 Aug 2015–Feb 2016 | 36.1 Jan 2010–Jul 2010 | 67.4 Feb 2010–Jul 2010 | 27.8 Feb 2016–Jul 2016 | 17.7 Feb16–Jul16 |
| Largest erosion | −35.5 Jul 2017–Feb 2018 | −66.3 Jul 2016–Feb 2017 | −87.6 Jul 2016–Feb 2017 | −46.5 Jul 2009–Feb 2010 | −23.2 Jul 2010–Jan 2011 |
© 2018 by the authors. Licensee MDPI, Basel, Switzerland. This article is an open access article distributed under the terms and conditions of the Creative Commons Attribution (CC BY) license (http://creativecommons.org/licenses/by/4.0/).
Share and Cite
MDPI and ACS Style
Atkinson, J.; Esteves, L.S. Alongshore Variability in the Response of a Mixed Sand and Gravel Beach to Bimodal Wave Direction. Geosciences 2018, 8, 488. https://doi.org/10.3390/geosciences8120488
AMA Style
Atkinson J, Esteves LS. Alongshore Variability in the Response of a Mixed Sand and Gravel Beach to Bimodal Wave Direction. Geosciences. 2018; 8(12):488. https://doi.org/10.3390/geosciences8120488
Chicago/Turabian StyleAtkinson, John, and Luciana S. Esteves. 2018. "Alongshore Variability in the Response of a Mixed Sand and Gravel Beach to Bimodal Wave Direction" Geosciences 8, no. 12: 488. https://doi.org/10.3390/geosciences8120488
Note that from the first issue of 2016, this journal uses article numbers instead of page numbers. See further details here.