Feasibility Study of SQp and SQs Attributes Application for Facies Classification


Department of Geosciences, Universiti Teknologi PETRONAS, 32610 Seri Iskandar, Malaysia
*
Author to whom correspondence should be addressed.
Geosciences 2018, 8(1), 10; https://doi.org/10.3390/geosciences8010010
Submission received: 14 November 2017
/
Revised: 24 December 2017
/
Accepted: 28 December 2017
/
Published: 2 January 2018
(This article belongs to the Special Issue Selected Papers from 1st International Congress on Earth Sciences in SE Asia)
Abstract
:Formation evaluation is a critical requirement in oil and gas exploration and development projects. Although it may be costly, wireline logs need to be acquired to evaluate and understand the subsurface formation. Gamma ray and resistivity are the two main well-log data used for formation evaluation purposes. However, outside the well, formation evaluation becomes difficult, as these logs are not available. Hence, it is important to have other data equivalent to the gamma ray or resistivity logs, which can be derived from other technique, such as seismic data. As a consequence, the dependency on well-log data can be avoided. Thus, the complexity in formation evaluation outside the well, such as the determination of facies, lithology, and fluid content, as well as petrophysical properties can be solved accurately even without well-log data. The objective of this paper was to demonstrate an application of the SQp and SQs attributes for facies classification. These attributes were derived from attenuation attributes through rock physics approximation by using basic elastic properties: P-wave, S-wave, and density. A series of tests were carried out to show the applicability of these attributes on well-logs and real seismic data from offshore the Malaysia Peninsular. Simultaneous inversion was used in the data sets to produce the three-dimensional (3D) SQp and SQs attributes required as inputs of a neural network engine in defining the facies distribution. The results showed that the SQp attribute was very similar to the gamma ray, while the SQs attribute was similar to the resistivity responses even in different reservoir conditions, including low resistivity low contrast and coal masking environment. In conclusion, the SQp motif, which is similar to the gamma ray motif, can potentially be used for facies classification/identification. Together with the SQs attribute, the SQp attribute can be used as input for the facies classification workflow. The application of the SQp and SQs attributes successfully identified the gas sand distribution and separated it clearly from the brine distribution in an offshore Malaysian field.
1. Introduction
Facies classification is a challenging, but necessary, step in formation evaluation analysis and reservoir characterization. Its purpose is to distinctly define the subsurface geology and build a better understanding of the depositional environment of the area. The resultant facies classification model characterizes the distribution of facies and the elastic properties of rocks. The facies model can lead to the construction of the depositional environment of the study area.
The identification of lithology and facies on the well domain are evaluated based on the petrophysical property logs, such as sonic, density, neutron, spontaneous potential (SP), gamma ray, and resistivity [1]. Various algorithms have also been proposed to improve the facies classification, especially for vertical and lateral facies distribution. McCreery and Al-Mudhafar [2] successfully classified the lithology of an oil field in the Texas Basin by applying a partitioning algorithm on well-log data to predict uncored data for better permeability and porosity relation. Utilization of supervised and unsupervised pattern recognition techniques are commonly used to generate a three-dimensional (3D) facies map by integrating seismic data [3].
Gamma ray and resistivity are primary well-log data that should be provided during wire logging for formation evaluation purposes. The gamma ray log is extremely useful for the correlation and evaluation of the shale content of a formation and lithology analysis. Even though the gamma ray is not unique per defined lithology, combining the gamma ray with other logs provides correct information about the formation. After the identification of the main lithology, the gamma ray log can be used as a shale line to estimate the volume of shale and discriminate the reservoir from non-reservoir rock. Many petrophysicists depend on the gamma ray log to define the sand/shale formation as the shale line will not change drastically with depth. Thus, gamma rays can also be used to predict the litho-facies and depositional environment. The different motifs or shapes of the gamma ray log can be associated with different depositional environments [4]. The resistivity log is used to identify the permeable zones, discriminate hydrocarbons from the water saturated zone, determine water saturation, estimate moveable hydrocarbons, determine the resistivity porosity, and correlate the strata [5]. The resistivity log is sensitive to the fluid type, and hence it is also used as a fluid indicator. Variations of lithology, porosity, and saturation can be related to seismically derived P and S velocities and density [6].
In the current technology, both gamma ray and resistivity logs are recorded from wireline logging measurements. It is still difficult to obtain the perfect pseudo logs of gamma ray and resistivity from elastic properties that can be derived from seismic data. However, numerous efforts have been proposed to approximate the attributes for lithology and fluid indicators. Amplitude Versus Offset (AVO) technology, including the AVO rotation technique is one of the methods that can approximate the resistivity log and gamma ray log by performing rotation or projecting the data into certain angles [7,8]. Timko [9] applied the seismic rotation technique to produce a pseudo gamma ray log to solve the problem of sand/shale interbedding in the lower Cretaceous of Near Base Cretaceous (NBC). The prediction of resistivity from elastic properties has also been practiced. Xu and Duta [10] used both P and S waves to predict resistivity, which can be derived from seismic inversion result. However, in some cases, an optimum result is still difficult to achieve due to the correlation issue.
It is very challenging to obtain responses equivalent to the gamma ray and resistivity data that can be derived from elastic properties. Once obtained, all of the seismic data can be converted into pseudo gamma ray and resistivity logs, hence further analyses based on resistivity and gamma ray logs can be undertaken in 3D or four-dimensional (4D) by utilizing the seismic data.
The objective of this paper was to determine the feasibility of the alternative attributes that are derived from basic elastic properties (Scale of Quality Factor of P, SQp and S wave, SQs) that are equivalent to the gamma ray and resistivity response for facies classification/identification. The testing and results of the application of these attributes for advanced analyses on Malaysian offshore data are discussed below.
2. Materials and Methods
Using well-log data, litho-facies can be identified with relative confidence at cored wells through defining cutoffs in well-logs. The integration of the well-log and seismic data for facies classification is useful as both data complement each other. The well-log response is associated with different litho-facies and depositional environments, whereas seismic data is associated with the lateral distribution of facies. By calibrating the well-log data interpretation to the seismic data interpretation, a relationship where the litho-facies distribution can be predicted between the wells and extrapolated away from wells can be established. The workflow for the facies classification is explained in Figure 1.
However, the convolution effects in the log measurement may lead to challenges in facies recognition and inaccuracy of the data evaluation. SQp and SQs attributes that are equivalent to the gamma ray and resistivity log response were applied as an alternative solution for facies prediction/classification in this study. The calculated SQp and SQs attributes were tested on well-logs and seismic data to verify their practicability for facies classification.
Attenuation properties estimated through rockphysics approximation have been introduced by Mavko et al. [11], who used a model of plane wave propagation in the viscoelastic medium, as governed by the Kramers–Kronig relation. By using the Hudson Crack Theory, the inverse Quality factor of the P and S waves (Qp and Qs) were defined in terms of bulk and shear modulus. To simplify the dependency of the equation on attenuation parameter, the SQp and SQs attributes are developed. The SQp and SQs are formulated, as in [12]:
where M/G is the ratio of bulk and shear modulus that can be approximated from the P-wave and S-wave velocity ratio [11]. Equation (1) shows that all of the parameters in this equation can be calculated directly from the seismic inversion result with density and Vp/Vs as inputs.
To test the effectiveness of these attributes in determining the lithology and fluid effect, well-log data were used to calculate the attributes from the density, sonic, and shear logs. The results were compared with the gamma ray and resistivity logs to examine the equivalency. All of the data sets were from the Malaysian offshore. In 3D, the SQp and SQs are calculated from basic elastic properties namely, density, Vp, and Vs, which are obtained from the seismic inversion result using Equation (1). The SQp and SQs are then used as inputs in the facies classification workflow.
To implement the SQp and SQs attributes in real seismic data, a data set consists of: near, mid, and far seismic stacks and well data are used as input for the simultaneous inversion. The Constrained Sparse Spike Inversion method (CSSI) was utilized during simultaneous inversion to obtain the basic elastic impedance of P-imp, S-imp, and density. The 3D SQp and SQs attributes were then calculated from the inversion result using Equation (1). The Probabilistic Neural Network (PNN) was used to classify the lithology in the horizon of interest. Derived attributes consisting of SQp, SQs and their ratios were used as a main input for the implementation of the workflow, which involved three wells in the training stage and cross validation.
3. Results
3.1. Testing Attribute on Well-Logs Data
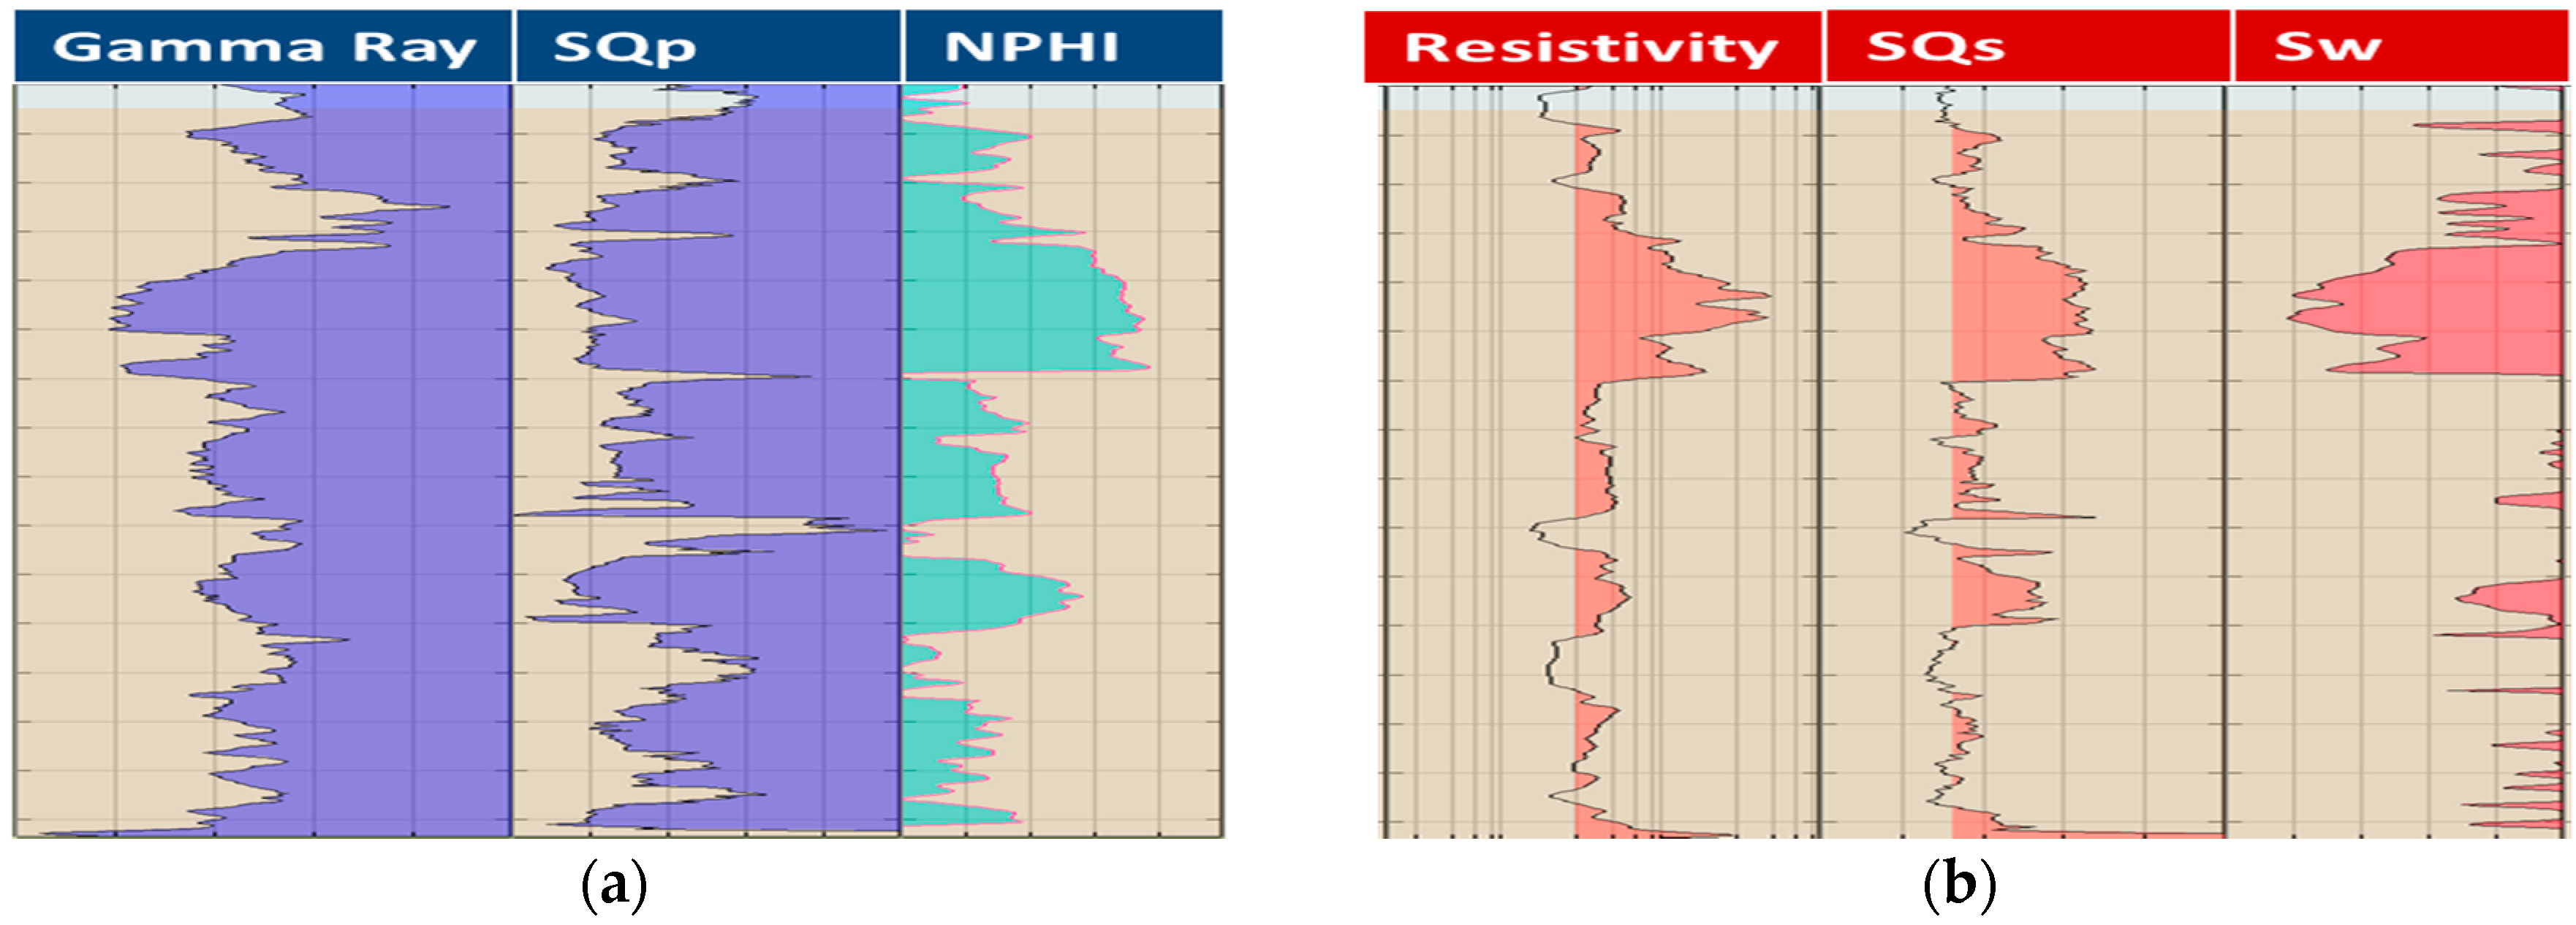
First, the SQp and SQs attributes on well-logs data from the Malaysia offshore were tested. The results showed that the response of the SQp attribute was similar to the gamma ray log, while the SQs attribute showed a similarity to the resistivity log (Figure 2). These attributes were not only similar to the gamma ray and resistivity logs, but the SQp and SQs responses were also similar to the petrophysical i.e., porosity and water saturation logs, respectively.
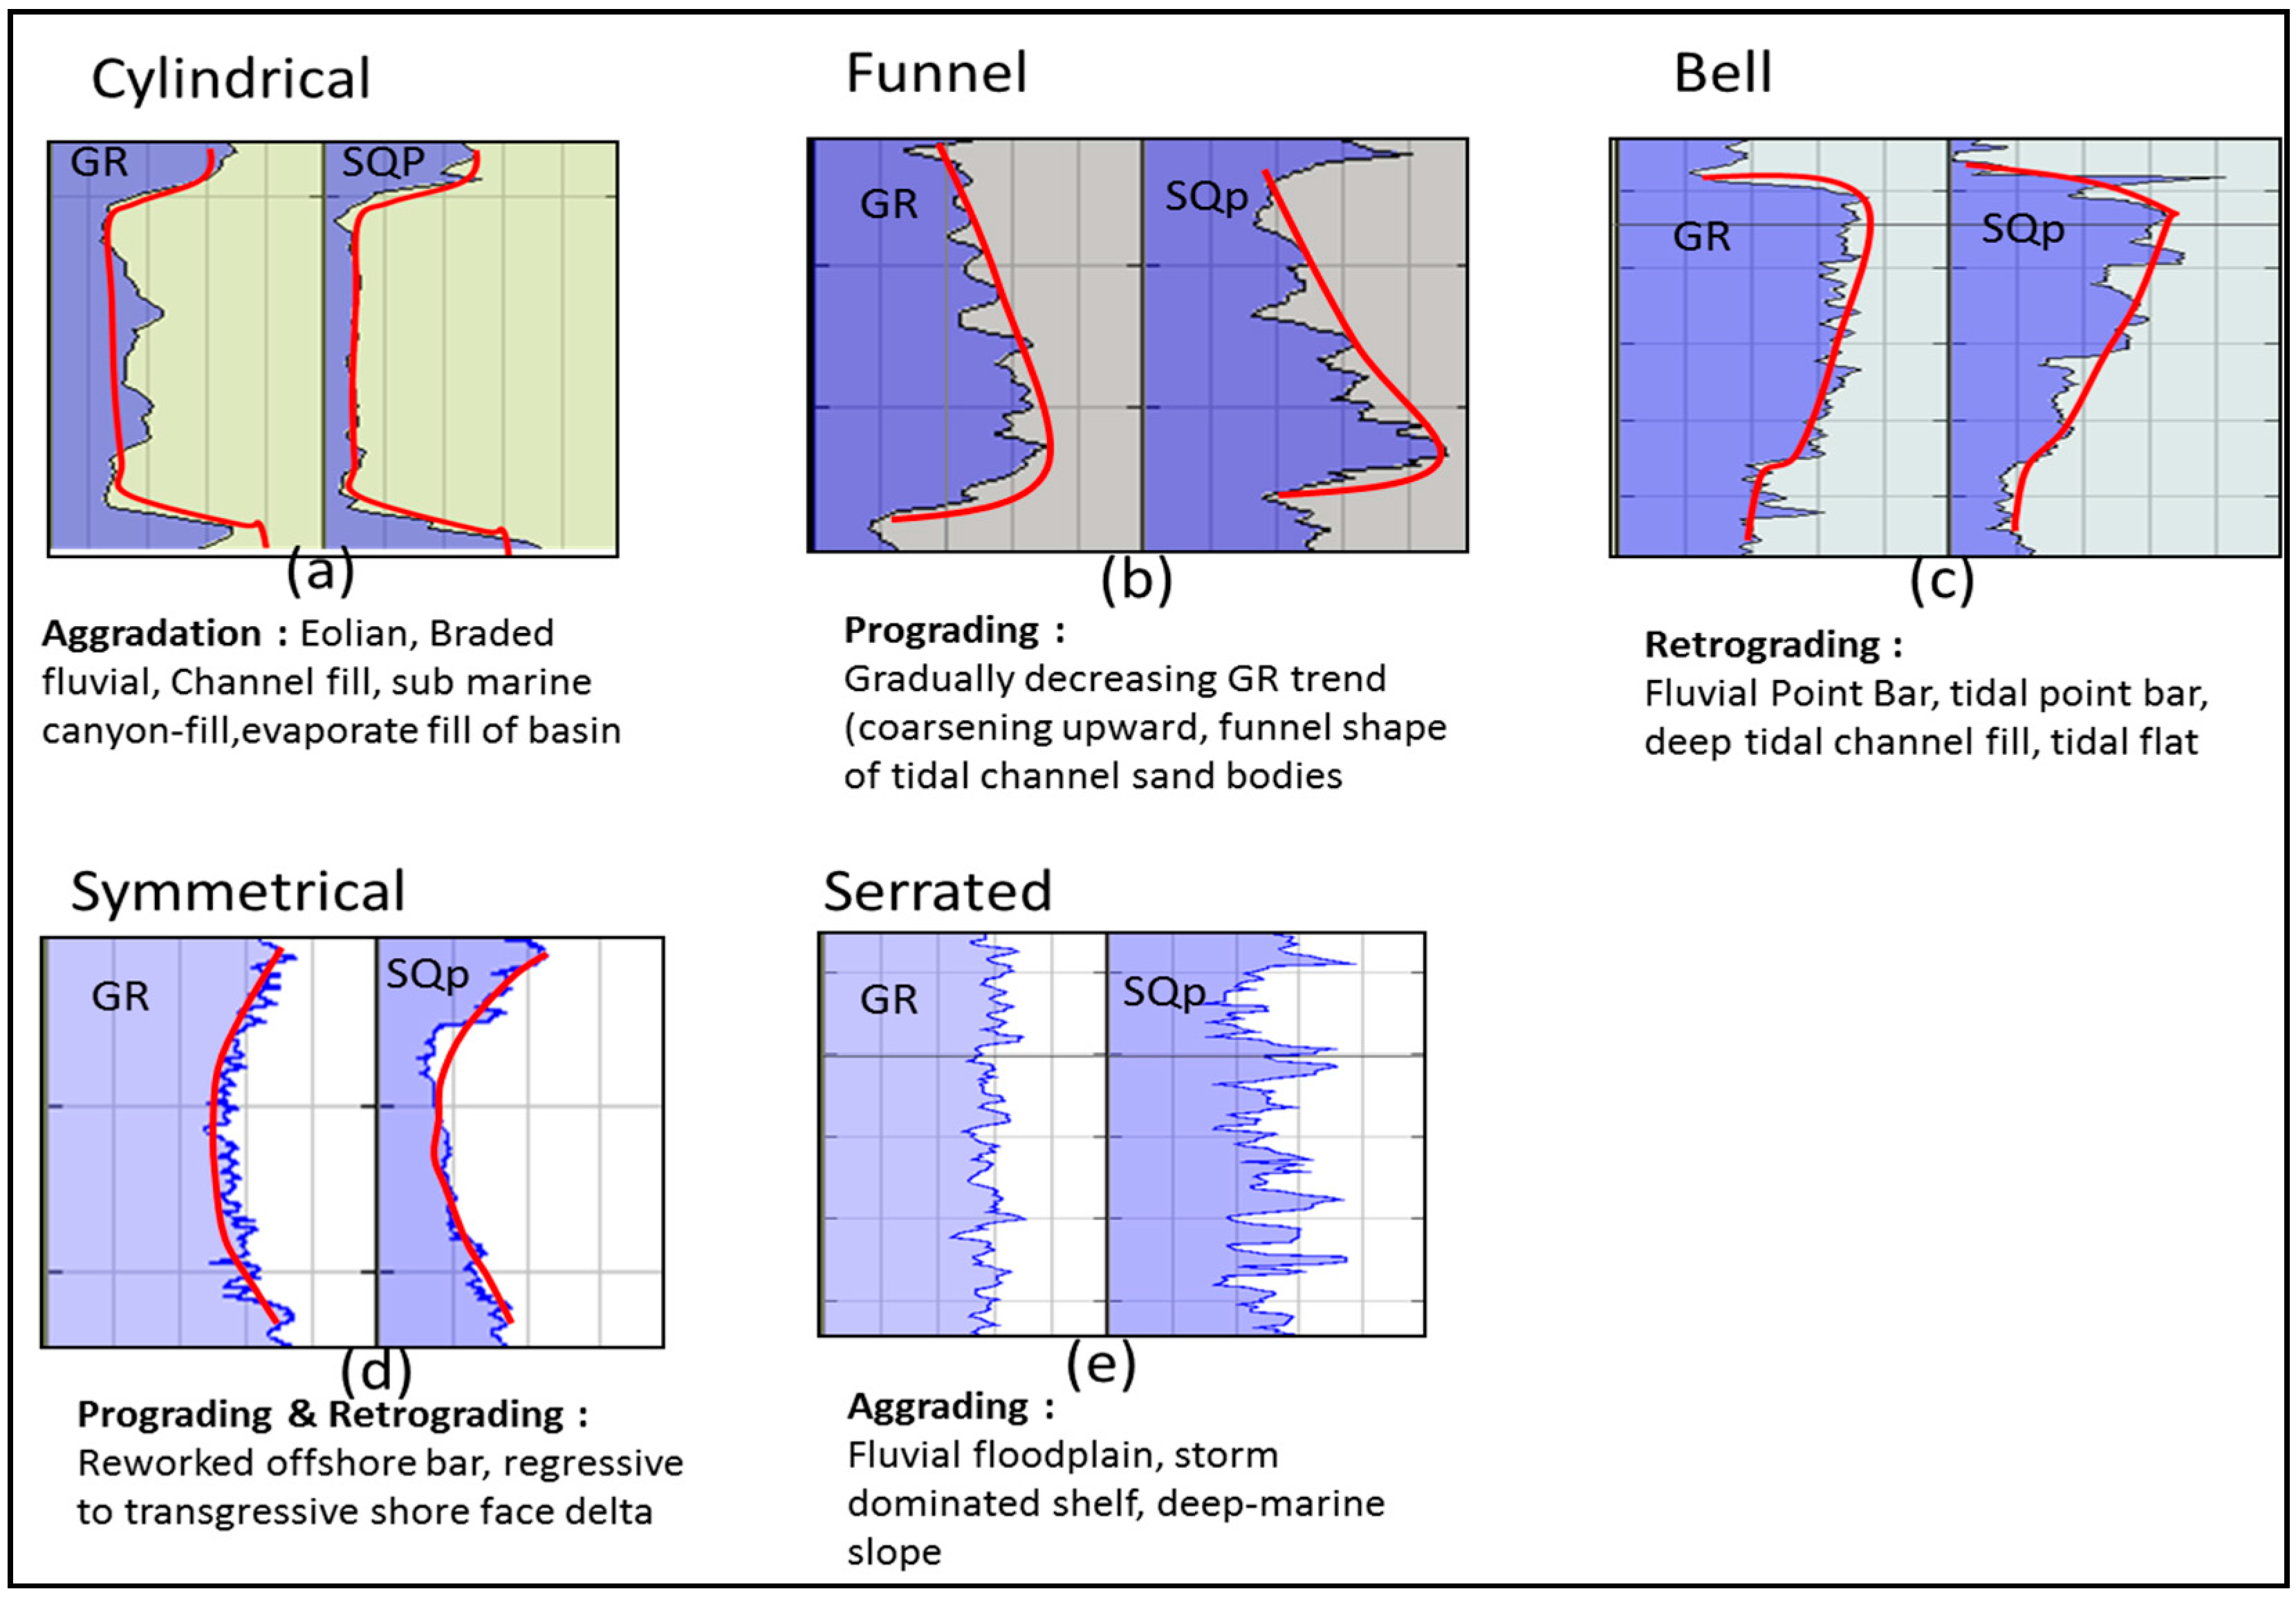
Adequate knowledge of the facies and depositional environment in a given basin will help in hydrocarbon potential delineation. Conventionally, the gamma ray, porosity, and resistivity logs are mandatory for facies classification. The lithology sequences can easily be identified in the log motif of gamma ray. Figure 3 shows how the SQp motif can provide a similar motif as the gamma ray in term of different facies. All of the main stratigraphic sequences, such as Aggradation, Progradation, Retrograding, Prograding, and Retrograding, and Aggrading were successfully identified in the SQp log, as well as in the gamma ray log. Thus, the SQp attribute was demonstrated to be useful for facies classification and seismic sequence stratigraphic analysis.
Commonly, types of fluid have been identified using the resistivity log, especially in the uninvaded zone. Since the response of hydrocarbon is higher than water, it is easier to use resistivity as a tool for fluids identification. Ogiesoba [13] used the instantaneous Quality factor attribute derived directly from the surface seismic data by using multi attribute analysis to predict resistivity and total organic carbon (TOC). Attenuation as the hydrocarbon indicator also has been used in the Gulf of Mexico [14], in that example, the attenuation predicted from both the rock physics approximation and the direct measurements from surface seismic data successfully identified the hydrocarbon accumulation. Not only can it be used as a hydrocarbon indicator, but attenuation can also be used to improve impedance inversion [15]. The direct estimation of attenuation from the surface seismic data can be performed either based on the amplitude spectral or frequency shift methods [16].
Figure 4 shows how SQs can provide a similar response as resistivity logs. In Figure 4a, the gas sand reservoir—identified as high resistivity—showed a similar high resistivity response in the SQs. In the Low Resistivity Low Contrast (LRLC) environment (Figure 4b), it is almost impossible to use the Acoustic Impedance (AI) for delineating the hydrocarbon prospect. However, the SQs is able to provide a better response, as well as resistivity. Thus, the delineation and characterization of this reservoir was possible through the use of SQs. The last example is shown in Figure 4c, where the coal layers appear in the resistivity response as a spike, which is equally shown in the SQs response.
3.2. Application for Facies Classification
Facies classification includes interdisciplinary tasks utilizing data at different scales, such as well-log data and computed properties, as well as geophysical measurements of seismic data. Using well-log data, facies classification defines the facies profile at the well location, which is then extended to inverted seismic attributes. The facies profiles at the well location were used as training data sets to link the inverted seismic attributes to the facies for seismic facies classification. As the SQp and SQs attributes are equivalent to the gamma ray and resistivity logs where the SQp attribute showed a similar motif to the gamma ray log, they can be used in facies classification to replace the well-log data.
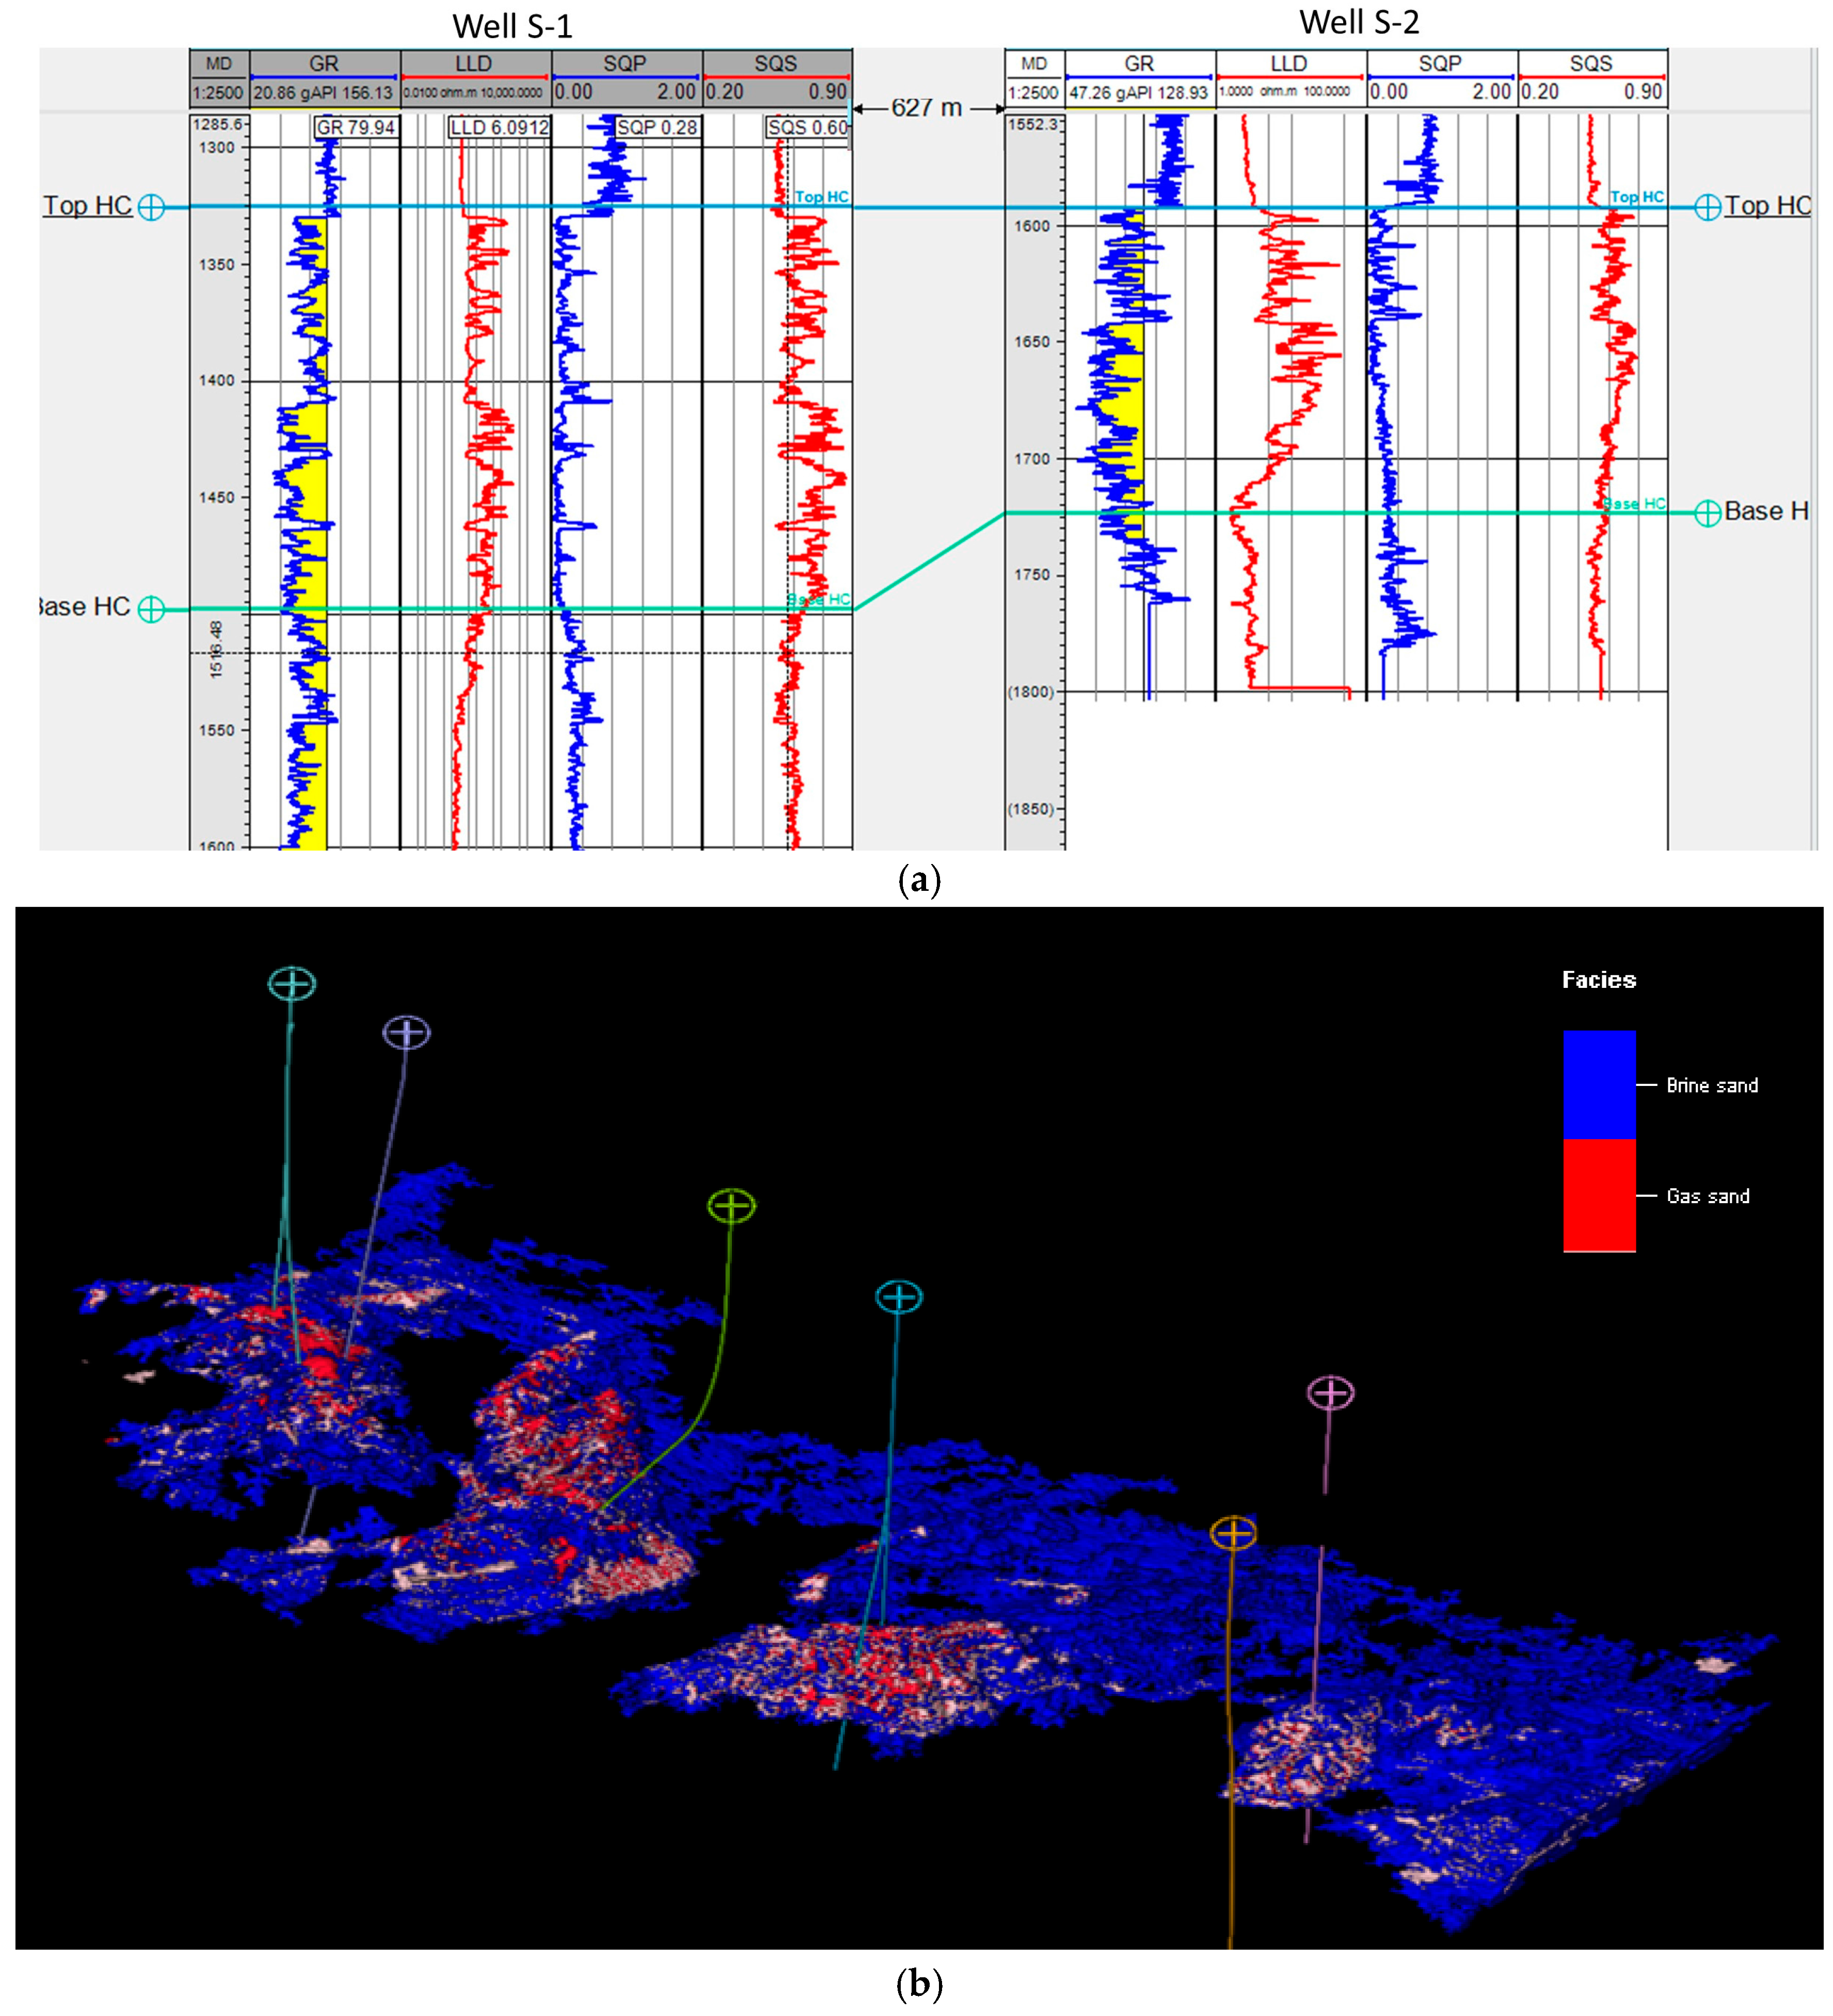
The feasibility of using SQp and SQs attributes for facies classification was demonstrated. A simultaneous inversion was performed to obtain the basic elastic properties. All of the parameters on the SQp and SQs formulation could be obtained directly from the simultaneous inversion, as shown in Equation (1). These attributes were applied as the input for the facies classification workflow. Figure 5 shows a well correlated and lithology map where the gas sand (red) was easily distinguished from the wet sand (blue).
4. Conclusions
A new tool for generating pseudo gamma ray and resistivity logs from elastic properties was successfully developed. These pseudo gamma ray and resistivity logs, SQp and SQs, can be used to identify the lithology and classify facies. The application of these tools on well-logs data showed that SQp had a similar response to gamma rays, and that SQs was similar to the resistivity log. Given these similarities, in the future, the SQp and SQs attributes can be used to replace the gamma ray log and resistivity log, respectively, for the same purposes, for example, facies classification, formation evaluation, reservoir characterization, and petrophysical properties prediction. It is also possible to extend the application of these attributes to other cases, such as the carbonate reservoir, fractured basement reservoir, and over pressure prediction. The application can be implemented in any field both inside and outside Malaysia. However, further investigation is still needed to examine and extend the application of these attributes for different purposes.
Acknowledgments
The authors thank UTP for funding this research work and PETRONAS for providing the data.
Author Contributions
Maman Hermana developed SQp and SQs attributes; Jia Qi Ngui implemented the workflow on real seismic data; Chow Weng Sum contributed to log analysis and facies identification and Deva Prasad Ghosh contributed to seismic inversion work.
Conflicts of Interest
The authors declare no conflict of interest.
References
- Al-Badawi, B.A. Reservoir Characterization and Identification of Formation Lithology from Well-log Data of Nahr Umr Formation in Luhais Oil Field, Southern Iraq. Iraqi J. Sci. 2016, 57, 445–463. [Google Scholar]
- McCreery, E.B.; Al-Mudhafar, W.J. Geostatistical Classification of Lithology Using Partitioning Algorithms on Well-log Data—A Case Study in Forest Hill Oil Field, East Texas Basin. In Proceedings of the 79th EAGE Conference and Exhibition, Paris, France, 12–15 June 2017. [Google Scholar]
- Qian, F.; Yin, M.; Su, M.-J.; Wang, Y.; Hu, G. Seismic Facies Recognition Based on Prestack Data Using Deep Convolutional Autoencoder. Available online: https://arxiv.org/pdf/1704.02446.pdf (accessed on 18 December 2017).
- Nazeera, A.; Abbasib, S.A.; Solangi, S.H. Sedimentary Facies Interpretation of Gamma Ray (GR) Log as Basic Well-Logs in Central and Lower Indus Basin of Pakistan. Geodesy Geodyn. 2016, 7, 432–443. [Google Scholar] [CrossRef]
- Varhaug, M. Basic Log Interpretation. In Oilfield Review; Schlumberger: Houston, TX, USA, 2016. [Google Scholar]
- Avseth, P.; Mukerji, T.; Mavko, G. Quantitative Seismic Interpretation; Cambridge University Press: Cambridge, UK, 2005. [Google Scholar]
- Connolly, P.A. Elastic Impedance. In The Leading Edge; Society of Exploration Geophysicists: Houston, TX, USA, 1999. [Google Scholar]
- Whitcombe, D.N.; Connolly, P.A.; Reagan, R.L.; Redshaw, T.C. Extended Elastic Impedance for Fluid and Lithology Prediction. Geophysics 2002, 67, 63–67. [Google Scholar] [CrossRef]
- Timko, D. Pseudo Gamma Ray Volumes Estimated from Offset Seismic; Recorder: Calgary, AB, Canada, 2003; Volume 28. [Google Scholar]
- Xu, H.; Duta, N.C. Prediction of Resistivity Using P and S-wave Properties from Prestack Seismic Inversion. In Proceedings of the 68th EAGE Conference and Exhibition incorporating SPE Europec, Vienna, Austria, 12–15 June 2006. [Google Scholar]
- Mavko, G.; Mukerji, T.; Dvorkin, J.P. The Rockphysics Handbook; Cambridge University Press: Cambridge, UK, 2009. [Google Scholar]
- Hermana, M.; Ghosh, D.P.; Sum, C.W. Optimizing the Lithology and Pore Fluid Separation Using Attenuation. In Proceedings of the Offshore Technology Conference Asia, Kuala Lumpur, Malaysia, 22–25 March 2016; Available online: https://www.onepetro.org/conference-paper/OTC-26437-MS (accessed on 18 December 2017).
- Ogiesoba, O. Application of Instantaneous Quality Factor (Q) in the Characterization of Austin Chalk and Eagle Ford Shale, South Texas; Search and Discovery Article #41781 (2016) Posted March 21, 2016; Datapages, Inc.: Tulsa, OK, USA, 2016. [Google Scholar]
- Walls, J.; Taner, M.T.; Naum Derzhi, G.M.; Jack, D. Seismic Attenuation for Reservoir Characterization; DE-FC26-01BC15356, Final Report; Rock Solid Images: Houston, TX, USA, 2003. [Google Scholar]
- Singleton, S. The Use of Seismic Attenuation to Aid Simultaneous Impedance Inversion in Geophysical Reservoir Characterization. In The Leading Edge; Society of Exploration Geophysicists: Houston, TX, USA, 2008. [Google Scholar]
- Li, F.; Zhou, H.; Jiang, N.; Bi, J.; Marfurt, K.J. Q Estimation from Reflection Seismic Data for Hydrocarbon Detection Using a Modified Frequency Shift Method. J. Geophys. Eng. 2015. [Google Scholar] [CrossRef]
Figure 1.
Workflow for facies classification.
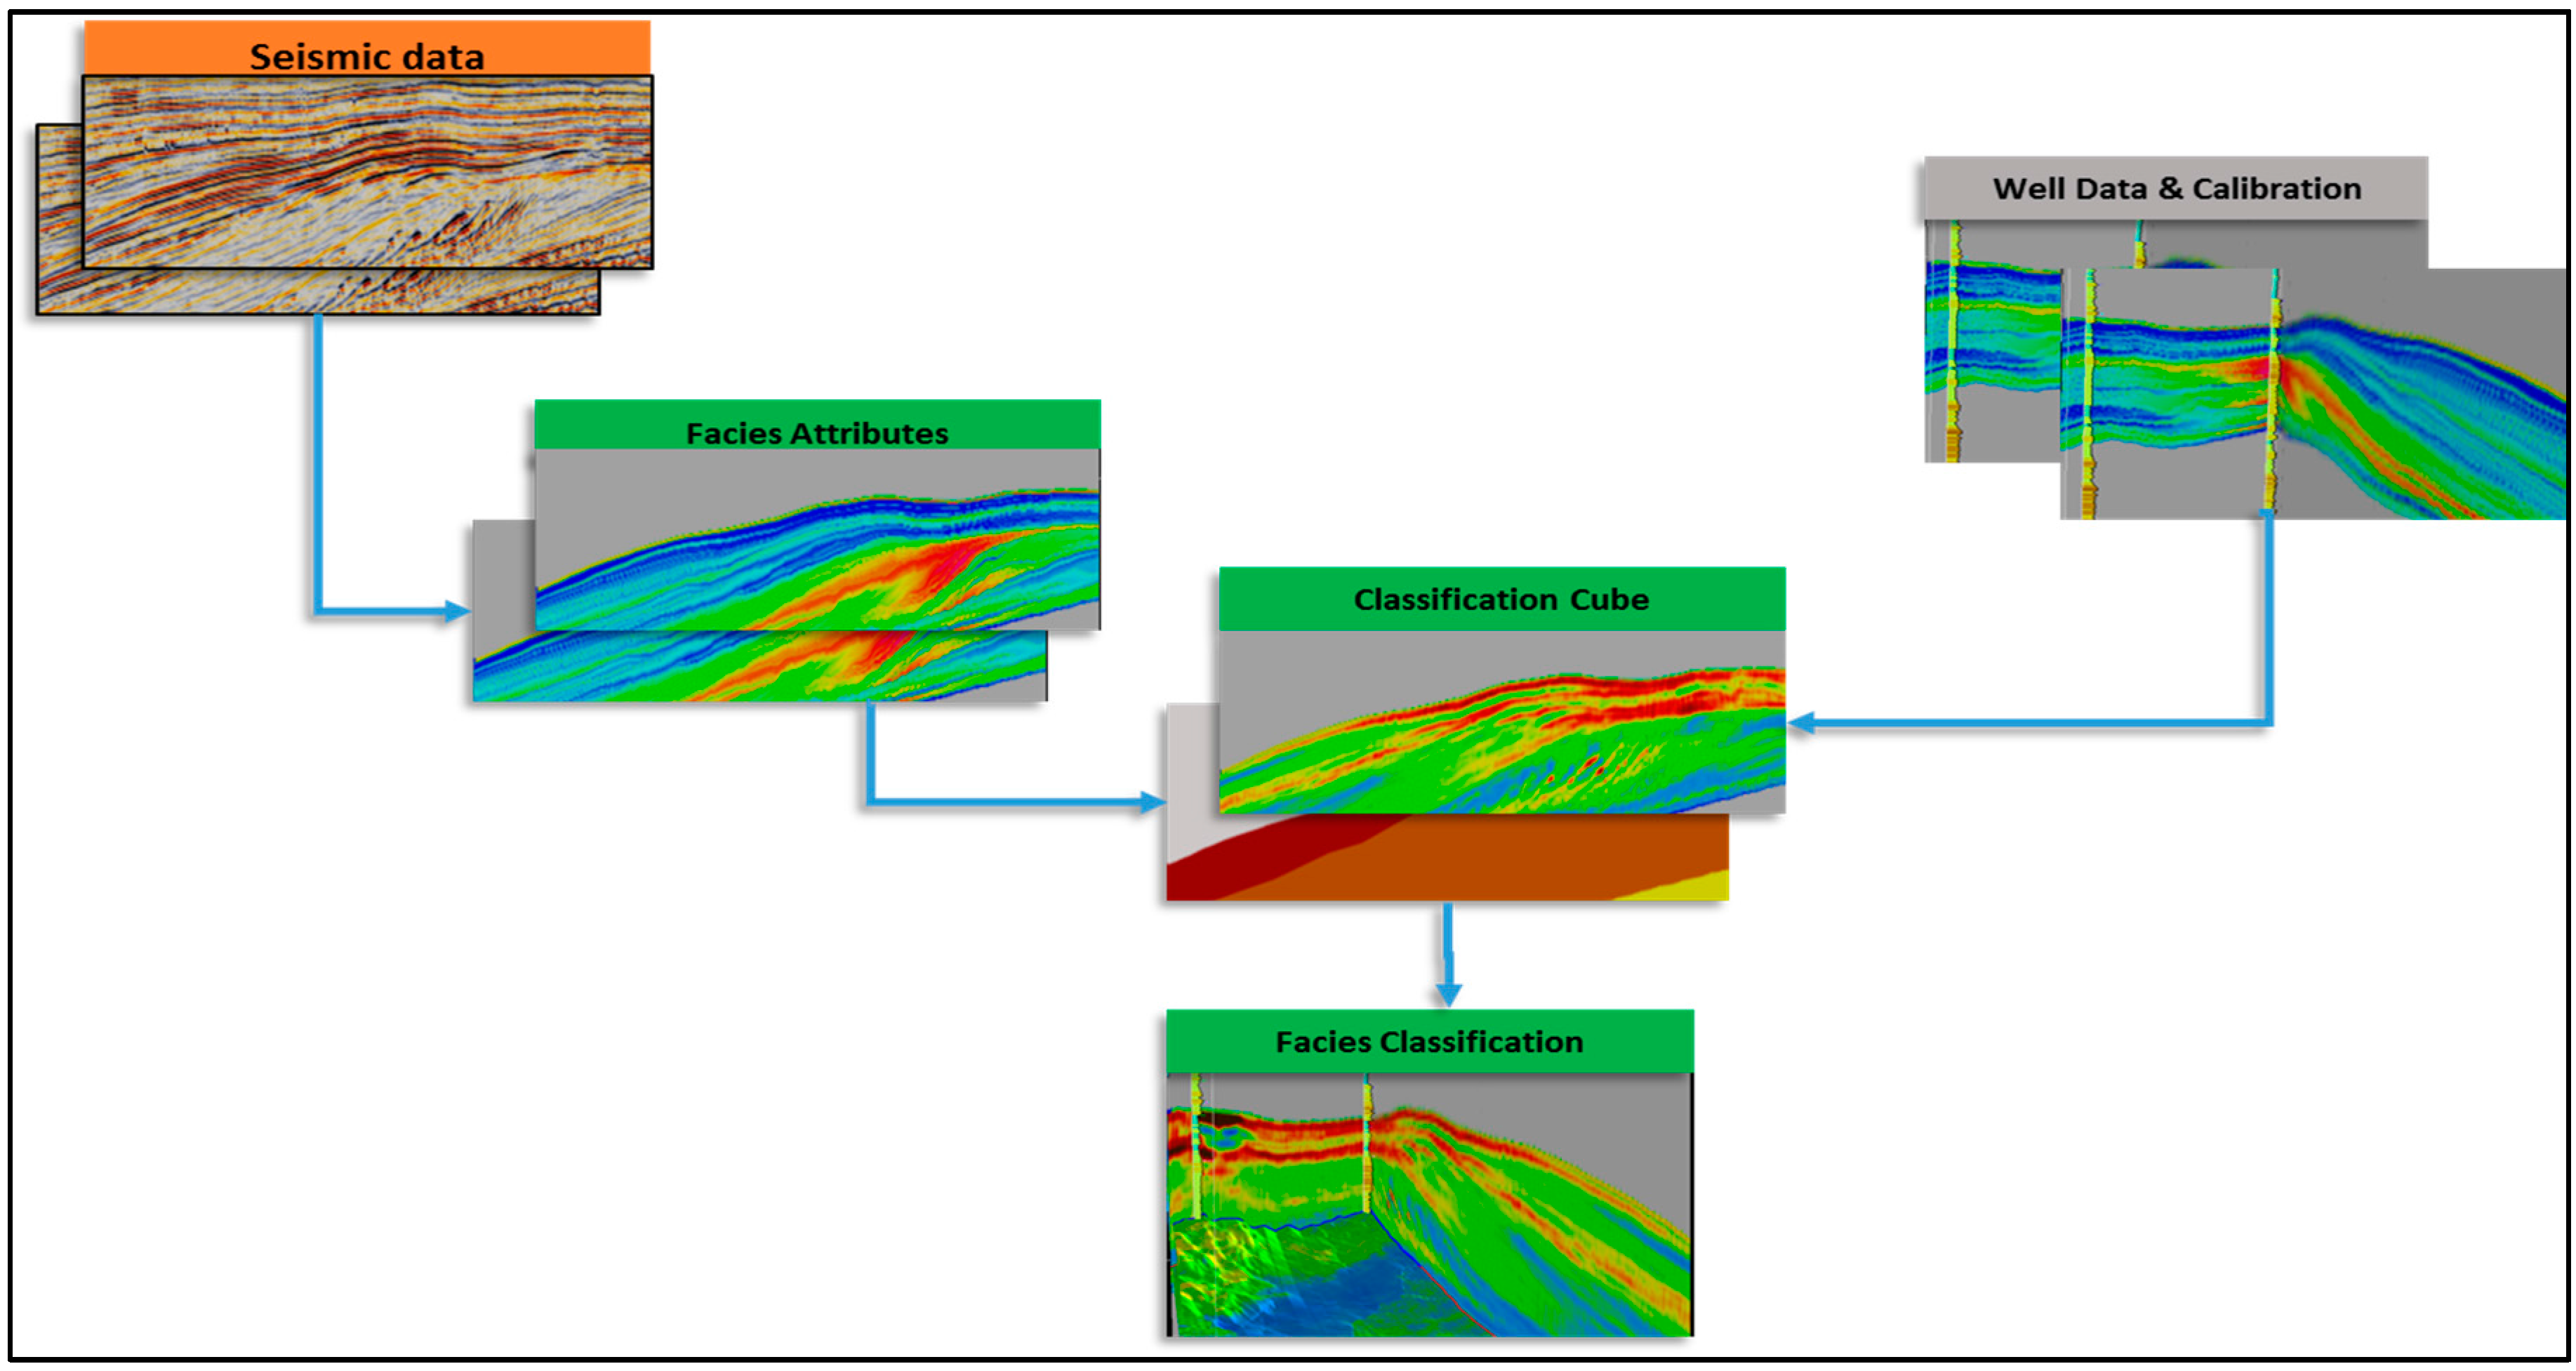
Figure 2.
(a) SQp response compared with the gamma ray and neutron porosity log; and (b) SQs response when compared with the resistivity and water saturation log.
Figure 2.
(a) SQp response compared with the gamma ray and neutron porosity log; and (b) SQs response when compared with the resistivity and water saturation log.

Figure 3.
Facies identification in the gamma ray and SQp, the values of GR and SQp increase to the right. (a) Aggradation; (b) Prograding; (c) Retrograding; (d) Prograding & Retrograding; and, (e) Aggrading.
Figure 3.
Facies identification in the gamma ray and SQp, the values of GR and SQp increase to the right. (a) Aggradation; (b) Prograding; (c) Retrograding; (d) Prograding & Retrograding; and, (e) Aggrading.

Figure 4.
The responses of Resistivity and SQs logs in different environment: (a) Gas sand reservoir; (b) Low Resistivity Low Contrast (LRLC)-oil sand; and, (c) coal layer.
Figure 4.
The responses of Resistivity and SQs logs in different environment: (a) Gas sand reservoir; (b) Low Resistivity Low Contrast (LRLC)-oil sand; and, (c) coal layer.
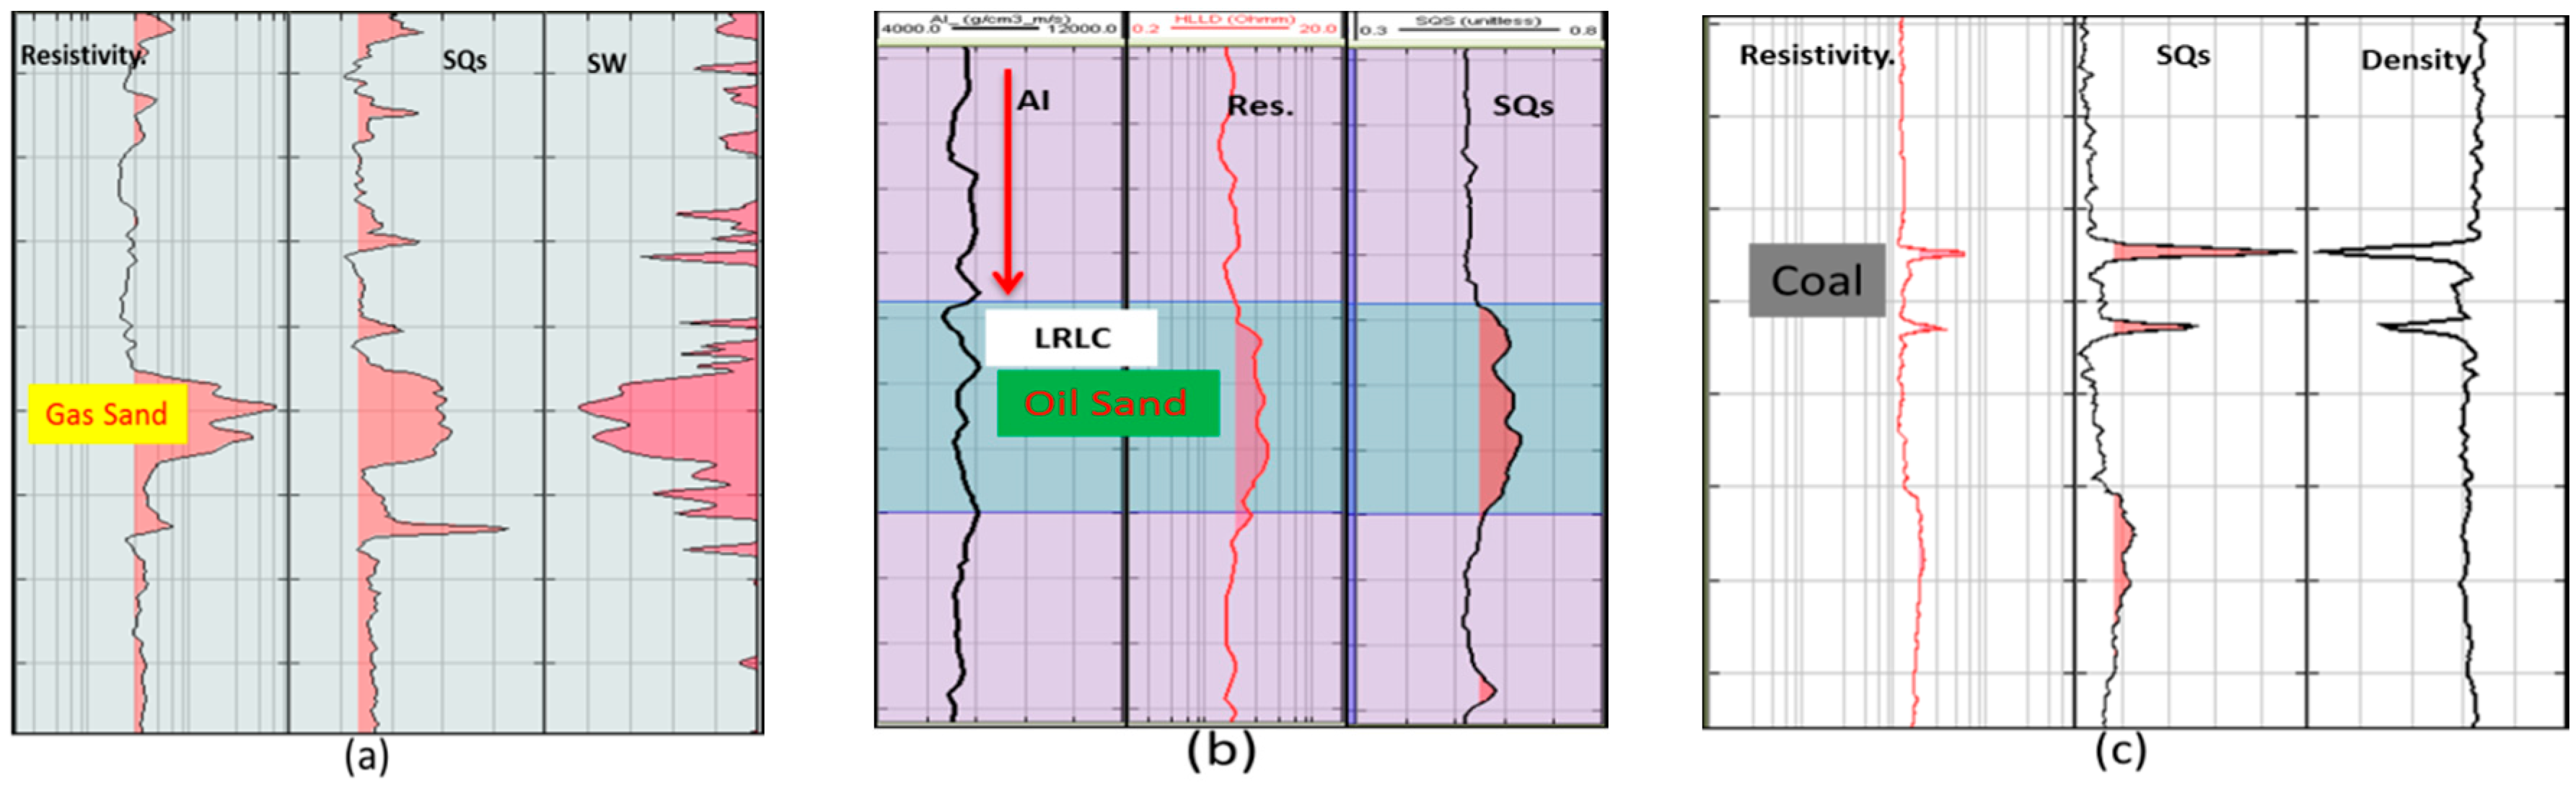
Figure 5.
(a) Well correlation using gamma ray, resistivity, SQp and SQs log for comparison. (b) Brine (blue) sand are separated from gas sand (red) for facies classification with the input SQp and SQs attributes.
Figure 5.
(a) Well correlation using gamma ray, resistivity, SQp and SQs log for comparison. (b) Brine (blue) sand are separated from gas sand (red) for facies classification with the input SQp and SQs attributes.

© 2018 by the authors. Licensee MDPI, Basel, Switzerland. This article is an open access article distributed under the terms and conditions of the Creative Commons Attribution (CC BY) license (http://creativecommons.org/licenses/by/4.0/).
Share and Cite
MDPI and ACS Style
Hermana, M.; Ngui, J.Q.; Weng Sum, C.; Prasad Ghosh, D. Feasibility Study of SQp and SQs Attributes Application for Facies Classification. Geosciences 2018, 8, 10. https://doi.org/10.3390/geosciences8010010
AMA Style
Hermana M, Ngui JQ, Weng Sum C, Prasad Ghosh D. Feasibility Study of SQp and SQs Attributes Application for Facies Classification. Geosciences. 2018; 8(1):10. https://doi.org/10.3390/geosciences8010010
Chicago/Turabian StyleHermana, Maman, Jia Qi Ngui, Chow Weng Sum, and Deva Prasad Ghosh. 2018. "Feasibility Study of SQp and SQs Attributes Application for Facies Classification" Geosciences 8, no. 1: 10. https://doi.org/10.3390/geosciences8010010
Note that from the first issue of 2016, this journal uses article numbers instead of page numbers. See further details here.