1. Introduction
Sandstone is a sedimentary rock widely found in Greek territory that has contributed to the cultural and architectural heritage in Greece and is still significant due to texture, appearance, and high mechanical properties which are compromising with the minimal decorating facade style of modern design. Sandstone from Epirus (Demati, Greece) is a certified rock, according to European Natural stone-Denomination criteria (EN 12440:2008) [
1] as a compact green fossiliferous limy type (
Table 1) sandstone with low porosity and high strength type (
Table 2). All the described properties fully justify the capability of Demati sandstone for building applications.
Table 1.
Composition of Demati sandstone.
Table 1.
Composition of Demati sandstone.
| Mineralogical composition | w/w % | Chemical analysis | w/w % |
|---|
| Calcite | 14.0 | CaO | 22.00 |
| Dolomite | 1.00 | MgO | 2.60 |
| Quartz | 56.00 | SiO2 | 45.20 |
| Micas | <1 | Fe2O3 | <1 |
| Chlorite | - | AI2O3 | 5.65 |
| Feldspars | 28 | K2O | 25.30 |
| Epidote | - | Na2O | 0.01 |
| Chromite | - | MnO | <0.01 |
Table 2.
Physico-mechanical properties of Demati sandstone.
Table 2.
Physico-mechanical properties of Demati sandstone.
| Physicomechanical Properties | Unit | Value |
|---|
| Bulk density | kg/m3 (DIN 52102) | 2.825 |
| Open porosity coefficient | % vol (DIN 52102 | 0.54 |
| Water absorption coefficient | w/w % (DIN 52103) | 0.19 |
| Dynamic modulus of elasticity | GPa (DIN 1048 Teil 5) | 35 |
| Compressive Strength | MPa (DIN 52105) | 139 |
| Flexural strength | MPa (DIN 52112) | 10 |
| Compressive Strength after frost/defrost cycles | MPa (DIN 52104 & 52105) | 103 |
| Abrasion resistance | mm (DIN 52108) | 2.20 |
| Impact Resistance | cm (UNI-U 32.07.248.0) | 59 |
However, long-term interaction of stone with the environment causes a progressive decay of the natural consolidant, which is predominantly lime, and causes deterioration starting from the surface. Especially in the presence of water, as in humidity or rain, in combination with large temperature fluctuations and traffic emission create a very hostile environment for the building materials [
2].
Furthermore, prolonged exposure to natural elements, man-made atmospheric pollution and temperature variations cause degradation [
3] and may provide field for colonization by biological organisms [
4]. Temperature changes, either gradual or sudden, cause stresses due to differential thermal expansion [
5], and consequently cracking.
The chemical and physical properties of materials are important as they determine the result of the interactions with gases, particles, and solutions. Thus, solubility, corrosion resistance, weathering resistance,
etc. are chemical properties strongly related to density, porosity, hardness, and other physical properties, but also to environmental factors [
6]. The evaluation of weathering damages is based on lithological mapping, and mapping of weathering forms. Weathering forms represent the visible results of weathering processes, which are initiated and controlled by interacting weathering facts [
7].
Sedimentary rocks, like sandstones, are usually considered as more susceptible to water deterioration as they are commonly soluble [
8]. Numerous hydrophobic treatments to sandstones showed effective reductions in stone’s water uptake in different extents depending onto the material and the action mechanism [
9], e.g., oils, waxes, acrylic-, phenolic-, epoxy- and PU-resins, have been tested by researchers. Amongst the different tests performed in order to evaluate the effectiveness of the water repellents, the most representative assessment methods were selected [
10],
i.e., those which afforded the fastest and most reliable performance evaluation: color determination, water–stone contact angle, and water-vapor permeability.
Hydrophobic impregnation into a stone makes the mineral surface water-repellent, results in less water absorption, and consequently, less deleterious dissolved substances, therefore it means the protection of building materials [
11].
Conclusions are that the most effective method is hydrophobic impregnation with silicone resin networks [
12,
13,
14,
15] because they provide impermeability to liquid water, permeability to water vapor, oil repellence, absence of color, chemical inertness, and environmental stability and energy saving [
16].
Furthermore, surface energy and the three-dimensional surface microgeometry control the wetability of the solid surfaces with water. The more hydrophobic a surface is, the lower the surface energy and, therefore, the more water repellent it is. However, surface energy is an intrinsic property to each material, so lowering the surface energy is, by itself, not sufficient to produce an ultra water-repellency [
17].
Generally it is recommended to modify the appropriate surface texture of surface geometry to imitate nature’s “lotus effect” by means of nanoparticles in order to increase water-repellency [
18].
Freeze–thaw cycles are an important environmental stress for external stone facades. Water expands when it freezes and can therefore enlarge cracks. Dew and/or frost are nightly occurrences in many climates. The covering temperature falls below the ambient air temperatures on clear nights due to the radiative cooling effect. If the relative humidity is high, dew or frost is formed. Water vapor is absorbed by stone materials. Changes in humidity lead to changes in the equilibrium of water content.
Broadly, water condensation in/or under any type of polymeric films occurs when the local vapor pressure is higher than that corresponding to the local dew point vapor pressure, which is conducive to adhesion reduction and even to complete delamination [
18].
The present study investigates the water protection efficacy of Demati sandstone through the use of hybrid surface coatings, derived by combination of a commercial solvent-based mixture of silicone water repellent, in several concentrations, with amorphous SiO2 nanoparticles.
3. Results and Discussion
3.1. Microscopic Observation
The stereoscopic examination of Demati samples through a lens (×10) displays a typical sandstone texture, which is predominated by clay minerals in a fine grained matrix with medium sugar-like calcitic crystals, well bonded, with no high percentage of voids.
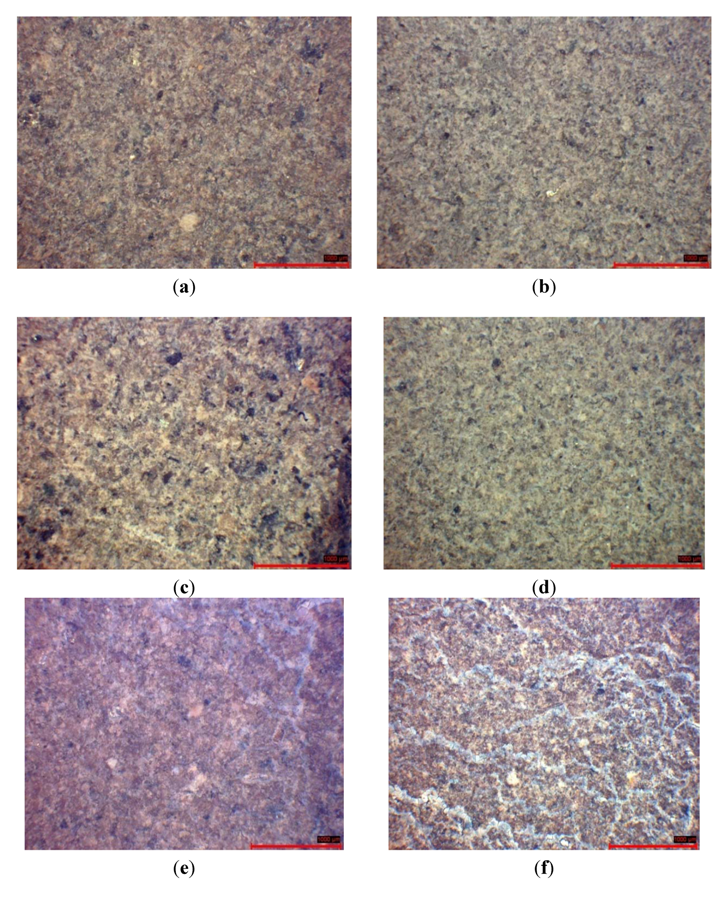
The stereoscopic optical examination was especially revealing of a gradual differentiation of the glass-like texture for the untreated sandstone sample (
Figure 1a) to the whitish, crusted, “fluffy” substratum (
Figure 1f). This texture is fully harmonized by the higher nanosilica content from 0 to 2.5 w/w %. Initially the color of the sandstone was a green/gray color but, due to the nanoparticles increase, it turned to a light grey/green with whitish layer/crust on the mineral surface. The higher the content of nanoparticles, the more marked was the phenomenon of the white crust. The layer was uniformly applied and no density differences were recorded (
Figure 1b–f).
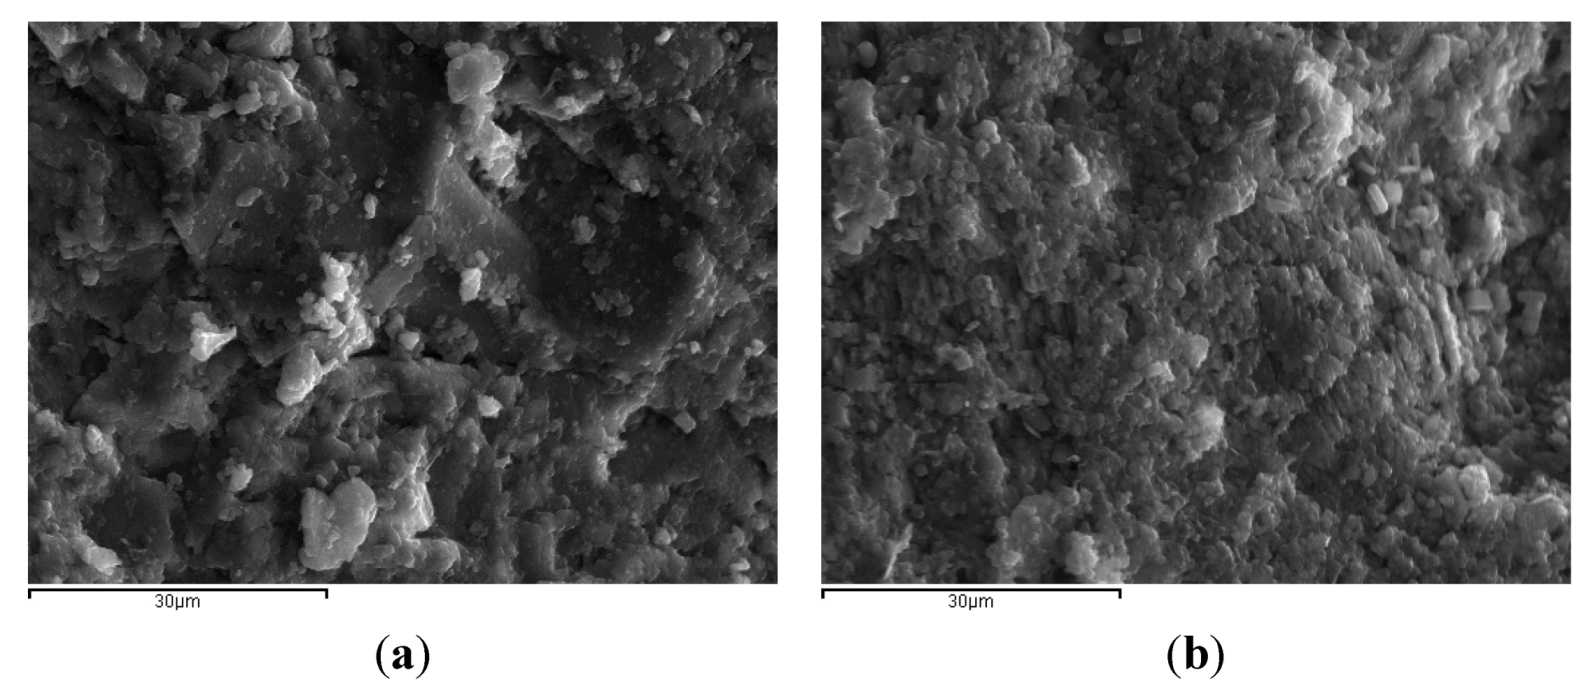
SEM analysis performed on the samples indicates small differences in the structure of the untreated sample and the sample treated with the neat hydrophobic material. Large angular crystals of feldspars prevail in the structure of the sandstone while the coating of hydrophobic material uniformly covers the surfaces, making the crystals look smaller and restricting the pores between them (
Figure 2).
Figure 1.
(a) D1 untreated; (b) D2 polymeric no nanosilica; (c) D3 1 w/w % nanosilica; (d) D4 1.5 w/w % nanosilica; (e) D5 2 w/w %nanosilica; (f) D6 2.5 w/w % nanosilica.
Figure 1.
(a) D1 untreated; (b) D2 polymeric no nanosilica; (c) D3 1 w/w % nanosilica; (d) D4 1.5 w/w % nanosilica; (e) D5 2 w/w %nanosilica; (f) D6 2.5 w/w % nanosilica.
Figure 2.
(a) Untreated sample and (b) sample treated with hydrophobic layer.
Figure 2.
(a) Untreated sample and (b) sample treated with hydrophobic layer.
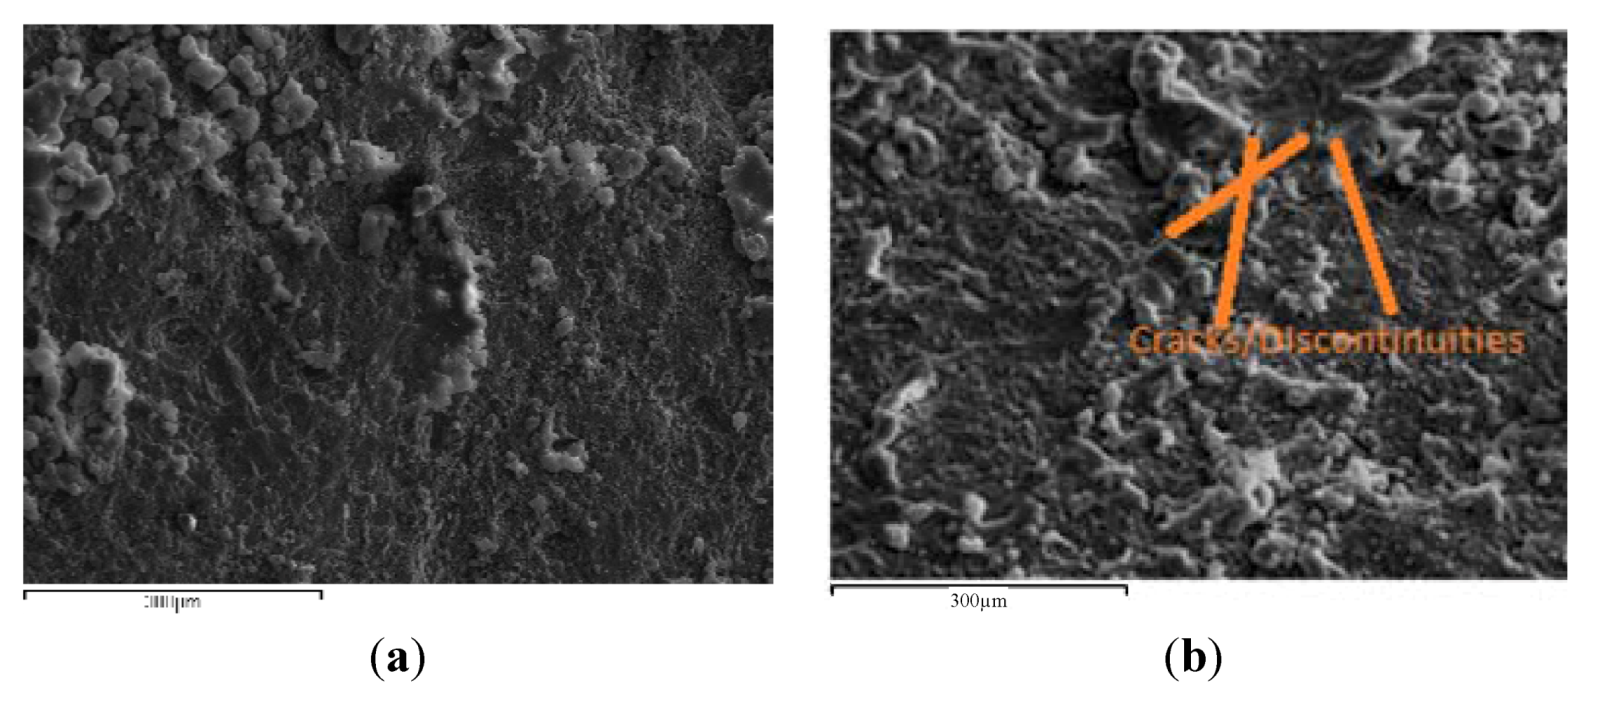
In samples treated with coatings containing nanosilica, a layer was observed, causing the smoothening of the surface because the natural crystallic relief is covered by the thin hybrid membrane. In the case of the D4 sample (
Figure 3a), this layer was almost uniform and continuous, fully covering the mineral inorganic substratum. In the case of the D6 sample, the higher the nanosilica consistency the more the possibilities of agglomeration, and therefore intense agglomeration “island” and cracks/discontinue-ties in some places of the layer were observed (
Figure 3b).
Figure 3.
(a) Surface of D4 sample and (b) surface of D6 sample under SEM.
Figure 3.
(a) Surface of D4 sample and (b) surface of D6 sample under SEM.
3.2. Water Absorption
The water absorption test was performed under vacuum, according to RILEM CPC11.3 and
Table 4 contains the results while
Figure 4 gives the relation between the absorption and the porosity. The method of liquid (usually distilled water) absorption in order to measure open porosity is quick, cost effective, and reliable, since it is easily repeatable [
22]. During the procedure of this method, the pore shape does not present any alterations and it is considered trustful when permeability estimation is required. It is based on the concept that the sample weight is due to its absolute mass. Firstly the samples should be dried, and air present should be removed through suction. By filling the pores with a liquid medium of known density at normal temperature, open porosity can be calculated from the weight change. The assumption of this method is that only connected pores open to the surface of the sample can be measured, and only pores (not solid parts) are filled with the liquid. Samples should be under vacuum in order to extract air and allow liquid to penetrate deeper or into smaller pores.
Table 4.
Water absorption test results.
Table 4.
Water absorption test results.
| Samples | Absorption (%) | Specific gravity (g/cm3) | Open porosity (%) | Porosity Index |
|---|
| D1 | 1.072 | 2.636 | 2.827 | - |
| D2 | 0.469 | 2.692 | 1.198 | –0.576 |
| D3 | 0.365 | 2.541 | 0.913 | –0.677 |
| D4 | 0.195 | 2.497 | 0.488 | –0.827 |
| D5 | 0.295 | 2.592 | 0.764 | –0.730 |
| D6 | 0.289 | 2.542 | 0.734 | –0.740 |
Figure 4.
Absorption and porosity data.
Figure 4.
Absorption and porosity data.
From the results we derived that the addition of nanoparticles reduced the water absorption but the lower porosity and water absorption was successful in sample D4 with 1.5% nanoparticles.
3.3. Mercury Porosimetry
Mercury Intrusion Porosimetry according to ASTM D 4404-84 [
23] provides a wide range of pore sizes and properties such as open porosity, mean pore diameter, and bulk density. This technique is the most common one used by researchers in different building materials [
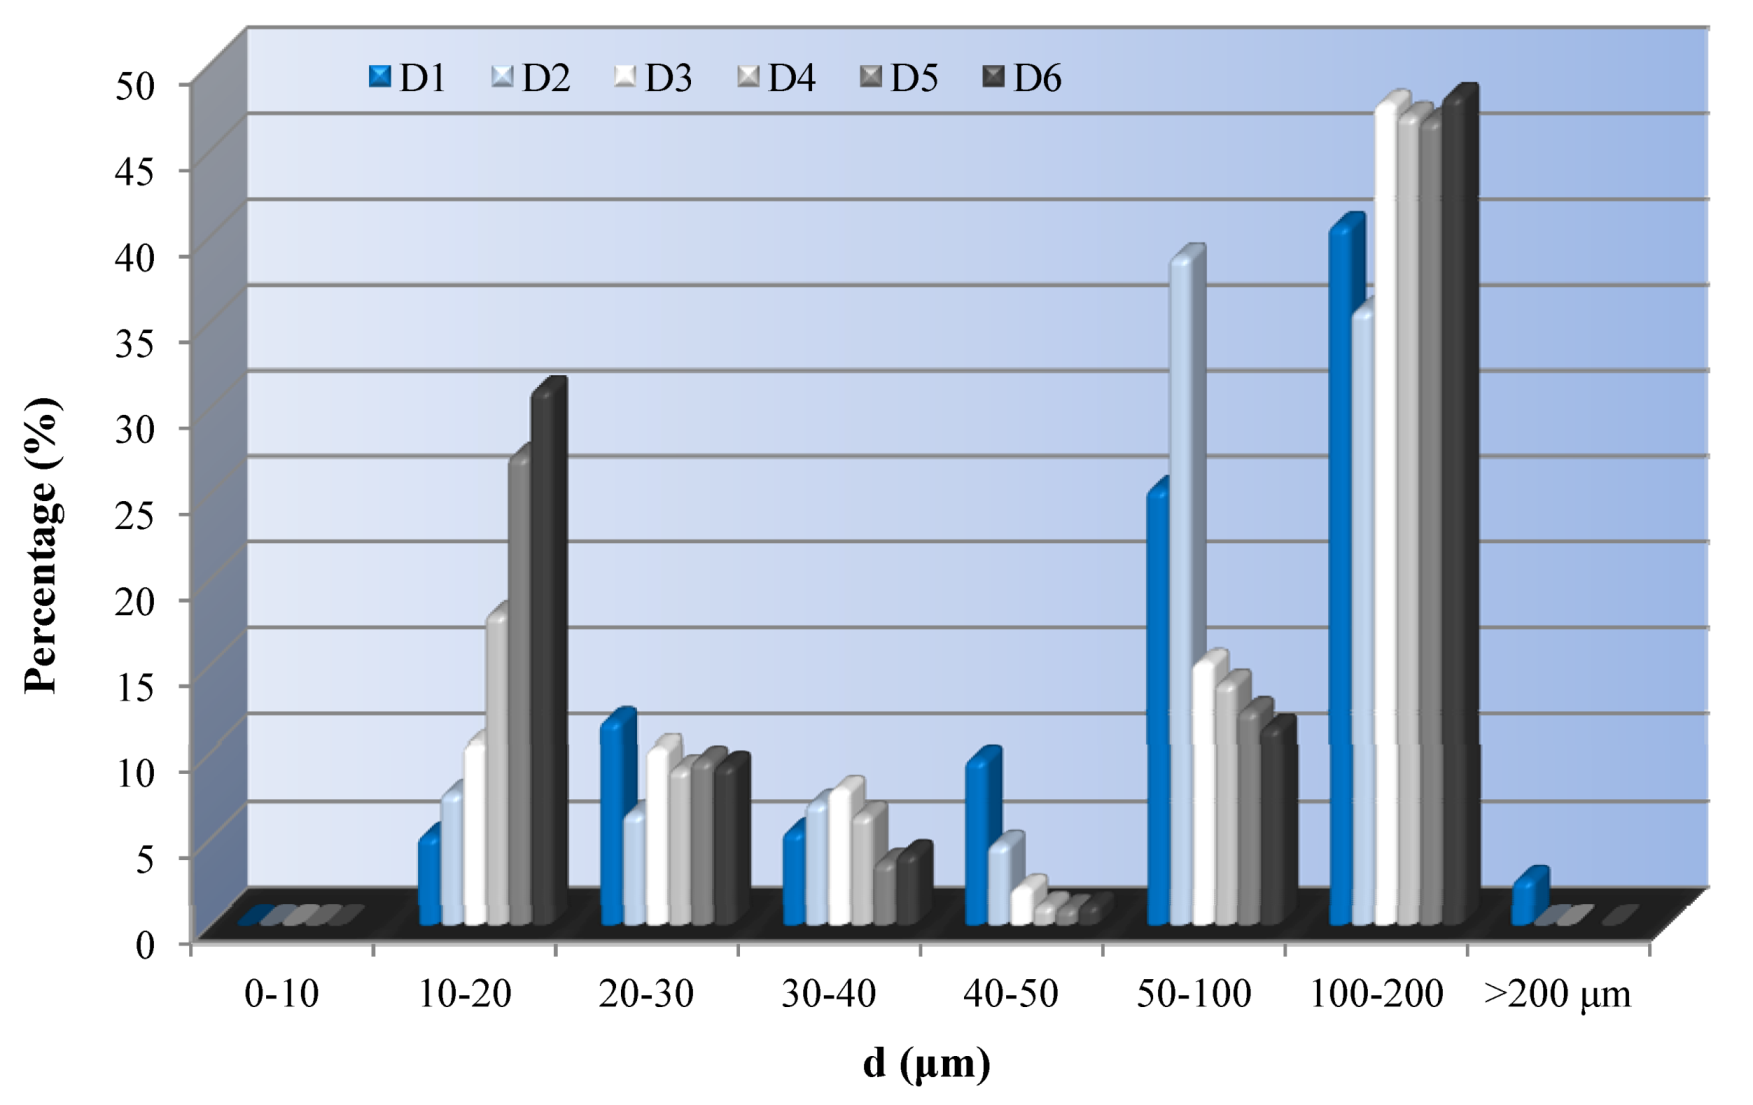
24] and has been proved sensitive for comparisons. The pore-size distribution is determined from the volume of mercury intruded at each pressure increment, while the total porosity is based on the total intruded volume. In this case, the untreated Demati sandstone presents a range of pore sizes from 10 μm to 200 μm. All treated samples do not present large pores (>200 μm). Small pores in the area of of <20 μm, samples treated with solution containing 2% nanoparticles (D5) present large amount of pores, while D2 and D4 samples have similar distribution to the untreated stone (
Figure 5).
Figure 5.
Pore size distribution by mercury porosimetry.
Figure 5.
Pore size distribution by mercury porosimetry.
3.5. Freeze-Thaw Test Results
Additionally to air freeze-thaw cycle tests, samples have been subjected to salt fog cycle tests. Because salt fog reaction is essential to weathering mechanisms, such as salt crystallization-deposition onto rock surfaces, or salt solution penetration into rock-pores causing expansion of existing voids in the rock geometry or secondary minerals genesis [
25,
26]. Thus two series of samples were weighted and put in a climatic chamber in order to subject them to freeze-thaw tests. One was left in air and the other was immersed in a solution of 10% NaCl. In total 260 cycles were performed according to EN12371:2001 [
27] from −18 °C to 20 °C. After the end of the program all samples were visually inspected and the loose material of each sample was weighted again. The weight loss data is given in
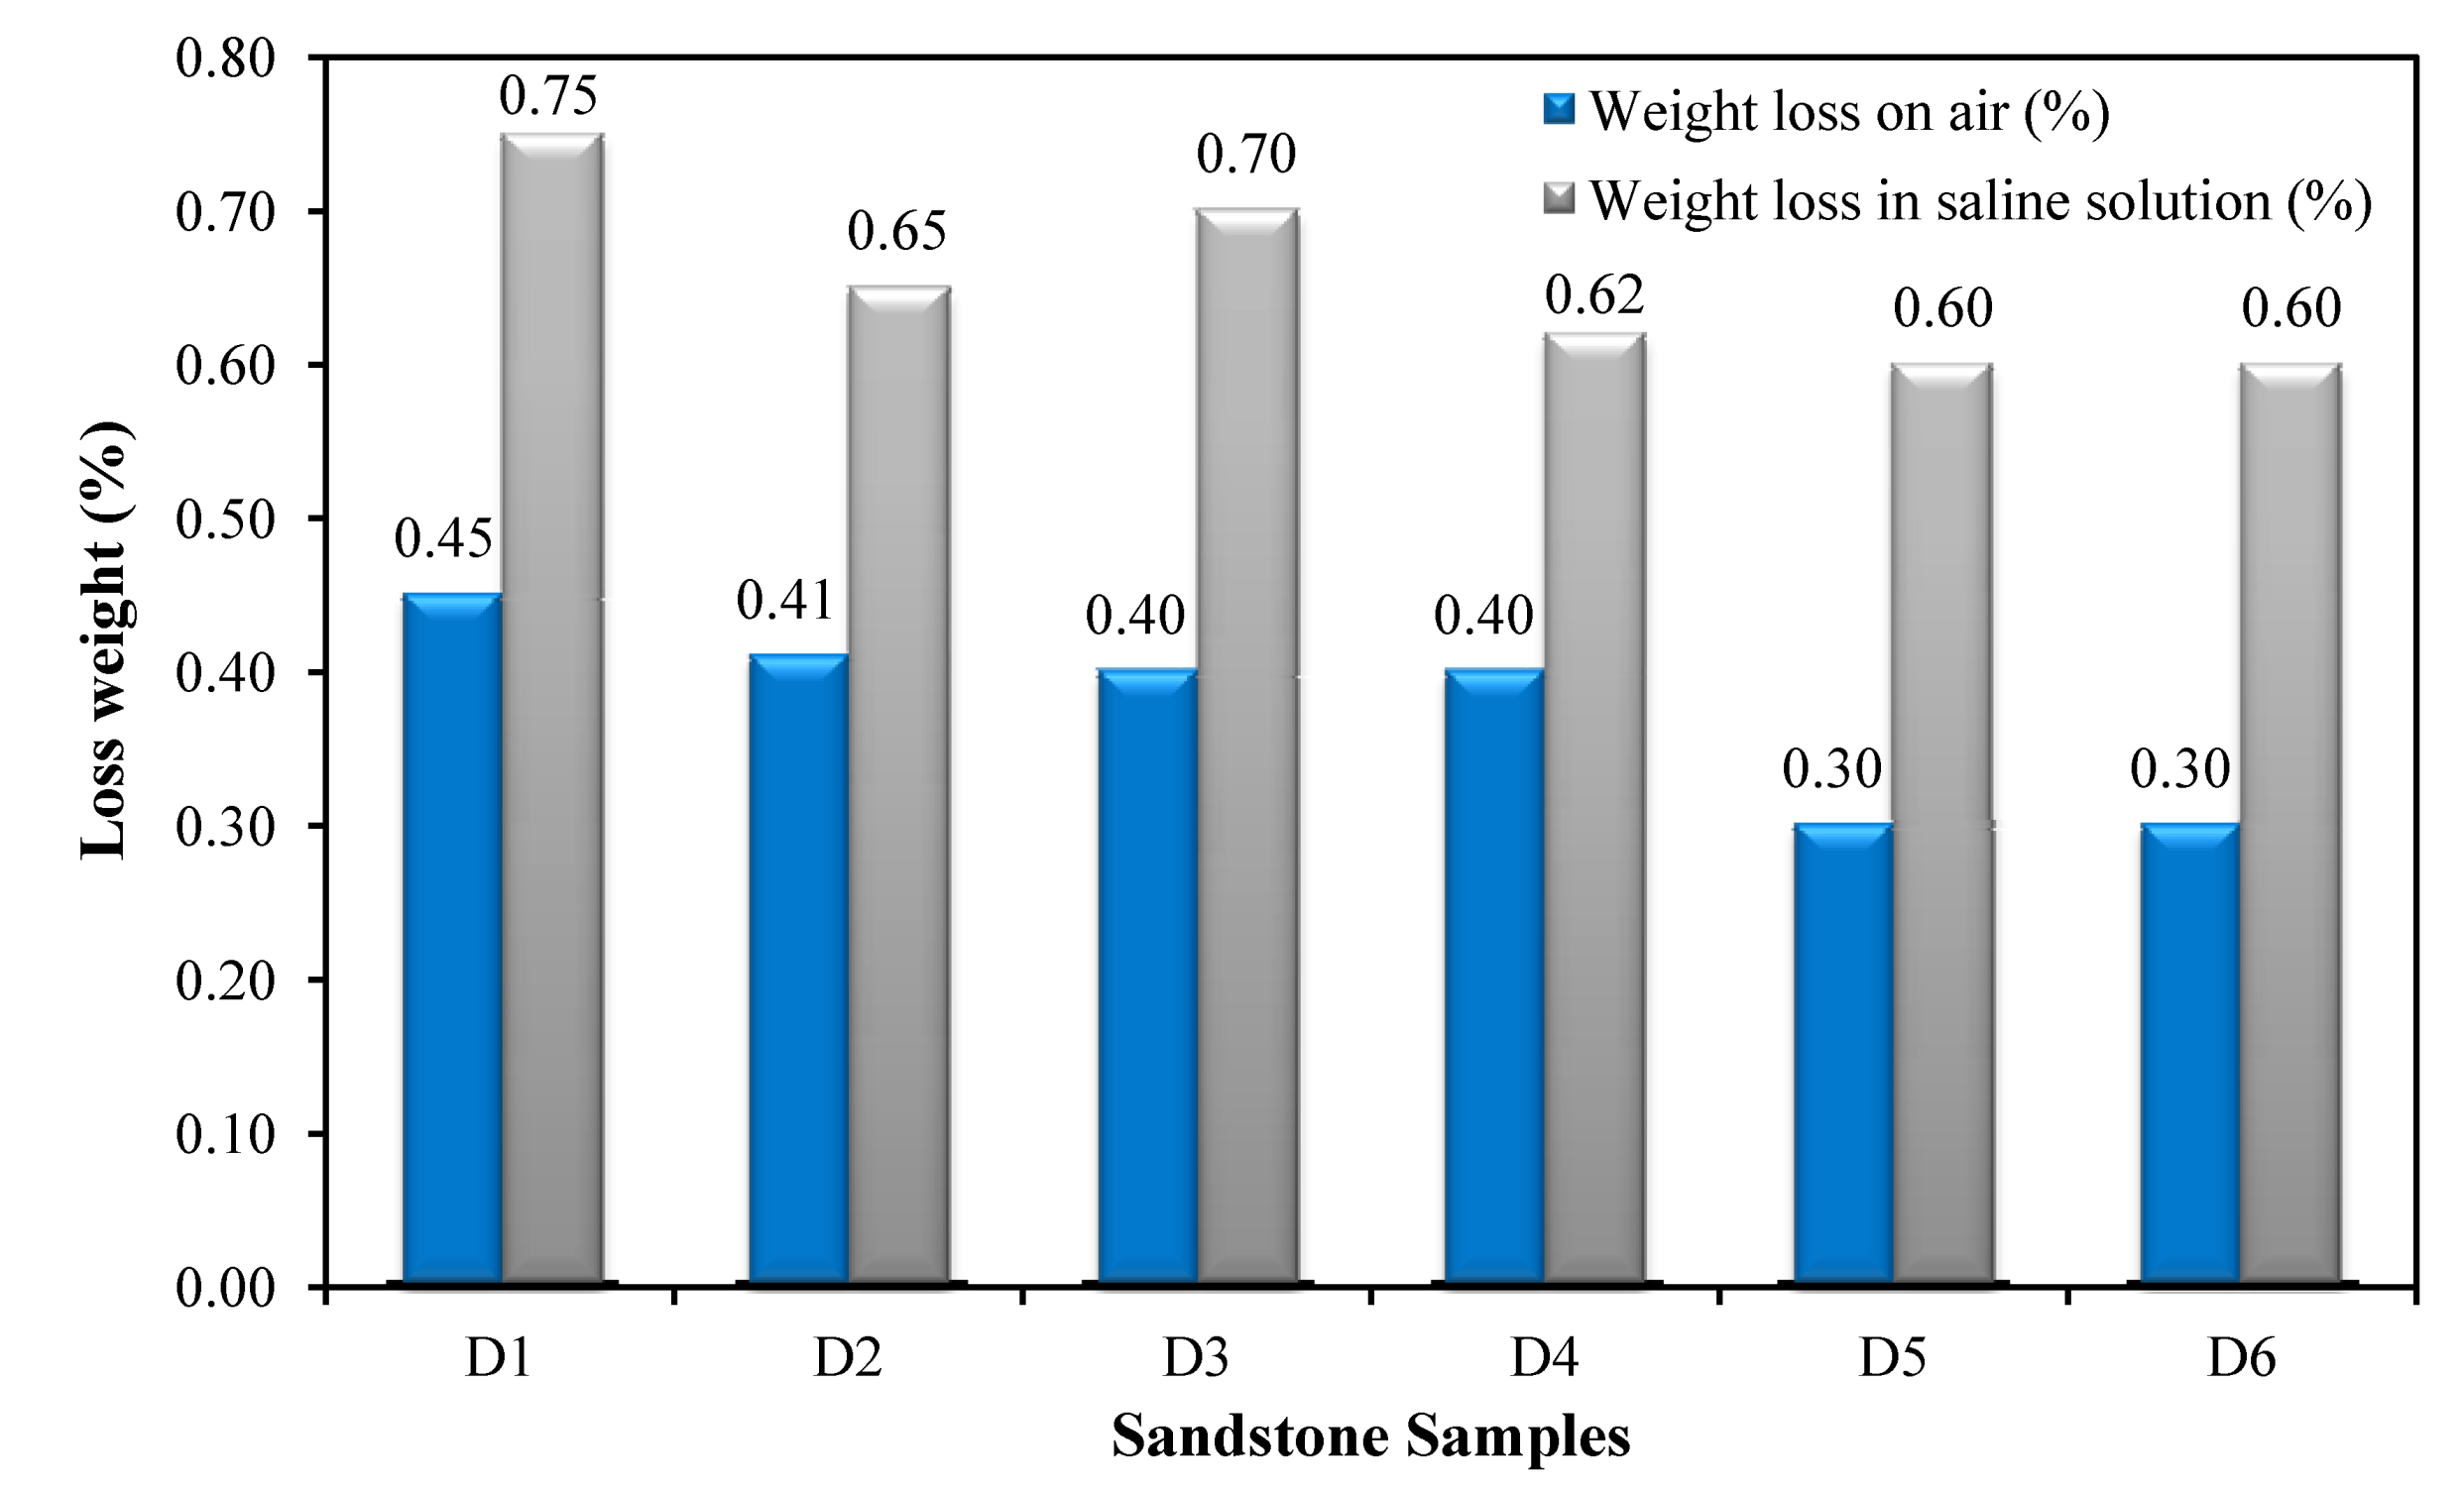
Table 6. All samples lost approximately 0.30–0.45 w/w % of their mass, while were exposed in freeze-thaw cycles in air (
Figure 8). Notable, is that minimum loss was observed in samples D5 and D6. The loss of mass was more intense in samples exposed to the saline solution of salt fog. There was an observed loss of approximately 0.60–0.75 w/w % of original weight and samples D5 and D6 were again the most durable.
Table 6.
Weight loss after the freeze-thaw cycle testing per w/w %.
Table 6.
Weight loss after the freeze-thaw cycle testing per w/w %.
| Sample | Weight loss on air (%) | Weight loss in saline solution (%) |
|---|
| D1 | 0.45 | 0.75 |
| D2 | 0.41 | 0.65 |
| D3 | 0.40 | 0.70 |
| D4 | 0.40 | 0.62 |
| D5 | 0.30 | 0.60 |
| D6 | 0.30 | 0.60 |
Figure 8.
Freeze-thaw cycles weight loss comparison.
Figure 8.
Freeze-thaw cycles weight loss comparison.
3.6. Acoustic Microscopy
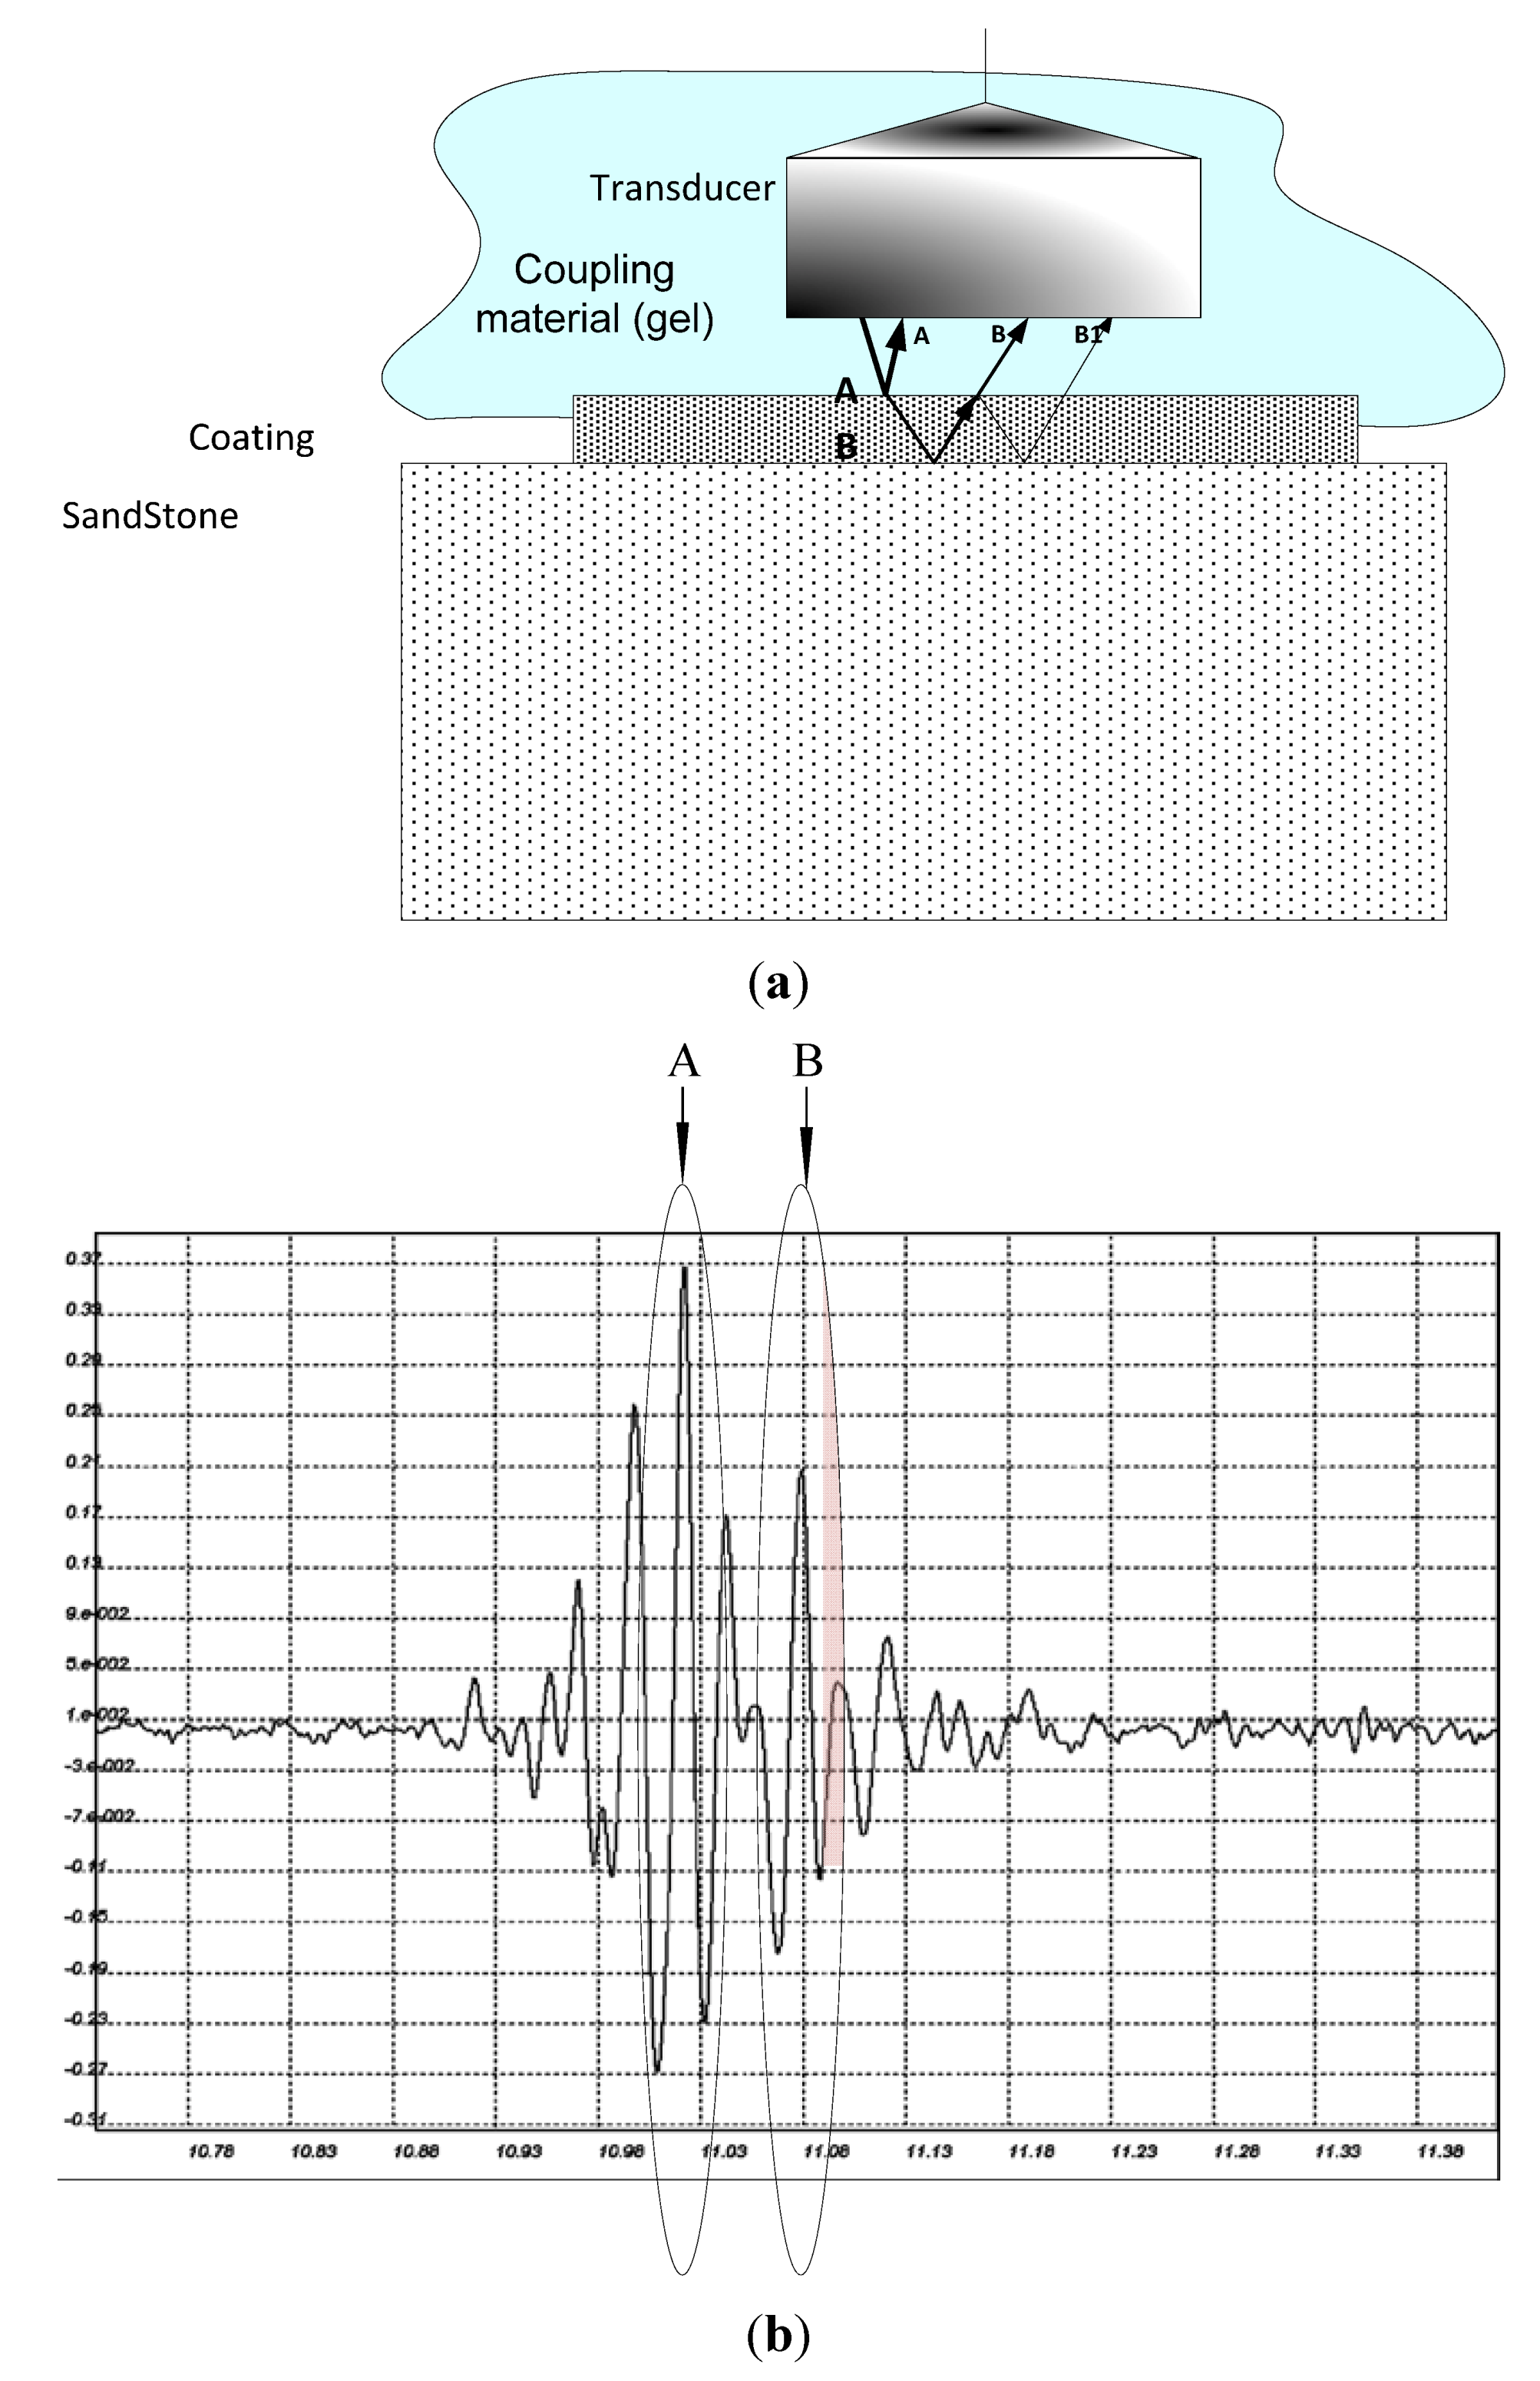
The ultrasonic waves are emitted from the transducer into the coated thin film through the used coupling gel material. The ultrasound propagates from the transducer to the thin film and consecutively to the various layers of the sandstone. Echoes are generated by the various interfaces between the different kinds of materials. The echoes are received by the transducer at different time instances, which are proportional to the distance of the interfaces from the transducer [
28,
29,
30]. The signal that contains the echoes consists the a-scan signal. From the Time of Flight (TOF) of two successive echoes, generated by the surface of the thin film (A) and the interface between the thin film and the sandstone material (B) (in
Figure 9), the thickness can be calculated. This is a real time measurement, lasting a few seconds in the case that a set of measurements is acquired in a region of interest of the sandstone.
Figure 9.
Pulse echo technique used for the thickness measurement of the thin film penetration. (a) Representation of the measurement; In (b) A stands for the echo of the thin film and B stands for the echo of the sandstone.
Figure 9.
Pulse echo technique used for the thickness measurement of the thin film penetration. (a) Representation of the measurement; In (b) A stands for the echo of the thin film and B stands for the echo of the sandstone.
The value of the propagation speed of the ultrasounds in the thin film material is required in order to determine the thickness of the thin film applied on the sandstone. For this reason, a reference layer of the thin film was created over a glass layer. The thickness of this reference film was 39 μm, measured using the Mitutoyo thickness micrometer with an accuracy of 1 μm and uncertainty 3.25 μm, traceable and certified according to the ISO 17025 standard. Then, ten measurements of the ultrasonic waves’ propagation time (time of flight—TOF) of this reference film were taken. The acoustic speed of the material is calculated as follows:
where
s is the thickness and
t corresponds to the time of flight (TOF) in the material. Using Equation (1), the acoustic speed of the thin film was calculated equal to
c = 1609.89 m/s.
In order to evaluate the effectiveness of acoustic microscopy-based methodology in the estimation of the thin film thickness, five cases were measured, and for each thin film, ten measurements at different places were monitored. In each sandstone sample a gel layer is applied as a conductive layer between the transducer and the film surface. Each measurement is real time and thus very fast. In order to take measurements from different places we have only to move the transducer at these positions. The results are accumulated in
Table 7. It seems that a layer of almost 30 μm thickness was achieved when the hydrophobic solution was applied on the stone surface, while a finer layer was achieved when nanoparticles were added. The thickness varied from 16.5 μm to 18.6 μm. The large uncertainty presented in measurements of the D6 sample is justified through the SEM observation of a cracked and not uniform layer.
Table 7.
Measurement of the thin film thickness of the coatings, standard deviation and the mean value, based on the acoustic speed measured.
Table 7.
Measurement of the thin film thickness of the coatings, standard deviation and the mean value, based on the acoustic speed measured.
| Sample | Standard Deviation | Calculated Value (μm)* | Uncertainty |
|---|
| D2 | 2.9796 | 30.4848 | 5.936 |
| D3 | 1.3459 | 17.1208 | 3.526 |
| D4 | 1.2322 | 18.5532 | 1.623 |
| D5 | 0.7833 | 18.6401 | 2.771 |
| D6 | 3.2555 | 16.5589 | 8.556 |
4. Results and Conclusions
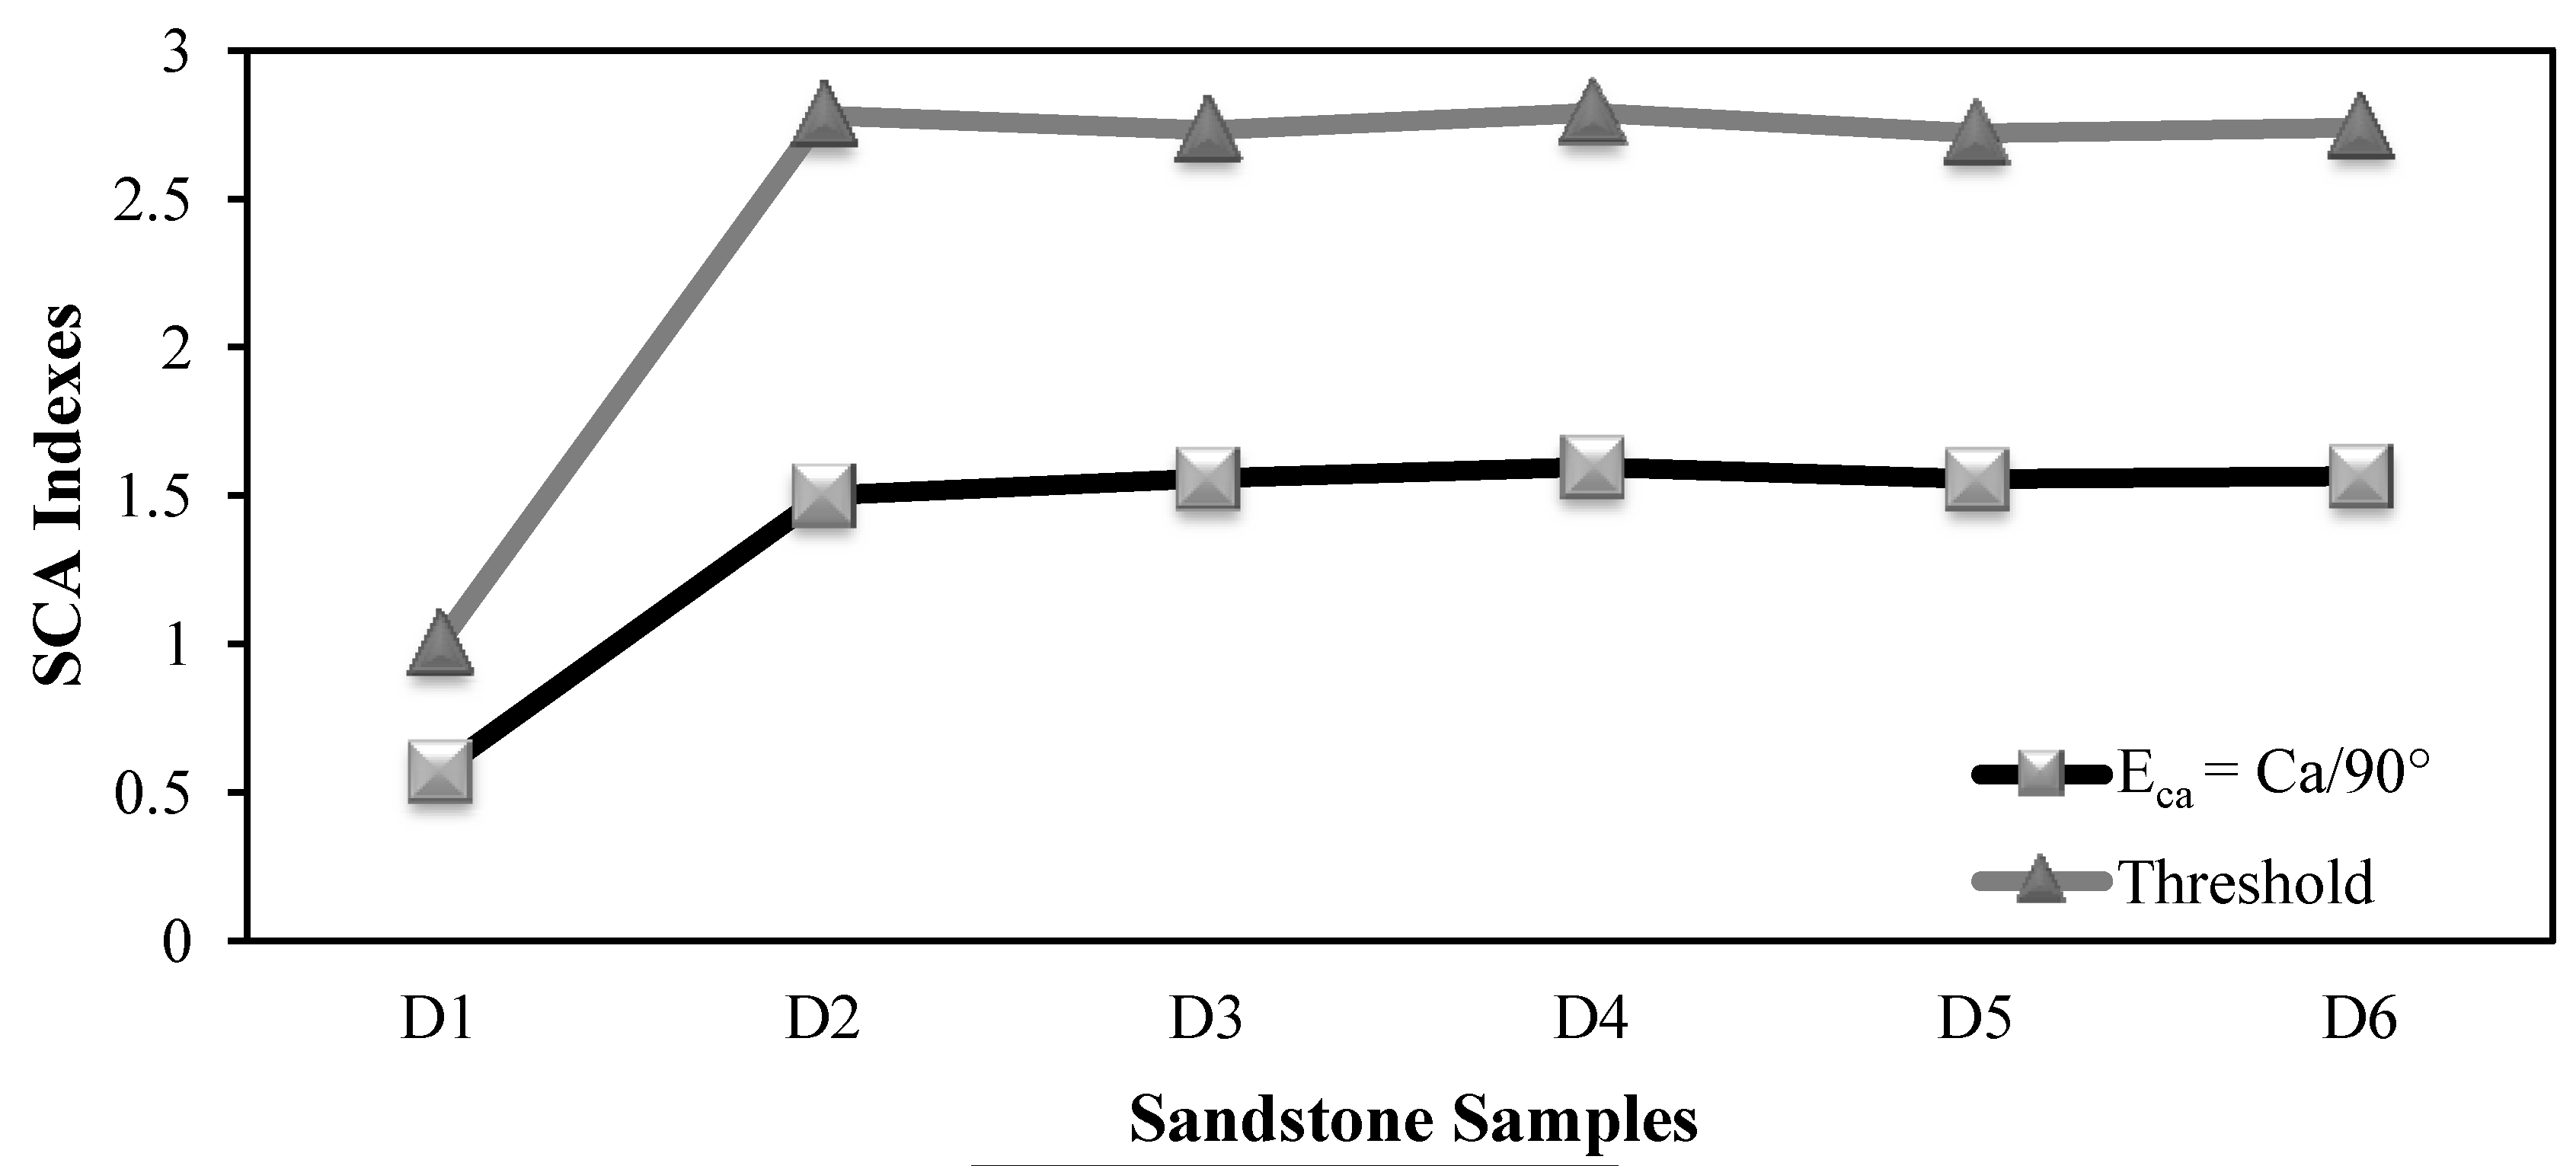
Samples from Demati sandstone were impregnated in a polymeric silicon solution enriched with nanosilica in different concentrations. The degree of the hydrophobicity succeeded was tested either through indirect ways, such as porosity and absorption tests, and also through direct measurements like water contact angle tests. From these tests it is derived that the treated samples present restricted water absorption and increased hydrophobicity as the static contact angle was >140° in many cases (in samples D3, D4, D5 and D6). The surface hydrophobicity of the sandstone has been almost tripled, ranging the static contact angle from 51.43° for the untreated sample D1 to the maximum value of 143.73° responding to sample D4 (1.5% nanosilica), indicating a super-hydrophobic character.
The sample treated with solution with 1.5% nanosilica present high solution absorption and the application of the layer was smooth and uniform. This can be attributed to the compatibility of the solution concentration with the porosity and the roughness of the substratum.
The thickness of the nano-modified coatings was recorded by the acoustic microscopy technique and it was 16.5–18.6 μm.
The microstructure analysis of the treated surfaces reveals the uniform and smooth application of the solutions with 1% and 1.5% nanosilica while a white layer of silica composition was formed on the stone surface in solutions rich in silica content (more than 2%). The surface in these last cases was cracked and agglomeration phenomena took place. As a final and crucial point, freeze-thaw tests in air and saline solution environments present remarkable durability with lowest comparable material loss. This study proves the increased protection of the polymeric solutions modified with up to 1.5% nanosilica when applied on strong and dense stone surfaces like the Demati sandstones. In this way the stones used in decorative facades can present increased durability against water-introduced degradation.


