Aquatic Biodiversity in the Amazon: Habitat Specialization and Geographic Isolation Promote Species Richness

Abstract
:Simple Summary
The immense rainforest ecosystems of tropical America represent some of the greatest concentrations of biodiversity on the planet. Prominent among these are evolutionary radiations of freshwater fishes, including electric eels, piranhas, stingrays, and a myriad of small-bodied and colorful tetras, cichlids, and armored catfishes. In all, the many thousands of these forms account for nearly 10% of all the vertebrate species on Earth. This article explores the complimentary roles that ecological and geographic filters play in limiting dispersal in aquatic species, and how these factors contribute to the accumulation of species richness over broad geographic and evolutionary time scales.
Abstract
The Neotropical freshwater ichthyofauna has among the highest species richness and density of any vertebrate fauna on Earth, with more than 5,600 species compressed into less than 12% of the world's land surface area, and less than 0.002% of the world's total liquid water supply. How have so many species come to co-exist in such a small amount of total habitat space? Here we report results of an aquatic faunal survey of the Fitzcarrald region in southeastern Peru, an area of low-elevation upland (200–500 m above sea level) rainforest in the Western Amazon, that straddles the headwaters of four large Amazonian tributaries; the Juruá (Yurúa), Ucayali, Purús, and Madre de Dios rivers. All measures of fish species diversity in this region are high; there is high alpha diversity with many species coexisting in the same locality, high beta diversity with high turnover between habitats, and high gamma diversity with high turnover between adjacent tributary basins. Current data show little species endemism, and no known examples of sympatric sister species, within the Fitzcarrald region, suggesting a lack of localized or recent adaptive divergences. These results support the hypothesis that the fish species of the Fitzcarrald region are relatively ancient, predating the Late Miocene-Pliocene (c. 4 Ma) uplift that isolated its several headwater basins. The results also suggest that habitat specialization (phylogenetic niche conservatism) and geographic isolation (dispersal limitation) have contributed to the maintenance of high species richness in this region of the Amazon Basin.
1. Introduction
Tropical America encompasses one of the greatest concentrations of organic diversity on Earth. In many groups of plants and animals species richness reaches a global zenith in the humid Neotropics [1,2]. The diversity of fishes in this region is especially impressive, with more than 5,600 species representing a majority of the world's freshwater fishes, and perhaps 10% of all known vertebrate species [3-5]. What is even more remarkable—and as yet unexplained—is how so many distinct evolutionary lineages of fishes can coexist in less than 0.002% of the Earth's total liquid water supply.
How did so much biodiversity accumulate in such a small amount of total habitat space? Or to paraphrase Hutchinson [6]: Why are there so many kinds of Amazonian fishes? Hutchinson sought explanations for species richness at the community level in terms of ecological mechanisms, hypothesizing for example that species-rich ecosystems with longer food chains and more niches are more stable, with a greater likelihood of persisting through time. Over the past half century many ecologists have followed Hutchinson [7] in the belief that species coexistence is enhanced by adaptive specialization, such that each species occupies a unique ecological niche or functional role within the ecosystem [8,9]. Under this view, species richness arises from the action of natural selection to reduce competition [10,11].
An alternative view focuses on the role of geographic space in the formation of local and regional species pools [12,13]. The central idea is that richness (numbers of species) and taxonomic composition of assemblages at local and regional scales are hierarchically interrelated [14,15]. This is because the species that inhabit local assemblages are recruited from the regional pool, and the regional pool is itself the sum of all the local assemblages [16-19]. This geographic view is consistent with the macroevolutionary perspective that net rates of diversification within a geographic region are a balance of differential rates of speciation, extinction and dispersal [20-23]. Indeed, the fish species composition of a given locality in lowland Amazonia is generally influenced by all three of these processes [24].
Most ecological studies on the formation of local species assemblages have focused on sessile organisms, especially plants [13,17,25-29]. Relatively less is known about the contributions of these processes in the formation of animal assemblages. Studies on animals have focused heavily on larval recruitment in marine assemblages [30-36], and environmental gradients and patchiness in terrestrial assemblages [37-43]. Freshwater faunas have also been explored for insights into the processes of community assembly [4,44-49]. Unlike terrestrial or marine environments, most freshwater habitats are spatially discrete at the landscape level, and the geographic range of most freshwater species is tightly linked to the course of modern and ancient river ways and watersheds [24,50-53].
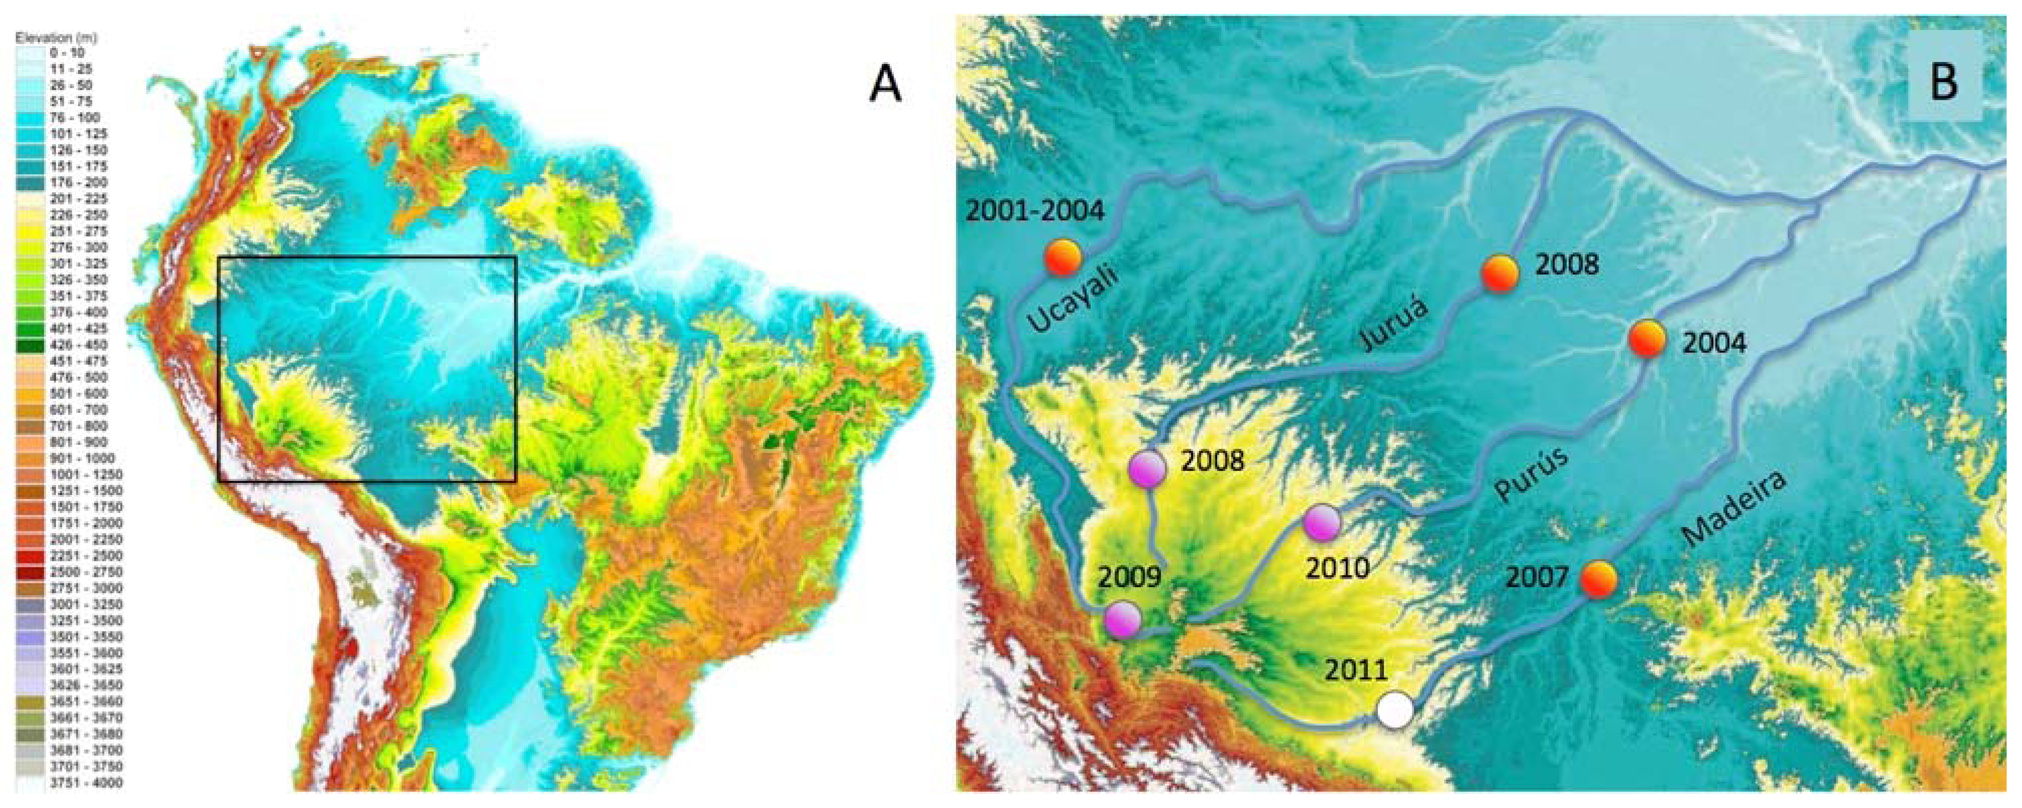
In this paper we report the distributions of freshwater fish species restricted to discrete habitat types and river-courses in the Fitzcarrald Arch region in southwestern Amazonia. The Fitzcarrald region exhibits a unique geographic setting for studying the formation of species-rich aquatic Amazonian assemblages [54]. The region is a broad (∼400,000 km2), relatively low elevation (200–500 m elevation) topographic high, located entirely within the Amazon Basin to the east of the north central Andes (Figure 1). Importantly for the purposes of faunal comparisons, the tributary headwaters that drain the Fitzcarrald region are hydrologically isolated from one another, at least on ecological time scales, and the upstream portions of these basins (above 200 m) exhibit different habitat conditions from downstream portions in the Amazonian lowlands. The Fitzcarrald fish fauna therefore represents an excellent system in which to explore the roles of habitat specialization and geographic isolation in the formation of local species assemblages in diverse tropical aquatic ecosystems.
2. Results and Discussion
2.1. Comparisons between Basins and Habitats
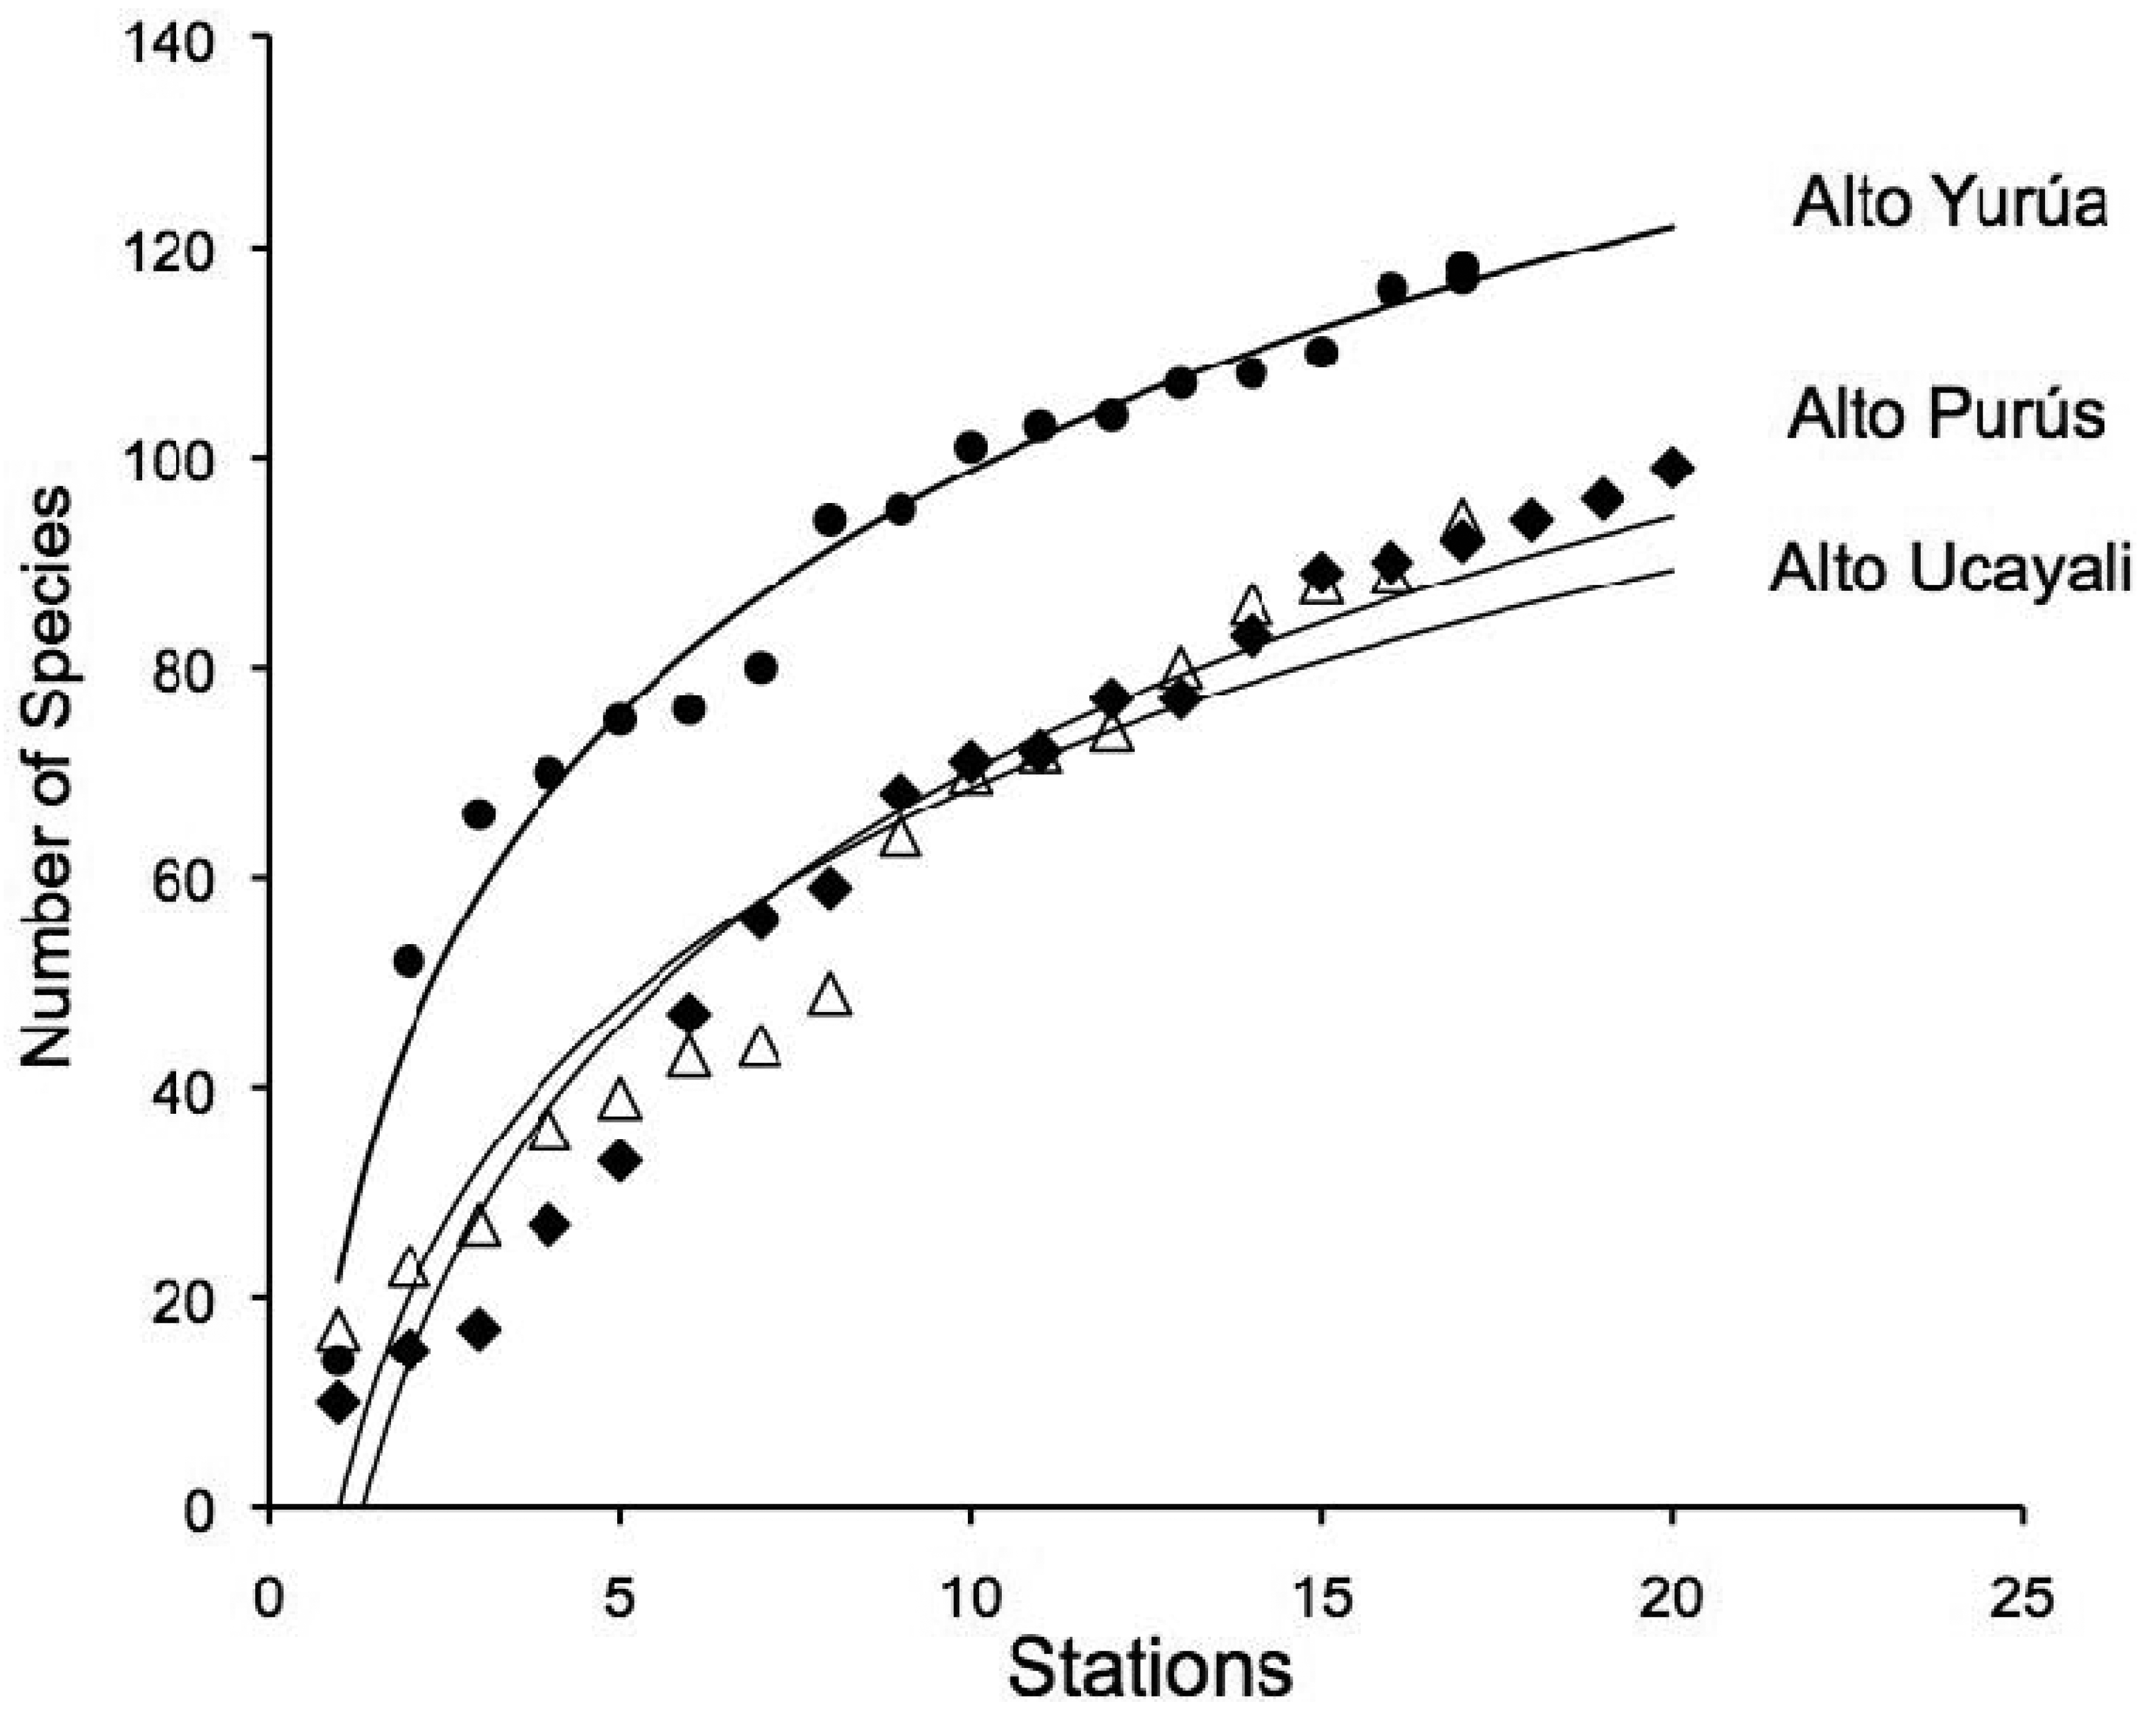
A total of 208 morphospecies were positively identified from materials collected in the Fitzcarrald region (Figure 1, purple circles). Identifications were based on catalogued vouchers with associated color digital images and cross referenced tissue samples (Appendix 1). This represents a 76% increase over the 118 fish species previously documented with vouchers from this region [55-65]. The taxa listed in Appendix 1 represent approximately 4.5% (208 of 4,581) of the freshwater fish species of tropical South America, in an area spanning about 2.6% (400,000 of 15,400,000 km2) the total land surface area occupied by this fauna [5]. Species accumulation curves for each of the three expeditions are reported in Figure 2. These accumulation curves do not approach asymptotic values, and the species richness numbers reported in this study underestimate the actual values for these basins.
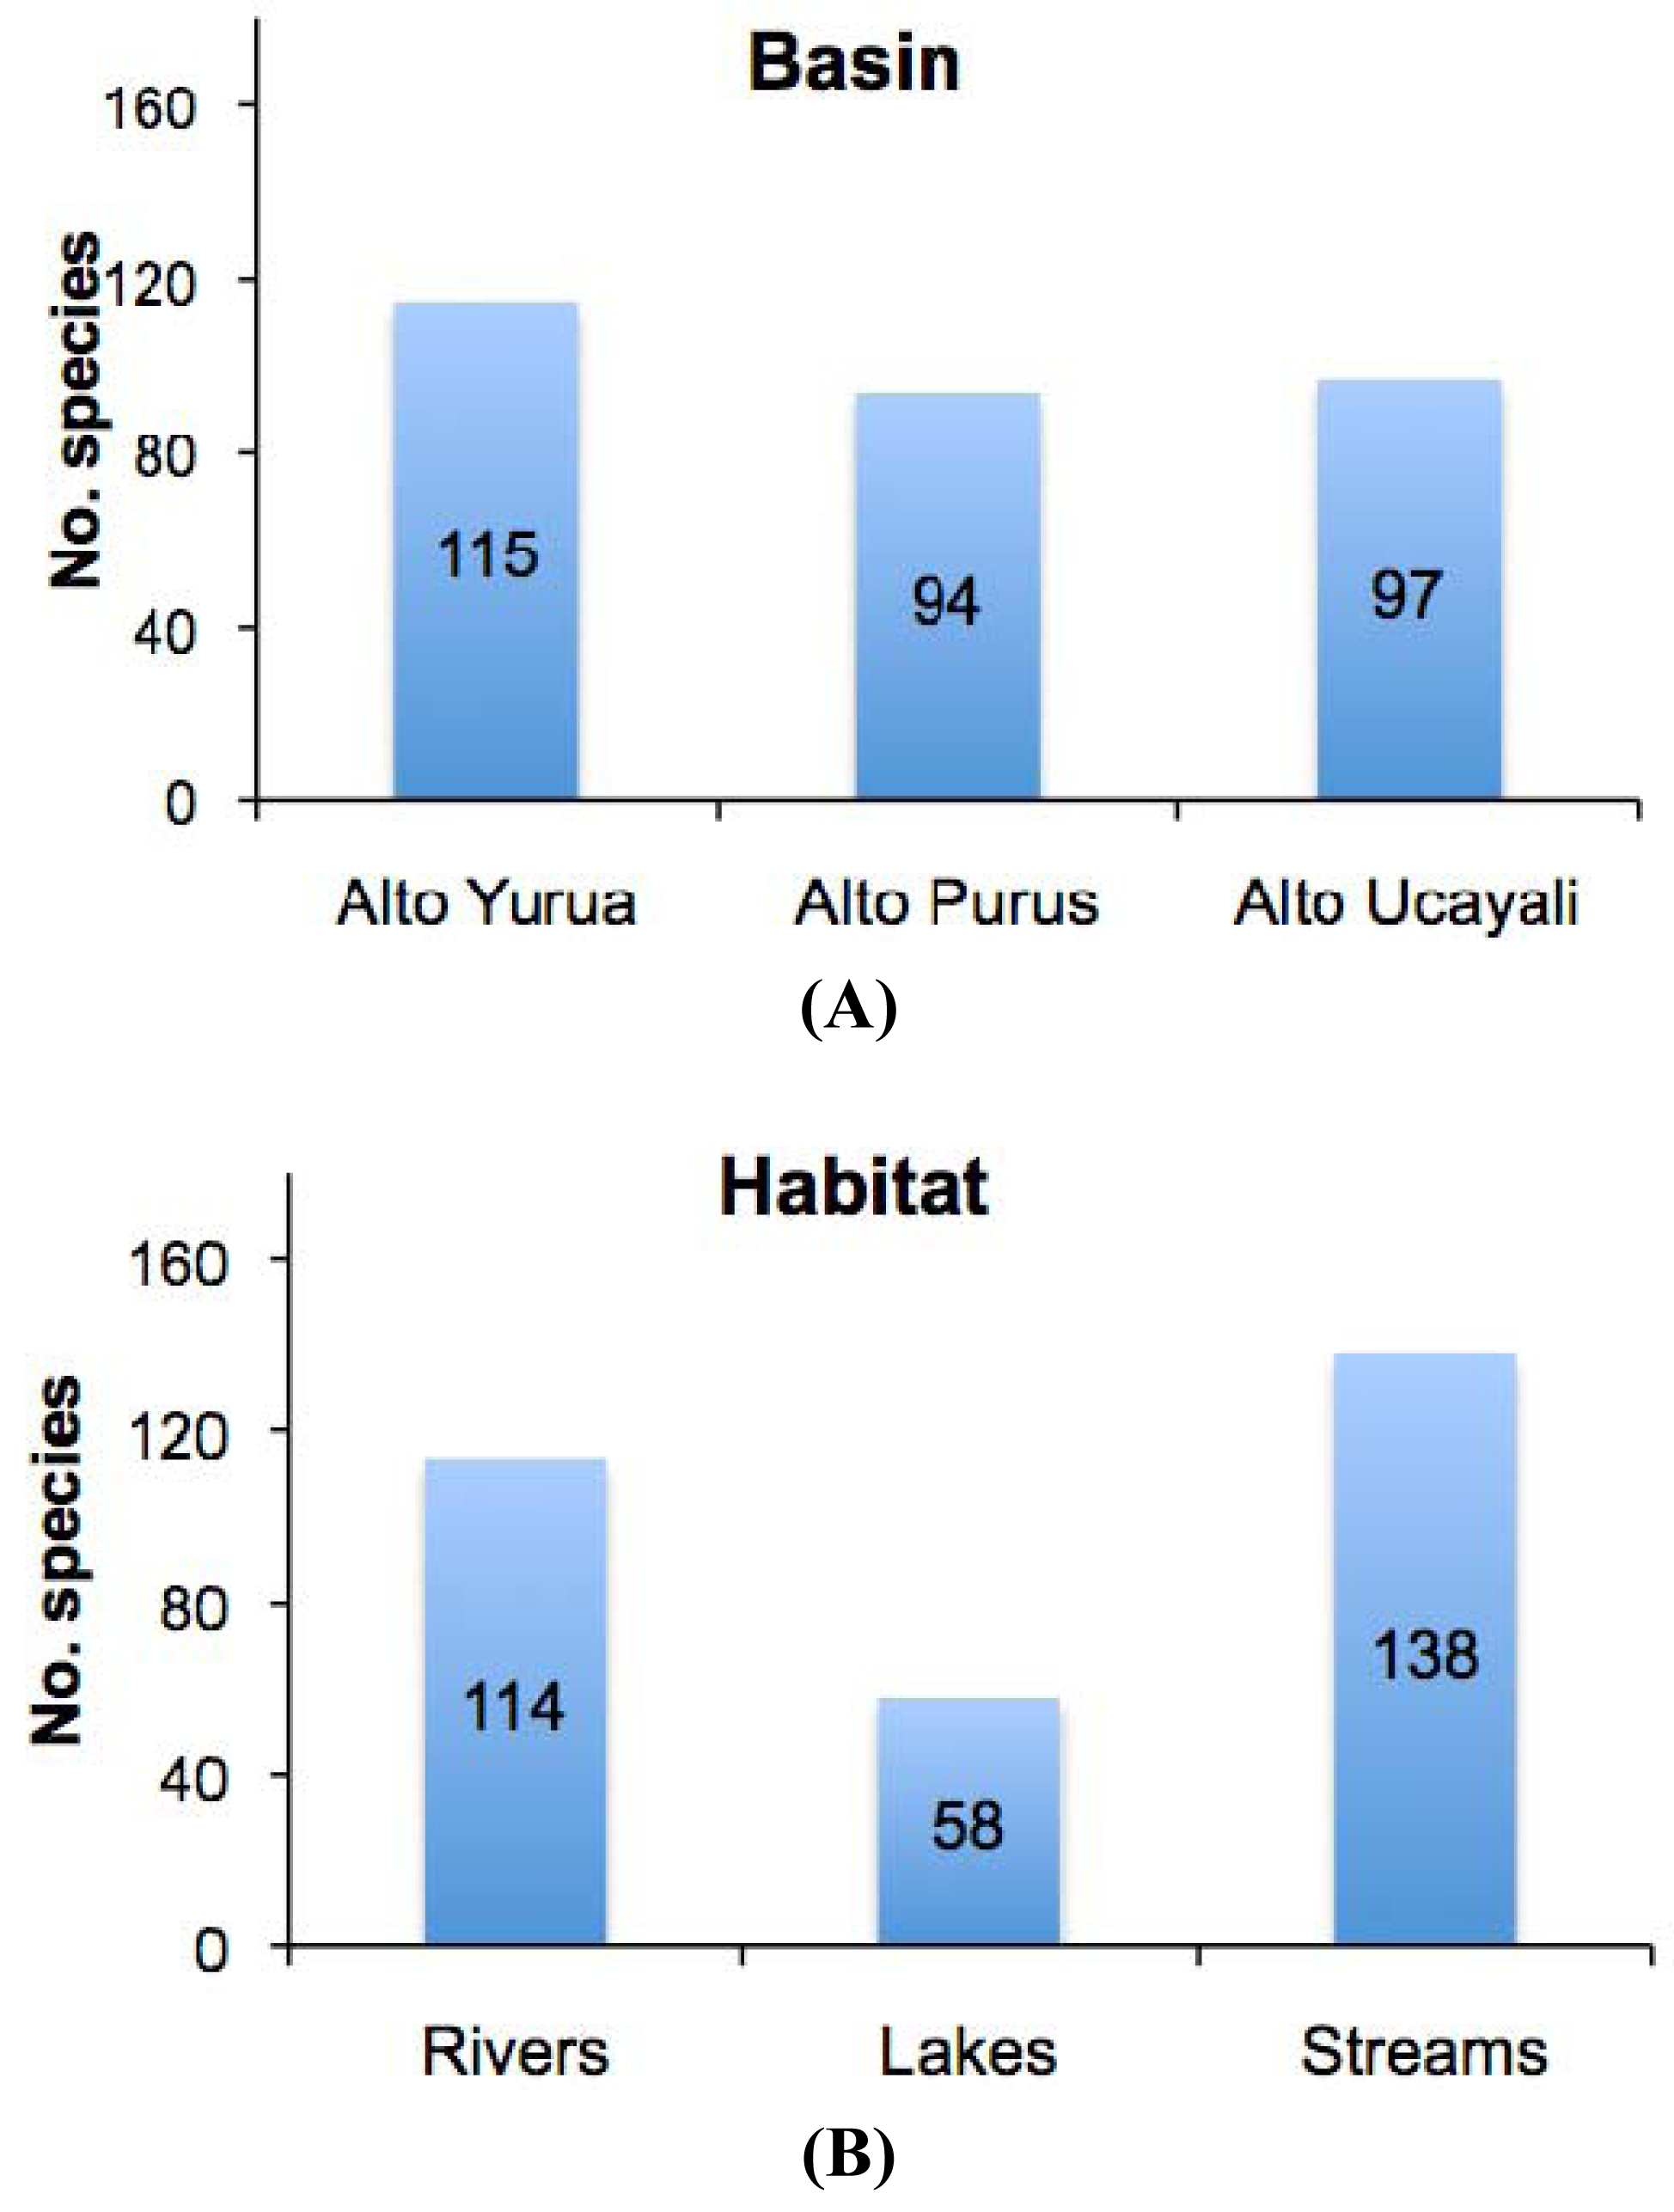
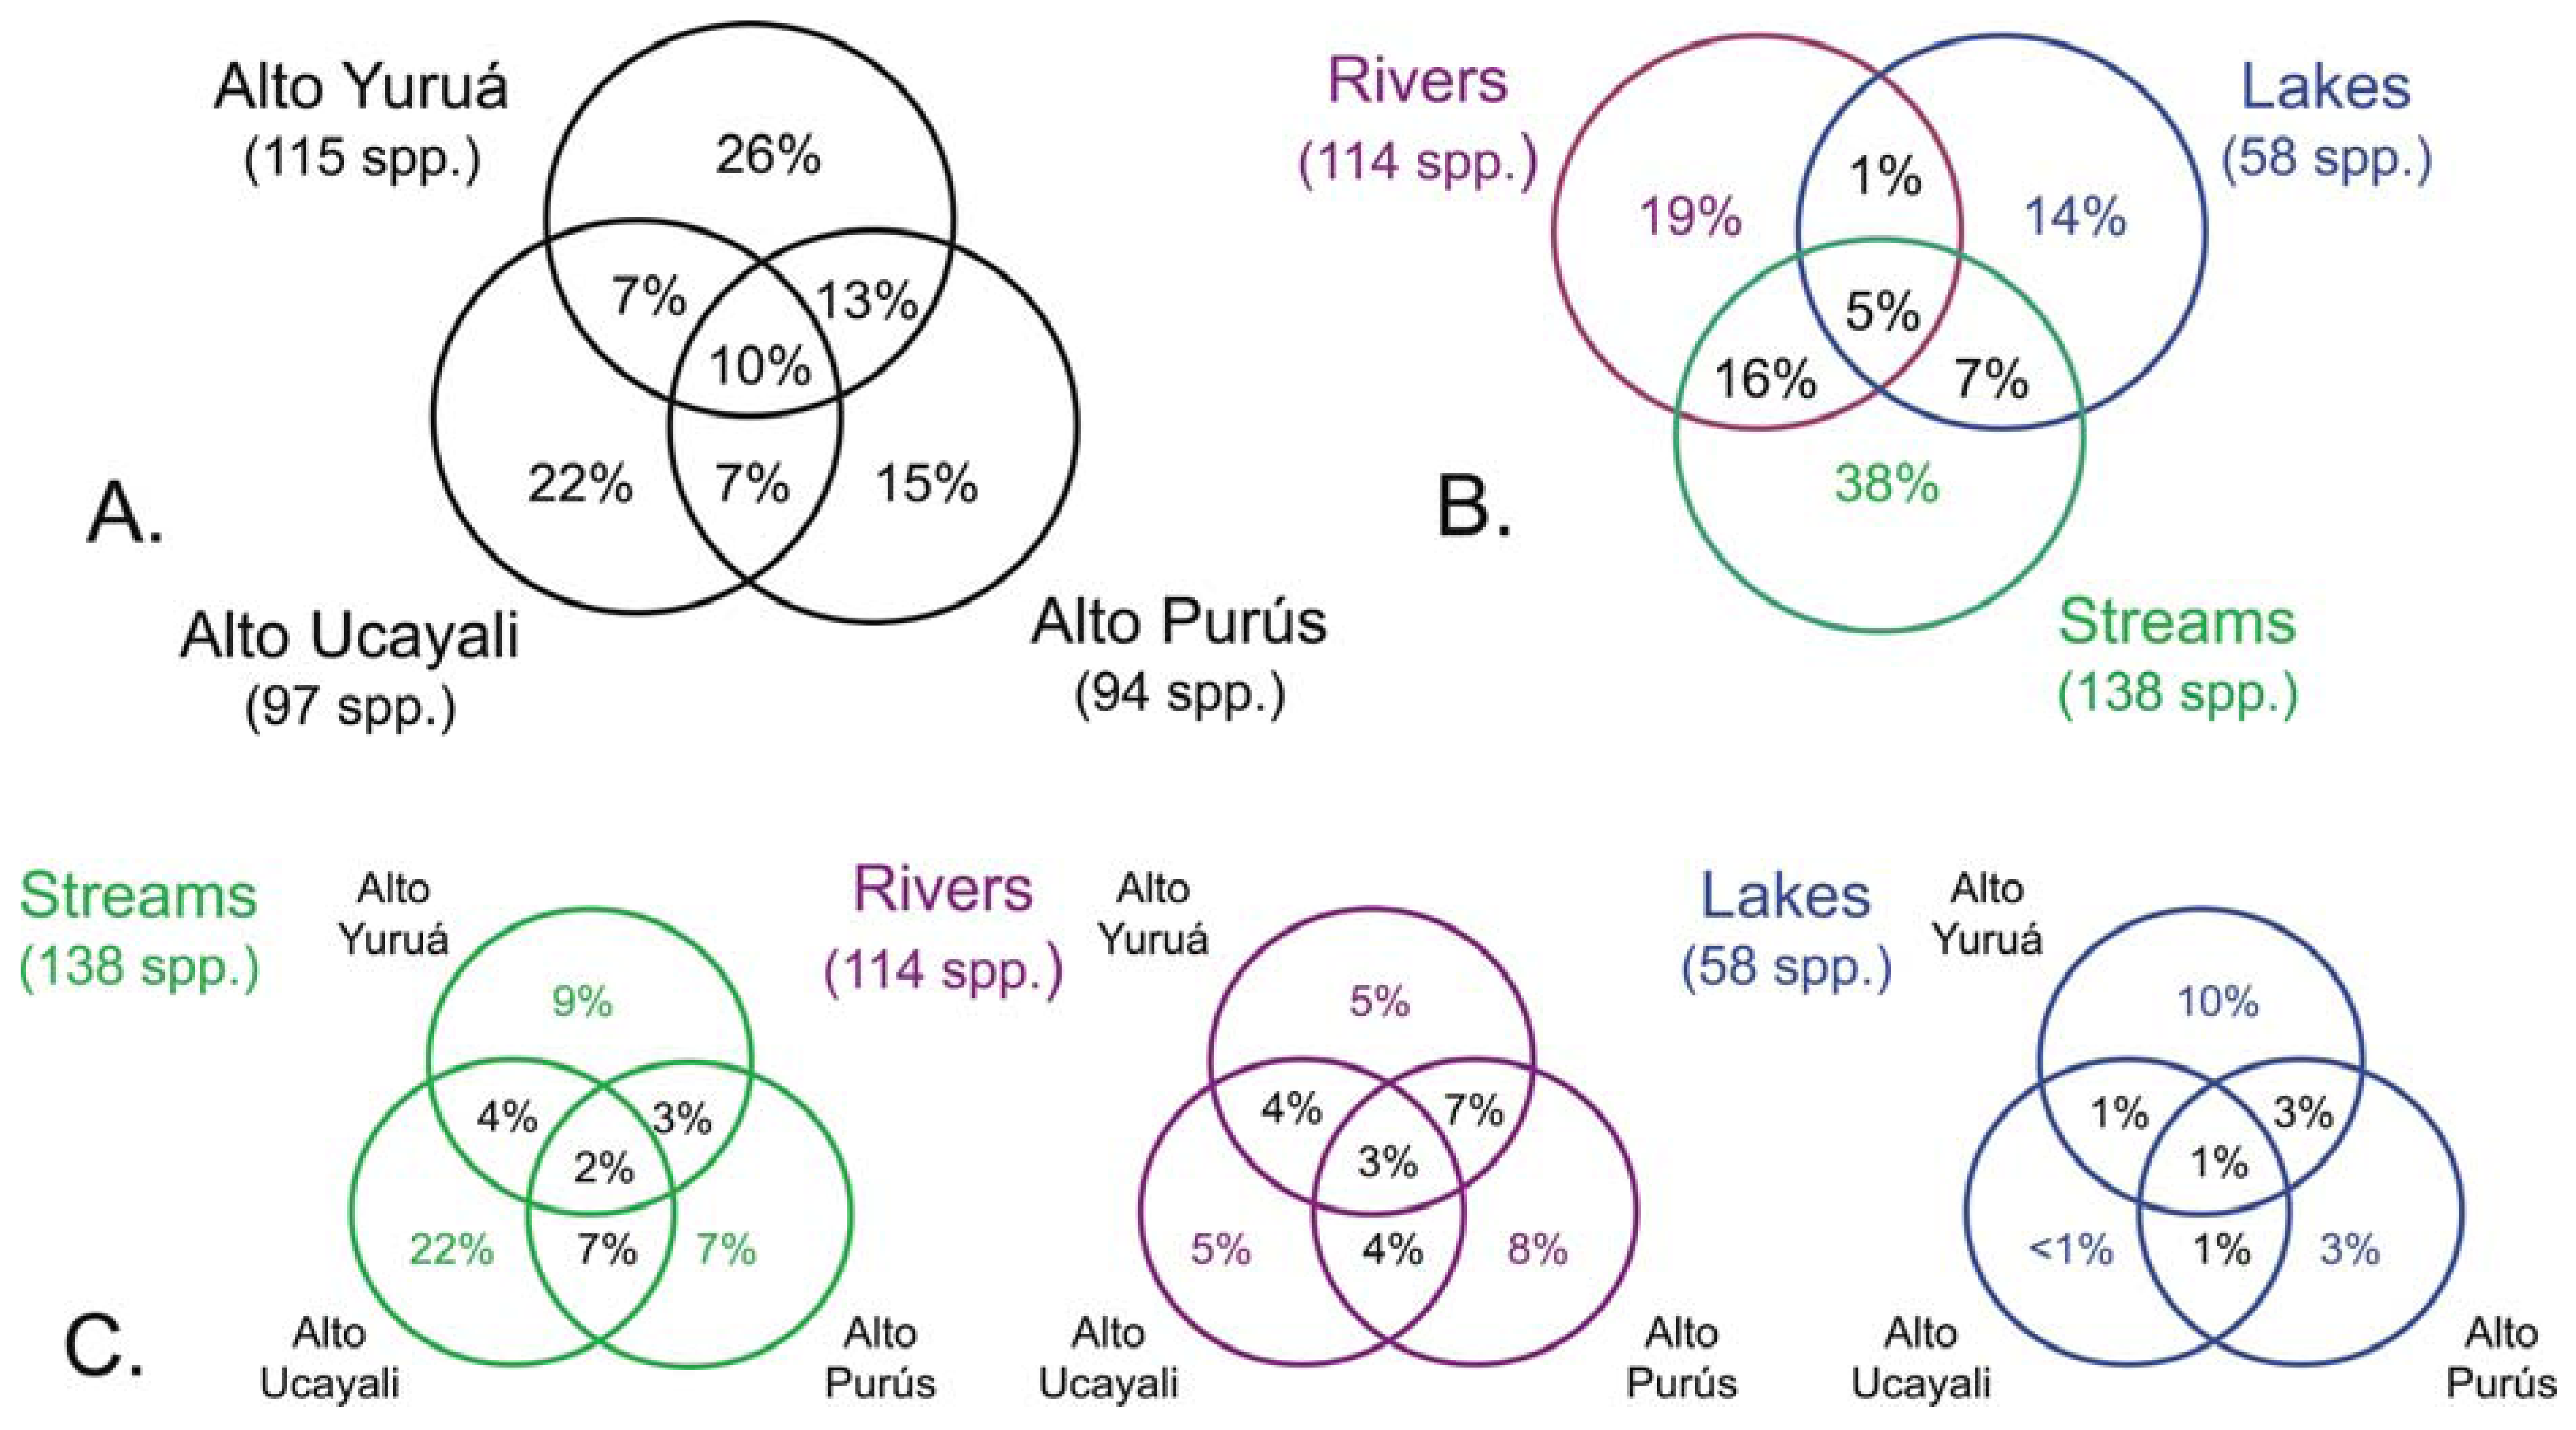
The results of this study showed high levels of geographic isolation among, and ecological specialization within, the tributary basins. The species richness values reported in each of the three basins were all very similar, each representing about half that of the regional species pool (Figure 3(a)); Alto Yuruá with 115 species (55%), Alto Ucayali with 97 species (46%), and Alto Purús with 94 species (45%). The taxonomic compositions (i.e., species names) of the faunas were however very different; most species (133 species, 64%) collected were restricted to a single basin, 56 species (27%) were shared by two basins, and only 21 species (10%) were widespread in all three basins (Figure 4). These differences are reflected in the high gamma diversity between upland basins, which averaged 165 (79%) species turnover. The fish species encountered in upland localities within the Fitzcarrald Arch also differ substantially from localities of the same rivers further downstream (e.g., Ucayali, Juruá, Purús), where floodplain habitats dominate the regional diversity [56,57,63,66-68]. Local species richness (alpha diversity) of floodplain sites declines noticeably in all three of the basins draining the Fitzcarrald examined so far, from 70–100 species at downstream sites (100–120 m) to fewer than 30 species at upstream sites (>200 m).
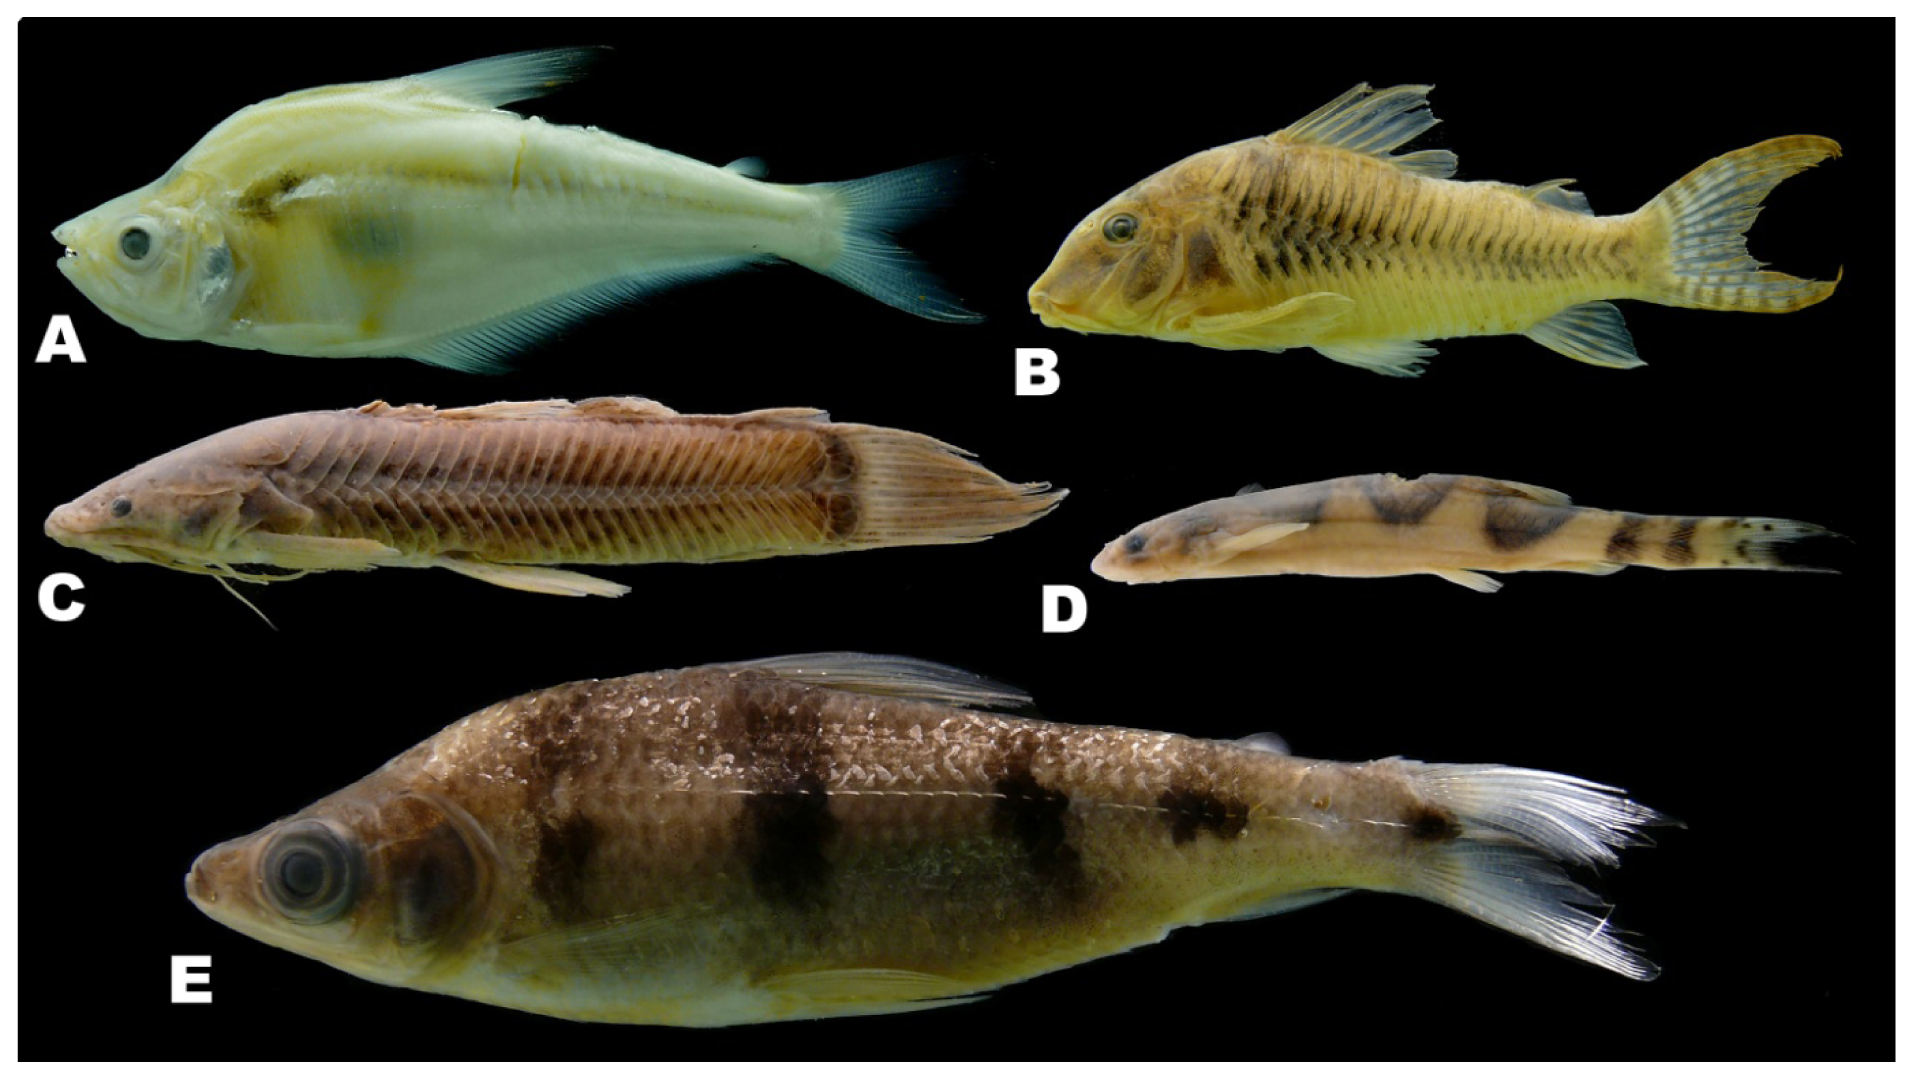
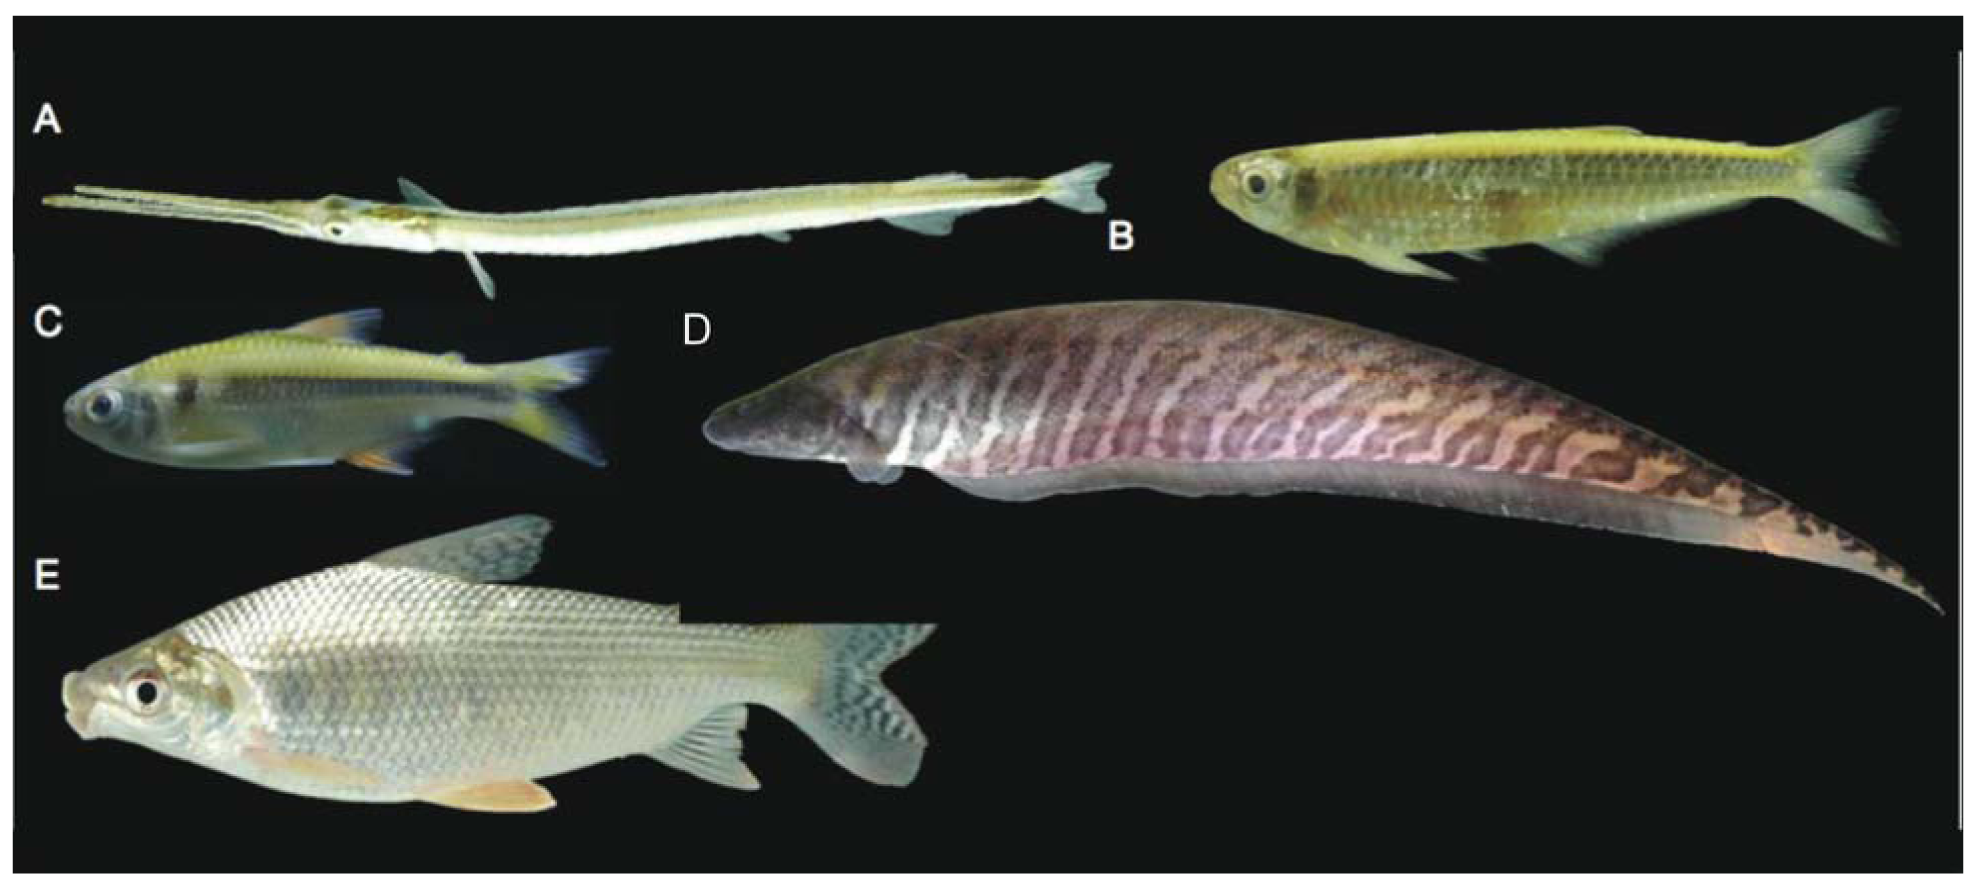
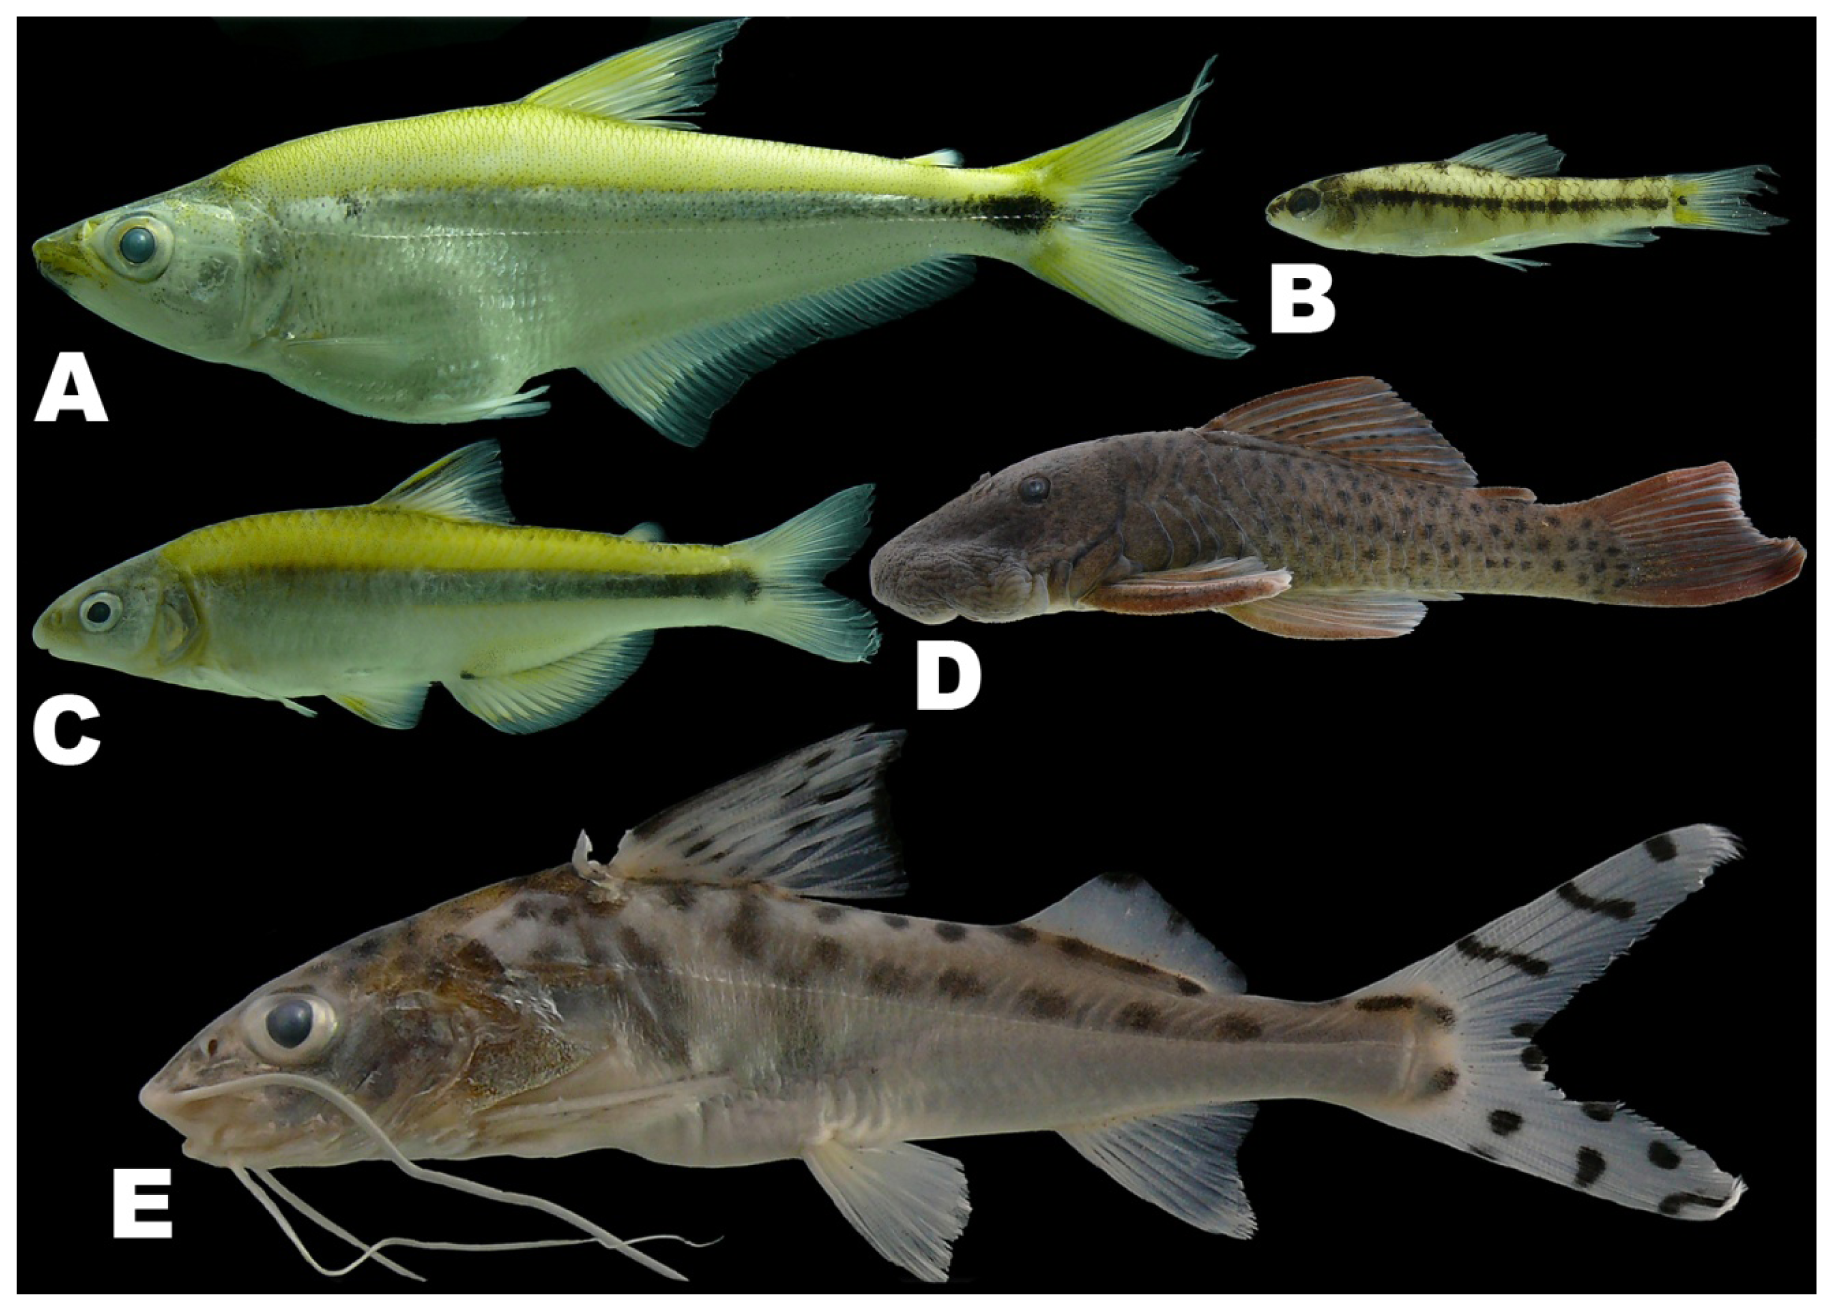
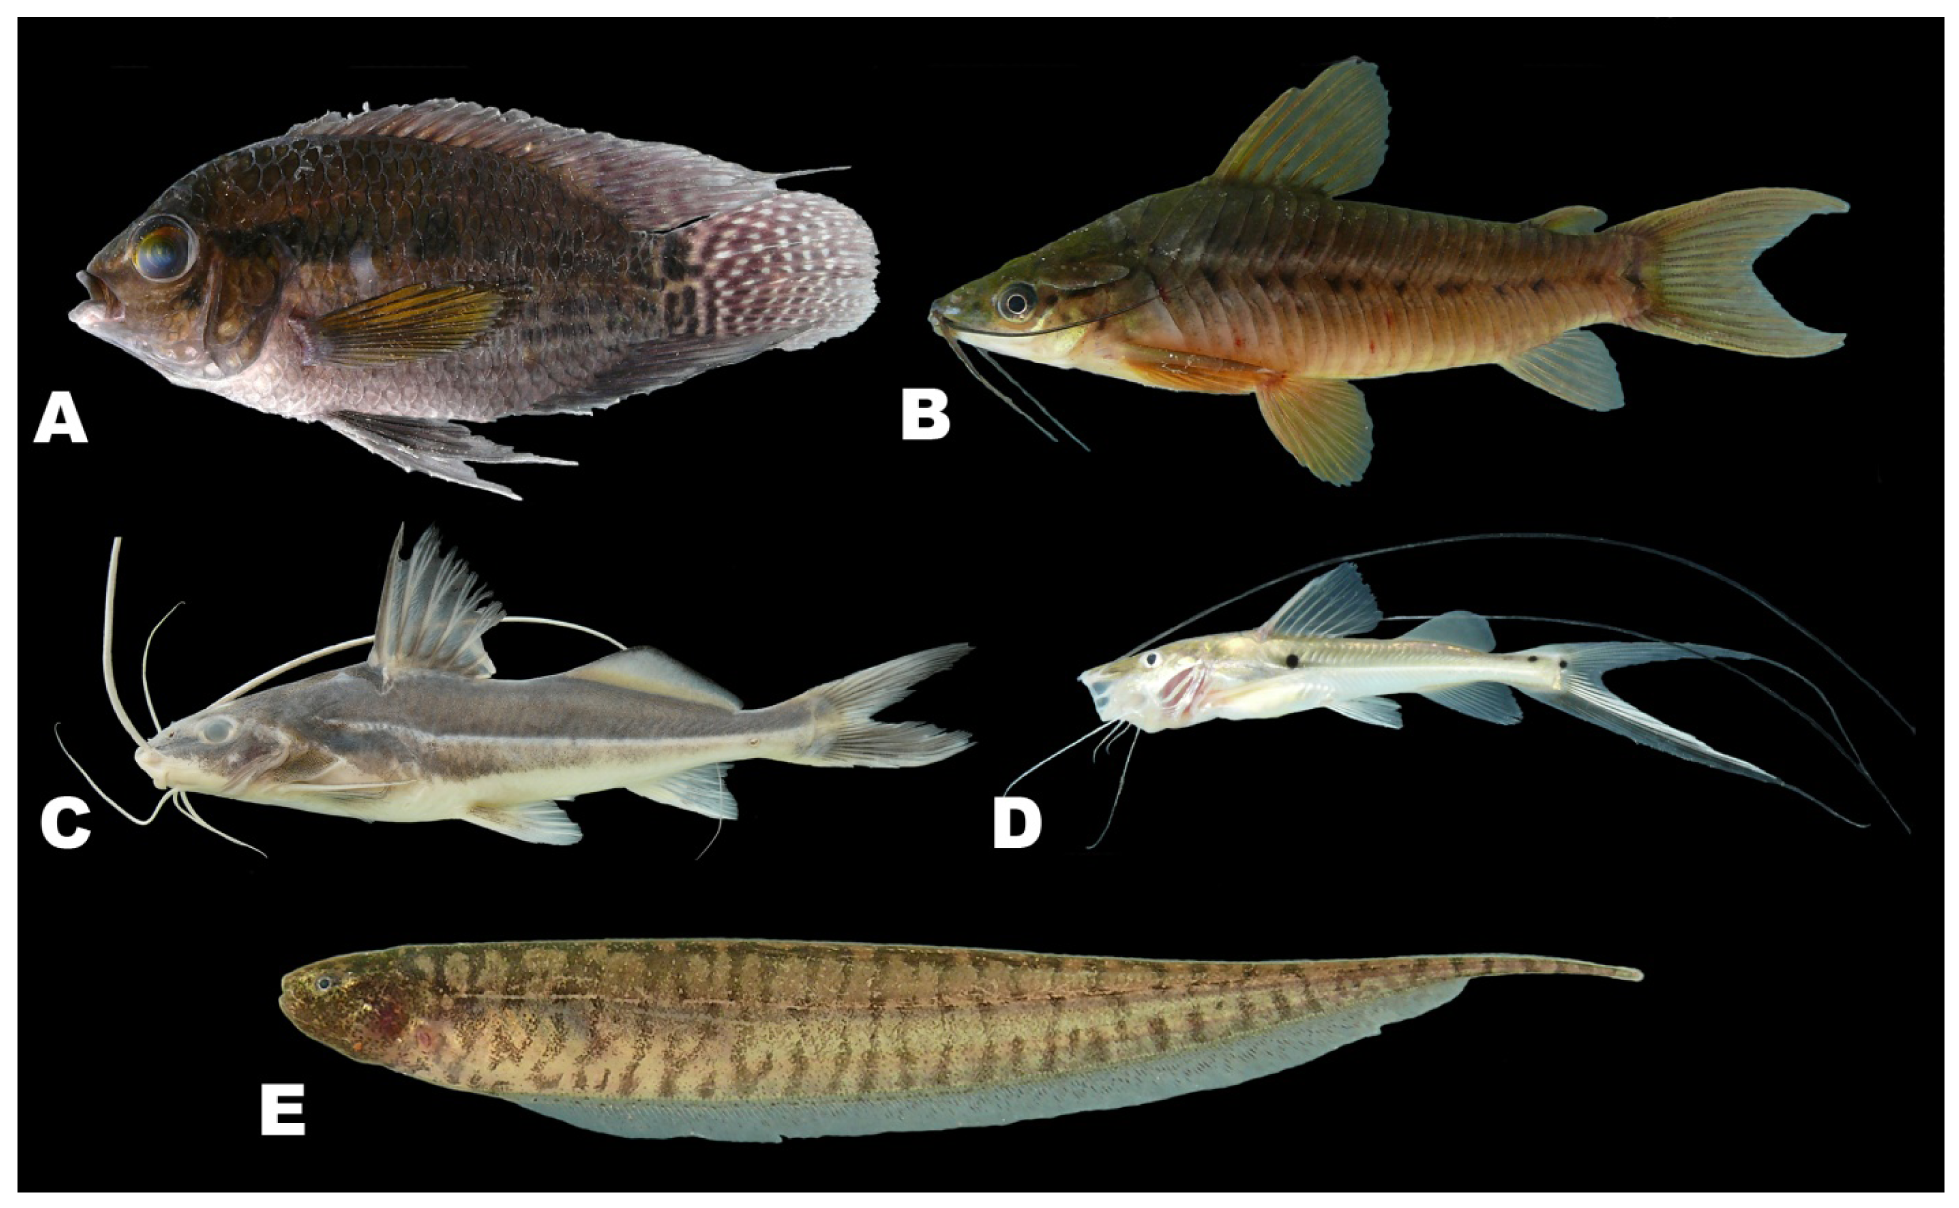
There was by contrast comparatively high heterogeneity in the species richness of the three habitats sampled, with a total of 114 species (55%) in rivers, 58 species (28%) in lakes, and 138 species (66%) encountered in streams. A large majority of the species (144 species, 69%) were stenotopic, that is restricted to a single habitat, and only 11 species (5%) were eurytopic, found in all three habitats. There were many more species in the lotic habitats (flowing waters of rivers and streams; 151 species, 72%) than in the non-riverine habitats (lakes and streams; 115 species, 46%) or floodplain habitats (rivers and lakes; 71 species, 34%). Examples of species collected only in the Alto Yuruá, Alto Ucayali, and Alto Purús basins are shown in Figure 5, Figure 6 and Figure 7. Five of the 21 species found in all three basins are depicted in Figure 8.
The high degree of habitat specialization in the Fitzcarrald is reflected in the high beta diversity (species turnover between habitats), which averaged 135 species (65%). A turnover of approximately half the species between adjacent habitats may seem remarkable, given the intimate proximity and physical contiguity of the waters draining small streams and oxbow lakes into the larger rivers, among sites separated by just a few tens to hundreds of meters. At least part of the reason for this high habitat specificity lies in the capacity of individuals in many floodplain species to move readily between sites over the course of the annual flood cycle, to find habitat conditions that better match their body size or other ecophysiological attributes [56]. Among the three basins, none of the habitats were found to share more than about 7% of the total species pool, and there were no substantial differences in actual numbers of species shared among the three habitats (Figure 4(C)). Another way to express this is that few species (5%) were found to be geographically widespread in any of the three habitats, and most were found restricted to a single basin (Figure 4(B)).
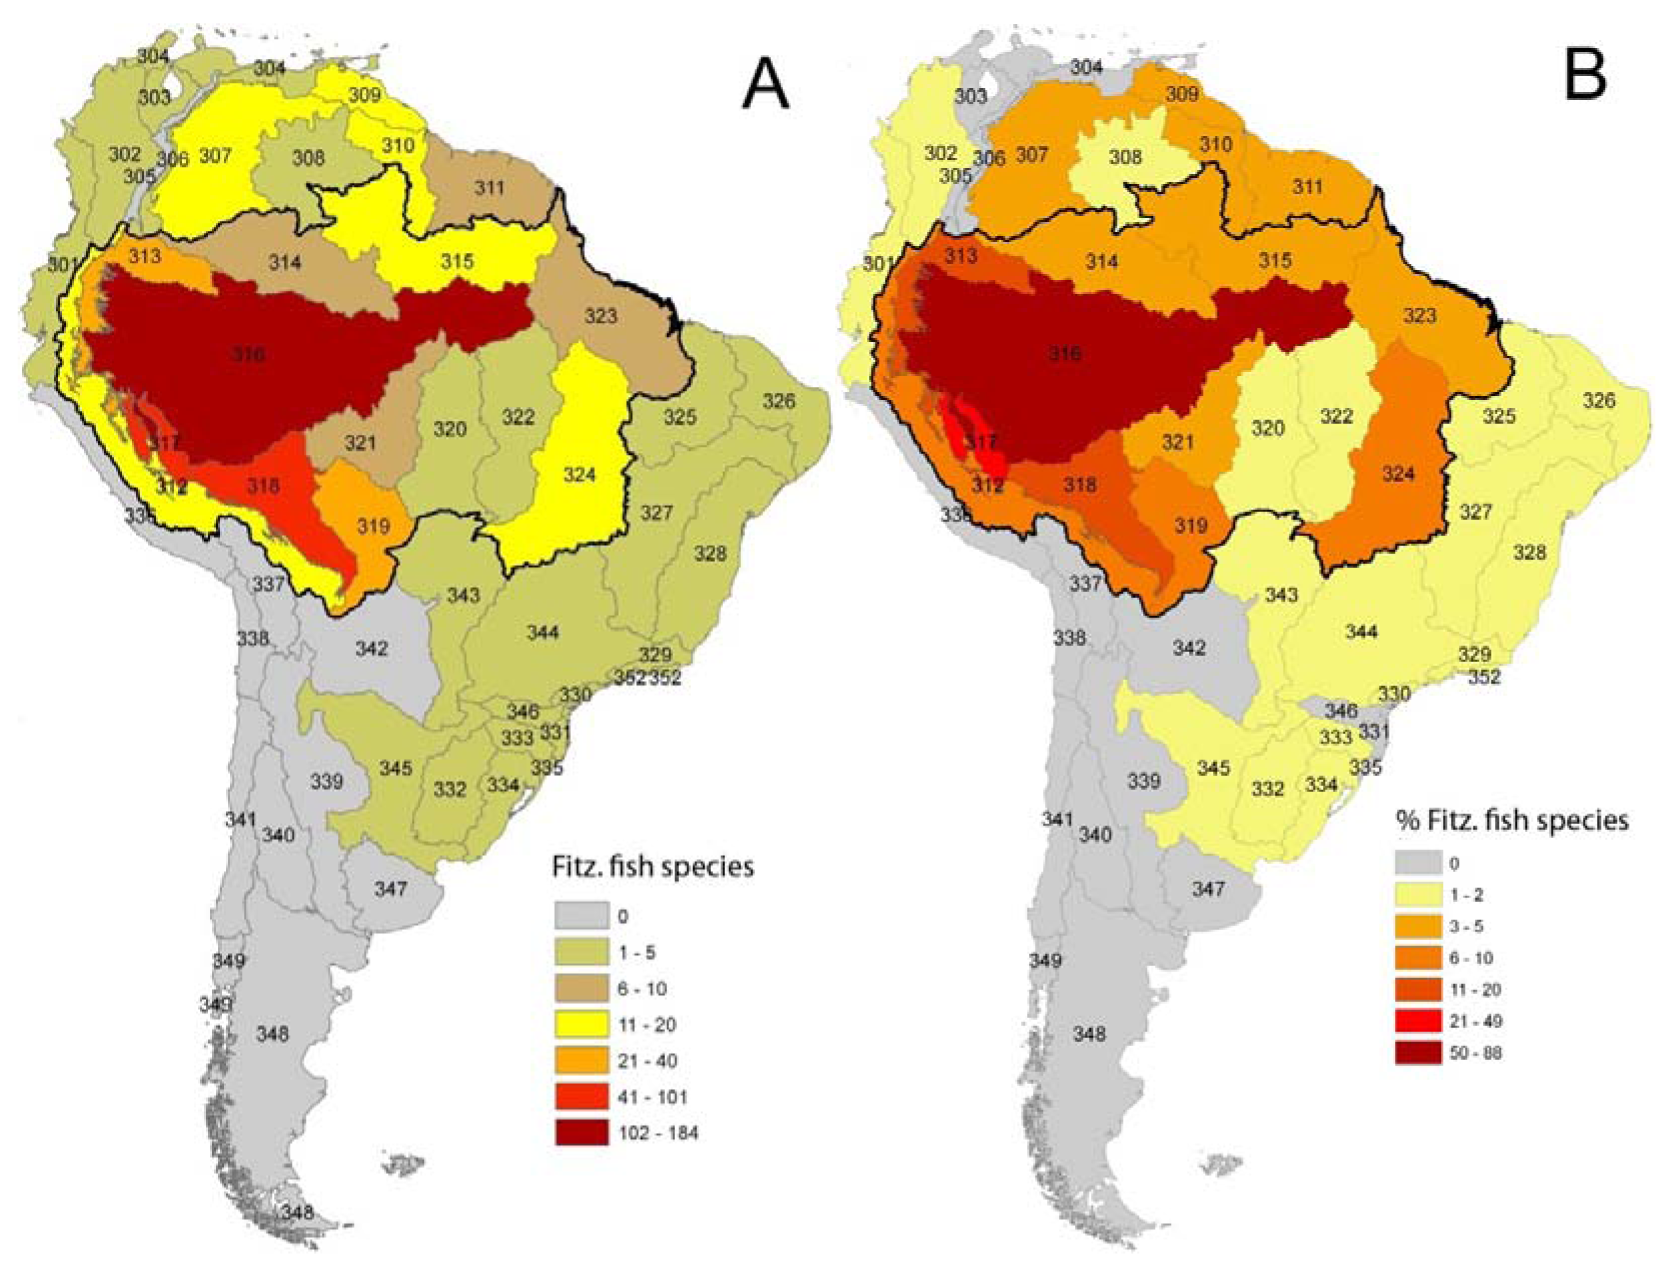
As in any ichthyofauna, each fish species that inhabits the Fitzcarrald region exhibits a distinct geographic range, both within and beyond the Arch. The distributions of known Fitzcarrald fish species (FFS) among the freshwater ecoregions of tropical South America are presented in Table 1, and some generalities in these distributions are illustrated in Figure 9 and Figure 10. A large majority of the FFS (184 species or 88%) are present in the adjacent Amazonas Lowlands Ecoregion (ER 317) A large number of FFS are also shared with the adjacent Ucayali-Urubamba Piedmont Ecoregio (ER 312; 101 spp.; 49%), and Mamoré-Madre de Dios Piedmont Ecoregion (ER 318; 42 spp.; 20%) By contrast, relatively few FFS are present in other portions of tropical South America (e.g., Brazilia Shield).
The floodplain midline (thalweg) is a more accurate measure of fluvial separation among populations than are either Euclidean distance (“as the crow flies”), or river-channel distances. Euclidean distances as measured point-to-point on a map are inappropriate for assessing geographic separation among localities in the one-dimensional topological landscape of a drainage network [69]. Euclidean distances substantially underestimate the amount of habitat space required for dispersal by obligatory aquatic taxa, and the distance required for the transfer of material and energy through stream networks [70]. River channels, on the other hand, overestimate geographic separation among sites for riverine taxa in lowland Amazonian systems, as most if not all species that inhabit the deep channels also regularly use floodplain habitats on ecological time scales for forging and breeding [66,71].
Channel length (river distance) is a poor measure of fluvial spatial separation in lowland (below 200 m elevation) Amazonian ecosystems, where rivers exhibit high sinuosity (i.e., have many meanders). Among the three rivers examined in this study, the total channel distances among sites range from 5,900 km (between Breu on the Alto Yuruá and Sepahua on the Alto Ucayali) to 6,765 km (between Sepahua and Pto. Esperanza on the Alto Purús), with the difference of 865 km representing about 13% that of the largest value (Table 2). Comparable ranges of distance estimates between these same sites are 21% for the floodplain midlines and 39% for Euclidean distances.
Channel length is generally well correlated with total basin area and floodplain area, and all three measures have been used as estimates of total habitat space in aquatic systems [72,73]. However, regional geomorphology can alter these relations, and channel length turns out to be a worse predictor of habitat space than does thalweg distance in highly meandering lowland Amazonian river systems. For example, the differences in channel length exhibited by rivers draining the Fitzcarrald Arch are relatively small as compared with other measures of basin size, such as total drainage area and water discharge [74,75]. This effect results from feedbacks of regional depositional hydrodynamics on channel length [76]. In the Yuruá, Purús and Madre de Dios basins the average channel sinuosity is proportional to floodplain width [77], which is very broad in the lower portions of the two shorter rivers, the Yuruá and Purús. These stretches are especially tortuous, attaining among the highest sinuosity values of any major rivers of the world, with values of about 2.3 [78,79].
2.2. Diversity Estimates and Sampling Biases
As of this writing we estimate the number of fish species in the interior of the Fitzcarrald region to exceed 300 species. This number is about one third more than the number used in the quantitative analyses of the present paper. The higher estimate was made by comparing species lists and photos presented in literature sources [55-65], and from examination of museum lots archived at the Natural History Museum of the University of San Marcos (MUSM), Lima. The quantitative comparisons of species diversity reported here were based on the more accurate and comparable species level identifications of our own collections, and not the higher species richness estimate based on literature references.
We emphasize the preliminary nature of the diversity estimates reported here, which are based on species presence and absence data only, and from limited sampling over a very small proportion of the Fitzcarrald region as a whole. The Fitzcarrald interior remains a remote wilderness landscape of lowland humid tropical forest with no roads, few air strips, and complex political interactions among the indigenous communities. Due to logistical constraints regarding access and transportation, we were unable to standardize the sampling protocol with sufficient rigor to collect species abundance data, or to test the effects sampling error on diversity estimates [80-85]. Quantitative data on fish species abundances in the Fitzcarrald region have to date focused on a limited number of commercially important, large-bodied, riverine species [59,86].
The Amazonian ichthyofauna in general remains incompletely documented, especially at the species level. A recent review calculated that, as of 2003, about 25% of Neotropical fish species known in museum collections were undescribed [87]. Much of the Amazonian lowlands is still a wilderness and the ichthyofaunas of many regions and river basins are either sparsely collected or, in some cases, almost entirely unknown [88]. There is also much poorer sampling of low order streams across the landscape, especially given the great proportion of the landscape they occupy, and the expectation for a relatively high species turnover among sites (gamma diversity) [89].
The sampling design of this study may also have introduced potential biases to the diversity estimates. In order to facilitate comparisons, collections were made during a standard period of low water in July when fishes are concentrated in lakes and channels, and not dispersed onto the floodplain. The lack of rain and mud also facilitates transportation by air, water and foot, and thereby increases the total number of localities, field days, stations, specimens and species that can be sampled within the limited time and other resources of a given expedition [56]. However, sampling at low water may under represent highly seasonal and migratory species (e.g., the pimelodid catfishes Pseudoplatystoma spp. and Brachyplatystoma platynema), as well as species associated with seasonally ephemeral habitats such as floating vegetation [71,90]. Interviews with local fishermen revealed the presence of several common lowland riverine species in upland portions of the Fitzcarrald rivers during the rainy season (Sept.-Dec.), that were not collected in our survey: e.g., potamotrygonid stingrays, the characiforms Curimata aspera, Colossoma macropomum, Piaractus brachypomus, Raphiodon vulpinus, and the perciform Plagioscion auratus [62,64]. Sampling at low water may affect gamma diversity estimates by under representing the number of species shared between floodplain habitats (rivers and lakes) due to seasonal lateral migrations. The anomalously low-water conditions encountered in the Alto Purús in 2010 as a result of a regional drought [91] may also have reduced the number of collection sites, fish abundances, and species diversity.
The small proportions of fish species shared among collections in the three basins of this study (Figure 4(C)) may reflect sampling error, dispersal limitation, or both. The very low level of species endemism recorded within the Fitzcarrald region as a whole suggests that dispersal has been important to the formation of the basin-wide fish faunas. Further, some species are expected to be absent from our collections do to perennially low abundances, or population variability in space or time (seasonal or annual variation). Other recorded absences may reflect real differences in absolute abundances. Some fish taxa (e.g., Rivulus, Corydoras) are widespread, abundant, and diverse in Amazonian lowlands, and really do seem to be absent or rare in the Fitzcarrald uplands. Among Gymnotiformes, the electric signals of Gymnotus coropinae and Hypopygus lepturus were never detected using a portable amplifier. As these species are usually common and abundant in lowland terra firme (non-floodplain) habitats, they also seem to be either absent or rare in the Fitzcarrald uplands. The absence of the callichthyids Callichthys callichthys and Hoplosternum littorale from many sites was also informative, as both species are usually common floodplain species in the lowland reaches of all the rivers draining the Fitzcarrald region, and neither had been previously reported from the upper reaches of these rivers [92,93]. Based on these experiences collecting in the Fitzcarrald uplands it is now possible to interpret the negative results as indicating real species absence, or at least rarity.
Some of the taxonomic patterns reported here may also be affected by the sampling gear, in particular our heavy reliance on nets (albeit of several kinds). Under sampled taxa may include certain pimelodid catfishes and apteronotid electric fishes inhabiting deep river channels, and species that take refuge in structurally complex habitats and substrates; e.g., doradid and auchenipterid catfishes in logs and logjams of streams and rivers; sternopygid and hypopomid electric fishes in rooted vegetation of floodplain lakes. Plant-based ichthyocides are widely used for subsistence fishing by indigenous peoples of the region, and were adventitiously employed in this study. However industrially produced rotenone is banned for scientific collecting in Peru and was not applied in this study. Although electrofishing is often useful in sampling structurally complex substrates, the apparatus is heavy and cumbersome to transport and use in remote settings that are often accessible by foot alone, and was not applied in this study.
2.3. Comparisons with Other Faunas
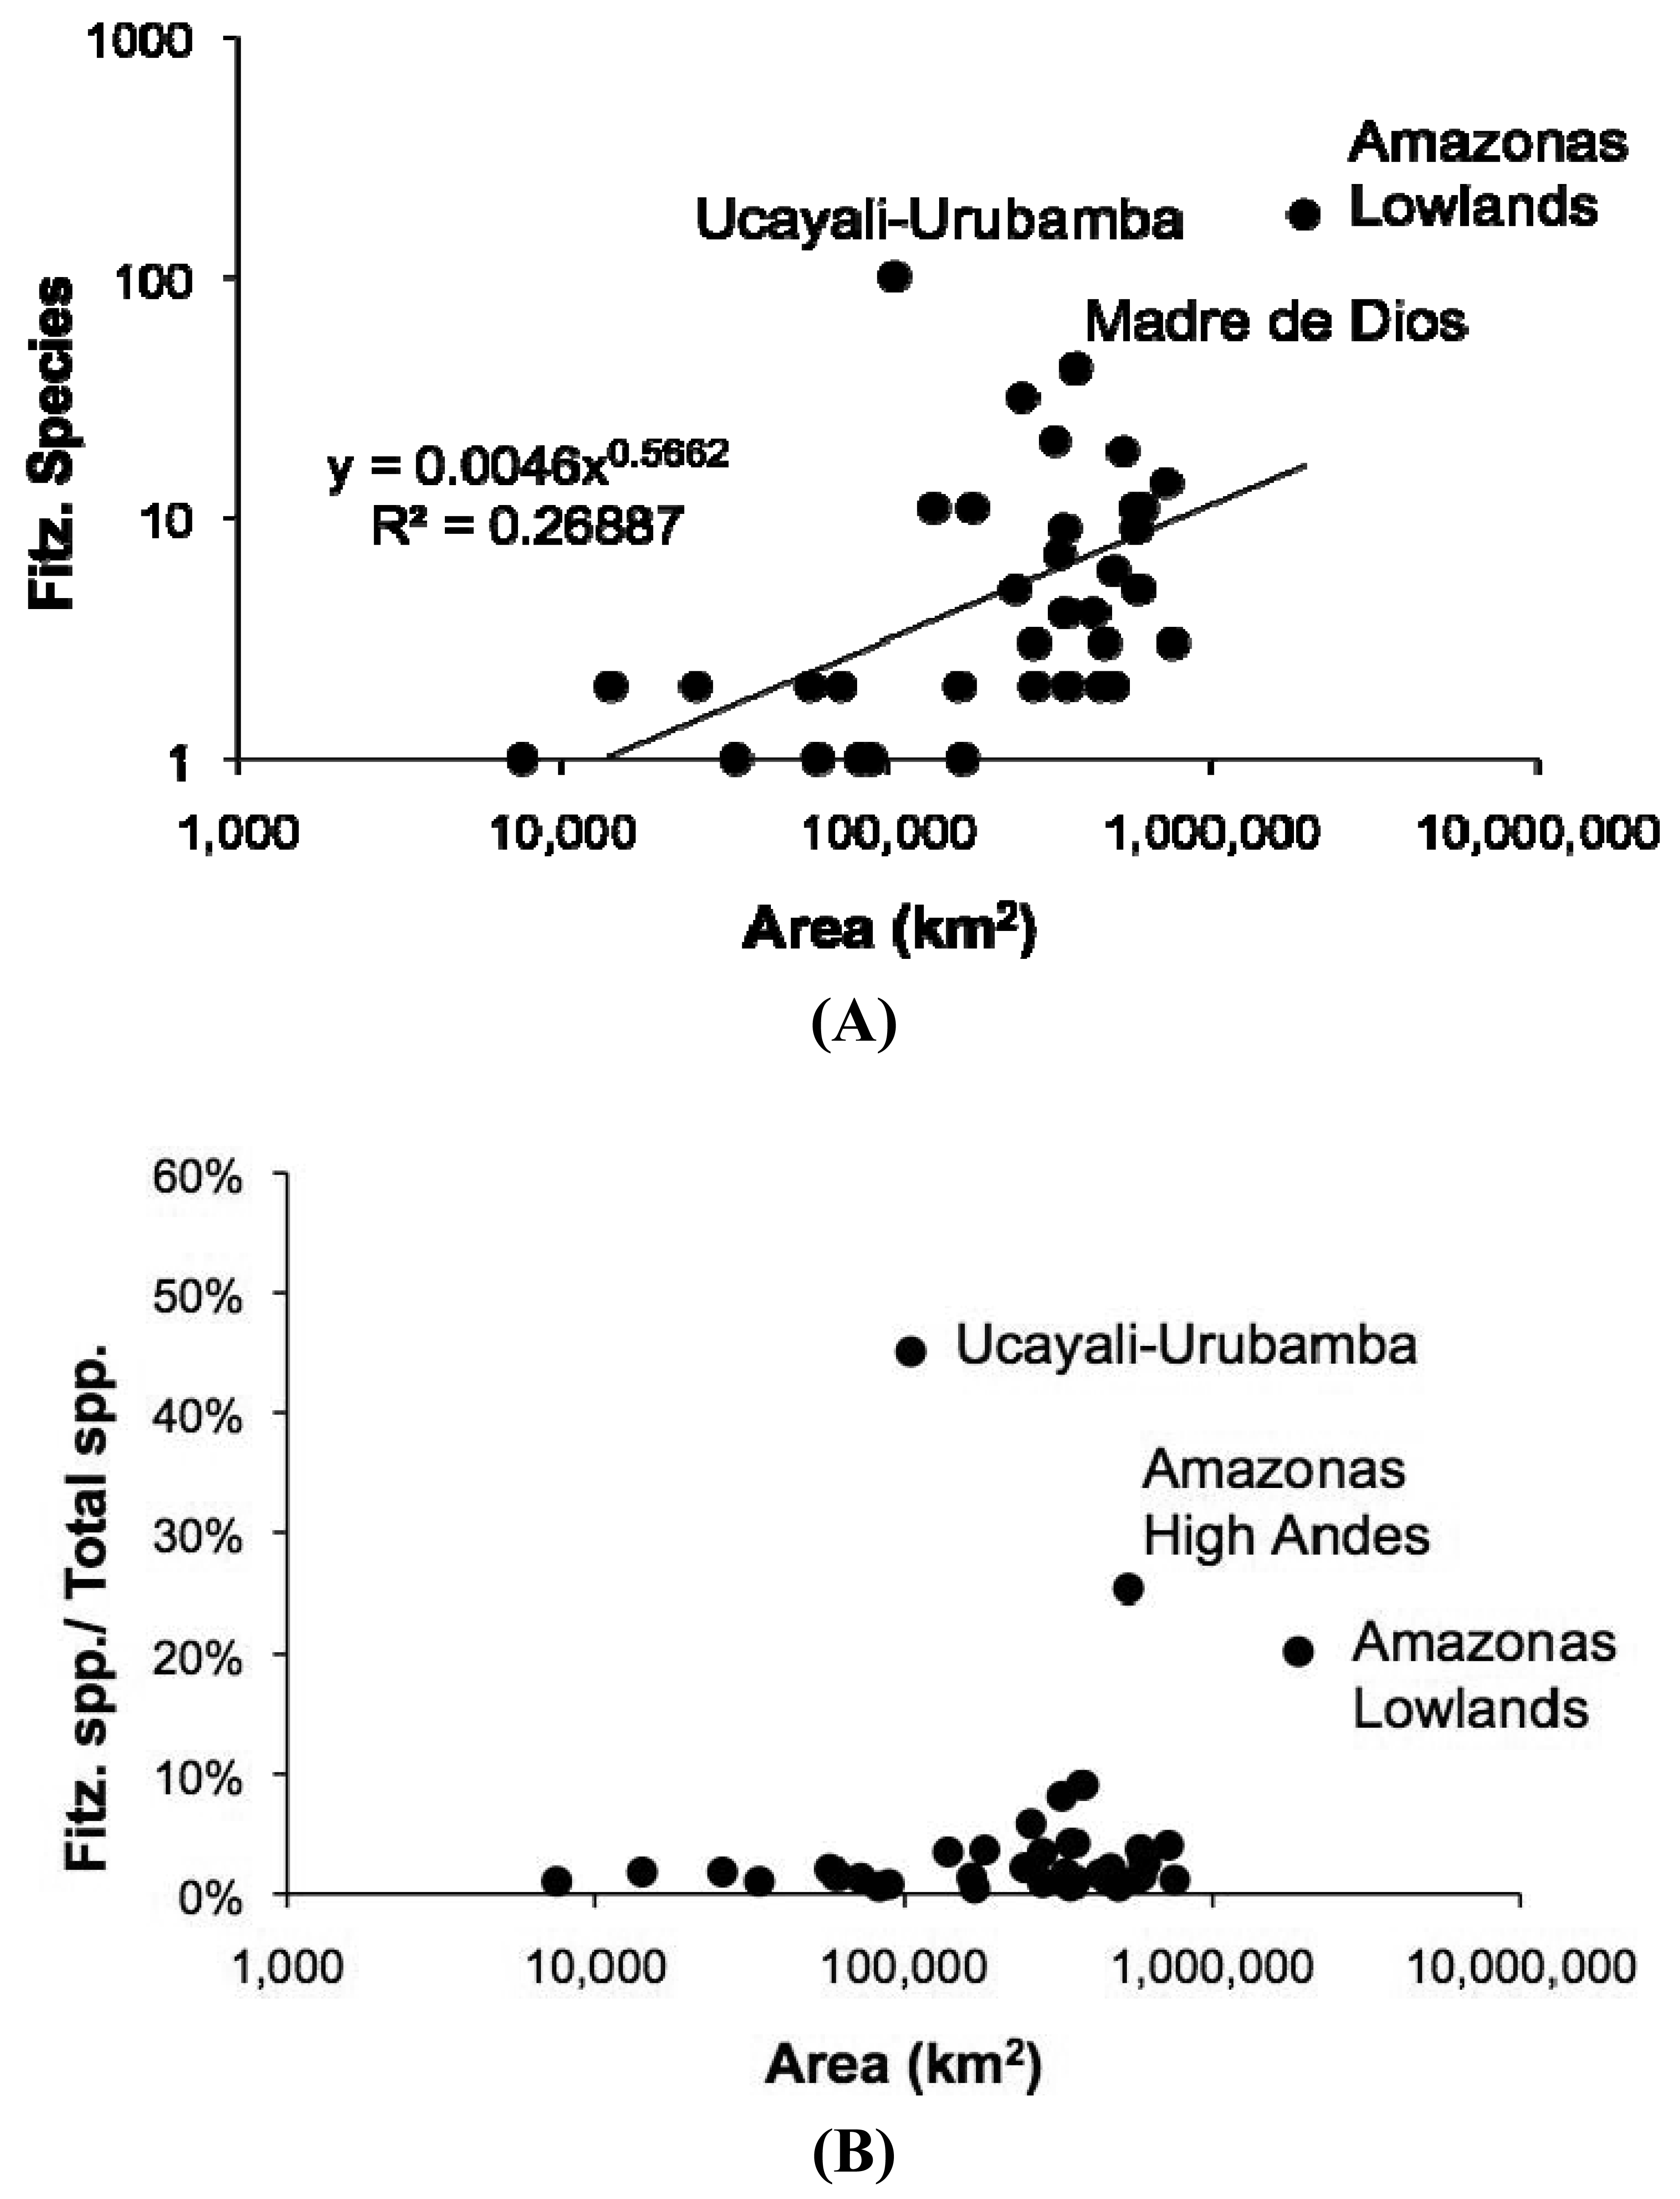
Despite the potentially important sampling biases described above, the fish faunas of the Fitzcarrald region appear to be composed of species recruited primarily from the exceptionally diverse Amazonian lowlands, and to a lesser extent from the fish faunas of the Ucayali and Madre de Dios basins (Table 1). There are high numbers (and proportions) of Fitzcarrald species present in the adjacent Amazonas Lowlands (184 species or 88%), Ucayali-Urubamba (101 species or 49%) and Mamoré-Madre de Dios (42 species or 20%) ecoregions (Figure 9). The absolute numbers of Fitzcarrald fish species is highest in the adjacent Amazonas Lowlands, Ucayali-Urubamba, and Madre de Dios ecoregions (Figure 10(A)), and proportional representation of Fitzcarrald fish species is highest in the Ucayali-Urubamba, Amazonas High Andes, and Amazonas Lowlands ecoregions (Figure 10(B)).
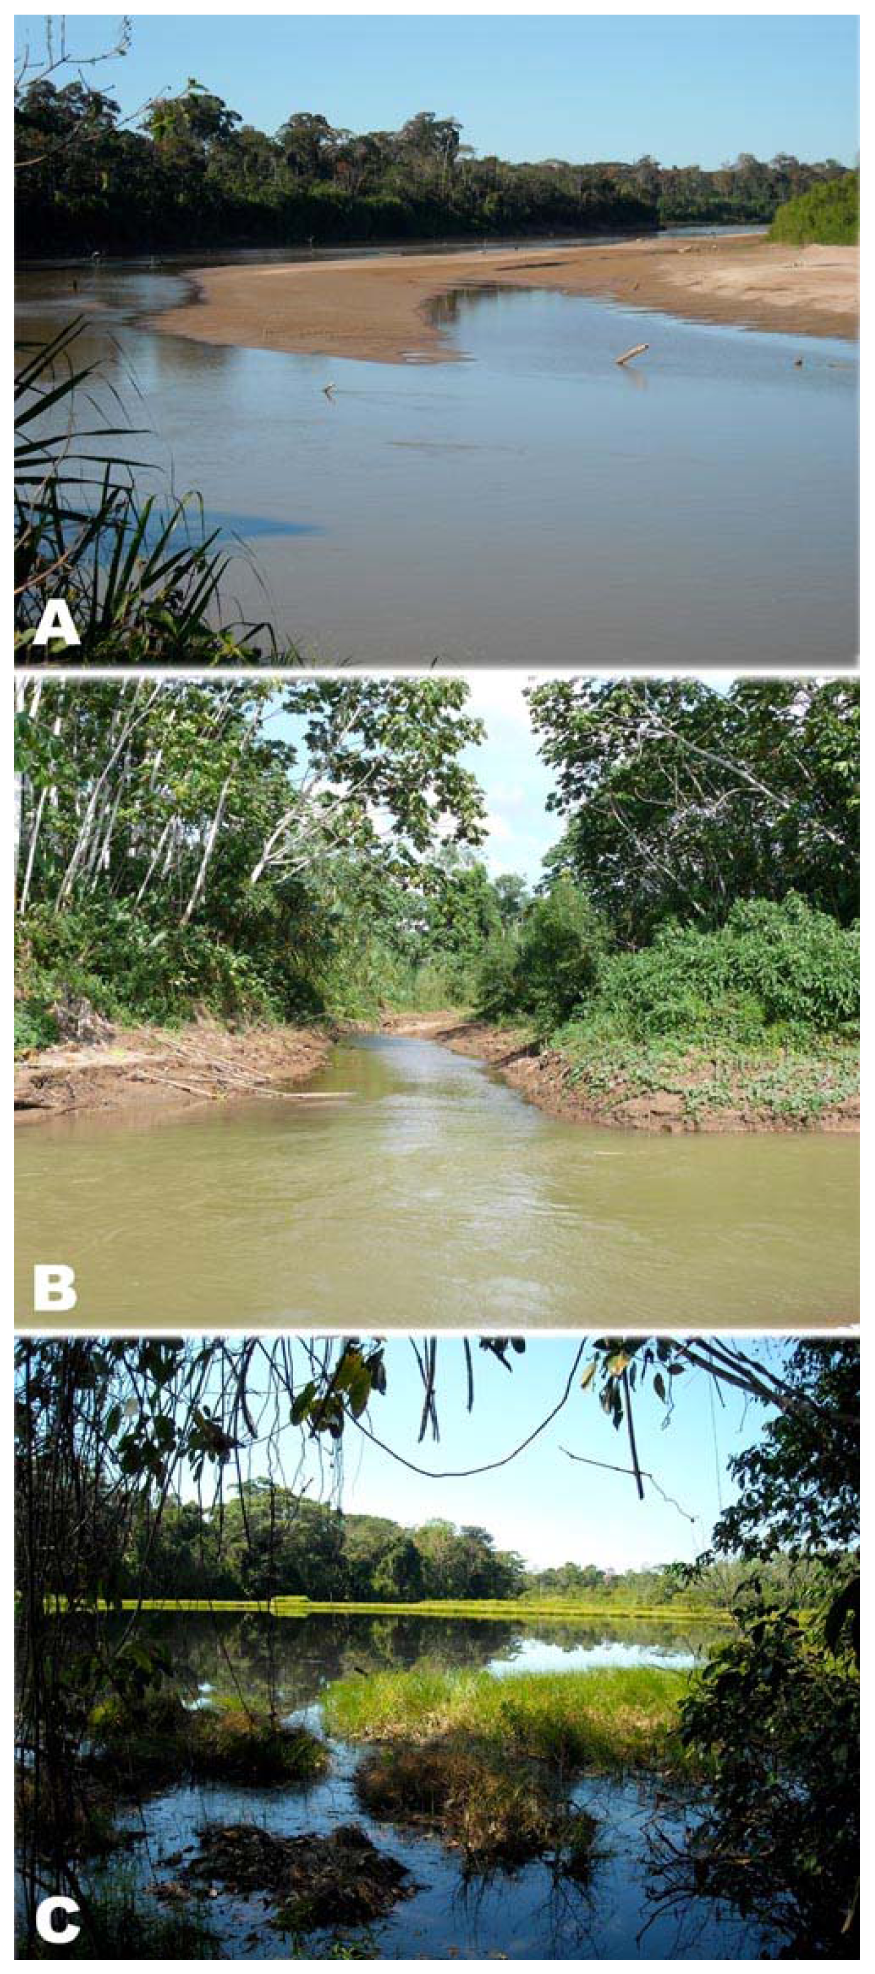
Upstream localities of the Fitzcarrald fish fauna appear to be relatively depauperate in comparison with downstream localities of comparable habitat in the same river basin [56,57,63,67,68]. Some common and widespread Amazonian fish taxa that are to date entirely absent from the Fitzcarrald uplands include: Lepidosiren, Pellona, Semaprochilodus, Metynnis, Myleus, Brycon, Acestrorhynchus, Hydrolicus, Hypopygus, Microsternarchus, Rhamphichthys, Hoplosternum, Cichla and Colomesus. The relative rarity or perhaps complete absent of these species in the Fitzcarrald uplands may be due in part to local ecological conditions. The margins of streams and rivers traversing the interior of the Fitzcarrald region are dominated by sandy or muddy beaches at low water, with little rooted and almost no floating aquatic vegetation (Figure 11). Further, the upland river channels are relatively shallow, and the floodplains substantially narrower, with fewer and smaller oxbow lakes than in lowlands. In combination these conditions are not favorable to many fish groups specialized to inhabit lowland Amazonian floodplains and deep river channels (e.g., the várzea guild of Serrasalminae; see Figure 3 in [94]). The pattern of fish species richness falling off with elevation has been reported in other regions of tropical South America sampling over similar elevational gradients [95-98].
2.4. Endemism
Very few fish species are known to be endemic within the Fitzcarrald region. At present we know of only three species; the gymnotid electric fish Gymnotus chaviro [99], the characin Phenacogaster capitulatus [100] and the cichlid Bujurquina eurhinus [101]. However, the task of documenting species endemism requires much more spatial information than does that of documenting species richness, as endemism requires positive knowledge of where species are both present and absent, and extensive geographic sampling with fine resolution at the alpha taxonomic level [5,102]. The actual patterns of species endemism in the remote and relatively poorly explored rivers of Western Amazonia may not be known for many years.
Given the relatively poor understanding of the FFS fauna, there is reason to suspect that both taxonomic and geographic factors contribute to the conclusion of little or no endemism within the Fitzcarrald region. The observed lack of endemism may in fact be real, but limited (or apply most strongly) to the floodplain portion of the fauna that was most intensively sampled, or perhaps to the peripheral portion of the Fitzcarrald region that was sampled at elevations below 310 m. Low levels of species endemism are indeed widely observed in other floodplain areas of lowland Amazonia [5]. Under this view it remains possible that some fish species are restricted to non-floodplain (terra firme) habitats of the Fitzcarrald, especially in the interior uplands (310–500 m), and that the elements of the fauna intercepted by the current study represent primarily the most common and widespread forms.
Nevertheless, the low endemism of fish species in the Fitzcarrald region does appear to be a genuine feature of the fauna, and we anticipate this result will be robust in the face of future discoveries [5]. We suggest, cautiously, that the data currently in hand really do indicate low levels of fish species endemism within the Fitzcarrald. The taxonomic and geographic understanding of this region is really not so much worse than many other areas of comparable size the Western Amazon, some of which really do exhibit distinct a species composition (ERs 313, 317, 318). In addition, the sampling intensity of this study, focused on the periphery of the Fitzcarrald (212–310 m), is likely to have intercepted at least some species endemic to the interior. The sampling station (Quebrada El Dorado on the Mishaua river) closest to the point of highest elevation (536 m) within the Fitzcarrald region lies at a distance of about 110 km as the crow flies. This is a relatively small distance in the context of Amazonian fish species whose ranges commonly extend over many hundreds of km in linear dimensions. Unsampled endemic species would therefore have to have very restricted geographic distributions, low abundances, or both. Lastly, analysis of geospatial information from DEM and high resolution satellite (Google Earth) images indicate an absence of pronounced physical barriers to dispersal (e.g., a fall line), or discrete climatic differences, between the peripheral(lower) and interior (upper) portions of the Fitzcarrald region. Indeed elevations associated with changes in fish species compositions usually occur above 500 m in other upland regions of tropical South America [5].
2.5. Paleogeographic Considerations
In addition to the unique ecological conditions alluded to in the Introduction, the Fitzcarrald Arch represents a unique geological situation, containing the only watersheds within the Amazon Basin for which reliable estimates are currently available regarding the timing of headwater basin separation [5,24]. The uplift of the Fitzcarrald Arch is dated by geophysical and paleontological data to the Late Miocene-Pliocene (9–3 Ma) [103-106]. Such information on the timing of river basin separation provides minimum age estimates for calibrating genetic divergences among populations or species inhabiting each of the newly isolated basins [52,107-114].
Analyses of radiometric and biostratigraphic data indicate that the Fitzcarrald region changed from a depositional to an erosional setting during the period of the Late Miocene to Pliocene epochs (c. 9–3 Ma.) [103,115-118]. Sedimentological analyses show the switch occurred in association with the transition from mid-Miocene (Quechua phase) faulting to Pliocene (Diaguita phase) compressional deformation [103]. Radiometric Argon-Argon dating of two volcanic tuffs from the Solimões Formation were dated to c. 9 and c. 3 Ma. [116]. Mammalian biostratigraphy confirms these age estimates, as the top of the Solimões Formation (Chapadmalan Stage) has no mammal fossils of North American origin [119]. These data suggest that sedimentation in the Solimões Formation ceased before the rise of the Isthmus of Panama and the onset of the Great American Biotic Interchange c. 3.5 Ma. Lastly, molecular dating of divergences among aquatic mammal and fish populations [120,121] suggest Late Miocene-Pliocene dates for the separation of the Upper Madeira from other Amazonian basins.
Although rising to only modest elevations, the Fitzcarrald uplift contributed to the Miocene fragmentation of the north flowing Subandean Foreland Basin, and to the reorganization of the fluvial net that forms the modern east-flowing Amazon Basin [104-106,122-124]. The low elevation and unconsolidated sediments of the region has resulted in a relatively continuous history of stream capture events across its several watershed divides, as the principle direction of stream flow shifted from generally NW to NE [125].
The most likely candidates for divergence in allopatry across low-lying Amazonian watersheds are clades (monophyletic groups) of species with spatially restricted and non-overlapping geographic ranges, and clades of species possessing small body size, stenotopic (ecologically narrow) habitat preferences and limited dispersal capacities. A recent meta-analysis of diversification in Amazonian fishes examined patterns in 33 taxa (genera or tribes) with sufficiently dense taxon and geographic sampling to test hypotheses of allopatric divergence [24]. Among these taxa no species-pair has yet been identified that matches criteria for divergence in allopatry across one or more of the Fitzcarrald watersheds.
Taxa that stand as candidates for possible species-level divergence across one or more of the Fitzcarrald watersheds include the characins Characidium (8 species), Knodus (7 species), Moenkhausia (5 species), and Odontostilbe (4 species), and the armored catfishes Ancistrus (7 species), Hypostomus (6 species), and Panaque (4 species). There is to date no phylogenetic information on the species of these taxa from the Fitzcarrald region. Available phylogenetic information on several other taxa is however inconsistent with such an hypothesis; e.g., Leporinus with four species [126], and Gymnotus with two species [99]. Genetic and phenotypic data on the armored catfish Chaetostoma lineopunctatum show incipient within-species divergence between the Ucayali and Madre de Dios basins [127], but this species really has an Andean distribution, and this example may not therefore represent divergence across a Fitzcarrald watershed. In general, the alpha taxonomy and systematics of all the taxa mentioned above remain very poorly understood. Phylogenetic and phylogeographic studies of several Fitzcarrald fish taxa are currently underway using molecular data to examine species-level divergence across Fitzcarrald watersheds.
3. Experimental Section
All collections were made between 212–310 m above sea level in portions of three major Amazonian basins draining the Fitzcarrald region (Table 3). The collections were made during the period of low water (July) when fish biomass is more concentrated and field sites are more accessible. The overall sampling strategy was to examine the relative roles of geography (river basin) and habitat in constraining the species composition of local assemblages. A total of 53 upstream localities were sampled within the Fitzcarrald region in 48 field days over three project years (Figure 1(B); Table 3).
Collections were made in three major types of environments: channels and flooded beaches of large rivers (>40 m wide on straight runs at low water), small rivers and streams, and floodplain oxbow lakes (Figure 11). All collecting stations were georeferenced (latitude, longitude, altitude) using GPS, and habitats were documented with high resolution digital photographs and written descriptions. Abiotic attributes such as water temperature, pH and electrical conductivity were measured using a HI 98129 Multimeter (Hanna Instruments). Collections were made using standard ichthyological gear, including seine nets (5 and 10 m, 5 mm between knots), dip nets, cast nets, and hook and line. Electric fishes were located with the aid of a portable amplifier [128].
All specimens collected were identified to morphospecies, and exemplars of each morphospecies set aside as vouchers for a standardized reference collection. Exemplar specimens were measured (standard length in mm), digitally photographed, and individually labeled with a field number attached to GPS coordinates and water quality data. Fish sizes are reported in millimeters standard length, or length to end of anal fin for Gymnotiformes. Tissue samples were excised using a sterilized scalpel and preserved in 100% ethanol in 1.8 mL vials with o-ring sealed caps, and then stored in a cool location at the base camp before transport to the laboratory. All voucher specimens were fixed in 10% formalin for at least 48 hours in a closed Nalgene container or covered flat plastic tray (for larger specimens), and later transferred to 70% ethanol. Fish specimens were collected under permits issued annually for each expedition from the Peruvian Ministry of the Environment, and all specimens were catalogued at the Museum of Natural History, University of San Marcos (MUSM), Lima. Images and collection data of all species are available from the project website at: www.ucs.louisiana.edu/~jxa4003/Alto%20Purús.html.
Quantitative comparisons of taxonomic composition (i.e., species lists) were made among each of the three headwater basins, and between habitat types within a basin, using standard diversity measures [129-131]. Alpha diversity was calculated as simply the number of species recorded at a local site. Changes in species composition were assessed using beta and gamma measures of diversity. Beta diversity between habitats was calculated as: β = (S1 − c) + (S2 − c), where S1 and S2 are the species richness values of adjacent habitats, and c is the number of species in common between two habitats. Gamma diversity between river basins was calculated as: γ = S1 + S2 − c. Qualitative comparisons of the taxonomic composition between upstream (>200 m) and downstream (<200 m) sites within a basin made using species presence and absence data from other faunal inventory projects conducted by the authors and colleagues (Figure 1(B); orange circles). Interregional comparisons were made by recording each species of the Fitzcarrald fish fauna as either present or absent in each of the freshwater ecoregions of tropical South America using a published dataset and methods [5]. Species presence data was based on confirmed identifications from catalogued museum records, photographs in literature reports, or in consultation with numerous specialists (see Acknowledgements). Ecoregion boundaries were defined primarily by hydrographic (river basin) limits, with some boundaries also defined using other landscape or physiographic discontinuities [132].
Distance between sampling locations were estimated using the Path function in Google Earth [133]. Distances were measured as Euclidean length, river channel length, and floodplain midline length. Floodplain midline distances are equivalent to the thalweg (valley line) of fluvial geomorphology signifying the deepest continuous line along the middle of a watercourse [134]. Sinuosity (meander ratio) is a measure of how much a river channel deviates from the shortest thalweg path. Sinuosity is calculated as river distance (=channel length) divided by floodplain midline distance, where the sinuosity of a straight river is 1.0 and higher ratios indicate greater sinuosity [72,135]. Sinuosity is highly correlated with stream velocity and sediment load, both quantities of which are maximized at a sinuosity of 1.0. Rivers with more meanders run more slowly and drop more sediment on the floodplain.
4. Conclusions
Accumulating evidence suggests that Neotropical fish species diversity is ancient, with regional species pools accumulating over tens of millions of years and over a geographical arena spanning multiple hydrogeographic basins. Similar patterns are also emerging for many elements of the Neotropical terrestrial biota, including amphibians [136-140], reptiles [141-144], birds [114,145-149], and mammals [119,150,151]. In other words, the exceptional species richness of local Amazonian assemblages is generally not the result of local diversification. Rather, species accumulated at a continental scale and over geological time frames. These patterns of biodiversity and biogeography at the species level have been observed in most if not all Neotropical fishes [5], and other taxa in which biotic diversification is bound by ecology and physiology to landscape history [152]. In almost all taxa, sympatric species assemblages are of polyphyletic origin, and comprise species with distributions that span far outside the area of sympatry and predate the Pleistocene climate oscillations; i.e., they are not the result of recent in situ radiations [24,52].
Comparisons of taxa distributed across the headwater tributaries of the Fitzcarrald region provide biogeographic tests for the generality of models on the formation of regional species pools. Interspecific phylogenies and phylogeographic (intraspecific) data do not in isolation provide rigorous tests for alternative hypotheses concerning the geography of speciation, because of the lability of geographical ranges and the lack of correlation between the role of adaptive processes and geographical mode of speciation [153-155]. However, concordances in species-area relationships and phylogeographic patterns among multiple taxa do help illuminate the sequence and relative timing of hydrological events (e.g., separation and merging headwaters) that may strongly influence the diversification of aquatic taxa [52,156].
The quantitative results of this study are sensitive to the finite sampling effort permitted by logistical constraints of working in such a remote region. Although the results reported in this study must be tested by additional sampling, the available data suggest that the ichthyofaunas of the Fitzcarrald region are not the result of localized or recent adaptive radiations.


| Ecoregion | Area km2 | FFS | % FFS | Total Species | FSS/Total species |
|---|---|---|---|---|---|
| 301–Atrato & NW Pac. Coast | 282,596 | 2 | 1% | 215 | 1% |
| 302–Magdalena & Sinu | 357,251 | 2 | 1% | 182 | 1% |
| 303–Maracaibo | 88,785 | 1 | 0% | 127 | 1% |
| 304–Caribbean Coast-Trinidad | 169,425 | 1 | 0% | 216 | 0% |
| 306–Orinoco Piedmont | 82,491 | 1 | 0% | 168 | 1% |
| 307–Orinoco-Llanos | 575,142 | 11 | 5% | 809 | 1% |
| 308–Orinoco-Guiana Shield | 348,090 | 4 | 2% | 637 | 1% |
| 309–Orinoco Delta & Coastal | 138,602 | 11 | 5% | 315 | 3% |
| 310–Essequibo | 182,512 | 11 | 5% | 301 | 4% |
| 311–Eastern Guiana | 336,492 | 7 | 3% | 413 | 2% |
| 312–Amazonas High Andes | 530,073 | 19 | 9% | 75 | 25% |
| 313–Marañon-Napo-Caqueta | 258,909 | 32 | 15% | 548 | 6% |
| 314–Rio Negro | 496,301 | 6 | 3% | 668 | 1% |
| 315–Amazonas Guiana Shield | 605,130 | 11 | 5% | 430 | 3% |
| 316–Amazonas Lowlands | 1,909,012 | 184 | 88% | 910 | 20% |
| 317–Ucayali-Urubamba | 104,605 | 101 | 49% | 224 | 45% |
| 318–Mamoré-Madre de Dios | 378,174 | 42 | 20% | 463 | 9% |
| 319–Guaporé-Itenez | 326,437 | 21 | 10% | 258 | 8% |
| 320–Tapajós-Juruena | 429,427 | 4 | 2% | 244 | 2% |
| 321–Madeira Brazilian Shield | 349,019 | 9 | 4% | 214 | 4% |
| 322–Xingu | 463,772 | 3 | 1% | 142 | 2% |
| 323–Amazonas Estuary | 580,379 | 9 | 4% | 243 | 4% |
| 324–Tocantins-Araguaia | 717,332 | 14 | 7% | 346 | 4% |
| 325–Maranho Piauí | 354,584 | 4 | 2% | 95 | 4% |
| 326–Mid-Northeast. Caatinga | 281,757 | 3 | 1% | 88 | 3% |
| 327-São Francisco | 592,794 | 5 | 2% | 181 | 3% |
| 328–Mata Atlantica | 454,322 | 2 | 1% | 180 | 1% |
| 329–Paraiba do Sul | 57,726 | 2 | 1% | 97 | 2% |
| 330–Ribeira do Iguape | 25,731 | 2 | 1% | 110 | 2% |
| 331–South Brazilian Coastal | 33,979 | 1 | 0% | 97 | 1% |
| 332–Lower Uruguay | 246,932 | 5 | 2% | 230 | 2% |
| 333–Upper Uruguay | 71,820 | 2 | 1% | 153 | 1% |
| 334–Laguna dos Patos Basin | 165,638 | 2 | 1% | 150 | 1% |
| 335–Tramandaí-Mampituba | 7,506 | 1 | 0% | 97 | 1% |
| 343–Paraguay | 492,705 | 2 | 1% | 332 | 1% |
| 344–Upper Parana | 751,513 | 3 | 1% | 258 | 1% |
| 345–Subtropical Potamic Axis | 586,319 | 5 | 2% | 331 | 2% |
| 346–Iguaçu | 60,664 | 1 | 0% | 68 | 1% |
| 352–Fluminense | 14,053 | 2 | 1% | 110 | 2% |
| TOTAL | 13,907,999 | 208 | 100% | 4,581 | 5% |
| MIN | 7,506 | 1 | 0% | 68 | 0% |
| MAX | 1,909,012 | 184 | 88% | 910 | 45% |
| AVG | 356,615 | 14 | 7% | 275 | 5% |
| Basin pair | Euclidean | Thalweg | Channel | Mean Sinuosity |
|---|---|---|---|---|
| AU-AY | 180 | 3,767 | 5,900 | 1.57 |
| AU-AP | 295 | 4,548 | 6,765 | 1.49 |
| AU-AM | 442 | 5,348 | 6,305 | 1.18 |
| AY-AP | 223 | 3,614 | 6,665 | 1.84 |
| AY-AM | 505 | 4,412 | 6,205 | 1.41 |
| Avg. | 329 | 4,338 | 6,368 | 1.50 |
| Stdev | 140 | 693 | 352 | 0.24 |
| min | 180 | 3,614 | 5,900 | 1.18 |
| max | 505 | 5,348 | 6,765 | 1.84 |
| max-min | 325 | 1,734 | 865 | 0.67 |
| range % | 0.64 | 0.32 | 0.13 | 0.36 |
| Basin | Base (Year) | Lat. Lon. | Alt. range | # stations | Field days | Vouch. Lots | Tot. Cat. Lots |
|---|---|---|---|---|---|---|---|
| Yuruá | Breu (2008) | 09°31′S 72°45′W | 232–260 m | 17 | 20 | 272 | 880 |
| Ucayali | Sepahua (2009) | 11°08′S 73°02′W | 273–310 m | 20 | 16 | 369 | 1,255 |
| Purús | Esperanza (2010) | 09°46′S 70°43′W | 212–259 m | 17 | 12 | 175 | 975 |
| Total | 53 | 48 | 816 | 3,110 | |||
Acknowledgements
We thank J. Armbruster, V. Bertaco, P. Buckup, C. Bührnheim, A. Cardoso, F. Carvalho, P. Chakrabarty, W. Costa, K. Ferreira, M. Hidalgo, C. Lucena, N. Lujan, J. Lundberg, R. Ramos, M. Rocha, M. Loebb, O. Shibatta and V. Tagliacollo for help with species identifications, J. Fredieu and J. Tang for curatorial assistance, F. Meyer and A. Takako for access to rare literature, and L. Anderson, W. Crampton, D. Johnson, H. López-Fernández, N. Lovejoy and K. Winemiller for discussions. This research was supported by NSF-DEB 0741450 to JSA, PP and RER.
Appendix
| Family | Genus species | Alto Yurúa | Alto Ucayali | Alto Purús | # basins | River | Stream | Lake | # habitats |
|---|---|---|---|---|---|---|---|---|---|
| Belonid | Pseudotylosurus angusticeps | X | X | X | 3 | X | X | 2 | |
| Anostomid | Leporellus vittatus | X | 1 | X | 1 | ||||
| Leporinus friderici | X | X | X | 3 | X | X | 2 | ||
| Leporinus striatus | X | 1 | X | 1 | |||||
| Leporinus trifasciatus | X | 1 | X | 1 | |||||
| Leporinus yophorus | X | X | 2 | X | 1 | ||||
| Schizodon fasciatus | X | 1 | X | 1 | |||||
| Characid | Acestrocephalus boehlkei | X | 1 | X | X | 2 | |||
| Aphyocharax pusillus | X | X | 2 | X | X | X | 3 | ||
| Astyanacinus multidens | X | 1 | X | X | 2 | ||||
| Astyanax abramis | X | X | 2 | X | X | 2 | |||
| Astyanax bimaculatus | X | X | 2 | X | X | X | 3 | ||
| Astyanax maximus | X | 1 | X | X | 2 | ||||
| Astyanax sp. 1 | X | 1 | X | 1 | |||||
| Astyanax sp. 2 | X | 1 | X | X | 2 | ||||
| Attonitus ephimeros | X | 1 | X | 1 | |||||
| Bryconacidnus sp | X | 1 | X | 1 | |||||
| Bryconamericus pachacuti | X | 1 | X | 1 | |||||
| Bryconamericus sp. 1 | X | 1 | X | 1 | |||||
| Bryconamericus sp. 2 | X | 1 | X | 1 | |||||
| Ceratobranchia obtusirostris | X | 1 | X | 1 | |||||
| Ceratobranchia sp. | X | 1 | X | 1 | |||||
| Charax sp. | X | X | 2 | X | X | 2 | |||
| Charax tectifer | X | 1 | X | 1 | |||||
| Clupeacharax anchoveoides | X | X | X | 3 | X | X | 2 | ||
| Creagrutus barrigai | X | X | 2 | X | X | 2 | |||
| Creagrutus changae | X | 1 | X | X | 2 | ||||
| Creagrutus occidaneus | X | 1 | X | X | 2 | ||||
| Creagrutus pila | X | 1 | X | X | 2 | ||||
| Creagrutus sp. | X | 1 | X | 1 | |||||
| Ctenobrycon hauxwellianus | X | X | X | 3 | X | X | 2 | ||
| Engraulisoma taeniatum | X | 1 | X | 1 | |||||
| Galeocharax gulo | X | X | 2 | X | X | 2 | |||
| Gephyrocharax sp. | X | X | X | 3 | X | X | 2 | ||
| Gymnocorymbus thayeri | X | 1 | X | 1 | |||||
| Hemibrycon jelskii | X | 1 | X | 1 | |||||
| Hemibrycon sp. | X | 1 | X | 1 | |||||
| Hemigrammus marginatus | X | 1 | X | X | 2 | ||||
| Knodus hypopterus | X | X | 2 | X | X | 2 | |||
| Knodus orteguasae | X | X | X | 3 | X | X | 2 | ||
| Knodus smithi | X | X | X | 3 | X | X | X | 3 | |
| Knodus sp. 1 | X | X | 2 | X | X | 2 | |||
| Knodus sp. 2 | X | 1 | X | 1 | |||||
| Knodus sp. 3 | X | 1 | X | 1 | |||||
| Knodus sp. 4 | X | 1 | X | 1 | |||||
| Leptagoniates steindachneri | X | X | 2 | X | X | 2 | |||
| Microgenys sp. | X | 1 | X | 1 | |||||
| Moenkhausia comma | X | 1 | X | 1 | |||||
| Moenkhausia dichroura | X | X | 2 | X | X | 2 | |||
| Moenkhausia intermedia | X | 1 | X | X | X | 3 | |||
| Moenkhausia oligolepis | X | X | X | 3 | X | X | 2 | ||
| Moenkhausia sp. | X | 1 | X | X | 2 | ||||
| Mylossoma aureum | X | 1 | X | 1 | |||||
| Mylossoma duriventre | X | 1 | X | 1 | |||||
| Odontostilbe euspilura | X | 1 | X | 1 | |||||
| Odontostilbe fugitiva | X | X | X | 3 | X | X | X | 3 | |
| Odontostilbe sp. “P” | X | X | 2 | X | X | X | 3 | ||
| Odontostilbe sp. 1 | X | 1 | 0 | ||||||
| Odontostilbe sp. 2 | X | 1 | X | X | 2 | ||||
| Paragoniates alburnus | X | X | 2 | X | X | 2 | |||
| Phenacogaster capitulatus | X | X | 2 | X | X | 2 | |||
| Prionobrama filigera | X | X | 2 | X | X | 2 | |||
| Prodontocharax melanotus | X | X | 2 | X | X | X | 3 | ||
| Roeboides affinis | X | 1 | X | 1 | |||||
| Roeboides myersii | X | 1 | X | 1 | |||||
| Scopaeocharax cf. rhinodus | X | 1 | X | 1 | |||||
| Salminus sp. | X | 1 | X | 1 | |||||
| Serrasalmus rhombeus | X | X | 2 | X | X | 2 | |||
| Serrapinnus sp. 1 | X | X | 2 | X | X | 2 | |||
| Tetragonopterus argentus | X | X | 2 | X | X | 2 | |||
| Triportheus albus | X | X | 2 | X | X | 2 | |||
| Triportheus angulatus | X | X | X | 3 | X | X | 2 | ||
| Xenurobrycon heterodon | X | X | 2 | X | X | X | 3 | ||
| Crenuchid | Characidium fasciatum | X | 1 | X | X | 2 | |||
| Characidium cf. purpuratum | X | 1 | X | 1 | |||||
| Characidium cf. steindachneri | X | 1 | X | 1 | |||||
| Characidium aff. zebra | X | 1 | X | X | 2 | ||||
| Characidium sp. 1 | X | 1 | X | 1 | |||||
| Characidium sp. 2 | X | 1 | X | 1 | |||||
| Characidium sp. 3 | X | 1 | X | 1 | |||||
| Characidium sp. 4 | X | 1 | X | 1 | |||||
| Geryichthys sterbai | X | 1 | X | 1 | |||||
| Curimatid | Curimatella meyeri | X | 1 | X | 1 | ||||
| Cyphocharax cf. festivus | X | 1 | X | 1 | |||||
| Cyphocharax spiluropsis | X | 1 | X | 1 | |||||
| Potamorhina altamazonica | X | X | 2 | X | X | 2 | |||
| Steindachnerina cf. dobula | X | X | 2 | X | X | 2 | |||
| Steindachnerina guentheri | X | X | X | 3 | X | X | 2 | ||
| Steindachnerina hypostoma | X | X | 2 | X | X | 2 | |||
| Steindachnerina aff. insculpta | X | 1 | X | 1 | |||||
| Steindachnerina leuscisca | X | 1 | X | X | 2 | ||||
| Erythrinae | Erythrinus erythrinus | X | 1 | X | 1 | ||||
| Hoplerythrinus uniaeniatus | X | 1 | X | 1 | |||||
| Hoplias malabaricus | X | X | X | 3 | X | X | 2 | ||
| Carnegiella myersi | X | 1 | X | 1 | |||||
| Gastropelecid | Thoracocharax stellatus | X | X | 2 | X | X | 2 | ||
| Lebiasinid | Copeina guttata | X | 1 | X | 1 | ||||
| Parodontid | Paradon pongoensis | X | X | 2 | X | X | 2 | ||
| Prochilodontid | Prochilodus nigricans | X | X | X | 3 | X | X | 2 | |
| Engraulid | Lycengraulis batesii | X | 1 | X | 1 | ||||
| Anchoviella carrikeri | X | 1 | X | X | 2 | ||||
| Rivulus sp. | X | X | 2 | X | X | 2 | |||
| Apteronotid | Apteronotus albifrons | X | 1 | X | 1 | ||||
| Sternarchorhynchus stewarti | X | 1 | X | 1 | |||||
| Sternarchorhynchus sp. | X | X | 2 | X | X | 2 | |||
| Gymnotid | Electrophorus electricus | X | X | 2 | X | X | 2 | ||
| Gymnotus carapo | X | X | X | 3 | X | X | 2 | ||
| Gymnotus chaviro | X | X | 2 | X | 1 | ||||
| Gymnotus ucamara | X | 1 | X | X | 2 | ||||
| Hypopomid | Brachyhypopomus cf. beebei | X | 1 | X | 1 | ||||
| Sternopygid | Eigenmannia virescens | X | 1 | X | X | 2 | |||
| Sternopygus macrurus | X | X | 2 | X | X | X | 3 | ||
| Cichlid | Aequidens tetramerus | X | 1 | X | 1 | ||||
| Bujurquina cf. eurhinus | X | 1 | X | 1 | |||||
| Bujurquina robusta | X | X | 2 | X | X | 2 | |||
| Cichlasoma amazonarum | X | 1 | X | 1 | |||||
| Cichlasoma boliviense | X | 1 | X | 1 | |||||
| Cichlasoma sp. 1 | X | 1 | X | 1 | |||||
| Crenicichla proteus | X | 1 | X | X | 2 | ||||
| Crenicichla sedentaria | X | X | 2 | X | X | X | 3 | ||
| Crenicichla semicincta | X | X | 2 | X | X | 2 | |||
| Pachyurus schomburgkii | X | 1 | X | 1 | |||||
| Pachyurus cf. stewarti | X | 1 | X | X | 2 | ||||
| Plagioscion squamosissimus | X | 1 | X | 1 | |||||
| Achirid | Apionichthys finis | X | X | 2 | X | 1 | |||
| Hypoclinemus mentalis | X | 1 | X | 1 | |||||
| Aspredinid | Bunocephalus coracoideus | X | 1 | X | 1 | ||||
| Pseudobunocephalus bifidus | X | 1 | X | 1 | |||||
| Auchenipterid | Centromochlus perugiae | X | 1 | X | 1 | ||||
| Callichthyid | Callichthys callichthys | X | 1 | X | 1 | ||||
| Corydoras aeneus | X | 1 | X | 1 | |||||
| Corydoras stenocephalus | X | 1 | X | 1 | |||||
| Lepthoplosternum altamazonicum | X | 1 | X | 1 | |||||
| Lepthoplosternum cf. stellatum | X | 1 | X | 1 | |||||
| Dianema longibarbis | X | 1 | X | 1 | |||||
| Cetopsid | Cetopsis coecutiens | X | 1 | X | 1 | ||||
| Doradid | Nemadoras sp. | X | 1 | X | X | 2 | |||
| Trachydoras steindachneri | X | 1 | X | 1 | |||||
| Heptapterid | Cetopsorhamdia phantasia | X | 1 | X | 1 | ||||
| Cetopsorhamdia sp. | X | 1 | X | 1 | |||||
| Chasmocranus sp. | X | 1 | X | 1 | |||||
| Imparfinis stictonotus | X | X | X | 3 | X | X | X | 3 | |
| Phenacorhamdia sp. | X | 1 | X | 1 | |||||
| Pimelodella cf. gracilis | X | 1 | X | 1 | |||||
| Pimelodella sp. 1 | X | X | 2 | X | 1 | ||||
| Pimelodella sp. 2 | X | X | 2 | X | X | 2 | |||
| Rhamdia quelen | X | 1 | X | X | 2 | ||||
| Loricariid | Ancistrus sp. 1 | X | 1 | X | 1 | ||||
| Ancistrus sp. 2 | X | 1 | X | 1 | |||||
| Ancistrus sp. 3 | X | 1 | X | 1 | |||||
| Ancistrus sp. 4 | X | X | 2 | X | 1 | ||||
| Ancistrus sp. 5 | X | X | 2 | X | 1 | ||||
| Ancistrus sp. 6 | X | 1 | X | 1 | |||||
| Ancistrus sp. 7 | X | 1 | X | X | 2 | ||||
| Chaetostoma lineopunctatum | X | 1 | X | 1 | |||||
| Crossoloricaria rhami | X | 1 | X | 1 | |||||
| Farlowella kneri | X | 1 | X | 1 | |||||
| Farlowella nattereri | X | X | 2 | X | X | 2 | |||
| Farlowella smithi | X | 1 | X | 1 | |||||
| Furcodontichthys cf. novaesi | X | 1 | X | 1 | |||||
| Hemiodontichthys acipenserinus | X | X | 2 | X | X | 2 | |||
| Hypoptopoma thoracatum | X | 1 | X | 1 | |||||
| Hypostomus cf. emarginatus | X | X | X | 3 | X | X | 2 | ||
| Hypostomus cf. pyrineusi | X | 1 | X | 1 | |||||
| Hypostomus pyrineusi | X | X | 2 | X | X | 2 | |||
| Hypostomus unicolor | X | X | X | 3 | X | X | 2 | ||
| Hypostomus sp. 1 (black dots) | X | X | 2 | X | X | 2 | |||
| Hypostomus sp. 2 | X | X | 2 | X | 1 | ||||
| Lamontichthys filamentosus | X | X | 2 | X | X | 2 | |||
| Lasiancistrus schomburgkii | X | X | 2 | X | X | 2 | |||
| Limatulichthys griseus | X | X | 2 | X | X | 2 | |||
| Loricaria sp. | X | X | X | 3 | X | X | 2 | ||
| Loricariichthys sp. | X | 1 | X | X | 2 | ||||
| Panaque albomaculatus | X | 1 | X | 1 | |||||
| Panaque changae | X | X | X | 3 | X | 1 | |||
| Panaque purusiensis | X | 1 | X | 1 | |||||
| Panaque schaeferi | X | 1 | X | 1 | |||||
| Peckoltia brevis | X | 1 | X | 1 | |||||
| Pterygoplichthys lituratus | X | 1 | X | 1 | |||||
| Pterygoplichthys punctatus | X | 1 | X | 1 | |||||
| Pterygoplichthys pardalis | X | 1 | X | 1 | |||||
| Rineloricaria lanceolata | X | 1 | X | 1 | |||||
| Spatuloricaria puganensis | X | X | 2 | X | 1 | ||||
| Sturisoma nigrirostrum | X | 1 | X | X | 2 | ||||
| Sturisoma sp. 1 | X | 1 | X | X | 2 | ||||
| Pimelodid | Brachyplatystoma juruense | X | X | 2 | X | 1 | |||
| Brachyplatystoma rousseauxii | X | 1 | X | 1 | |||||
| Calophysus macropterus | X | X | X | 3 | X | 1 | |||
| Cheirocerus eques | X | X | 2 | X | X | 2 | |||
| Megalonema amaxanthum | X | X | 2 | X | 1 | ||||
| Megalonema platycephalum | X | X | 2 | X | 1 | ||||
| Pimelodus blochi | X | X | 2 | X | X | X | 3 | ||
| Pimelodus ornatus | X | 1 | X | 1 | |||||
| Pimelodus pictus | X | 1 | X | 1 | |||||
| Pimelodus sp. 1 | X | X | X | 3 | X | X | X | 3 | |
| Pimelodus sp. 2 | X | 1 | X | 1 | |||||
| Pinirampus pirinampu | X | X | 2 | X | 1 | ||||
| Platystomatichthys sturio | X | 1 | X | 1 | |||||
| Platysilurus mucosus | X | 1 | X | 1 | |||||
| Sorubim lima | X | 1 | X | X | 2 | ||||
| Pseudopimelodid | Batrochoglanis raninus | X | 1 | X | 1 | ||||
| Pseudopimelodus pulcher | X | X | 2 | X | X | 2 | |||
| Trichomycterid | Acanthopoma annectens | X | X | 2 | X | X | 2 | ||
| Henonemus punctatus | X | 1 | X | 1 | |||||
| Plectrochilus sp. | X | 1 | X | 1 | |||||
| Pseudostegophilus nemurus | X | 1 | X | X | 2 | ||||
| Tridentopsis pearsoni | X | 1 | X | 1 | |||||
| Synbranchid | Synbranchus madeirae | X | 1 | X | 1 | ||||
| Total | 115 | 97 | 94 | 114 | 138 | 58 | |||
| %Total | 0.55 | 0.47 | 0.45 | 0.55 | 0.66 | 0.28 |
References and Notes
- Gentry, A.H. Neotropical floristic diversity—Phytogeographical connections between Central and South America, Pleistocene climatic fluctuations, or an accident of the Andean orogeny? Ann. Mo. Bot. Gard. 1982, 69, 557–593. [Google Scholar]
- Moritz, C.; Patton, J.L.; Schneider, C.J.; Smith, T.B. Diversification of rainforest faunas: An integrated molecular approach. Annu. Rev. Ecol. Syst. 2000, 31, 533–563. [Google Scholar]
- Lundberg, J.G.; Kottelat, M.; Smith, G.R.; Stiassny, M.L.J.; Gill, A.C. So many fishes, so little time: An overview of recent ichthyological discovery in continental waters. Ann. Mo. Bot. Gard. 2000, 87, 26–62. [Google Scholar]
- Leveque, C.; Oberdorff, T.; Paugy, D.; Stiassny, M.L.J.; Tedesco, P.A. Global diversity of fish (Pisces) in freshwater. Hydrobiologia 2008, 595, 545–567. [Google Scholar]
- Albert, J.S.; Petry, P.; Reis, R.E. Major Biogeographic and Phylogenetic Patterns. In Historical Biogeography of Neotropical Freshwater Fishes; Albert, J.S., Reis, R.E., Eds.; University of California Press: Berkeley, CA, USA, 2011; pp. 21–57. [Google Scholar]
- Hutchinson, G.E. Homage to Santa Rosalia or Why are there so many kinds of animals? Am. Naturalist 1959, 93, 145. [Google Scholar]
- Hutchinson, G.E. Concluding remarks. Cold Spring Harb. Symp. Quant. Biol. 1957, 22, 415–427. [Google Scholar]
- Darwin, C.R. On the Origin of Species by Means of Natural Selection, or the Preservation of Favoured Races in the Struggle For Life; John Murray: London, UK, 1859. [Google Scholar]
- Gause, G.F. The Struggle For Existence; Williams and Wilkins: Baltimore, MD, USA, 1934; p. 163. [Google Scholar]
- Brown, J.H. Two decades of homage to santa rosalia: Toward a general theory of diversity. Amer. Zool. 1981, 21, 877–888. [Google Scholar]
- Wright, S.J. Plant diversity in tropical forests: A review of mechanisms of species coexistence. Oecologia 2002, 130, 1–14. [Google Scholar]
- Whittaker, R.H. Evolution of species diversity in land communities. In Evolutionary Biology; Hecht, M.K., Steere, W.C., Wallace, B., Eds.; Plenum Press: New York, NY, USA, 1977; Volume 10, pp. 1–67. [Google Scholar]
- Zobel, M. The relative of species pools in determining plant species richness: An alternative explanation of species coexistence? Trend. Ecol. Evolut. 1997, 12, 266–269. [Google Scholar]
- Hawkins, B.A.; Diniz-Filho, J.A.F.; Jaramillo, C.A.; Soeller, S.A. Climate, niche conservatism, and the global bird diversity gradient. Am. Naturalist 2007, 170, S16–S27. [Google Scholar]
- Field, R.; Hawkins, B.A.; Cornell, H.V.; Currie, D.J.; Diniz-Filho, J.A.F.; Guegan, J.F.; Kaufman, D.M.; Kerr, J.T.; Mittelbach, G.G.; Oberdorff, T.; et al. Spatial species-richness gradients across scales: A meta-analysis. J. Biogeogr. 2009, 36, 132–147. [Google Scholar]
- Taylor, D.R.; Aarssen, L.W.; Loehle, C. On the relationship between r/K selection and environmental carrying capacity: A new habitat templet for plant life history strategies. Oikos 1990, 58, 239–250. [Google Scholar]
- Butaye, J.; Jacquemyn, H.; Honnay, O.; Hermy, M. The species pool concept applied to forests in a fragmented landscape: Dispersal limitation versus habitat limitation. J. Veg. Sci. 2002, 13, 27–34. [Google Scholar]
- Witman, J.D.; Etter, R.J.; Smith, F. The relationship between regional and local species diversity in marine benthic communities: A global perspective. Proc. Nat. Acad. Sci. USA 2004, 101, 15664–15669. [Google Scholar]
- McPeek, M.A. The macroevolutionary consequences of ecological differences among species. Palaeontology 2007, 50, 111–129. [Google Scholar]
- Stanley, S.M. Macroevolution Pattern and Process; The Johns Hopkins University Press: Baltimore, MD, USA, 1998; p. 332. [Google Scholar]
- Jablonski, D. Micro- and macroevolution: Scale and hierarchy in evolutionary biology and paleobiology. Paleobiology 2000, 26, 15–52. [Google Scholar]
- Jablonski, D.; Roy, K.; Valentine, J.W. Out of the tropics: Evolutionary dynamics of the latitudinal diversity gradient. Science 2006, 314, 102–106. [Google Scholar]
- Roy, K.; Goldberg, E.E. Origination, extinction, and dispersal: Integrative models for understanding present-day diversity gradients. Am. Naturalist 2007, 170, S71–S85. [Google Scholar]
- Albert, J.S.; Carvalho, T.P. Neogene Assembly of Modern Faunas. In Historical Biogeography of Neotropical Freshwater Fishes; Albert, J.S., Reis, R.E., Eds.; University of California Press: Berkeley, CA, USA, 2011; pp. 119–136. [Google Scholar]
- Brokaw, N.; Busing, R.T. Niche versus chance and tree diversity in forest gaps. Trend. Ecol. Evolut. 2000, 15, 183–188. [Google Scholar]
- Chave, J.; Muller-Landau, H.C.; Levin, S.A. Comparing classical community models: Theoretical consequences for patterns of diversity. Am. Naturalist 2002, 159, 1–23. [Google Scholar]
- Valencia, R.; Foster, R.B.; Villa, G.; Condit, R.; Svenning, J.C.; Hernandez, C.; Romoleroux, K.; Losos, E.; Magard, E.; Balslev, H. Tree species distributions and local habitat variation in the Amazon: Large forest plot in eastern Ecuador. J. Ecol. 2004, 92, 214–229. [Google Scholar]
- Evans, K.L.; Warren, P.H.; Gaston, K.J. Species-energy relationships at the macroecological scale: A review of the mechanisms. Biol. Rev. 2005, 80, 1–25. [Google Scholar]
- Hubbell, S.P. Neutral theory in community ecology and the hypothesis of functional equivalence. Funct. Ecol. 2005, 19, 166–172. [Google Scholar]
- Sousa, W.P. Intertidal mosaics—Patch size, propagule availability, and spatially-variable patterns of succession. Ecology 1984, 65, 1918–1935. [Google Scholar]
- Shulman, M.J. Recruitment of coral-reef fishes—Effects of distribution of predators and shelter. Ecology 1985, 66, 1056–1066. [Google Scholar]
- Lewis, S.M. The role of herbivorous fishes in the organization of a Caribbean reef community. Ecol. Monogr. 1986, 56, 183–200. [Google Scholar]
- Dugan, J.E.; Davis, G.E. Applications of marine refugia to coastal fisheries management. Can. J. Fisheries Aquat. Sci. 1993, 50, 2029–2042. [Google Scholar]
- Hunt, H.L.; Scheibling, R.E. Role of early post-settlement mortality in recruitment of benthic marine invertebrates. Mar. Ecol. Progr. Ser. 1997, 155, 269–301. [Google Scholar]
- Eggleston, D.B.; Etherington, L.L.; Elis, W.E. Organism response to habitat patchiness: Species and habitat-dependent recruitment of decapod crustaceans. J. Exp. Mar. Biol. Ecol. 1998, 223, 111–132. [Google Scholar]
- Brendonck, L.; De Meester, L. Egg banks in freshwater zooplankton: Evolutionary and ecological archives in the sediment. Hydrobiologia 2003, 491, 65–84. [Google Scholar]
- Sisk, T.D.; Haddad, N.M.; Ehrlich, P.R. Bird assemblages in patchy woodlands: Modeling the effects of edge and matrix habitats. Ecol. Appl. 1997, 7, 1170–1180. [Google Scholar]
- Vitt, L.J.; Avila-Pires, T.C.S.; Caldwell, J.P.; Oliveira, V.R.L. The impact of individual tree harvesting on thermal environments of lizards in Amazonian rain forest. Conserv. Biol. 1998, 12, 654–664. [Google Scholar]
- Gaston, K.J.; Chown, S.L. Elevation and climatic tolerance: A test using dung beetles. Oikos 1999, 86, 584–590. [Google Scholar]
- Voeten, M.M.; Prins, H.H.T. Resource partitioning between sympatric wild and domestic herbivores in the Tarangire region of Tanzania. Oecologia 1999, 120, 287–294. [Google Scholar]
- Abrahamczyk, S.; Kessler, M. Hummingbird diversity, food niche characters, and assemblage composition along a latitudinal precipitation gradient in the Bolivian lowlands. J. Ornithol. 2010, 151, 615–625. [Google Scholar]
- Bihn, J.H.; Gebauer, G.; Brandl, R. Loss of functional diversity of ant assemblages in secondary tropical forests. Ecology 2010, 91, 782–792. [Google Scholar]
- Fork, S.K. Arthropod Assemblages on Native and Nonnative Plant Species of a Coastal Reserve in California. Environ. Entomol. 2010, 39, 753–762. [Google Scholar]
- Matthews, W.J. Patterns in Freshwater Fish Ecology; Chapman and Hall: London, UK, 1998; p. 756. [Google Scholar]
- Arrington, D.A.; Winemiller, K.O.; Layman, C.A. Community assembly at the patch scale in a species rich tropical river. Oecologia 2005, 144, 157–167. [Google Scholar]
- Granado-Lorencio, C.; Lima, C.; Lobon-Cervia, J. Abundance-distribution relationships in fish assembly of the Amazonas floodplain lakes. Ecography 2005, 28, 515–520. [Google Scholar]
- Leveque, C.; Balian, E.V.; Martens, K. An assessment of animal species diversity in continental waters. Hydrobiologia 2005, 542, 39–67. [Google Scholar]
- Smith, S.A.; Bermingham, E. The biogeography of lower Mesoamerican freshwater fishes. J. Biogeogr. 2005, 32, 1835–1854. [Google Scholar]
- McPeek, M.A. The ecological dynamics of clade diversification and community assembly. Am. Naturalist 2008, 172, E270–E284. [Google Scholar]
- Lundberg, J.G. The Temporal Context for the Diversification of Neotropical Fishes. In Phylogeny and Classification of Neotropical Fishes; Malabarba, L.R., Reis, R.E., Vari, R.P., Lucena, Z.M.S., Lucena, C.A.S., Eds.; Museu de Ciências e Tecnologia: Porto Alegre, Brazil, 1998; pp. 49–68. [Google Scholar]
- Winemiller, K.O.; Lopez-Fernandez, H.; Taphorn, D.C.; Nico, L.G.; Duque, A.B. Fish assemblages of the Casiquiare River, a corridor and zoogeographical filter for dispersal between the Orinoco and Amazon basins. J. Biogeogr. 2008, 35, 1551–1563. [Google Scholar]
- Lovejoy, N.R.; Willis, S.C.; Albert, J.S. Molecular Signatures of Neogene Biogeographic Events in the Amazon Fish Fauna. In Amazonia, Landscape and Species Evolution, 1st ed.; Hoorn, C.M., Wesselingh, F.P., Eds.; Blackwell Publishing: London, UK, 2010; pp. 405–417. [Google Scholar]
- Lundberg, J.G.; Sabaj Pérez, M.H.; Dahdul, W.M.; Orangel, A.; Aguilera, S. The Amazonian Neogene Fish Fauna. In Neogene History of Western Amazonia and its Significance for Modern Biodiversity; Hoorn, C.M., Wesselingh, F., Eds.; Blackwell Publishing: London, UK, 2010; Chapter 17. [Google Scholar]
- Albert, J.S.; Reis, R.E. Historical Biogeography of Neotropical Freshwater Fishes, 1st ed.; University of California Press: Berkeley, CA, USA, 2011; p. 424. [Google Scholar]
- Chang, F. La Pesquería en Madre de Dios, Perú. In Manjeo y Conservacion de Fauna Silvestre en America Latina; Fang, T.G., Montenegro, O.L., Bodmer, R.E., Eds.; Instituto de Ecologia: La Paz, Bolivia, 1999; pp. 227–236. [Google Scholar]
- Silvano, R.A.M.; do Amaral, B.D.; Oyakawa, O.T. Spatial and temporal patterns of diversity and distribution of the Upper Jurua River fish community (Brazilian Amazon). Environ. Biol. Fish. 2000, 57, 25–35. [Google Scholar]
- Silvano, R.A.M.; Oyakawa, O.T.; Amaral, B.D.D.; Begossi, A. Peixes do Alto Rio Juruá (Amazônia, Brasil); Editora da Universidade de São Paulo: São Paulo, Brazil, 2001; p. 301. [Google Scholar]
- Ortega, H.; Hidalgo, M.; Castro, E.; Riofrio, C.; Salcedo, N. Peces de la Cuenca del Río Bajo Urubamba, UCAYALI–CUSCO, PERU; Biodiversity Assessment & Monitoring Program MAB Series 3; Smithsonian Institution: Washington, DC, USA, 2002. [Google Scholar]
- Goulding, M.; Canas, C.; Barthem, R.; Forsberg, B.; Ortega, H. Amazon Headwaters. Rivers, Life and Conservation of the Madre de Dios River Basin; Gráfica Biblos S.A.: Lima, Peru, 2003; p. 198. [Google Scholar]
- Ortega, H.; Hidalgo, M. Los Peces del río Yavarí. In Yavari: Rapid Biological Inventories Report 11; Pitman, N., Vriesendorp, C., Moskovits, D., Eds.; The Field Museum: Chicago, IL, USA, 2003. [Google Scholar]
- Ortega, H.; Rham, P.D. Los Peces del Río Purús. In Diversidad Biologica en Purus, Peru; Leite-Pitman, R., Ed.; Duke University Press: Durham, NC, USA, 2003; pp. 84–87. [Google Scholar]
- Rengifo, B. Diversidad de peces en la cuenca del Alto Yuruá (Ucayali, Perú). Revista Perúana de Biologia 2007, 13, 195–202. [Google Scholar]
- Ortega, H.; Hidalgo, M. Freshwater fishes and aquatic habitats in Peru: Current knowledge and conservation. Aquat. Ecosys. Health Manag. 2008, 11, 257–271. [Google Scholar]
- Carvalho, T.P.; Tang, S.J.; Fredieu, J.I.; Corahua, I.; Quispe, R.; Ortega, H.; Albert, J.S. Fishes from the Alto Yuruá, Amazon Basin, Perú. Checklist 2009, 5, 673–691. [Google Scholar]
- Carvalho, T.P.; Espino, J.; Maxime, E.L.; Quispe, R.; Rengifo, B.; Ortega, H.; Albert, J.S. Fishes from the Lower Urubamba river near Sepahua, Amazon Basin, Peru. Checklist 2011. in press. [Google Scholar]
- Crampton, W.G.R. Diversity and Conservation of the Fishes of the Amazon Basin. In Amazonia: Principles of Sustainable Development; Paitán, S., Ed.; UNAP-World Bank: Lima, Peru, 2001; pp. 121–140. [Google Scholar]
- Rapp-Py-Daniel, L.; Deus, C.P. Avaliação preliminar da ictiofauna e comentários sobre a pesca no baixo Rio Purus. In Piagaçu-Purus: Bases científicas para a criação de uma Reserva de Desenvolvimento Sustentável; Deus, C.P., Silveira, R., Rapp-Py-Daniel, L., Eds.; Instituto de Desenvolvimento Sustentável Mamirauá: Tefé, Brazil, 2003; pp. 31–47. [Google Scholar]
- Correa, S.B.; Crampton, W.G.R.; Albert, J.S. Three new species of the neotropical electric fish Rhabdolichops (Gymnotiformes: Sternopygidae) from the central Amazon, with a new diagnosis of the genus. Copeia 2006, 2006, 27–42. [Google Scholar]
- Fetzner, J.W.J.; Crandall, K.A. Linear habitats and the Nested Clade Analysis: An empirical evaluation of geographic versus river distances using an Ozark crayfish (Decapoda: Cambaridae). Evolution 2003, 57, 2101–2118. [Google Scholar]
- Peterson, E.E.; Theobald, D.M.; Ver Hoef, J.M. Geostatistical modelling on stream networks: Developing valid covariance matrices based on hydrologic distance and stream flow. Freshwater Biol. 2007, 52, 267–279. [Google Scholar]
- Crampton, W.G.R. An Ecological Perspective on Diversity and Distributions. In Historical Biogeography of Neotropical Freshwater Fishes; Albert, J.S., Reis, R.E., Eds.; University of California Press: Berkeley, CA, USA, 2011; pp. 165–191. [Google Scholar]
- Leopold, L.B.; Wolman, M.G.; Miller, J.P. Fluvial Processes in Geomorphology; W. H. Freeman and Co.: San Francisco, CA, USA, 1964; p. 522. [Google Scholar]
- Bridge, J.S. Rivers and Floodplains: Forms, Processes, and Sedimentary Record; Blackwell Science: Oxford, UK, 2003; p. 487. [Google Scholar]
- Goulding, S.E.; Olmstead, R.G.; Morden, C.W.; Wolfe, K.H. Ebb and flow of the chloroplast inverted repeat. Mol. Gen. Genet. 1996, 252, 195–206. [Google Scholar]
- Latrubesse, E.M.; Stevaux, J.C.; Sinha, R. Tropical rivers. Geomorphology 2005, 70, 187–206. [Google Scholar]
- Mertes, L.A.K.; Dunne, T.; Martinelli, L.A. Channel-floodplain geomorphology along the Solimões-Amazon River, Brazil. Geol. Soc. Amer. Bull. 1996, 108, 1089–1107. [Google Scholar]
- Stølum, H.H. Planform geometry and dynamics of meandering rivers. Geol. Soc. Amer. Bull. 1998, 110, 1485–1498. [Google Scholar]
- Costa, M.H.; Henrique, C.; Oliveira, C.; Andrade, R.G.; Bustamante, T.R.; Silva, F.A. A macroscale hydrological data set of river flow routing parameters for the Amazon Basin. J. Geophys. Res. 2002, 17, 1–9. [Google Scholar]
- Latrubesse, E.M. Patterns of anabranching channels: The ultimate end-member adjustment of mega rivers. Geomorphology 2008, 101, 130–145. [Google Scholar]
- Preston, F.W. The Canonical Distribution of Commonness and Rarity: Part I. Ecology 1962, 43, 185–215. [Google Scholar]
- Soberon, J.; Llorente, J. The use of species accumulation functions for the prediction of species richness. Conserv. Biol. 1993, 7, 480–488. [Google Scholar]
- Gotelli, N.J.; Colwell, R.K. Quantifying biodiversity: Procedures and pitfalls in the measurement and comparison of species richness. Ecol. Lett. 2001, 4, 379–391. [Google Scholar]
- Moreno, C.E.; Halffter, G. On the measure of sampling effort used in species accumulation curves. J. Appl. Ecol. 2001, 38, 487–490. [Google Scholar]
- Diaz-Frances, E.; Soberon, J. Statistical estimation and model selection of species-accumulation functions. Conserv. Biol. 2005, 19, 569–573. [Google Scholar]
- Correa, S.B.; Crampton, W.G.R.; Chapman, L.J.; Albert, J.S. A comparison of flooded forest and floating meadow fish assemblages in an upper Amazon floodplain. J. Fish Biol. 2008, 72, 629–644. [Google Scholar]
- Leite-Pitman, R.; Pitman, N.; Álvarez, P. Alto Purús: Biodiversidad, Conservación y Manejo; Center for Tropical Conservation: Lima, Peru, 2003; p. 350. [Google Scholar]
- Reis, R.E.; Kullander, S.O.; Ferraris, C.J. Checklist of the Freshwater Fishes of South and Central America; Edipucrs: Porto Alegre, Brazil, 2003; p. 735. [Google Scholar]
- Anjos, M.B.; Zuanon, J. Sampling effort and fish species richness in small terra firme forest streams of central Amazonia, Brazil. Neotrop. Ichthyol. 2007, 5, 45–52. [Google Scholar]
- Albert, J.S.; Bart, H.J.; Reis, R.E. Species Richness and Cladal Diversity. In Historical Biogeography of Neotropical Freshwater Fishes; Albert, J.S., Reis, R.E., Eds.; University of California Press: Berkeley, CA, USA, 2011; pp. 89–104. [Google Scholar]
- Crampton, W.G.R. Effects of anoxia on the distribution, respiratory strategies and electric signal diversity of Gymnotiform fishes. J. Fish Biol. 1998, 53, 502–520. [Google Scholar]
- Lewis, S.L.; Brando, P.M.; Phillips, O.L.; van der Heijden, G.M.F.; Nepstad, D. The 2010 Amazon Drought. Science 2011, 331, 554. [Google Scholar]
- Reis, R.E. Revision of the neotropical catfish genus Hoplosternum (Ostariophysi: Siluriformes: Callichthyidae), with the description of two new genera and three new species. Ichthyol. Explor. Freshw. 1997, 7, 299–326. [Google Scholar]
- Lehmann, P.; Reis, R.E. Callichthys serralabium: A new species of neotropical catfish from the upper Orinoco and Negro Rivers (Siluriformes: Callichthyidae). Copeia 2004, 2004, 336–343. [Google Scholar]
- Jegu, M.; Keith, P. Lower Oyapock River as northern limit for the Western Amazon fish fauna or only a stage in its northward progression. C. R. Acad. Sci. Ser. III-VIE 1999, 322, 1133–1143. [Google Scholar]
- Ibarra, M.; Stewart, D.J. Longitudinal zonation of sandy beach fishes in the Napo River Basin, Eastern Ecuador. Copeia 1989, 1989, 364–381. [Google Scholar]
- Galacatos, K.; Stewart, D.J.; Ibarra, M. Fish community patterns of lagoons and associated tributaries in the Ecuadorian Amazon. Copeia 1996, 1996, 875–894. [Google Scholar]
- Hoeinghaus, D.J.; Winemiller, K.O.; Taphorn, D.C. Compositional change in fish assemblages along the Andean piedmont—Llanos floodplain gradient of the río Portuguesa, Venezuela. Neotrop. Ichthyol. 2004, 2, 85–92. [Google Scholar]
- Súarez, Y.R.; Petrere, M. Environmental factors predicting fish community structure in two neotropical rivers in Brazil. Neotrop. Ichthyol. 2007, 5, 61–68. [Google Scholar]
- Maxime, E.L.; Albert, J.S. A new species of Gymnotus (Gymnotiformes, Gymnotidae) from the Fitzcarrald Arch of southeastern Peru. Neotrop. Ichthyol. 2009, 7, 579–586. [Google Scholar]
- Lucena, Z.M.S.D.; Malabarba, L.R. Description of nine new species of Phenacogaster (Ostariophysi: Characiformes: Characidae) and notes on the other species of genus. Zoologia (Curitiba, Impresso) 2010, 27, 263–304. [Google Scholar]
- Kullander, S.O. The Cichlid Fishes of the Amazon River Drainage of Peru; Swedish Museum of Natural History: Stockholm, Sweden, 1986. [Google Scholar]
- Soria-Auza, R.W.; Kessler, M. The influence of sampling intensity on the perception of the spatial distribution of tropical diversity and endemism: A case study of ferns from Bolivia. Divers. Distrib. 2008, 14, 123–130. [Google Scholar]
- Westaway, R. Late Cenozoic sedimentary sequences in Acre state, southwestern Amazonia: Fluvial or tidal? Deductions from the IGCP 449 fieldtrip. J. S. Am. Earth Sci. 2006, 21, 120–134. [Google Scholar]
- Antoine, P.O.; Salas-Gismondi, R.; Baby, P.; Benammi, M.; Brusset, S.; de Franceschi, D.; Espurt, N.; Goillot, C.; Pujos, F.; Tejada, J.; Urbina, M. The Middle Miocene (Laventan) Fitzcarrald Fuana, Amazonian Peru. Proceedings of 4th European Meeting on the Palaeontology and Stratigraphy of Latin America, Madrid, Spain, 12–15 September 2007.
- Espurt, N.; Baby, P.; Brusset, S.; Roddaz, M.; Hermoza, W.; Regard, V.; Antoine, P.O.; Salas-Gismondi, R.; Bolanos, R. How does the Nazca Ridge subduction influence the modern Amazonian foreland basin? Geology 2007, 35, 515–518. [Google Scholar]
- Regard, V.; Lagnous, R.; Espurt, N.; Darrozes, J.; Baby, P.; Roddaz, M.; Calderon, Y.; Hermoza, W. Geomorphic evidence for recent uplift of the Fitzcarrald Arch (Peru): A response to the Nazca Ridge subduction. Geomorphology 2009, 107, 107–117. [Google Scholar]
- Albert, J.S.; Lovejoy, N.R.; Crampton, W.G.R. Miocene tectonism and the separation of cis- and trans-Andean river basins: Evidence from Neotropical fishes. J. S. Am. Earth Sci. 2006, 21, 14–27. [Google Scholar]
- Hardman, M.; Lundberg, J.G. Molecular phylogeny and a chronology of diversification for “phractocephaline” catfishes (Siluriformes: Pimelodidae) based on mitochondrial DNA and nuclear recombination activating gene 2 sequences. Mol. Phylogenet. Evol. 2006, 40, 410–418. [Google Scholar]
- Hrbek, T.; Kucuk, F.; Frickey, T.; Stolting, K.N.; Wildekamp, R.H.; Meyer, A. Molecular phylogeny and historical biogeography of the Aphanius (Pisces, Cyprinodontiformes) species complex of central Anatolia, Turkey. Mol. Phylogenet. Evol. 2002, 25, 125–137. [Google Scholar]
- Hrbek, T.; Seckinger, J.; Meyer, A. A phylogenetic and biogeograpical perspective on the evolution of poeciliid fishes. Mol. Phylogenet. Evol. 2006, 43, 986–998. [Google Scholar]
- Lovejoy, N.R.; Araújo, M.L.G.D. Molecular systematics, biogeography, and population structure of Neotropical freshwater needlefishes of the genus Potamorrhaphis. Mol. Ecol. 2000, 9, 259–268. [Google Scholar]
- Montoya-Burgos, J.I. Historical biogeography of the catfish genus Hypostomus (Siluriformes: Loricariidae), with implications on the diversification of Neotropical ichthyofauna. Mol. Ecol. 2003, 12, 1855–1867. [Google Scholar]
- Sivasundar, A.; Bermingham, E.; Orti, G. Population structure and biogeography of migratory freshwater fishes (Prochilodus: Characiformes) in major South American rivers. Mol. Ecol. 2001, 10, 407–417. [Google Scholar]
- Weir, J.T. Divergent timing and patterns of species accumulation in lowland and highland neotropical birds. Evolution 2006, 60, 842–855. [Google Scholar]
- Potter, P.E. The Mesozoic and Cenozoic paleodrainage of South America: A natural history. J. S. Am. Earth Sci. 1997, 10, 331–344. [Google Scholar]
- Campbell, K.E.; Heizler, M.; Frailey, C.D.; Romero-Pittman, L.; Prothero, D.R. Upper Cenozoic chronostratigraphy of the southwestern Amazon Basin. Geology 2001, 29, 595–598. [Google Scholar]
- Harris, S.E.; Mix, A.C. Climate and tectonic influences on continental erosion of tropical South America, 0–13 Ma. Geology 2002, 30, 447–450. [Google Scholar]
- Campbell, K.E.; Frailey, C.D.; Romero-Pittman, L. The Pan-Amazonian Ucayali Peneplain, late Neogene sedimentation in Amazonia, and the birth of the modern Amazon River system. Palaeogeogr. Palaeoclimatol. 2006, 239, 166–219. [Google Scholar]
- Cozzuol, M.A. The Acre vertebrate fauna: Age, diversity, and geography. J. S. Am. Earth Sci. 2006, 21, 185–203. [Google Scholar]
- Cunha, H.A.; da Silva, V.M.F.; Lailson-Brito, J.; Santos, M.C.O.; Flores, P.A.C.; Martin, A.R.; Azevedo, A.F.; Fragoso, A.B.L.; Zanelatto, R.C.; Sole-Cava, A.M. Riverine and marine ecotypes of Sotalia dolphins are different species. Mar. Biol. 2005, 148, 449–457. [Google Scholar]
- Renno, J.F.; Hubert, N.; Torrico, J.P.; Duponchelle, F.; Rodriguez, J.N.; Davila, C.G.; Willis, S.C.; Desmarais, E. Phylogeography of Cichla (Cichlidae) in the upper Madera basin (Bolivian Amazon). Mol. Phylogenet. Evol. 2006, 41, 503–510. [Google Scholar]
- Antoine, P.O.; De Franceschi, D.; Flynn, J.J.; Nel, A.; Baby, P.; Benammi, M.; Calderon, Y.; Espurt, N.; Goswami, A.; Salas-Gismondi, R. Amber from western Amazonia reveals Neotropical diversity during the middle Miocene. Proc. Nat. Acad. Sci. USA 2006, 103, 13595–13600. [Google Scholar]
- Espurt, N.; Brusset, S.; Baby, P.; Hermoza, W.; Bolanos, R.; Uyen, D.; Deramond, J. Paleozoic structural controls on shortening transfer in the Subandean foreland thrust system, Ene and southern Ucayali basins, Peru. Tectonics 2008, 27, 1–21. [Google Scholar]
- Mora, A.; Baby, P.; Hermoza, W.; Brusset, S.; Parra, M.; Roddaz, M.; Espurt, N.; Sobel, E.R.; Strecker, M.R. Tectonic History of the Andes and Subandean Zones: Implications for Neogene Amazonia. In Neogene History of Western Amazonia and its Significance for Modern Biodiversity; Hoorn, C.M., Wesselingh, F., Eds.; Blackwell Publishing: London, UK, 2010. [Google Scholar]
- Mora, A.; Horton, B.K.; Mesa, A.; Rubiano, J.; Ketcham, R.A.; Parra, M.; Blanco, V.; Garcia, D.; Stockli, D.F. Migration of Cenozoic deformation in the Eastern Cordillera of Colombia interpreted from fission track results and structural relationships: Implications for petroleum systems. AAPG Bull. 2010, 94, 1543–1580. [Google Scholar]
- Sidlauskas, B.L.; Vari, R.P. Phylogenetic relationships within the South American fish family Anostomidae (Teleostei, Ostariophysi, Characiformes). Zool. J. Linn. Soc. 2008, 154, 70–210. [Google Scholar]
- Salcedo, N.J. Speciation in Andean rivers: Morphological and genetic divergence in the catfish genus Chaetostoma; Texas Tech University: Lubbock, TX, USA, 2007. [Google Scholar]
- Crampton, W.G.R.; Wells, J.K.; Smyth, C.; Walz, S.A. Design and construction of an electric fish finder. Neotrop. ichthyol. 2007, 5, 425–428. [Google Scholar]
- Whittaker, R.H. Evolution and measurement of species diversity. Taxon 1972, 21, 213–251. [Google Scholar]
- Sepkowski, J.J. Alpha, Beta and Gamma diversity: where does all the diversity go? Paleobiology 1988, 14, 221–234. [Google Scholar]
- Hopkins, M.J.G. Modelling the known and unknown plant biodiversity of the Amazon Basin. J. Biogeogr. 2007, 34, 1400–1411. [Google Scholar]
- Abell, R.; Thieme, M.L.; Revenga, C.; Bryer, M.; Kottelat, M.; Bogutskaya, N.; Coad, B.; Mandrak, N.; Balderas, S.C.; Bussing, W.; et al. Freshwater ecoregions of the world: A new map of biogeographic units for freshwater biodiversity conservation. Bioscience 2008, 58, 403–414. [Google Scholar]
- Anonymous Google Earth User Guide.
- Karcz, I. Development of a meandering thalweg in a straight, erodible laboratory channel. J. Geol. 1971, 79, 234–240. [Google Scholar]
- Gordon, N.D.; McMahon, T.A.; Gippel, C.J.; Nathan, R.J. Stream Hydrology: An Introduction for Ecologists, 2nd ed.; John Wiley and Sons: Hoboken, NJ, USA, 2005. [Google Scholar]
- Gascon, C.; Malcolm, J.R.; Patton, J.L.; da Silva, M.N.F.; Bogart, J.P.; Lougheed, S.C.; Peres, C.A.; Neckel, S.; Boag, P.T. Riverine barriers and the geographic distribution of Amazonian species. Proc. Nat. Acad. Sci. USA 2000, 97, 13672–13677. [Google Scholar]
- Parra-Olea, G.; Garcia-Paris, M.; Wake, D.B. Molecular diversification of salamanders of the tropical American genus Bolitoglossa (Caudata: Plethodontidae) and its evolutionary and biogeographical implications. Biol. J. Linn. Soc. 2004, 81, 325–346. [Google Scholar]
- Weigt, L.A.; Crawford, A.J.; Rand, A.S.; Ryan, M.J. Biogeography of the tungara frog, Physalaemus pustulosus: A molecular perspective. Mol. Ecol. 2005, 14, 3857–3876. [Google Scholar]
- Roberts, J.L.; Brown, J.L.; von May, R.; Arizabal, W.; Schulte, R.; Summers, K. Genetic divergence and speciation in lowland and montane Peruvian poison frogs. Mol. Phylogenet. Evol. 2006, 41, 149–164. [Google Scholar]
- Roberts, J.L.; Brown, J.L.; Schulte, R.; Arizabal, W.; Summers, K. Rapid diversification of colouration among populations of a poison frog isolated on sky peninsulas in the central cordilleras of Peru. J. Biogeogr. 2007, 34, 417–426. [Google Scholar]
- Schulte, J.A.; Macey, J.R.; Espinoza, R.E.; Larson, A. Phylogenetic relationships in the iguanid lizard genus Liolaemus: Multiple origins of viviparous reproduction and evidence for recurring Andean vicariance and dispersal. Biol. J. Linn. Soc. 2000, 69, 75–102. [Google Scholar]
- Doan, T.M.; Arriaga, W.A. Microgeographic variation in species composition of the herpetofaunal communities of Tambopata Region, Peru. Biotropica 2002, 34, 101–117. [Google Scholar]
- Iturralde-Vinent, M.A.; MacPhee, R.D.E. Paleogeography of the Caribbean region: Implications for Cenozoic biogeography. Bull. Am. Mus. Nat. Hist. 1999, 238, 1–95. [Google Scholar]
- Torres-Carvajal, O.; Schulte, J.A.; Cadle, J.E. Phylogenetic relationships of South American lizards of the genus Stenocercus (Squamata: Iguania): A new approach using a general mixture model for gene sequence data. Mol. Phylogenet. Evol. 2006, 39, 171–185. [Google Scholar]
- Bleiweiss, R. Tempo and mode of hummingbird evolution. Biol. J. Linn. Soc. 1998, 65, 63–76. [Google Scholar]
- Givnish, T.J.; Evans, T.M.; Zjhra, M.L.; Patterson, T.B.; Berry, P.E.; Sytsma, K.J. Molecular evolution, adaptive radiation, and geographic diversification in the amphiatlantic family Rapateaceae: Evidence from ndhF sequences and morphology. Evolution 2000, 54, 1915–1937. [Google Scholar]
- Pereira, S.L.; Baker, A.J. Vicariant speciation of curassows (Aves, Cracidae): A hypothesis based on mitochondrial DNA phylogeny. Auk 2004, 121, 682–694. [Google Scholar]
- Fjeldsa, J.; Rahbek, C. Diversification of tanagers, a species rich bird group, from lowlands to montane regions of South America. Integr. Comp. Biol. 2006, 46, 72–81. [Google Scholar]
- Tavares, E.S.; Baker, A.J.; Pereira, S.L.; Miyaki, C.Y. Phylogenetic relationships and historical biogeography of Neotropical parrots (Psittaciformes: Psittacidae: Arini) inferred from mitochondrial and nuclear DNA sequences. Syst. Biol. 2006, 55, 454–470. [Google Scholar]
- Salazar-Bravo, J.; Dragoo, J.W.; Tinnin, D.S.; Yates, T.L. Phylogeny and evolution of the neotropical rodent genus Calomys: Inferences from mitochondrial DNA sequence data. Mol. Phylogenet. Evol. 2001, 20, 173–184. [Google Scholar]
- Galewski, T.; Mauffrey, J.F.; Leite, Y.L.R.; Patton, J.L.; Douzery, E.J.P. Ecomorphological diversification among South American spiny rats (Rodentia; Echimyidae): A phylogenetic and chronological approach. Mol. Phylogenet. Evol. 2005, 34, 601–615. [Google Scholar]
- Santos, J.C.; Coloma, L.A.; Summers, K.; Caldwell, J.P.; Ree, R.; Cannatella, D.C. Amazonian Amphibian Diversity is Primarily Derived from Late Miocene Andean Lineages. PLoS Biology 2009, 7, 448–461. [Google Scholar]
- Avise, J.C.; Wollenberg, K. Phylogenetics and the origin of species. Proc. Nat. Acad. Sci. USA 1997, 94, 7748–7755. [Google Scholar]
- Collins, T.M.; Frazer, K.; Palmer, A.R.; Vermeij, G.J.; Brown, W.M. Evolutionary history of northern hemisphere Nucella (Gastropoda, Muricidae): Molecular, morphological, ecological, and paleontological evidence. Evolution 1996, 50, 2287–2304. [Google Scholar]
- Losos, J.B.; Glor, R.E. Phylogenetic comparative methods and the geography of speciation. Trend. Ecol. Evolut. 2003, 18, 220–227. [Google Scholar]
- Albert, J.S.; Crampton, W.G.R. The geography and ecology of diversification in Neotropical freshwaters. Nature Educ. Knowl. 2010, 1, 13–19. [Google Scholar]
© 2011 by the authors; licensee MDPI, Basel, Switzerland. This article is an open access article distributed under the terms and conditions of the Creative Commons Attribution license (http://creativecommons.org/licenses/by/3.0/).
Share and Cite
Albert, J.S.; Carvalho, T.P.; Petry, P.; Holder, M.A.; Maxime, E.L.; Espino, J.; Corahua, I.; Quispe, R.; Rengifo, B.; Ortega, H.; et al. Aquatic Biodiversity in the Amazon: Habitat Specialization and Geographic Isolation Promote Species Richness. Animals 2011, 1, 205-241. https://doi.org/10.3390/ani1020205
Albert JS, Carvalho TP, Petry P, Holder MA, Maxime EL, Espino J, Corahua I, Quispe R, Rengifo B, Ortega H, et al. Aquatic Biodiversity in the Amazon: Habitat Specialization and Geographic Isolation Promote Species Richness. Animals. 2011; 1(2):205-241. https://doi.org/10.3390/ani1020205
Chicago/Turabian StyleAlbert, James S., Tiago P. Carvalho, Paulo Petry, Meghan A. Holder, Emmanuel L. Maxime, Jessica Espino, Isabel Corahua, Roberto Quispe, Blanca Rengifo, Hernan Ortega, and et al. 2011. "Aquatic Biodiversity in the Amazon: Habitat Specialization and Geographic Isolation Promote Species Richness" Animals 1, no. 2: 205-241. https://doi.org/10.3390/ani1020205
APA StyleAlbert, J. S., Carvalho, T. P., Petry, P., Holder, M. A., Maxime, E. L., Espino, J., Corahua, I., Quispe, R., Rengifo, B., Ortega, H., & Reis, R. E. (2011). Aquatic Biodiversity in the Amazon: Habitat Specialization and Geographic Isolation Promote Species Richness. Animals, 1(2), 205-241. https://doi.org/10.3390/ani1020205