
Experimental West Nile Virus Infection in Rabbits: An Alternative Model for Studying Induction of Disease and Virus Control

Abstract
:
1. Introduction
2. Results
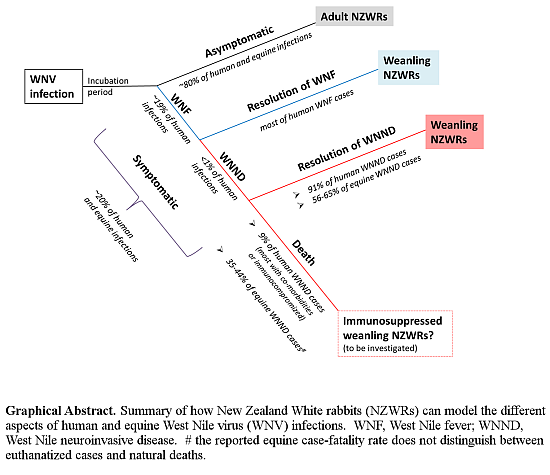
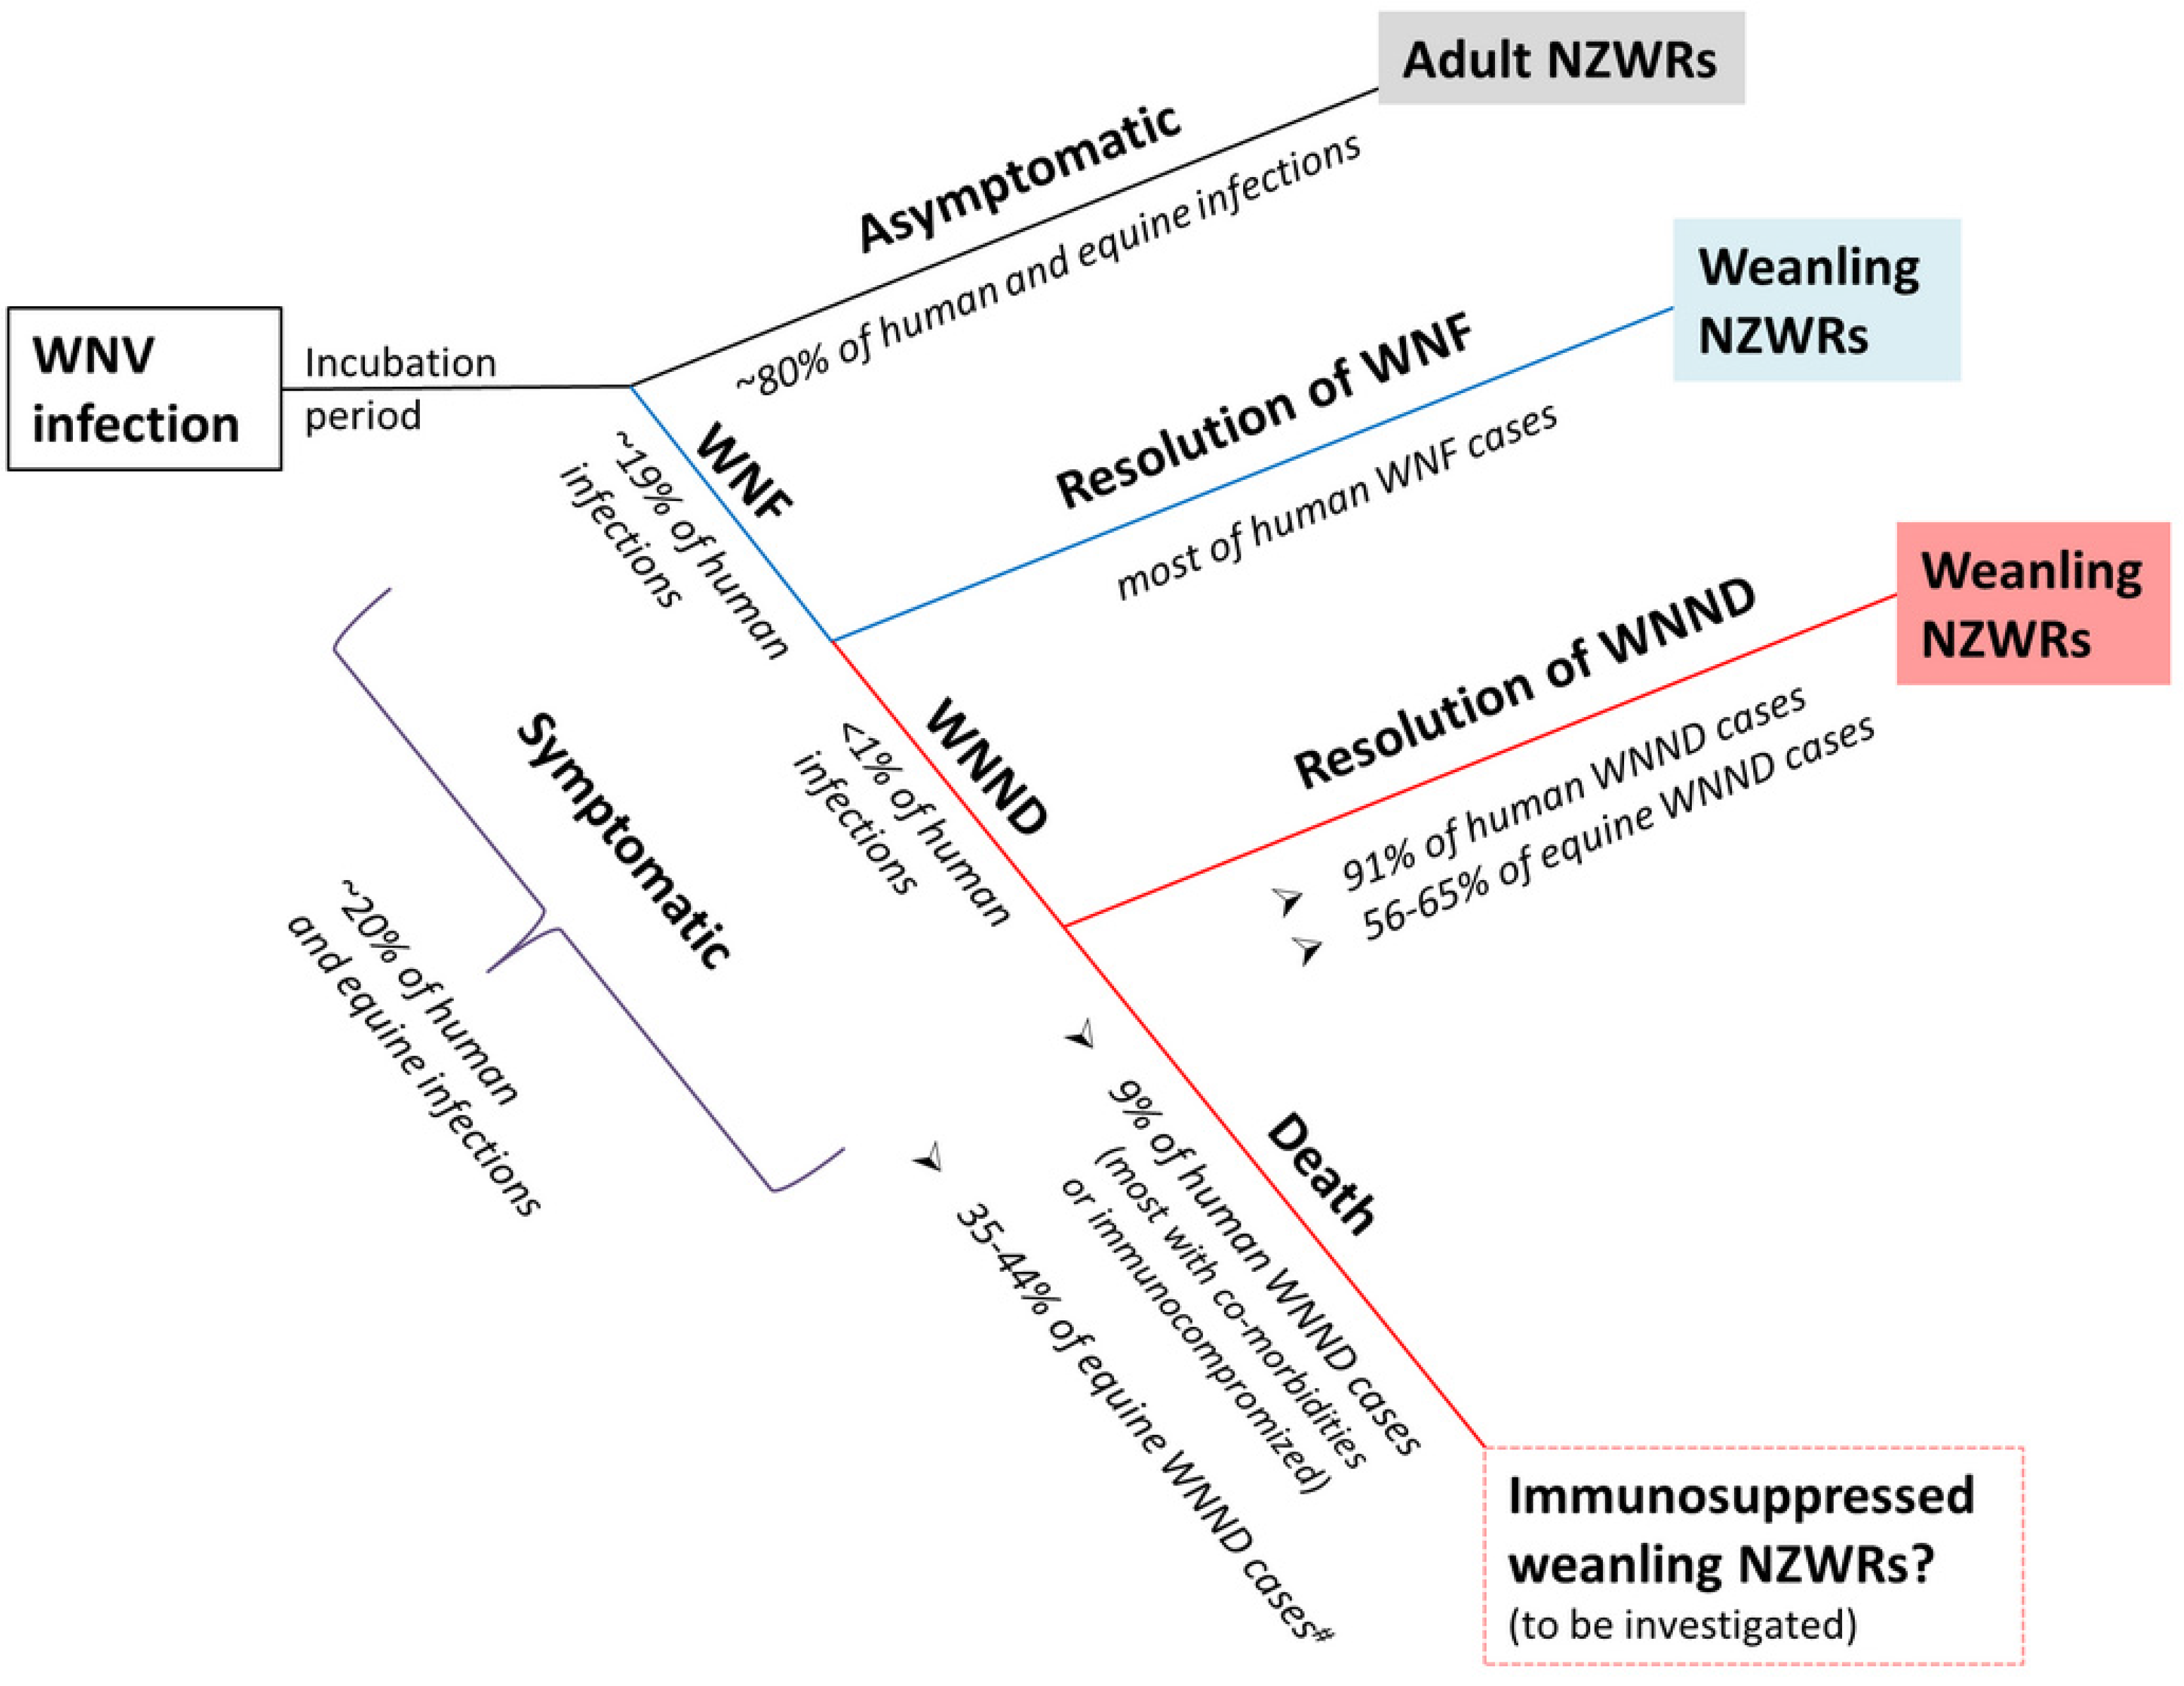
2.1. Subclinical and Non-Lethal Infection

| Rabbit Species | New Zealand White Rabbit (NZWR) | Cottontail Rabbit (CTR) | ||||||
|---|---|---|---|---|---|---|---|---|
| Age | Weanlings (4–5 Weeks Old, ~500–700 g) | Adults (>3 Months Old, ~3000 g) | Mixed Age (~250–900 g) | |||||
| Inoculum | WNVNSW2011 | MVE1-51 | Sham | WNVNSW2011 | MVE1-51 | WNVNSW2011 | WNVTX8667 | Sham |
| Termination day (pi) | Group 1 | Group 2 | Control | Group 3 | Group 4 | Group 5 | Group 6 | Control |
| 3 | 3 | 3 | N/D | N/D | N/D | 3 | 3 | 1 |
| 7 | 9 | 6 | 3 | 3 | 3 | 3 | 3 | 1 |
| 12 | 6 | 6 | N/D | N/D | N/D | N/D | N/D | N/D |
| 18 | 6 | 6 | 3 | N/D | N/D | N/D | N/D | N/D |
| Totals | 24 | 21 | 6 | 3 | 3 | 6 | 6 | 2 |
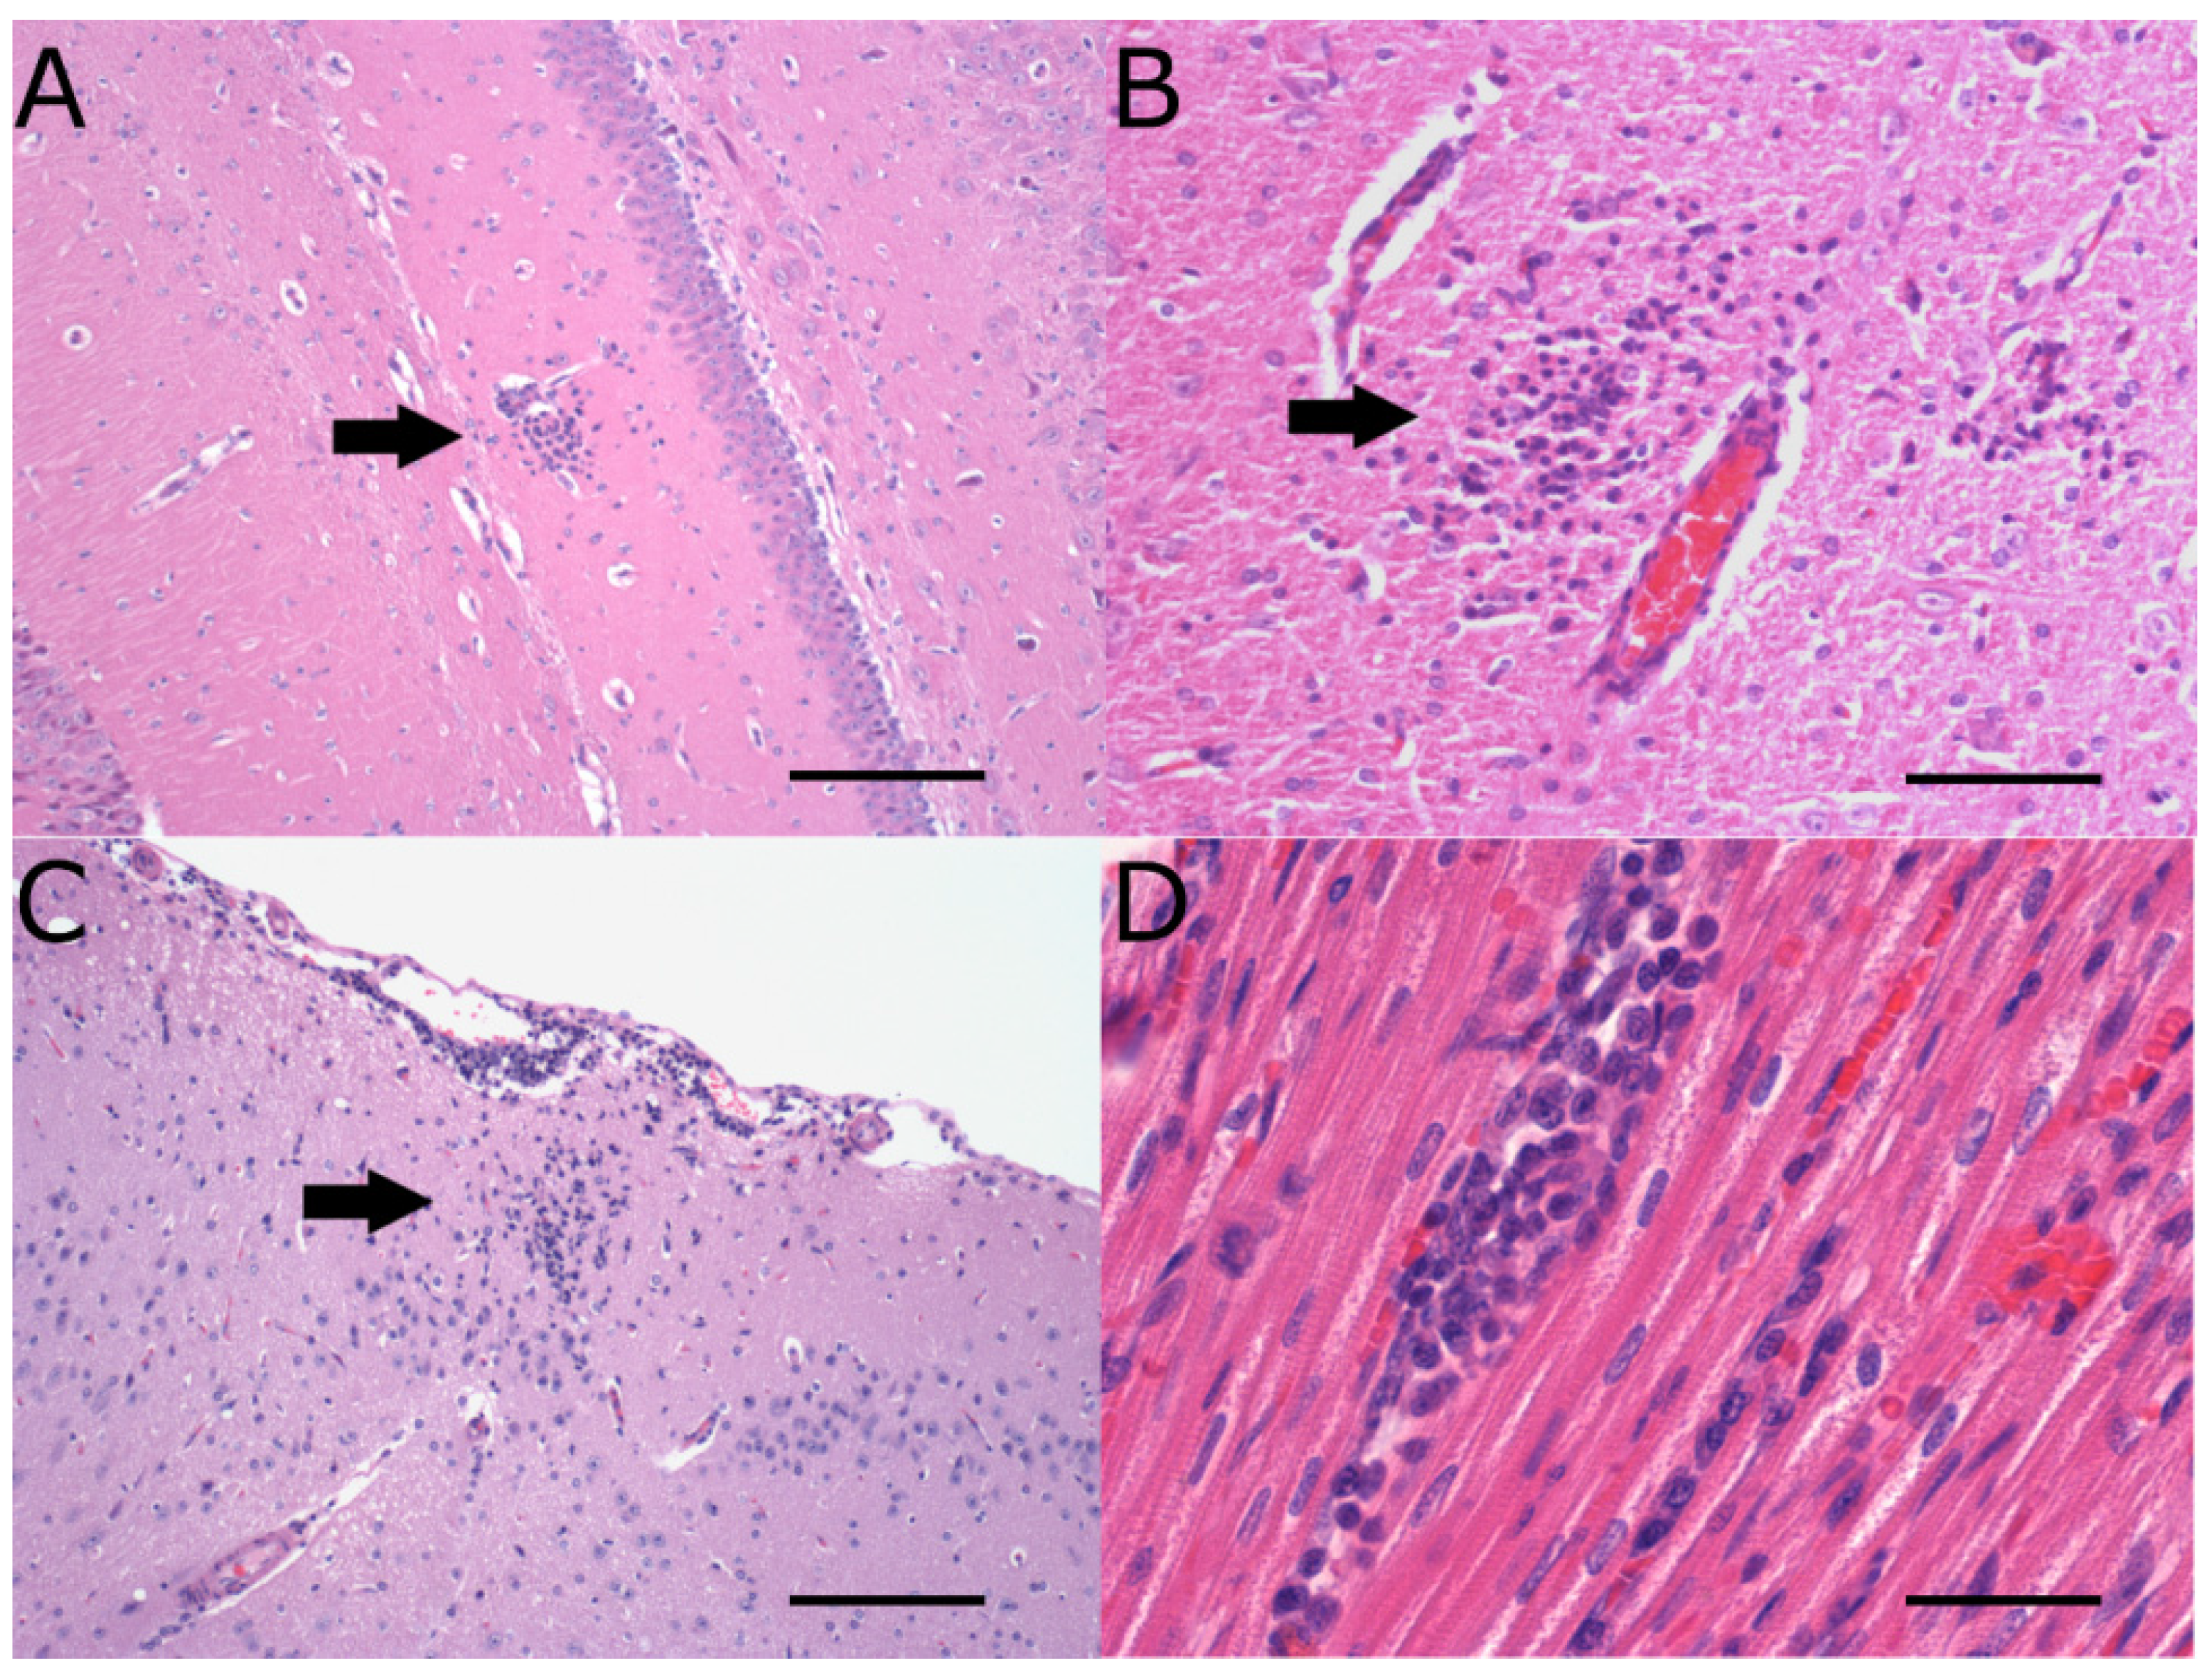
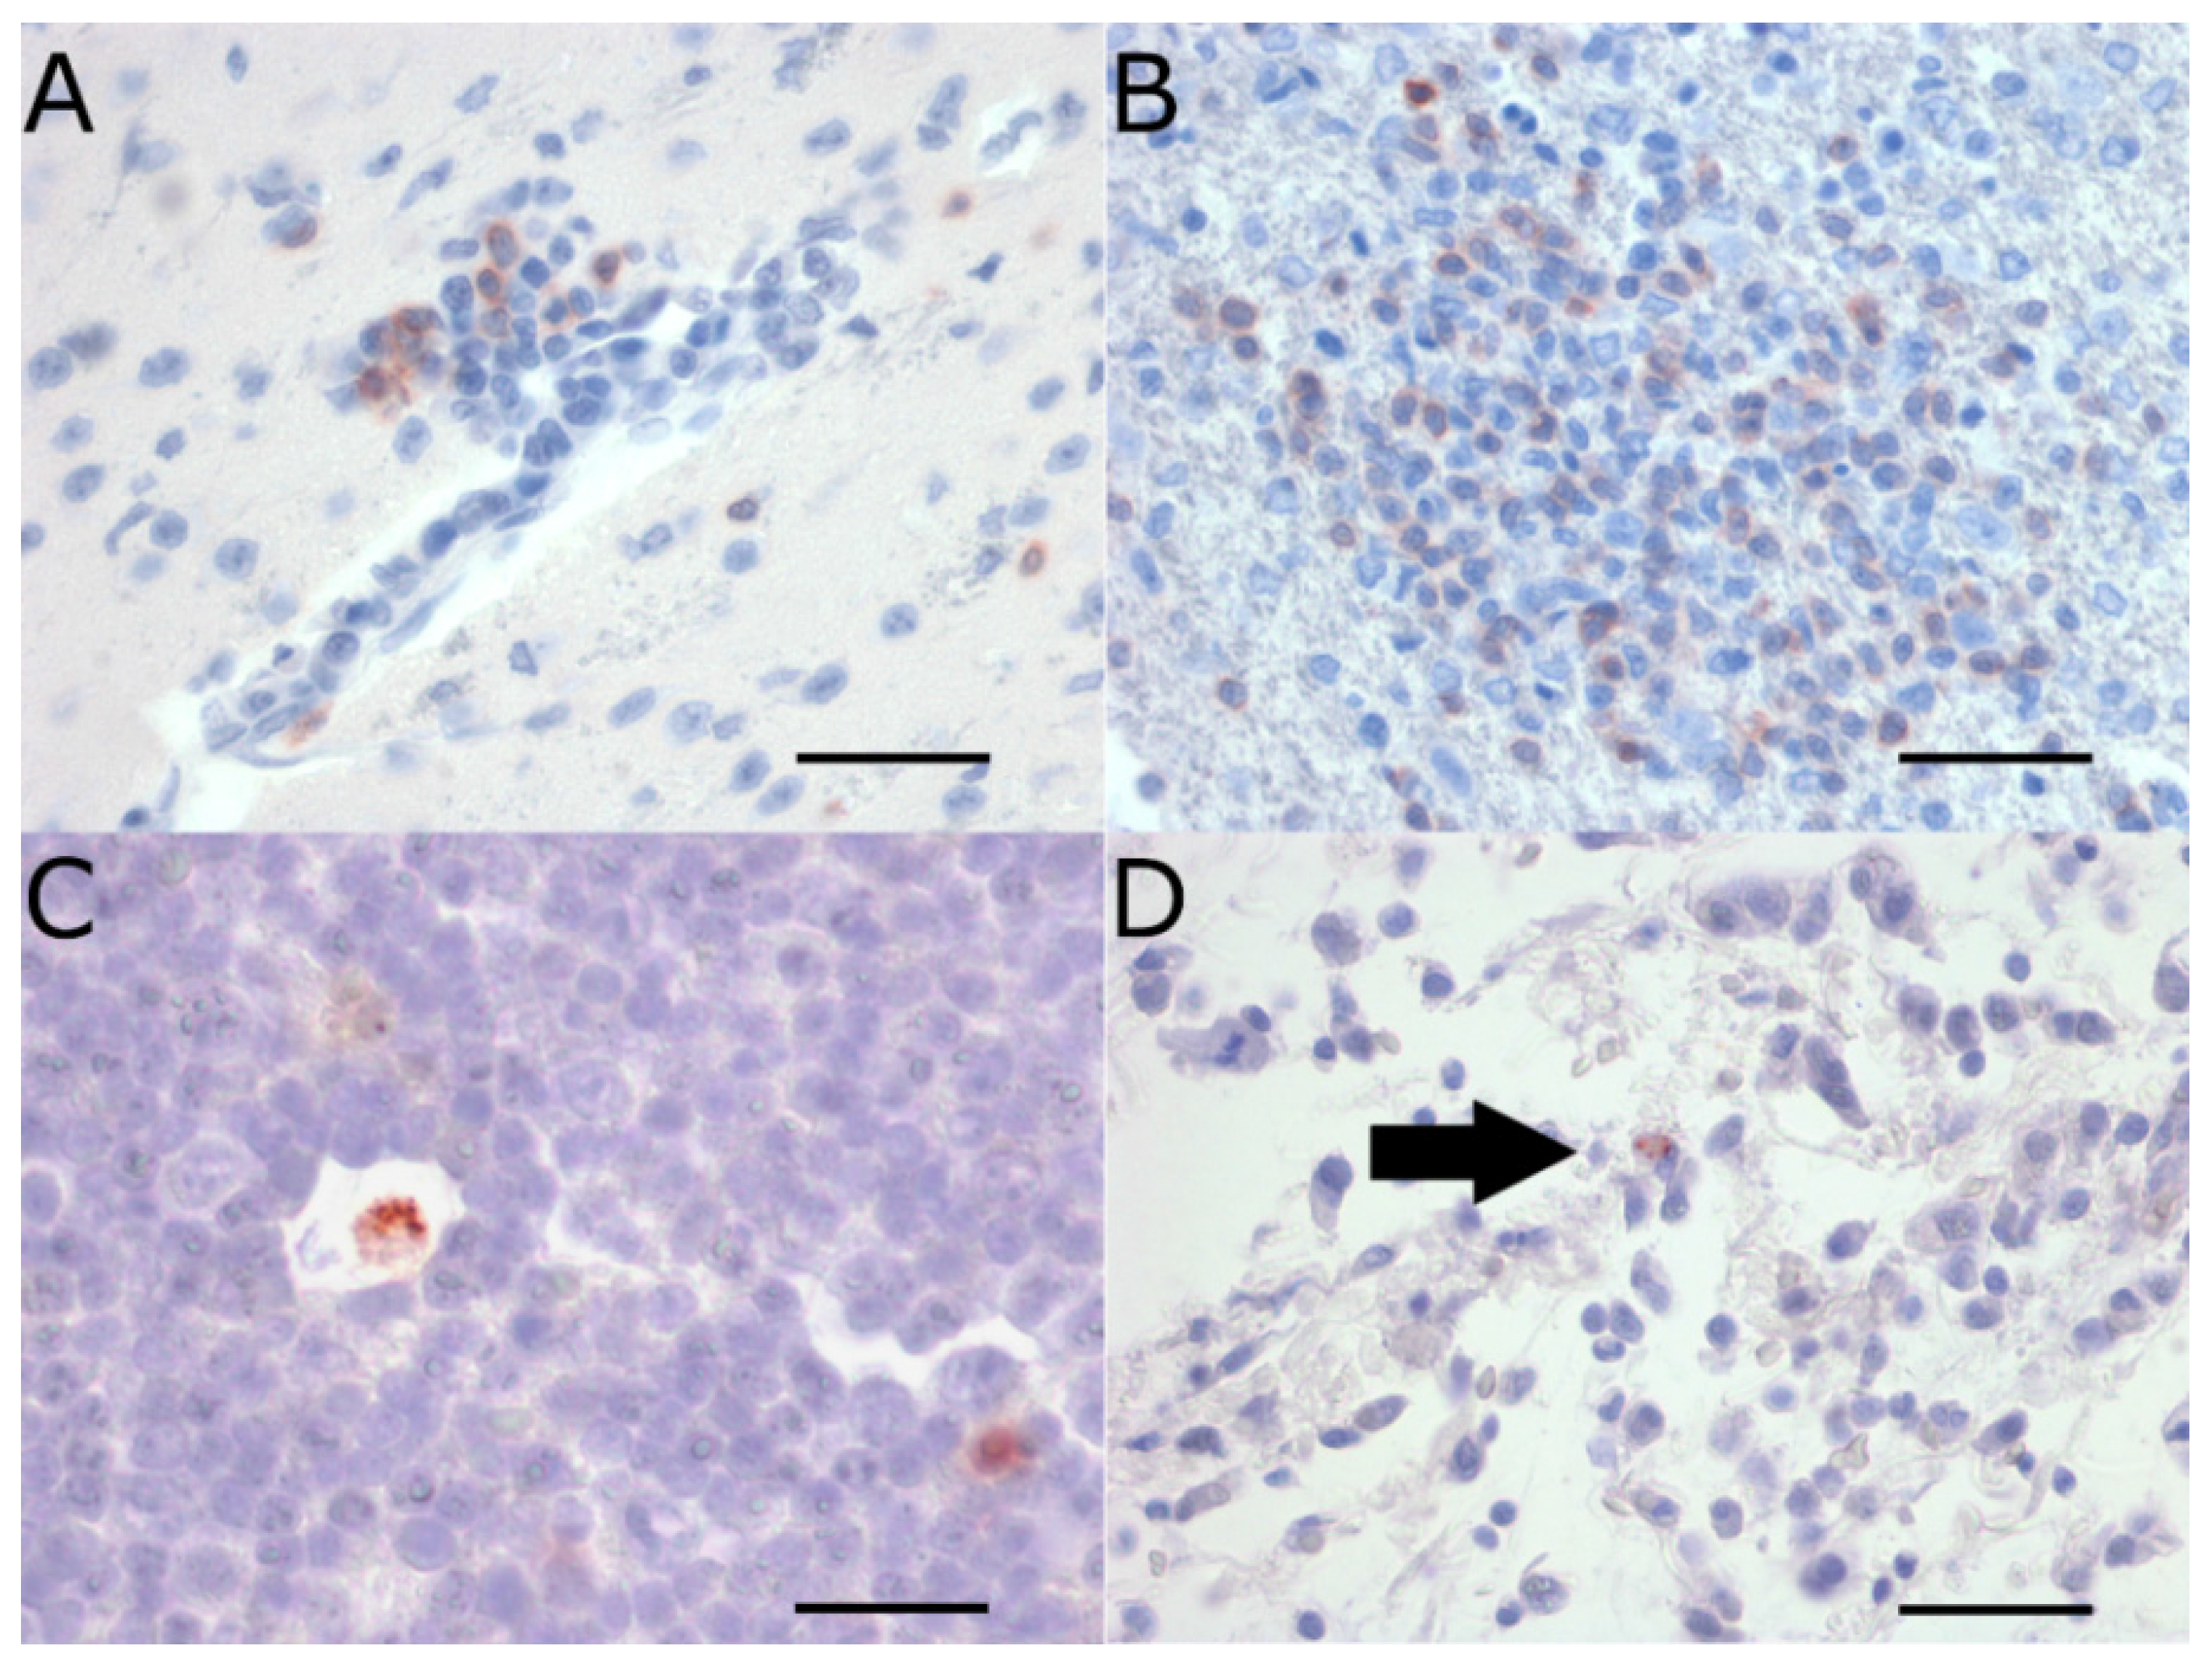
2.2. Neuropathology
| Neuropathology | Virus strain | Weanling | Adults |
|---|---|---|---|
| Meningitis (Brain) | WNVNSW2011 | 2 | 1 |
| MVE1-51 | 2 | 1 | |
| Encephalitis (Brain) | WNVNSW2011 | 2 | 1 |
| MVE1-51 | 3 | 1 | |
| Meningitis (Olfactory bulbs) | WNVNSW2011 | 2 | 1 |
| MVE1-51 | 2 | 1 | |
| Encephalitis (Olfactory bulbs) | WNVNSW2011 | 2 | 0 |
| MVE1-51 | 2 | 0 | |
| Spinal Meningitis | WNVNSW2011 | 2 | 0 |
| MVE1-51 | 1 | 0 | |
| Myelitis | WNVNSW2011 | 2 | 0 |
| MVE1-51 | 2 | 0 |
| Day 3 pi | Day 7 pi | Day 12 pi | Day 18 pi | |
|---|---|---|---|---|
| WNVNSW2011 (weanling NZWRs) | Mn and rare htl near CVO and neuropil of brain (peak score = 1, n = 2/3) | Mn in meninges, neuropil of brain, olfactory bulbs, spinal cord, perineurium and/or nerve fibres of spinal nerves in cauda equine (peak score = 2, n = 4/9) | Mn in meninges, neuropil of brain and cranial cervical spinal cord (peak score = 1, n = 4/6) | Mn in meninges, neuropil of brain near CVO and cranial cervical spinal cord (peak score = 1, n = 2/6) |
| MVE1-51 (weanling NZWRs) | No pathology (n = 0/3) | Mn with occasional htl in meninges, neuropil of brain (extensive with neuronophagia), olfactory bulbs, spinal cord, perineurium of spinal nerves and/or dorsal root ganglion in cauda equine (peak score = 3, n = 6/6) | Mn,with occasional htl in meninges, neuropil of brain (extensive) with neuronophagia+ (peak score = 3, n = 4/6) | Mn,with occasional htl in meninges, neuropil of brain (extensive)+ (peak score = 2, n = 2/6) |
| WNVNSW2011 (CTRs) | No pathology (n = 0/3) | Mn in meninges, neuropil of brain and spinal cord (peak score = 2, n = 1/3) | N/D | N/D |
| WNVTX8667 (CTRs) | No pathology (n = 0/3) | Mn in meninges and neuropil of brain (extensive; peak score = 3, n 2/3) | N/D | N/D |
2.3. Extraneural Pathology
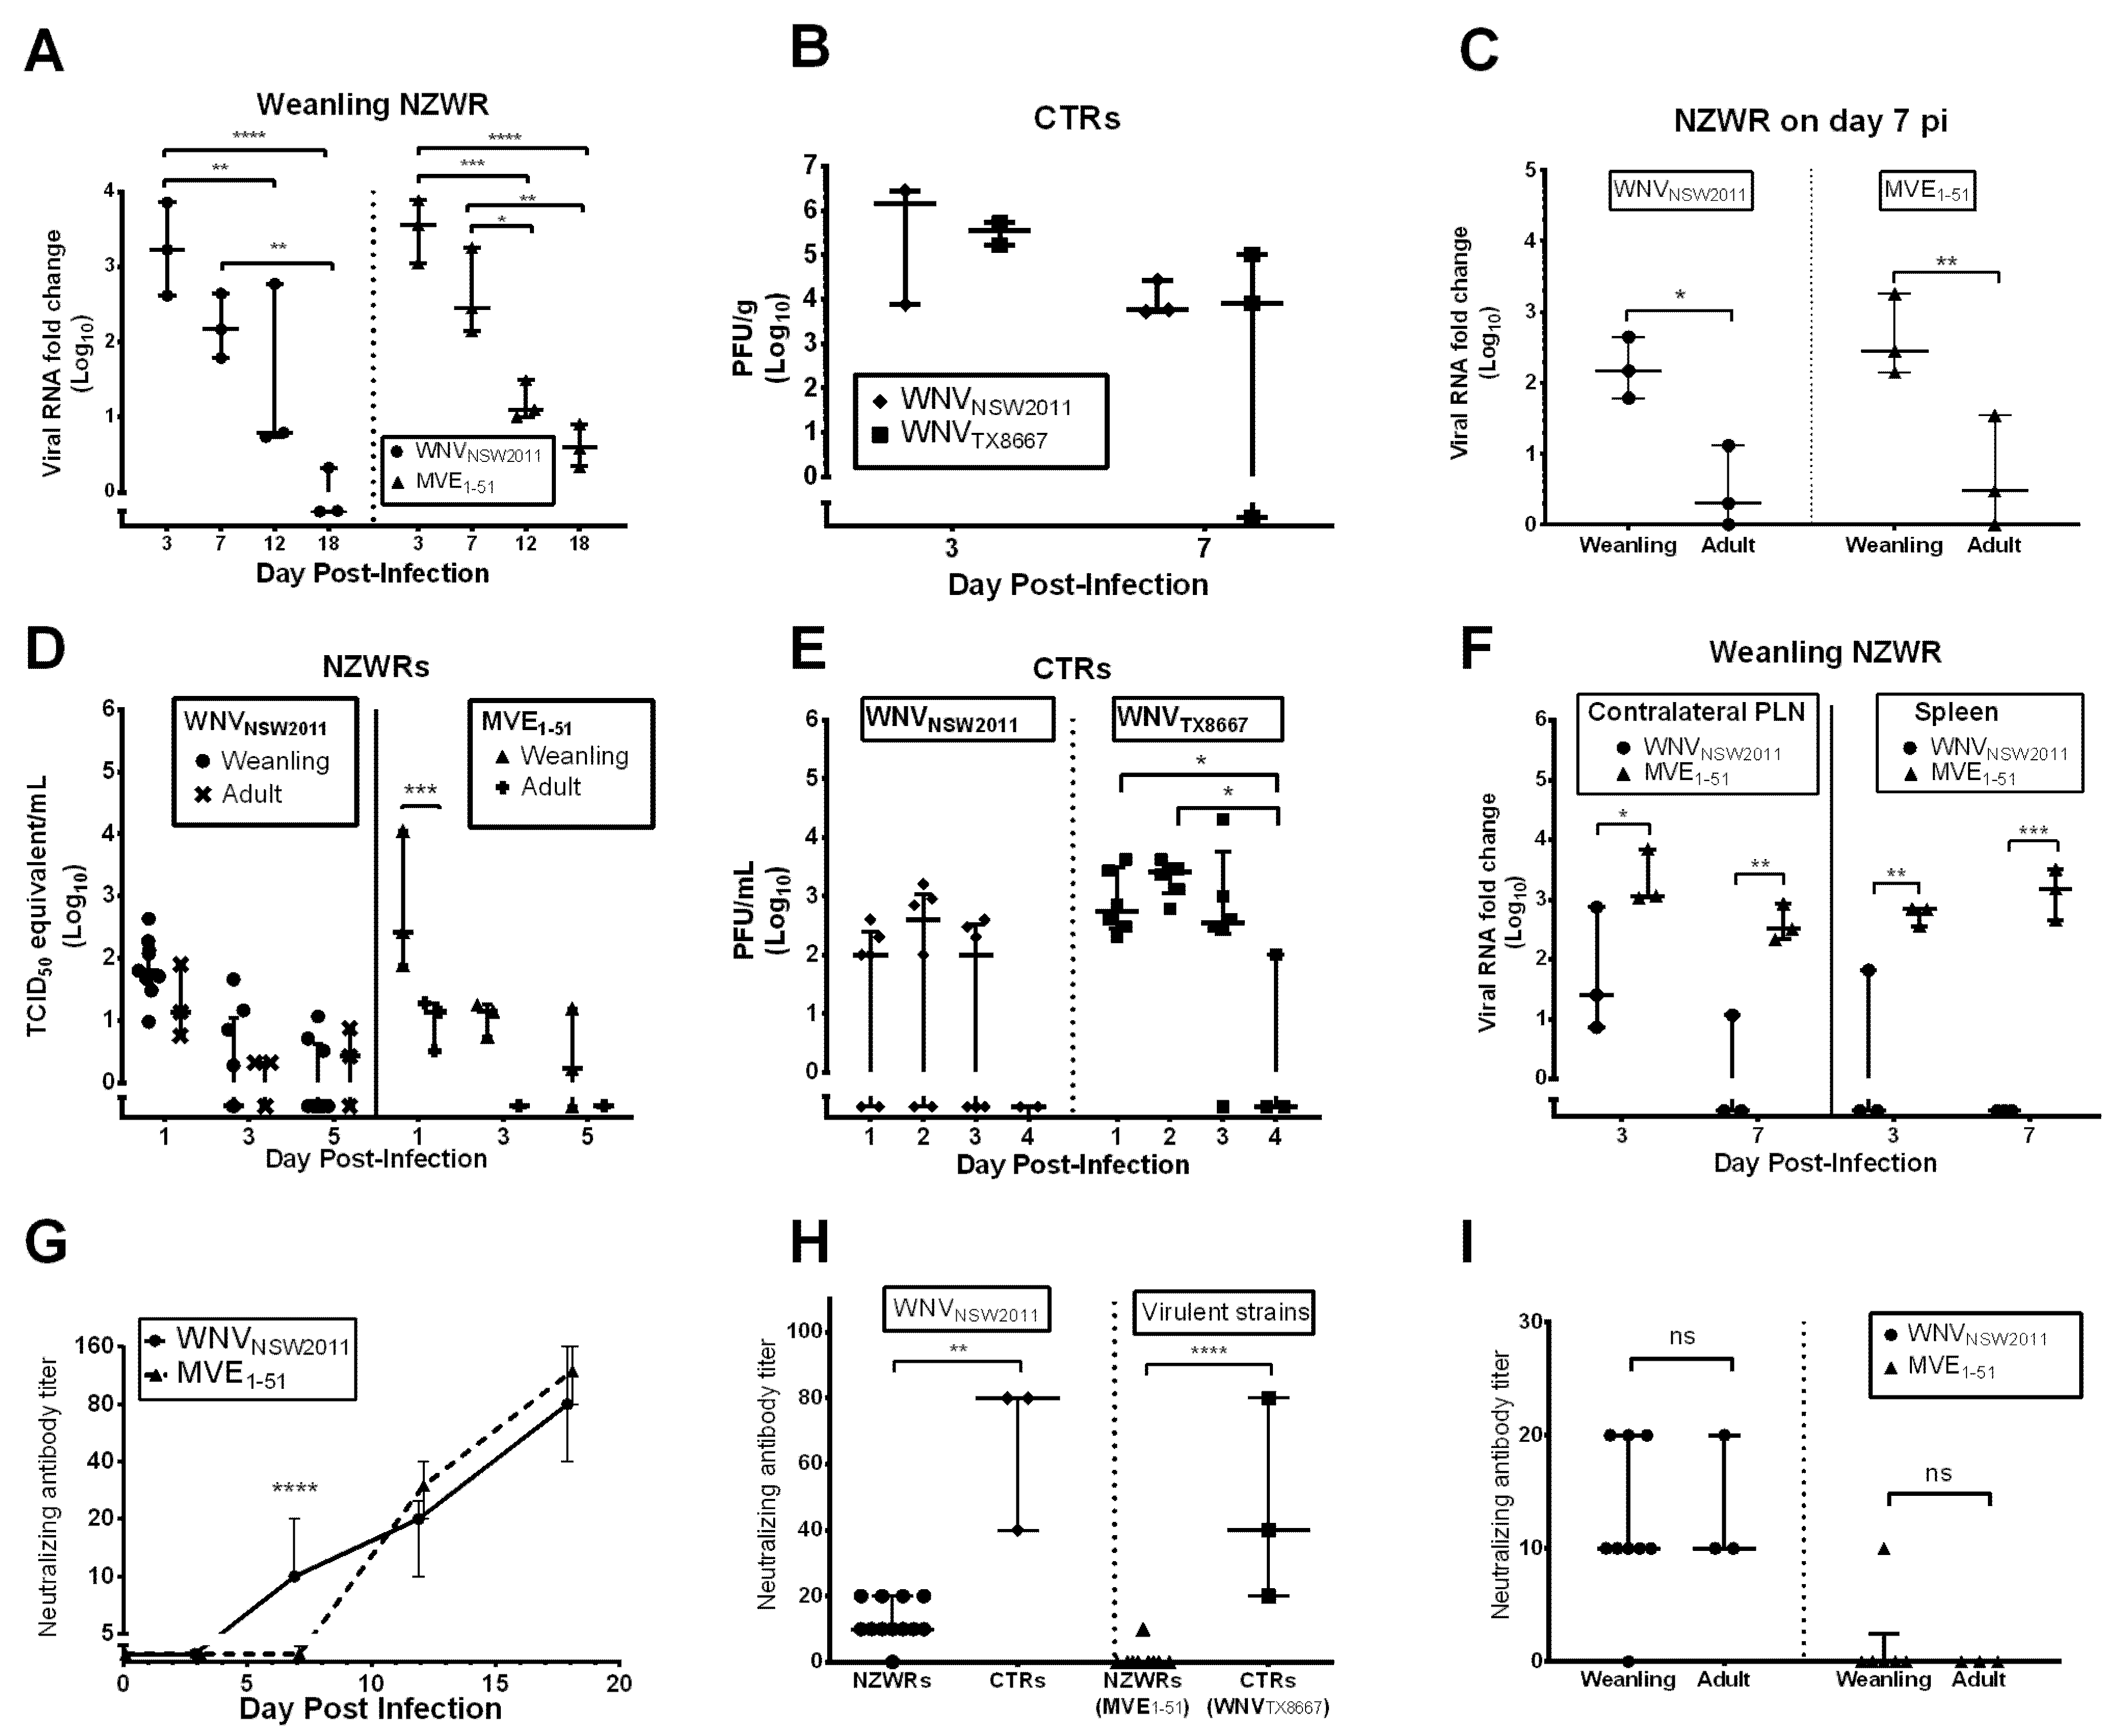
2.4. Viral Burden in the CNS
2.5. Peripheral Virus Replication

2.6. Peripheral Virus Dissemination
2.7. Neutralizing Antibody Response
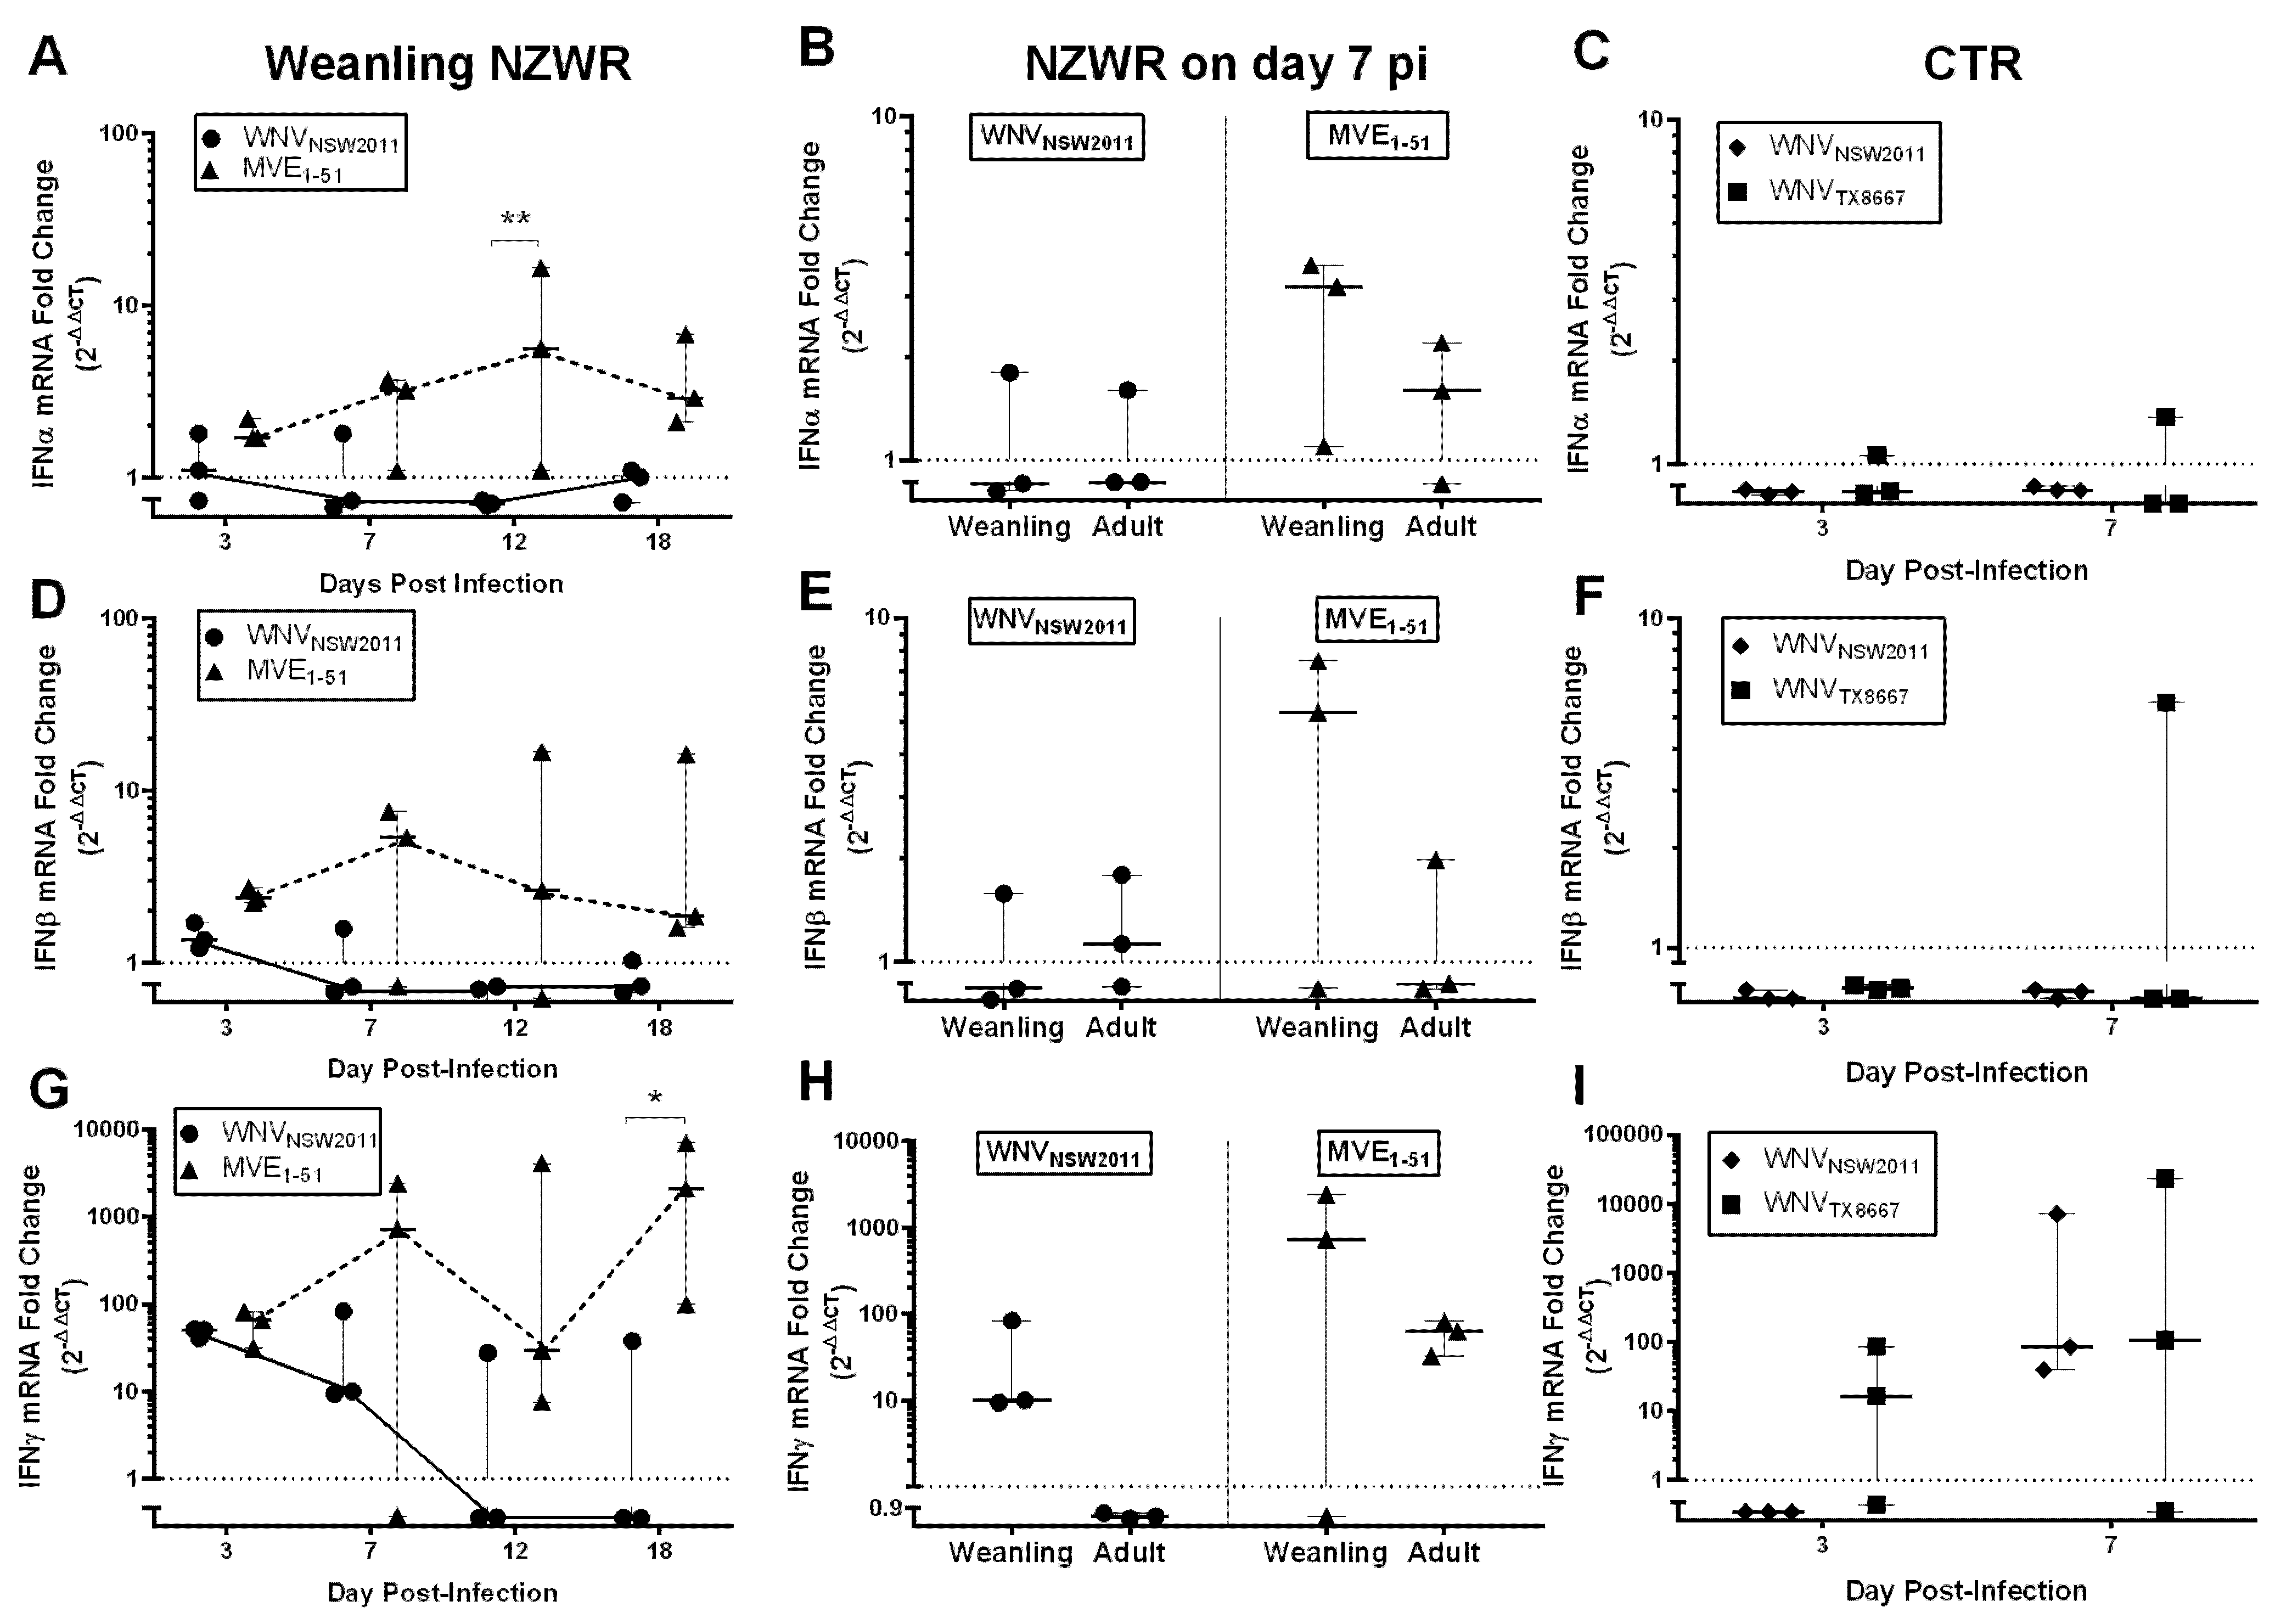
2.8. IFN-I and -II Transcription Levels in the Draining Popliteal Lymph Node and Brain


3. Discussion
3.1. Experimental Design
3.2. Rabbits Can Model Non-Lethal Human and Equine WNV Infections

3.3. Productive Flavivirus Replication in Draining PLN
3.4. Restricted Viremia and CNS Infection in Rabbits Resemble Human and Equine WNV Kinetics
3.5. Weanling NZWRs are an Appropriate Model to Study Non-Fatal Human and Equine WNND
3.6. Virus-Dependent Systemic Virus Dissemination, Peripheral IFN-α/β, and Neutralizing Antibody Response
3.7. Neutralizing Antibody and IFNγ Response in CTRs
3.8. IFNγ Response in NZWRs
3.9. Significance and Future Directions
4. Materials and Methods
4.1. Cell Culture and Virus
4.2. Animals and Experimental Design
4.3. Clinical Monitoring
4.4. Tissue Sampling
4.5. Histopathology
| Extensiveness | SEVERITY | |||
| Mild | Moderate | Severe | ||
| Focal | 1 | 2 | 3 | |
| Multifocal | 2 | 3 | 4 | |
| Diffuse | 3 | 4 | 5 | |
4.6. Immunohistochemistry (IHC)
4.7. Virus Isolation and Titration
4.8. Serology
4.9. RNA Extraction
4.10. Viral RNA Quantitation (qRT-PCR)
4.11. Cytokine Transcription Profiling Assay (RT-qPCR)
4.12. Statistical Analysis
5. Conclusions
Supplementary Information
Acknowledgments
Author Contributions
Conflicts of Interest
References
- Mostashari, F.; Bunning, M.L.; Kitsutani, P.T.; Singer, D.A.; Nash, D.; Cooper, M.J.; Katz, N.; Liljebjelke, K.A.; Biggerstaff, B.J.; Fine, A.D.; et al. Epidemic west nile encephalitis, new york, 1999: Results of a household-based seroepidemiological survey. Lancet 2001, 358, 261–264. [Google Scholar] [CrossRef] [PubMed]
- Zou, S.; Foster, G.A.; Dodd, R.Y.; Petersen, L.R.; Stramer, S.L. West nile fever characteristics among viremic persons identified through blood donor screening. J. Infect. Dis. 2010, 202, 1354–1361. [Google Scholar] [CrossRef] [PubMed]
- Lindsey, N.P.; Staples, J.E.; Lehman, J.A.; Fischer, M. Surveillance for human west nile virus disease—United states, 1999–2008. MMWR Surveill. Summ. 2010, 59, 1–17. [Google Scholar] [PubMed]
- Nielsen, C.F.; Reisen, W.K.; Armijos, M.V.; Maclachlan, N.J.; Scott, T.W. High subclinical west nile virus incidence among nonvaccinated horses in northern california associated with low vector abundance and infection. Am. J. Trop. Med. Hyg. 2008, 78, 45–52. [Google Scholar] [PubMed]
- Ostlund, E.N.; Crom, R.L.; Pedersen, D.D.; Johnson, D.J.; Williams, W.O.; Schmitt, B.J. Equine west nile encephalitis, united states. Emerg. Infect. Dis. 2001, 7, 665–669. [Google Scholar] [CrossRef] [PubMed]
- Nolan, M.S.; Schuermann, J.; Murray, K.O. West nile virus infection among humans, texas, USA, 2002–2011. Emerg. Infect. Dis. 2013, 19, 137–139. [Google Scholar] [CrossRef] [PubMed]
- Diamond, M.S.; Shrestha, B.; Marri, A.; Mahan, D.; Engle, M. B cells and antibody play critical roles in the immediate defense of disseminated infection by west nile encephalitis virus. J. Virol. 2003, 77, 2578–2586. [Google Scholar] [CrossRef] [PubMed]
- Xiao, S.Y.; Guzman, H.; Zhang, H.; Travassos da Rosa, A.P.; Tesh, R.B. West nile virus infection in the golden hamster (mesocricetus auratus): A model for west nile encephalitis. Emerg. Infect. Dis. 2001, 7, 714–721. [Google Scholar] [CrossRef] [PubMed]
- Prow, N.A.; Setoh, Y.X.; Biron, R.M.; Sester, D.P.; Kim, K.S.; Hobson-Peters, J.; Hall, R.A.; Bielefeldt-Ohmann, H. The west nile-like flavivirus koutango is highly virulent in mice due to delayed viral clearance and the induction of a poor neutralizing antibody response. J. Virol. 2014, 188, 9947–9962. [Google Scholar] [CrossRef] [PubMed]
- Suen, W.W.; Prow, N.A.; Hall, R.A.; Bielefeldt-Ohmann, H. Mechanism of west nile virus neuroinvasion: A critical appraisal. Viruses 2014, 6, 2796–2825. [Google Scholar] [CrossRef] [PubMed]
- Guarner, J.; Shieh, W.J.; Hunter, S.; Paddock, C.D.; Morken, T.; Campbell, G.L.; Marfin, A.A.; Zaki, S.R. Clinicopathologic study and laboratory diagnosis of 23 cases with west nile virus encephalomyelitis. Hum. Pathol. 2004, 35, 983–990. [Google Scholar] [CrossRef] [PubMed]
- Cantile, C.; Del Piero, F.; di Guardo, G.; Arispici, M. Pathologic and immunohistochemical findings in naturally occuring west nile virus infection in horses. Vet. Pathol. 2001, 38, 414–421. [Google Scholar] [CrossRef] [PubMed]
- Bunning, M.L.; Bowen, R.A.; Cropp, C.B.; Sullivan, K.G.; Davis, B.S.; Komar, N.; Godsey, M.S.; Baker, D.; Hettler, D.L.; Holmes, D.A.; et al. Experimental infection of horses with west nile virus. Emerg. Infect. Dis. 2002, 8, 380–386. [Google Scholar] [CrossRef] [PubMed]
- Kumar, M.; OʼConnell, M.; Namekar, M.; Nerurkar, V.R. Infection with non-lethal west nile virus eg101 strain induces immunity that protects mice against the lethal west nile virus ny99 strain. Viruses 2014, 6, 2328–2339. [Google Scholar] [CrossRef] [PubMed]
- Shirato, K.; Kimura, T.; Mizutani, T.; Kariwa, H.; Takashima, I. Different chemokine expression in lethal and non-lethal murine west nile virus infection. J. Med. Virol. 2004, 74, 507–513. [Google Scholar] [CrossRef] [PubMed]
- Frost, M.J.; Zhang, J.; Edmonds, J.H.; Prow, N.A.; Gu, X.; Davis, R.; Hornitzky, C.; Arzey, K.E.; Finlaison, D.; Hick, P.; et al. Characterization of virulent west nile virus kunjin strain, australia, 2011. Emerg. Infect. Dis. 2012, 18, 792–800. [Google Scholar] [CrossRef] [PubMed]
- Venter, M.; Human, S.; Zaayman, D.; Gerdes, G.H.; Williams, J.; Steyl, J.; Leman, P.A.; Paweska, J.T.; Setzkorn, H.; Rous, G.; et al. Lineage 2 west nile virus as cause of fatal neurologic disease in horses, south africa. Emerg. Infect. Dis. 2009, 15, 877–884. [Google Scholar] [CrossRef] [PubMed]
- Lobigs, M.; Marshall, I.D.; Weir, R.C.; Dalgarno, L. Genetic differentiation of murray valley encephalitis virus in australia and papua new guinea. Aust. J. Exp. Biol. Med. Sci. 1986, 64, 571–585. [Google Scholar] [CrossRef] [PubMed]
- Blitvich, B.J.; Bowen, R.A.; Marlenee, N.L.; Hall, R.A.; Bunning, M.L.; Beaty, B.J. Epitope-blocking enzyme-linked immunosorbent assays for detection of west nile virus antibodies in domestic mammals. J. Clin. Microbiol. 2003, 41, 2676–2679. [Google Scholar] [CrossRef] [PubMed]
- Dayan, G.H.; Bevilacqua, J.; Coleman, D.; Buldo, A.; Risi, G. Phase II, dose ranging study of the safety and immunogenicity of single dose west nile vaccine in healthy adults ≥50 years of age. Vaccine 2012, 30, 6656–6664. [Google Scholar] [CrossRef] [PubMed]
- Ratterree, M.S.; Gutierrez, R.A.; Travassos da Rosa, A.P.; Dille, B.J.; Beasley, D.W.; Bohm, R.P.; Desai, S.M.; Didier, P.J.; Bikenmeyer, L.G.; Dawson, G.J.; et al. Experimental infection of rhesus macaques with west nile virus: Level and duration of viremia and kinetics of the antibody response after infection. J. Infect. Dis. 2004, 189, 669–676. [Google Scholar] [CrossRef] [PubMed]
- Seino, K.K.; Long, M.T.; Gibbs, E.P.; Bowen, R.A.; Beachboard, S.E.; Humphrey, P.P.; Dixon, M.A.; Bourgeois, M.A. Comparative efficacies of three commercially available vaccines against west nile virus (wnv) in a short-duration challenge trial involving an equine wnv encephalitis model. Clin. Vaccine Immunol. 2007, 14, 1465–1471. [Google Scholar] [CrossRef] [PubMed]
- Castillo-Olivares, J.; Mansfield, K.L.; Phipps, L.P.; Johnson, N.; Tearle, J.; Fooks, A.R. Antibody response in horses following experimental infection with west nile virus lineages 1 and 2. Transbound. Emerg. Dis. 2011, 58, 206–212. [Google Scholar] [CrossRef] [PubMed]
- Busch, M.P.; Kleinman, S.H.; Tobler, L.H.; Kamel, H.T.; Norris, P.J.; Walsh, I.; Matud, J.L.; Prince, H.E.; Lanciotti, R.S.; Wright, D.J.; et al. Virus and antibody dynamics in acute west nile virus infection. J. Infect. Dis. 2008, 198, 984–993. [Google Scholar] [CrossRef] [PubMed]
- Styer, L.M.; Kent, K.A.; Albright, R.G.; Bennett, C.J.; Kramer, L.D.; Bernard, K.A. Mosquitoes inoculate high doses of west nile virus as they probe and feed on live hosts. PLoS Pathog. 2007, 3, 1262–1270. [Google Scholar] [CrossRef] [PubMed]
- Lobigs, M.; Marshall, I.D.; Weir, R.C.; Dalgarno, L. Murray valley encephalitis virus field strains from australia and papua new guinea: Studies on the sequence of the major envelope protein gene and virulence for mice. Virology 1988, 165, 245–255. [Google Scholar] [CrossRef] [PubMed]
- Brown, A.N.; Kent, K.A.; Bennett, C.J.; Bernard, K.A. Tissue tropism and neuroinvasion of west nile virus do not differ for two mouse strains with different survival rates. Virology 2007, 368, 422–430. [Google Scholar] [CrossRef] [PubMed]
- Epp, T.; Waldner, C.; West, K.; Townsend, H. Factors associated with west nile virus disease fatalities in horses. Can. Vet. J. 2007, 48, 1137–1145. [Google Scholar] [PubMed]
- Byrne, S.N.; Halliday, G.M.; Johnston, L.J.; King, N.J. Interleukin-1beta but not tumor necrosis factor is involved in west nile virus-induced langerhans cell migration from the skin in c57bl/6 mice. J. Investig. Dermatol. 2001, 117, 702–709. [Google Scholar] [CrossRef] [PubMed]
- Johnston, L.J.; Halliday, G.M.; King, N.J. Langerhans cells migrate to local lymph nodes following cutaneous infection with an arbovirus. J. Investig. Dermatol. 2000, 114, 560–568. [Google Scholar] [CrossRef] [PubMed]
- Tiawsirisup, S.; Platt, K.B.; Tucker, B.J.; Rowley, W.A. Eastern cottontail rabbits (sylvilagus floridanus) develop west nile virus viremias sufficient for infecting select mosquito species. Vector Borne Zoonotic Dis. 2005, 5, 342–350. [Google Scholar] [CrossRef] [PubMed]
- Kay, B.H.; Young, P.L.; Hall, R.A.; Fanning, I.D. Experimental infection with murray valley encephalitis virus. Pigs, cattle, sheep, dogs, rabbits, macropods and chickens. Aust. J. Exp. Biol. Med. Sci. 1985, 63, 109–126. [Google Scholar] [CrossRef] [PubMed]
- Verstrepen, B.E.; Fagrouch, Z.; van Heteren, M.; Buitendijk, H.; Haaksma, T.; Beenhakker, N.; Palu, G.; Richner, J.M.; Diamond, M.S.; Bogers, W.M.; et al. Experimental infection of rhesus macaques and common marmosets with a european strain of west nile virus. PLoS Negl. Trop. Dis. 2014, 8, e2797. [Google Scholar] [CrossRef] [PubMed]
- Smith, R.D.; Konoplev, S.; DeCourten-Myers, G.; Brown, T. West nile virus encephalitis with myositis and orchitis. Hum. Pathol. 2004, 35, 254–258. [Google Scholar] [CrossRef] [PubMed]
- McMinn, P.C.; Dalgarno, L.; Weir, R.C. A comparison of the spread of murray valley encephalitis viruses of high or low neuroinvasiveness in the tissues of swiss mice after peripheral inoculation. Virology 1996, 220, 414–423. [Google Scholar] [CrossRef] [PubMed]
- Hussmann, K.L.; Samuel, M.A.; Kim, K.S.; Diamond, M.S.; Fredericksen, B.L. Differential replication of pathogenic and nonpathogenic strains of west nile virus within astrocytes. J. Virol. 2013, 87, 2814–2822. [Google Scholar] [CrossRef] [PubMed]
- Laurent-Rolle, M.; Boer, E.F.; Lubick, K.J.; Wolfinbarger, J.B.; Carmody, A.B.; Rockx, B.; Liu, W.; Ashour, J.; Shupert, W.L.; Holbrook, M.R.; et al. The ns5 protein of the virulent west nile virus ny99 strain is a potent antagonist of type i interferon-mediated jak-stat signaling. J. Virol. 2010, 84, 3503–3515. [Google Scholar] [CrossRef] [PubMed] [Green Version]
- Keller, B.C.; Fredericksen, B.L.; Samuel, M.A.; Mock, R.E.; Mason, P.W.; Diamond, M.S.; Gale, M., Jr. Resistance to alpha/beta interferon is a determinant of west nile virus replication fitness and virulence. J. Virol. 2006, 80, 9424–9434. [Google Scholar] [CrossRef] [PubMed]
- Purtha, W.E.; Chachu, K.A.; Virgin, H.W.T.; Diamond, M.S. Early b-cell activation after west nile virus infection requires alpha/beta interferon but not antigen receptor signaling. J. Virol. 2008, 82, 10964–10974. [Google Scholar] [CrossRef] [PubMed]
- Hayes, E.B.; Sejvar, J.J.; Zaki, S.R.; Lanciotti, R.S.; Bode, A.V.; Campbell, G.L. Virology, pathology, and clinical manifestations of west nile virus disease. Emerg. Infect. Dis. 2005, 11, 1174–1179. [Google Scholar] [CrossRef] [PubMed]
- Neves, P.C.C.; Santos, J.R.; Tubarão, L.N.; Bonaldo, M.C.; Galler, R. Early ifn-gamma production after yf 17d vaccine virus immunization in mice and its association with adaptive immune responses. PLoS ONE 2013, 8, e81953. [Google Scholar] [CrossRef] [PubMed]
- Lopez-Griego, L.; Nava-Castro, K.E.; Lopez-Salazar, V.; Hernandez-Cervantes, R.; Tiempos Guzman, N.; Muniz-Hernandez, S.; Hernandez-Bello, R.; Besedovsky, H.O.; Pavon, L.; Becerril Villanueva, L.E.; et al. Gender-associated differential expression of cytokines in specific areas of the brain during helminth infection. J. Interferon Cytokine Res. 2015, 35, 116–125. [Google Scholar] [CrossRef] [PubMed]
- Peng, S.Y.; Chu, T.H.; Wang, I.C.; Chung, W.C.; Yu, K.W.; Tsaihong, J.C.; Huang, J.C.; Fan, P.C. Infection of normal c3h/hen mice with taenia saginata asiatica oncospheres. Res. Vet. Sci. 2009, 86, 261–266. [Google Scholar] [CrossRef] [PubMed]
- MacMicking, J.; Xie, Q.W.; Nathan, C. Nitric oxide and macrophage function. Annu. Rev. Immunol. 1997, 15, 323–350. [Google Scholar] [CrossRef] [PubMed]
- Kreutzberg, G.W. Microglia: A sensor for pathological events in the cns. Trends Neurosci. 1996, 19, 312–318. [Google Scholar] [CrossRef]
- Miller, J.D.; van der Most, R.G.; Akondy, R.S.; Glidewell, J.T.; Albott, S.; Masopust, D.; Murali-Krishna, K.; Mahar, P.L.; Edupuganti, S.; Lalor, S.; et al. Human effector and memory cd8(+) t cell responses to smallpox and yellow fever vaccines. Immunity 2008, 28, 710–722. [Google Scholar] [CrossRef] [PubMed]
- Dittmer, U.; Peterson, K.E.; Messer, R.; Stromnes, I.M.; Race, B.; Hasenkrug, K.J. Role of interleukin-4 (il-4), il-12, and gamma interferon in primary and vaccine-primed immune responses to friend retrovirus infection. J. Virol. 2001, 75, 654–660. [Google Scholar] [CrossRef] [PubMed]
- Liu, S.Y.; Sanchez, D.J.; Aliyari, R.; Lu, S.; Cheng, G. Systematic identification of type i and type ii interferon-induced antiviral factors. Proc. Natl. Acad. Sci. USA 2012, 109, 4239–4244. [Google Scholar] [CrossRef] [PubMed]
- Girdlestone, J.; Wing, M. Autocrine activation by interferon-gamma of stat factors following t cell activation. Eur. J. Immunol. 1996, 26, 704–709. [Google Scholar] [CrossRef] [PubMed]
- Christmas, S.E.; Meager, A. Production of interferon-gamma and tumor-necrosis-factor-alpha by human t-cell clones expressing different forms of the gamma-delta-receptor. Immunology 1990, 71, 486–492. [Google Scholar] [PubMed]
- Biron, C.A.; Nguyen, K.B.; Pien, G.C.; Cousens, L.P.; Salazar-Mather, T.P. Natural killer cells in antiviral defense: Function and regulation by innate cytokines. Annu. Rev. Immunol. 1999, 17, 189–220. [Google Scholar] [CrossRef] [PubMed]
- Omalu, B.I.; Shakir, A.A.; Wang, G.; Lipkin, W.I.; Wiley, C.A. Fatal fulminant pan-meningo-polioencephalitis due to west nile virus. Brain Pathol. 2003, 13, 465–472. [Google Scholar] [CrossRef] [PubMed]
- Maximova, O.A.; Ward, J.M.; Asher, D.M.; St Claire, M.; Finneyfrock, B.W.; Speicher, J.M.; Murphy, B.R.; Pletnev, A.G. Comparative neuropathogenesis and neurovirulence of attenuated flaviviruses in nonhuman primates. J. Virol. 2008, 82, 5255–5268. [Google Scholar] [CrossRef] [PubMed]
- Pusterla, N.; Wilson, W.D.; Conrad, P.A.; Mapes, S.; Leutenegger, C.M. Comparative analysis of cytokine gene expression in cerebrospinal fluid of horses without neurologic signs or with selected neurologic disorders. Am. J. Vet. Res. 2006, 67, 1433–1437. [Google Scholar] [CrossRef] [PubMed]
- Wei, Y.P.; Kita, M.; Shinmura, K.; Yan, X.Q.; Fukuyama, R.; Fushiki, S.; Imanishi, J. Expression of ifn-gamma in cerebrovascular endothelial cells from aged mice. J. Interferon Cytokine Res. 2000, 20, 403–409. [Google Scholar] [CrossRef] [PubMed]
- Neumann, H.; Schmidt, H.; Wilharm, E.; Behrens, L.; Wekerle, H. Interferon gamma gene expression in sensory neurons: Evidence for autocrine gene regulation. J. Exp. Med. 1997, 186, 2023–2031. [Google Scholar] [CrossRef] [PubMed]
- Beasley, D.W.; Barrett, A.D.; Tesh, R.B. Resurgence of west nile neurologic disease in the united states in 2012: What happened? What needs to be done? Antivir. Res. 2013, 99, 1–5. [Google Scholar] [CrossRef] [PubMed]
- Dalgarno, L.; Trent, D.W.; Strauss, J.H.; Rice, C.M. Partial nucleotide sequence of the murray valley encephalitis virus genome. Comparison of the encoded polypeptides with yellow fever virus structural and non-structural proteins. J. Mol. Biol. 1986, 187, 309–323. [Google Scholar] [CrossRef]
- Lorenz, M.D.; Coates, J.R.; Kent, M. Handbook of Veterinary Neurology, 5th ed.; Elsevier/Saunders: St. Louis, MI, USA, 2011; p. 28. [Google Scholar]
- Tolnay, A.E.; Baskin, C.R.; Tumpey, T.M.; Sabourin, P.J.; Sabourin, C.L.; Long, J.P.; Pyles, J.A.; Albrecht, R.A.; Garcia-Sastre, A.; Katze, M.G.; et al. Extrapulmonary tissue responses in cynomolgus macaques (macaca fascicularis) infected with highly pathogenic avian influenza a (h5n1) virus. Arch. Virol. 2010, 155, 905–914. [Google Scholar] [CrossRef] [PubMed]
- Hall, R.A.; Kay, B.H.; Burgess, G.W. An enzyme immunoassay to detect australian flaviviruses and identify the encephalitic subgroup using monoclonal antibodies. Immunol. Cell Biol. 1987, 65, 103–110. [Google Scholar] [CrossRef] [PubMed]
- Bowen, R.A.; Rouge, M.M.; Siger, L.; Minke, J.M.; Nordgren, R.; Karaca, K.; Johnson, J. Pathogenesis of west nile virus infection in dogs treated with glucocorticoids. Am. J. Trop. Med. Hyg. 2006, 74, 670–673. [Google Scholar] [PubMed]
- Prow, N.A.; Tan, C.S.; Wang, W.; Hobson-Peters, J.; Kidd, L.; Barton, A.; Wright, J.; Hall, R.A.; Bielefeldt-Ohmann, H. Natural exposure of horses to mosquito-borne flaviviruses in south-east queensland, australia. Int. J. Environ. Res. Public. Health 2013, 10, 4432–4443. [Google Scholar] [CrossRef] [PubMed]
- Prow, N.A.; Hewlett, E.K.; Faddy, H.M.; Coiacetto, F.; Wang, W.; Cox, T.; Hall, R.A.; Bielefeldt-Ohmann, H. The australian public is still vulnerable to emerging virulent strains of west nile virus. Front. Public Health 2014, 2, 146. [Google Scholar] [CrossRef] [PubMed]
- Pyke, A.T.; Smith, I.L.; van den Hurk, A.F.; Northill, J.A.; Chuan, T.F.; Westacott, A.J.; Smith, G.A. Detection of australasian flavivirus encephalitic viruses using rapid fluorogenic taqman rt-pcr assays. J. Virol. Methods 2004, 117, 161–167. [Google Scholar] [CrossRef] [PubMed]
- Lanciotti, R.S.; Kerst, A.J.; Nasci, R.S.; Godsey, M.S.; Mitchell, C.J.; Savage, H.M.; Komar, N.; Panella, N.A.; Allen, B.C.; Volpe, K.E.; et al. Rapid detection of west nile virus from human clinical specimens, field-collected mosquitoes, and avian samples by a taqman reverse transcriptase-pcr assay. J. Clin. Microbiol. 2000, 38, 4066–4071. [Google Scholar] [PubMed]
- Schnupf, P.; Sansonetti, P.J. Quantitative rt-pcr profiling of the rabbit immune response: Assessment of acute shigella flexneri infection. PLoS ONE 2012, 7, e36446. [Google Scholar] [CrossRef] [PubMed]
- Pfaffl, M.W. A new mathematical model for relative quantification in real-time rt-pcr. Nucl. Acids Res. 2001, 29, e45. [Google Scholar] [CrossRef] [PubMed]
- Smirnova, N.P.; Webb, B.T.; Bielefeldt-Ohmann, H.; Van Campen, H.; Antoniazzi, A.Q.; Morarie, S.E.; Hansen, T.R. Development of fetal and placental innate immune responses during establishment of persistent infection with bovine viral diarrhea virus. Virus Res. 2012, 167, 329–336. [Google Scholar] [CrossRef] [PubMed]
© 2015 by the authors; licensee MDPI, Basel, Switzerland. This article is an open access article distributed under the terms and conditions of the Creative Commons Attribution license (http://creativecommons.org/licenses/by/4.0/).
Share and Cite
Suen, W.W.; Uddin, M.J.; Wang, W.; Brown, V.; Adney, D.R.; Broad, N.; Prow, N.A.; Bowen, R.A.; Hall, R.A.; Bielefeldt-Ohmann, H. Experimental West Nile Virus Infection in Rabbits: An Alternative Model for Studying Induction of Disease and Virus Control. Pathogens 2015, 4, 529-558. https://doi.org/10.3390/pathogens4030529
Suen WW, Uddin MJ, Wang W, Brown V, Adney DR, Broad N, Prow NA, Bowen RA, Hall RA, Bielefeldt-Ohmann H. Experimental West Nile Virus Infection in Rabbits: An Alternative Model for Studying Induction of Disease and Virus Control. Pathogens. 2015; 4(3):529-558. https://doi.org/10.3390/pathogens4030529
Chicago/Turabian StyleSuen, Willy W., Muhammad J. Uddin, Wenqi Wang, Vienna Brown, Danielle R. Adney, Nicole Broad, Natalie A. Prow, Richard A. Bowen, Roy A. Hall, and Helle Bielefeldt-Ohmann. 2015. "Experimental West Nile Virus Infection in Rabbits: An Alternative Model for Studying Induction of Disease and Virus Control" Pathogens 4, no. 3: 529-558. https://doi.org/10.3390/pathogens4030529