Nomenclature
| Symbol | Name | Description |
| (x) | Sampling statistic average | Average value of index EP |
| Median | Numerical value separating the higher half of sampling from the lower half |
| (δ) | Standard deviation | Dispersion from the average value |
| Confidence interval | Actual value of any other data is not known, but an interval can in most cases be defined, that has a high probability (e.g., 95% or 99%) to contain the actual value |
| (μ) | Expected value | Random variable is the weighted average of all possible values that this random variable can take on |
| Indicator |
| (GFEC) | Gross final regional energy consumption | Estimated sum of total regional primary energy consumption |
| (GDSU) | Gross dwelling net floor surface | Estimated sum of dwelling urban units net floor surface, result of product from average urban units floor surface and number of dwellings |
| Index EPtot | - | Energy performance index EP, primary energy consumption, for heating (EPi) and DHW (EPacs), calculated for following standard UNITS 11300 |
| (AIEP) | Average Index EPAIEP (AIEP) | Result of an average of Index EPtot for each building |
| (AAIEP) | Aggregate Average Index EPAAIEP (AAIEP) | Result of ratio between total energy consumption (kWh/year) and gross volume or units floor surface for residential buildings |
| Subscription |
| (RER) | Value refers to the Region |
| (VER) | Value refers to Verucchio |
| (corr) | Value corrected by gap percentage |
| Average | Average value |
| pro | Projection value |
| GSU | Gross urban units net floor surface |
| ASU | Average urban units net floor surface |
| SU | Urban units net floor surface |
| E | Energy |
| DBp | DATABASE projection |
| DBm | DATABASE measured (by SACE) |
1. Introduction
Directive 2002/91/EC (EPBD) [
1] and Directive 2010/31/EU (EPBD-recast) [
2] introduced the Energy Performance Certificate (EPC) in the European Union real estate market, and was adopted by each Member State in different ways [
3,
4,
5,
6]. The EPBD was endorsed in Italy by L. Decree 192/2005 [
7] and M. Decree of 26 June 2009 [
8], but on this matter the Italian Constitution authorized the Regions to make their own laws provided they respected the general and national norms established [
9,
10].
Each Region therefore adopted its own rules to define the EPC energy class ratings, to be cited on the certificate and also several EPC model certificates with their own list of certifiers (independent experts). The Italian case study presented in this paper could be applied in other European State Members [
11,
12,
13,
14,
15,
16]. The Emilia-Romagna region has adopted a specific discipline on matters of EPC and created an online Sistema Accreditamento Certificazione Energetica (SACE—System for the online issuance of Certificates) that can monitor the EPC trends. SACE is an Emilia-Romagna Region online application in order to submit official EPCs, and SACE is therefore a Regional EPC Database.
The EPC was introduced as an information tool for the EU real estate market. In Italy the EPC is required in the same cases and also for the sale or lease of a building or building units. The EPC thus contains sensitive information about a building, and is useful to the owner, buyer or the real estate market. The data also increases awareness of legislators or Public Administrators who may lay down energy policies and incentives on the basis of the energy performance features of their own building estates. This paper describe how the EPC can be used as an index to measure energy performance of buildings in a region and in relation to possible scenarios for energy policies, funding and incentives.
Energy performance evaluation processes are studied through statistical research using [
17,
18] the
top down [
19,
20] or
bottom up approach [
21]. The top down method, also used in econometric studies, is based in national statistics of energy usage, related for example, to national (or regional) gas consumption [
22], as referred to territorial indicators (such as homes or buildings) issued by ISTAT (Italian National Institute of Statistics) Census [
23].
These methods are used in urban planning or energy scheduling on a large scale such as for the European Union and nations or regions, to support policy makers in determining the expected changes in customs or behavior based on certain indicators and corrective systems. For energy and environmental planning, the top-down methodology refers to energy-cumulative value (aggregates) composed of the sum of energy consumption obtained from several resources: institutional research centers, energy sales agencies or energy distributors, and energy buyers. These values are only cumulative because they are personally identifiable information, and are related to privacy norms and contracts between energy sales companies and customers.
The bottom-up approach is based on a hierarchy of disaggregated levels for each energy technology. The bottom-up evaluation in energy performance of buildings and of the energy performance certificate (EPC) may relate to only one building, taken as a representative element (reference building) and multiplied by the number of similar buildings, or could otherwise be related to existing building stocks. The building stock could be aggregated according to:
- (a)
Continuity, (quarters, city districts);
- (b)
Building types, (high-risers, villas, block buildings, housing estates, etc.);
- (c)
Designated use (dwellings, schools, hospitals, etc.);
- (d)
Adopting energy evaluation methods following the standards.
The top-down and bottom–up assessments are founded on two different data sets: in the top-down method the data set is related to boundary investigation, while in the bottom-up method the data set is related to the sampling of a single territory. This paper compares both methods:
- (a)
The top-down by using the aggregate data set of all regions taken from ISTAT and databases of the Emilia-Romagna Region;
- (b)
The bottom-up by using the single sampling statistic based on the EPC from SACE databases, where each EPC is related to a single urban unit.
For an in-depth view of the top-down and bottom-up methods, consult [
24,
25,
26].
For example, the requirements for minimum renewable energy provided by Directive 2009/28/EC [
27] for each EU Member State, are defined as the ratio between the sums of energy produced from renewable energy sources and the
Gross Final Energy Consumption (GFEC).
Furthermore, the studies on energy performance of new and existing building stocks, are based on the statistical analysis of the aggregate database. Another approach is based on energy building performance (EBP) with the evaluation of exemplificative buildings, generally residential estates or the estimation of average transmittance incidences multiplied by the total number of buildings, or other statistical data [
28].
2. Aim of Paper
This paper illustrates a specific case of the Energy Performance Certificate (EPC) database of a commune in the Italian Emilia-Romagna Region. The aims of the paper are:
- (a)
To describe the EPC database, in order to define the statistical indicator index applied to the case study, and therefore only urban units equipped with an EPC, to be taken as a statistical sample representative of the whole municipal territory.
- (b)
To compare the energy index between the bottom-up method, at town level, obtained by the sum of energy performances reported in the EPC database, and the top-down method, at regional level, obtained from the aggregate value supplied by energy distributors according to national statistics.
- (c)
Once the criteria have been defined, passing from bottom-up to top-down scales, and vice versa, with the relative statistical error gaps, we will compare some simulation scenarios, each of which will have a different percentage distribution of energy class of the new EPC, in order to study the changes in the statistical energy index indicator. The criterion adopted is the following: if the value (x) percentage of certified buildings compared to the total of existing buildings in the territory, with a (y) distribution of energy class rating, have determined values of the energy index indicator in cases where a scenario changes with a (x + dx) percentage of EPC buildings and a (z) distribution of energy class rating, what changes will come about in the energyindexindicator? Can these changes be used to measure energy efficiency of the trends of energy policies or the real estate market?
- (d)
To study future regional scenarios in order to schedule region energy policy decision;
- (e)
To compare the EPC database results for 2010 with those for 2011 and to verify statistical data, as per point (c).
The study focuses on two scales:
On a large scale, related to the Emilia-Romagna Region, located in the center north of Italy;
On a small (or local) scale, related to Verucchio town (almost 10,000 population) located south-east of the Emilia-Romagna Region.
The databases and values used in this paper are:
ISTAT Database, for the number of buildings and territorial surfaces;
SACE Database, for EPC, energy index EPtot and Energy Class of Verucchio town.
In order to clarify the interpretation of the energy index, it is important to point out that this paper does not deal with the metering methods in calculating energy performance of a single building through software and dynamic simulations of building behavior, such as the Energyplus, TRNSYS, etc.). These simulations are generally used for single building scales to evaluate and compare the real energy consumption of some parameters of single buildings (energy temperature, radiating mean temperature, ventilation, etc.) with the calculation model.
In this paper, the index EP
tot, in kWh/m
2year of primary energy, is related to heating and Domestic Hot Water (DHW) energy consumption. The energy class rating depends on the EP
tot range value. The independent expert records the EPC on the database, inserting the EP
tot value, calculated following standards UNITS 11300 [
29], which are the national application of EN ISO 13790 [
30]. The calculation methodology is based on the building’s energy balance.
This paper makes a statistical study of the index EPtot, value taken as such from the SACE Database-using the top-down method, and the single values of the EPtot index indicator aggregates. The evaluations are based solely on the EPC Database values which are obviously the tools used to acquire the energy performance values of buildings on a large-scale. Not knowing the real energy behavior of all the buildings, or their geometries or any other kind of thermo-physics parameters, the assessment of energy behavior of the buildings is like a black box where we adopt the EPC value registered in the SACE database by independent experts.
The aggregate energy value refers to a percentage of total buildings in Verucchio, that acts as sampling statistics from which we have adopted two pathways:
The bottom-up (EPC value) approach to top-down values: the aggregate value of Verucchio and the Region’s energy index are determined from the aggregate statistical energy index of the SACE database;
The top-down approach to bottom-up values: the aggregate statistical energy index of the SACE is verified from the total regional energy consumption (in MWh/year). The assessment described in this paper is based on basic statistical tools such as the following data input: Territory surface size km2; dwelling apartments (by ISTAT); number of apartments per building; Apartment/km2 (dwelling density); total floor net surface (m2); average floor surface SU (m2) of dwellings in pursuit of energy territorial indices to measure energy status and scenarios.
4. Case Study: Verucchio Town’s Database
The SACE database was studied in August 2010 and regards the EPCs of the little town of Verucchio in mid-northern Italy (and in the southeastern region of Emilia-Romagna in the Rimini hinterlands).
The Commune of Verucchio measures 27 km2, with 1735 residential buildings, and 4509 urban dwelling units (ISTAT Census 2001).
The data analysis arouses interest because it is a large-scale top down description (aerial assessment) with the relevant marginal errors.
As of 2010, the number of EPCs was 257 for new and existing buildings, of which 200 were regarded as dwelling urban units, equal to 4.44% of all the residential buildings in Verucchio.
The percentage of EPCs issued gives an initial description of energy indicators of the commune’s building stock, and helps to verify whether, from the statistical viewpoint, the evaluations of the data in the database convey an idea of the actual state and allow for possible simulations.
The distribution of the energy use of the certified buildings are: 77.82% of EPCs are dwelling units (E.1); 7.39% are designated as office units (E.2); 3.11% are for recreational activity, for example bars, pubs, restaurants (E.4); 5.06% are market units and include shopping centers (E.5); 3.50% are for school activities (E.7) and only 1.95% are for production activities (E.8). Hospitals are not present.
The gross volume percentage distribution highlights how the percentages of residential buildings are only 3.56%, and 68.82% of gross volume are for shopping centers. This is because in such a small territory, the presence of one big shopping center (E.5) distorts the data.
The Energy Class distribution show that only 1.56% of EPCs belong to Energy Class A, 9.73% to Class B, and 22.18% to Class C. These rates presumably refer to new or retrofit buildings. To continue, 16.73% belong to Class D, 10.51% to Class E, 7.00% to Class F, and 13.23% to Class G.
The percentages of worse energy Classes F and G are lower than the regional value. The number of buildings without EPCs due to the lack of heating plants or for other reasons is 19.07%, which is a significant rate. The uncertified buildings are those without heating systems or those having less than 15 kW rated power.
The energy index drawn from the database is called energy performance index EPtot (or Index EPtot) of primary energy, measured in (kWh/m2 year), for dwellings, or in (kWh/m3 year) for other buildings. The energy consumption for each building, is expressed in kWh/year of primary energy, and this is achieved by multiplying the Index EPtot by the gross volume and in the case of non-residential buildings, the volume is divided by 2.70 m average height presumed for dwelling units.
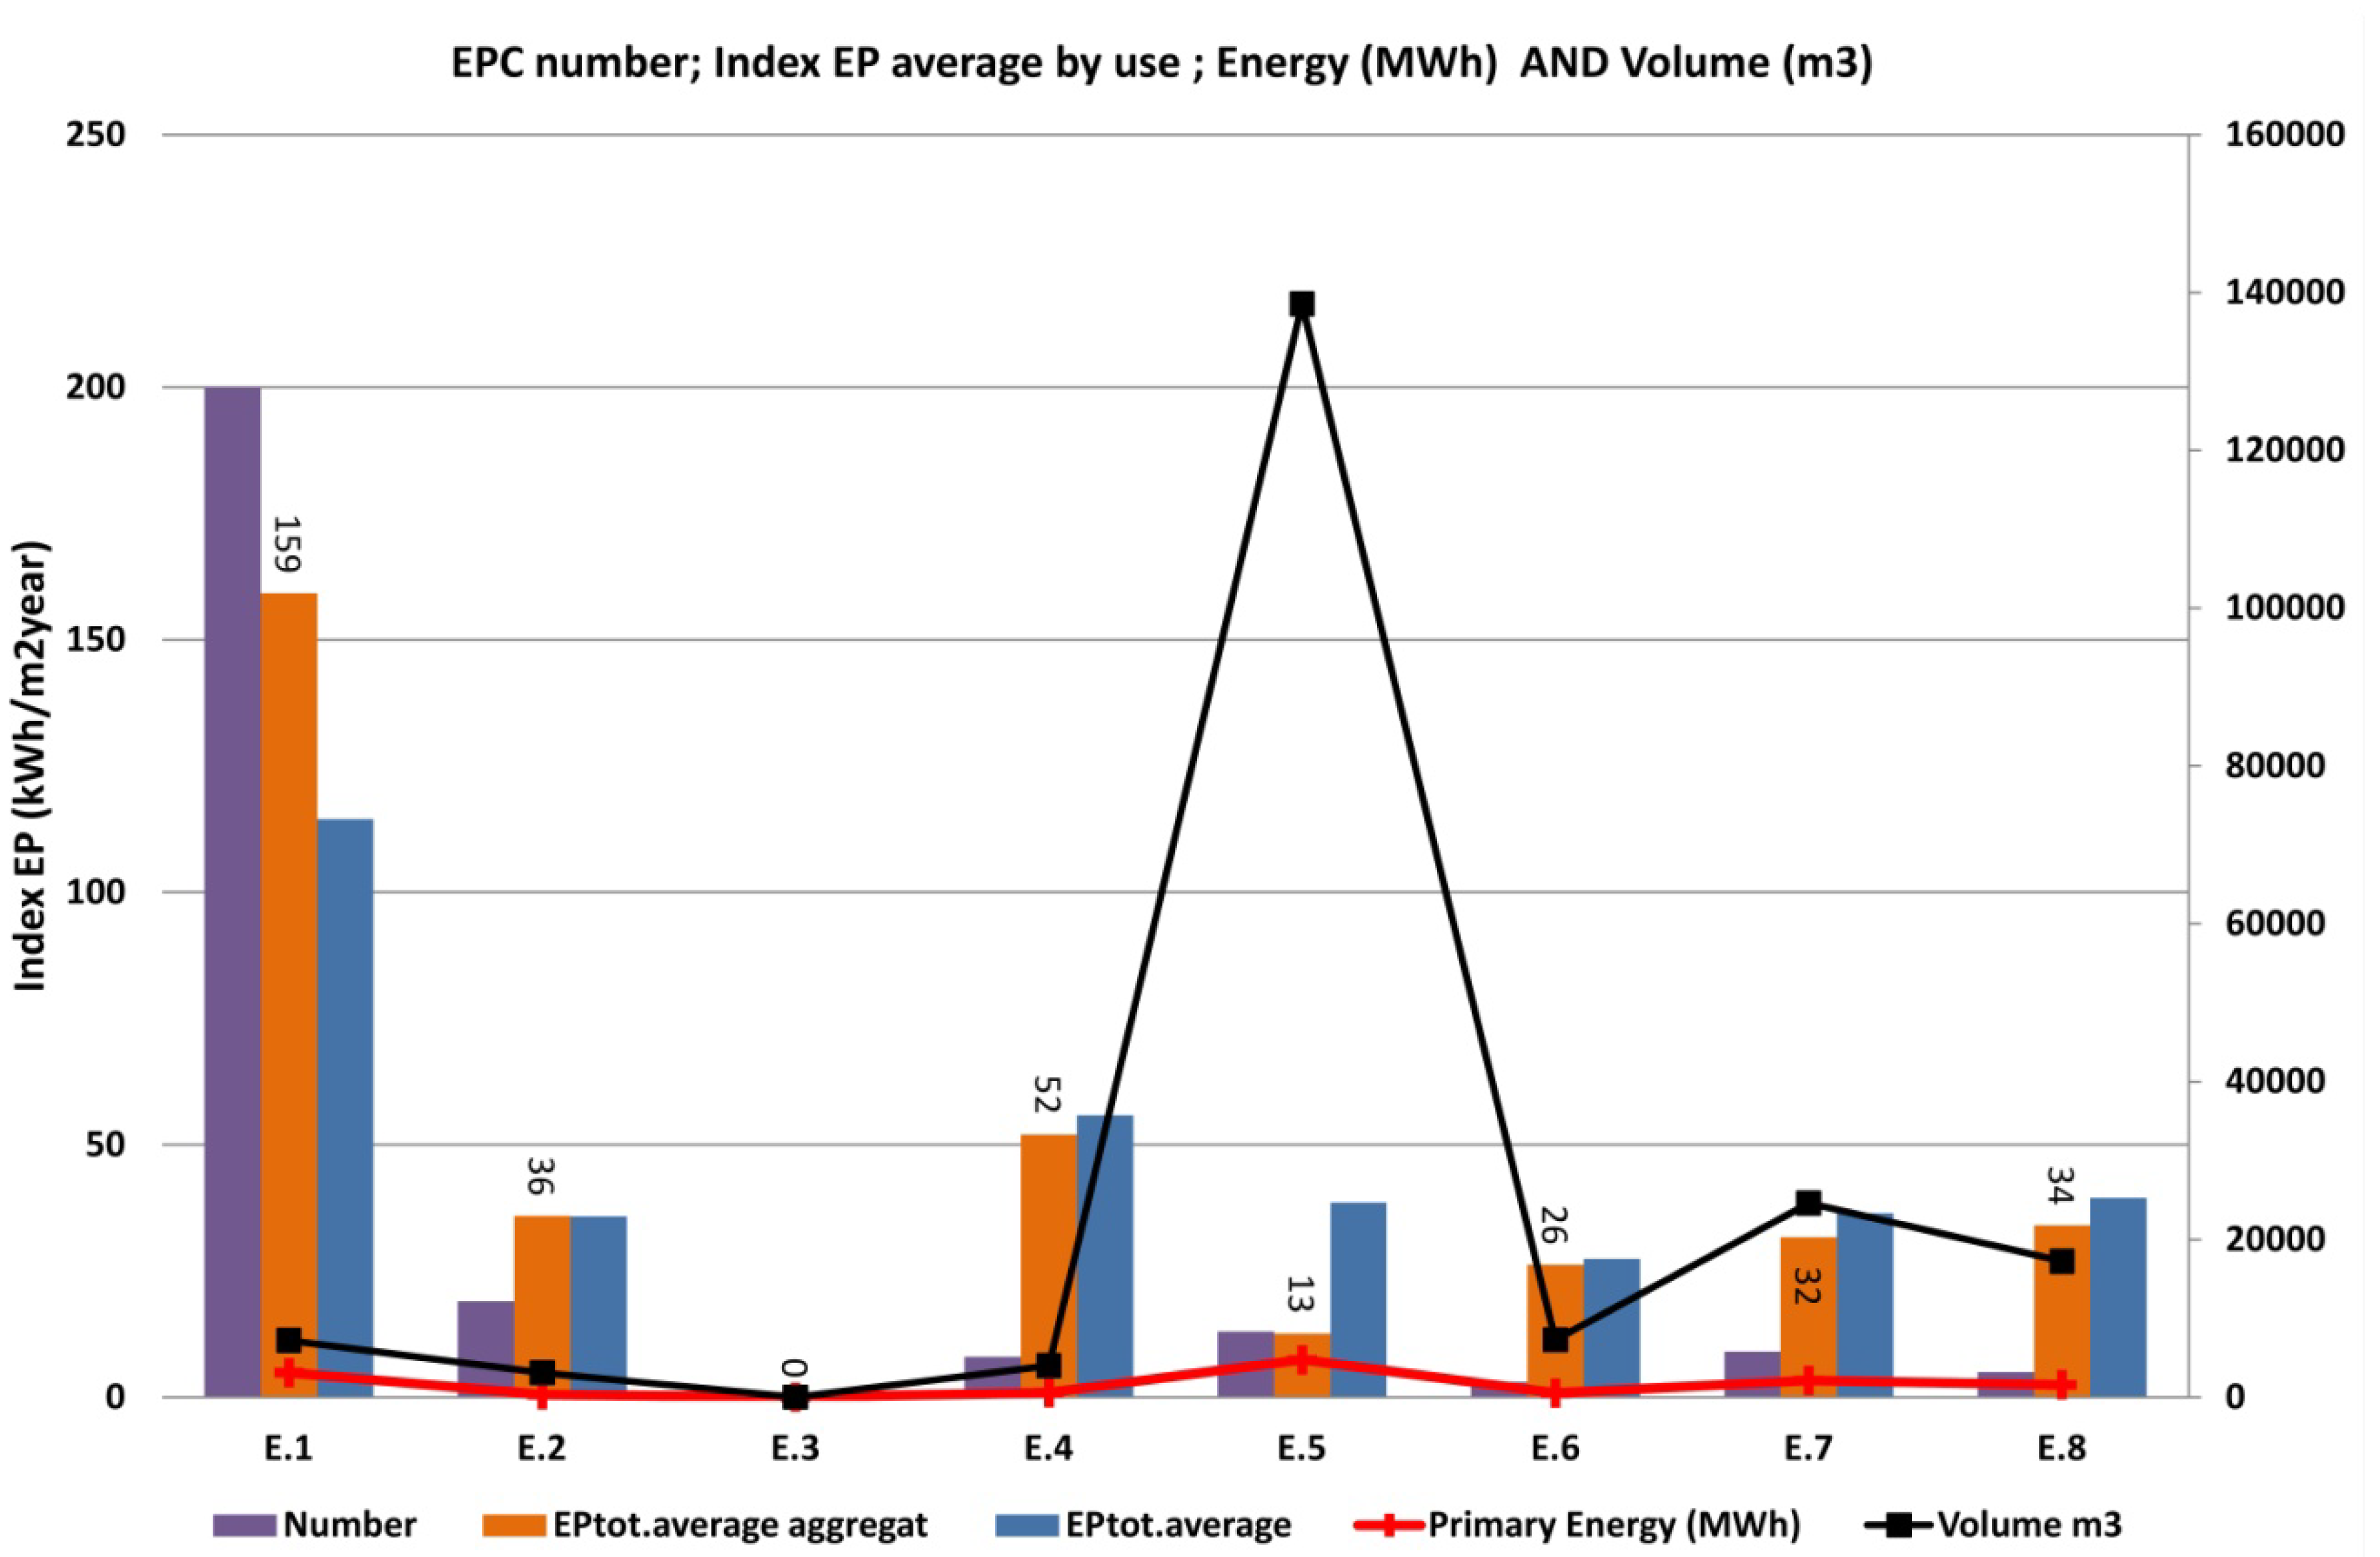
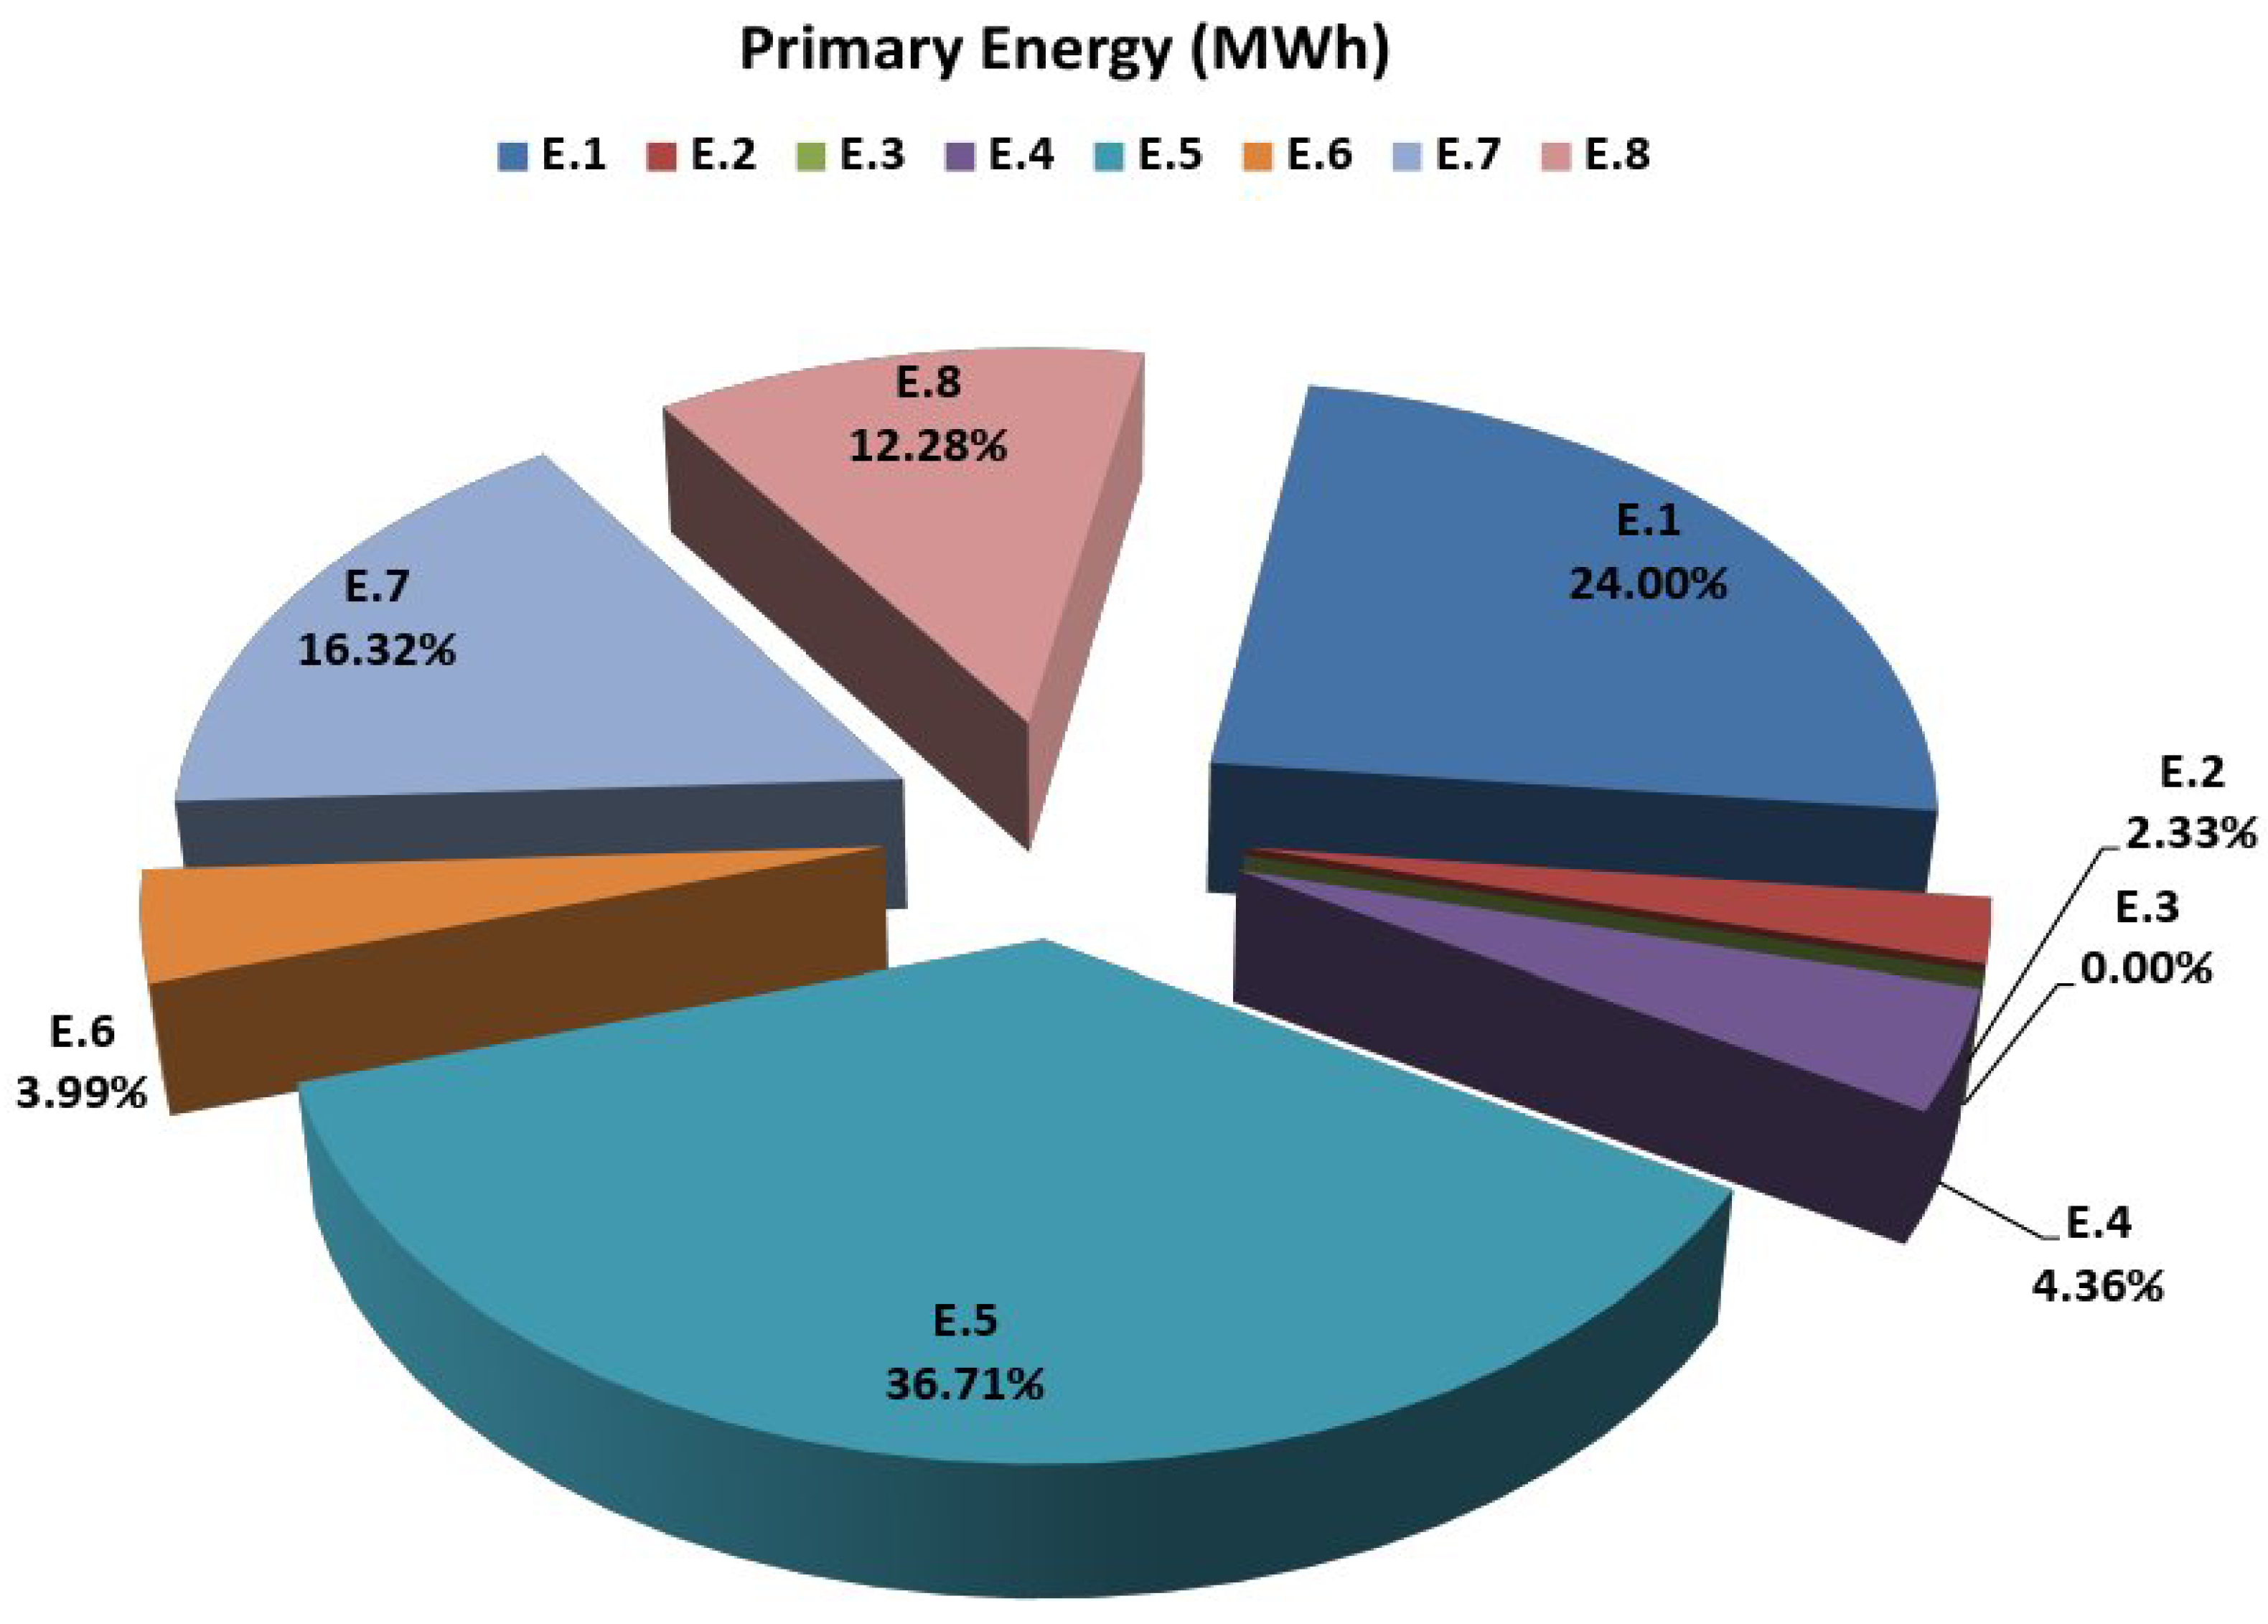
Table 2 shows the total sums of energy consumption for each building according to assigned usage. In this case the bigger consumption is related to shopping centers (E.5), with bigger volumes, followed by school buildings (E.7). The energy performance index of dwellings is 24%, without considering the shopping centers (which are an exception). The incidence of dwellings is 37.91% (
Figure 1).
Table 2.
Verucchio Energy Performance Certificate (EPC) Database–Volume, number energy and energy Index EPtot.
Table 2.
Verucchio Energy Performance Certificate (EPC) Database–Volume, number energy and energy Index EPtot.
| Building tippology | Volume (m3) | Numbers | Energy (MWh) | AAI EPtot | AI EPtot | Gap (%) *** |
|---|
| E.1 Dwellings | 7195.11 ** | 208 | 3,092.87 | 159.21 **** | 114.50 **** | ±28.08% |
| E.2 Offices | 3101.94 | 19 | 300.85 | 35.92 | 35.80 | ±0.33% |
| E.3 Hospitals | 0 | 0 | 0 | 0 | 0 | ±0.00% |
| E.4 Recreational activities | 3997.12 | 8 | 561.71 | 52.05 | 55.87 | ±7.34% |
| E.5 Markets/shopping centers | 138,561.85 | 13 | 4730.52 | 12.64 | 38.52 | ±204.61% |
| E.6 Sport buildings | 7258.00 | 3 | 514.32 | 26.25 | 27.38 | ±4.34% |
| E.7 School activities | 24,586.81 | 9 | 2102.70 | 31.67 | 36.48 | ±15.58% |
| E.8 Production activities | 17,220.36 | 5 | 1582.05 | 34.03 | 39.50 | ±16.10% |
| TOTAL | 201,921.20 | 257 | 12,885.00 | 31.44 * | 34.49 * | ±9.71% |
Figure 1.
Primary energy by building energy use, excluding E:5 shopping center.
Figure 1.
Primary energy by building energy use, excluding E:5 shopping center.
The Average Index EP
AIEP (AIEP) is the result of an average of Index EP for each building. On the other hand the Aggregate Average Index EP
AAIEP (AAIEP) results from the ratio between
total energy consumption (kWh/year) and
gross volume or
floor surface units according to the assigned usage. The AIEP and AAIEP values do not concur; the gap depends on the assigned use of the building and the number of certified buildings. The greater the number of buildings (residential) or the size variables (shopping centers), the greater will be the gap between the mean value and the mean aggregate value.
Figure 2 shows the energy consumption (MWh) according to the assigned use of the buildings, the number of EPC certificates issued, the EP index average (AIEP) and EP mean aggregate (AAIEP). The figure shows the non-uniformity of the relationships between the number, energy performance and consumption demand, especially in cases of buildings where the variable volume has an impact on energy consumption particularly regarding ventilation and bigger plants, as seen in the assigned uses, such as shopping centers (E.5) and schools (E.7).
Figure 2 highlights the relation between energy performance and gross volume. In fact, the incidence of the variability of the air-conditioned volume between the assigned usages, is greater compared to that of the energy. Of 257 certificates issued, 209 have an EP
tot, index. The other 48 regard buildings without heating plants, equal to 18.86%, and also this is anomalous. Of the 209 certified, 25 have an EP index greater than 250 kWh/m
2 year, and the anomalous incidence is at 11.96%.
Figure 2.
Comparison between number of building, AIEPtot, primary energy (MWh) and gross volume.
Figure 2.
Comparison between number of building, AIEPtot, primary energy (MWh) and gross volume.
5. Statistical Analysis of SACE Database 2010
The statistical analysis of the Database results was performed on index EP, EPi and EPacs, registered on the EPC. Furthermore, each of these indices has a confidence interval range of ±5%. This confidence interval range depends on the Thermo-technical software certified by CTI (Comitato Termotecnico Italiano—Italian Thermo technical Committee), in addition to the expertise of the single independent expert in performing the calculations and gathering the input data.
Generally speaking, we can say that the energy performance index EP for energy Class A, B or C related to new buildings, calculated with certified software, with data input taken from building plans as is, are more precise with respect to the index values higher than those of the existing Class E, F or G buildings.
The sampling statistic average is described as the mean value of the index EP of 257 EPCs, of which 208 EPCs are regarded as residential buildings (77.82%). The sampling statistic average for 208 dwellings is 114.50 kWh/m2 year; this value is a territorial energy indicator. In this case the median value of the EP is 87.79 kWh/m2 year. The comparison between statistic average and median shows a high impact of the greater index EP over the average value. If we excluded EPCs without the EP index due to the lack of heating plants, the number of samples would fall to 154 EPCs (77% of total dwellings) where:
The territorial energy marker is 149.30 kWh/m2 year;
The median is 121.86 kWh/m2 year;
The standard deviation (δ) is 108.72 kWh/m2 year, with more unevenness referring to average value of EPtot 149.30 kWh/m2 year.
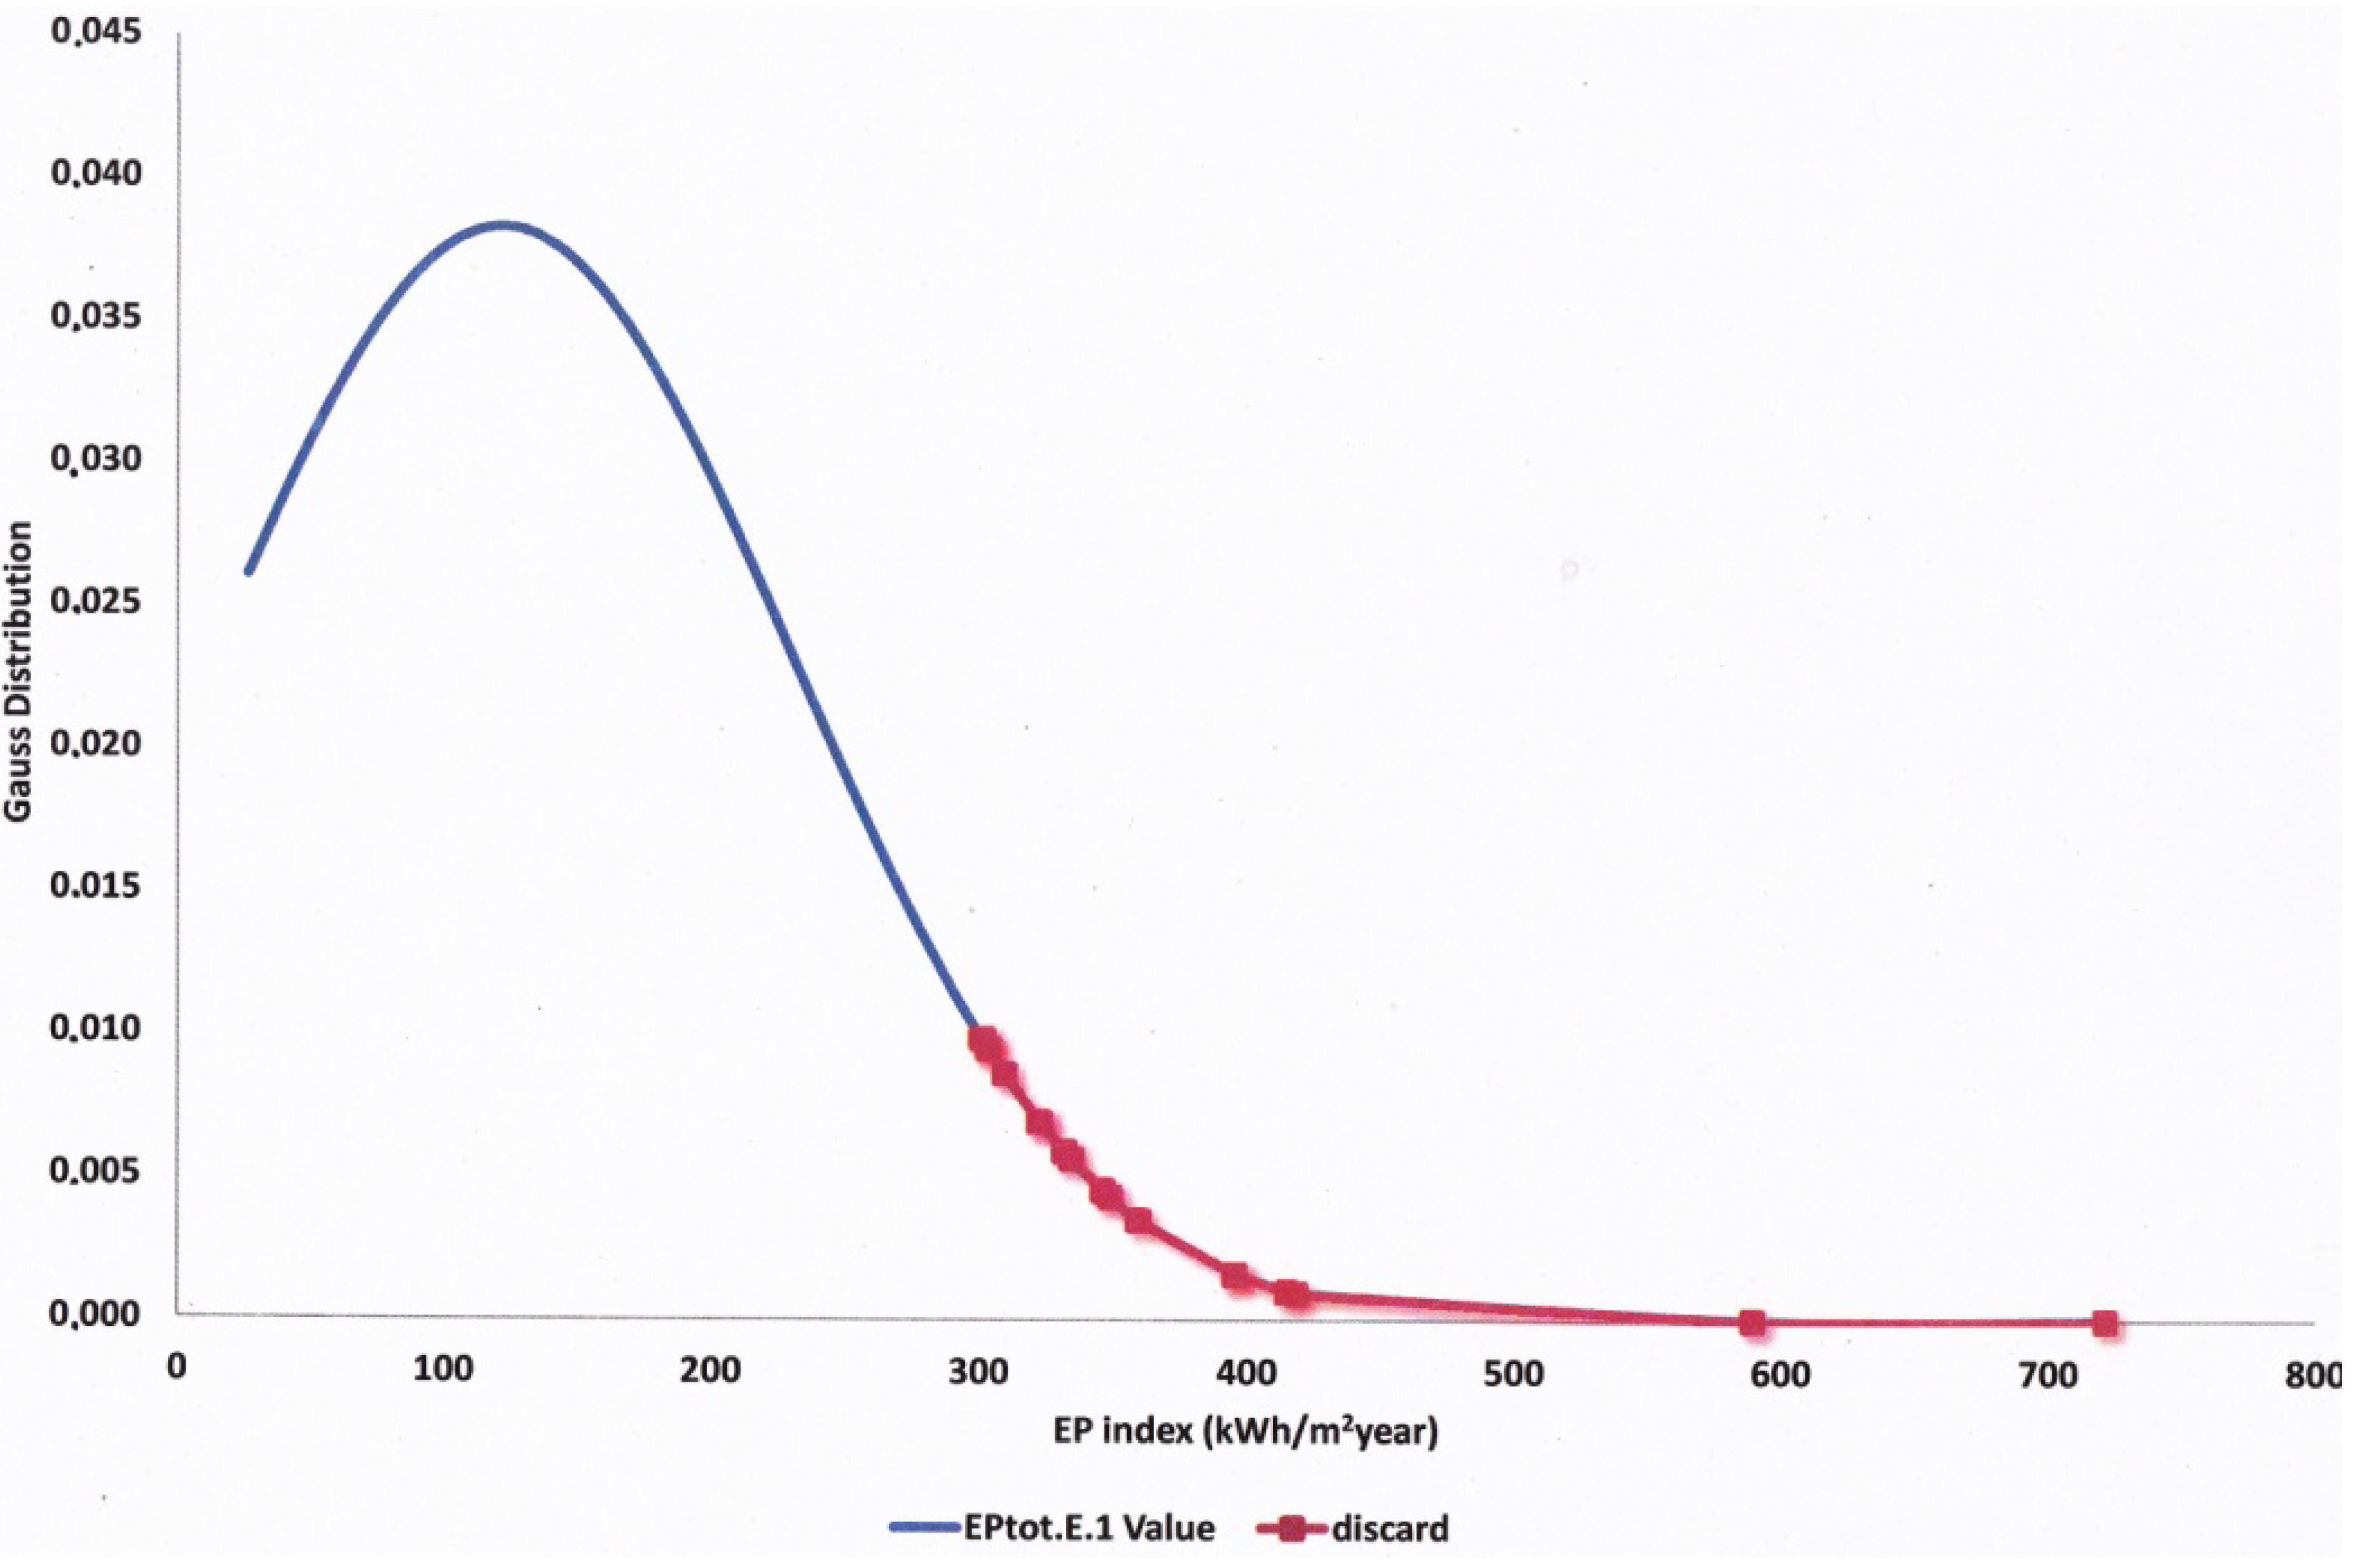
The Gaussian function of residential buildings with EPCs show a large normal distribution of values (
Figure 3).
Figure 3.
Gauss function of dwelling EPC.
Figure 3.
Gauss function of dwelling EPC.
6. Comparison between Bottom-Up and Top-Down Evaluations and Scenario Simulation
The database analysis of the EPCs issued for the single commune of Verucchio must be compared with energy and settlement data at regional level. This is a matter of comparing the top-down (regional data) with the bottom-up (EPC data) evaluations.
The first step is to verify whether the Verucchio sample can act as a representative model. The extent of the Verucchio commune represents 0.12% of the total regional territory, and 0.18% of the total regional dwelling units.
In the Regional Energy Actual Program 2011–2013, the energy consumption related to residential buildings is 2851 ktoe (based on ENEA [
35] and REA 2007 [
36]), equal to 33,150.79 GWh/year of primary energy. The energy incidence for Verucchio is 58,297.35 MWh/year (0.18% of regional dwellings).
The sample of 208 certificates is at 6.01%, with an energy demand percentage attributable to the sample, equal to 3501.55 MWh/year, to compare with the bottom-up value. Thus a top-down value of 501.55 MWh/year must be compared with the bottom-up value gathered from the regional database (
bottom up—
Table 3) equivalent to 3,092.87 MWh/year. Therefore, there is a gap between top-down and bottom-up values, of 11.67%. Firstly, the database value could be compared with the regional value with just an 11.67% gap.
The regional index EP
AAIEP,RER of 175.31 kWh/m
2 year, is the result of the ratio between (GFEC)
gross final regional energy consumption and (GDSU)
gross dwelling net floor surface. This value must be compared with the sampling statistics average of 114.50 kWh/m
2year (
Table 3) with a gap of 34.06%. In this case, the comparison between top-down (
top-down—
Table 4 and Regional indexes value in
Table 5) and bottom-up values shows a great confidence interval.
Table 3.
Statistical data. SACE database 2010.
Table 3.
Statistical data. SACE database 2010.
| EP indexes | EPtot | EPinv | EPacs |
|---|
| Dwellings including those with EPC with Energy Class not determinable (ND) |
| Number of simple samples | 208 | 208 | 208 |
| Index EPAIEP—Sampling statistic average | 114.50 | 103.45 | 11.05 |
| Index EP—Sampling Median | 87.79 | 72.54 | 5.83 |
| Index EP—Standard deviation (δ) | 114.72 | 109.94 | 12.55 |
| Dwellings only with EPC with Energy Class |
| Number of simple samples | 154 | 154 | 154 |
| Index EPAIEP—Sampling statistic average | 149.30 | 134.65 | 14.65 |
| Index EP—Sampling Median | 121.86 | 105.65 | 16.49 |
| Index EP—Standard deviation (δ) | 108.72 | 107.06 | 12.17 |
Table 4.
Statistical data of Emilia-Romagna Region and Verucchio town.
Table 4.
Statistical data of Emilia-Romagna Region and Verucchio town.
| EP indexes | [RER] Emilia Romagna | [VER] Verucchio | Gap, ratio between [VER]/[RER] |
|---|
| Territory surface size km2 (by ISTAT) | 22,123.09 | 27.07 | 0.12% |
| Dwelling average floor surface SU—m2 (by ISTAT) | 96.95 | 104.06 | 107.33% |
| Residential buildings (by ISTAT) | 735,066 | 1735 | 0.24% |
| Apartments (by ISTAT) | 1,969,235 | 3463 | 0.18% |
| Number of apartments per building | 2.68 | 2.00 | - |
| Total floor net surface–m2 | 190,917,333.25 a | 360,359.78 b | - |
| MWh/km2 | 1,498.47 | 2,153.58 | - |
| kWh/m2 of territory | 1.50 | 2.15 | - |
| Apartments/km2 (Dwelling density) | 89.01 | 127.93 | - |
Table 5.
Verucchio: ISTAT Data, SACE Database and simulation data.
Table 5.
Verucchio: ISTAT Data, SACE Database and simulation data.
| Indicators | Number of building | Incidence Database/ISTAT |
|---|
| Urban units by ISTAT | 3,463 | - |
| Urban units by SACE Database | 257 | 7.42% |
| Residential urban units by SACE Database | 208 | 6.01% |
| Residential urban units by SACE Database exclude EPC without energy rating | 154 | 4.45% |
| New residential urban units simulation | 238 | 6.87% |
| Floor average surface for dwelling—simulation (m2/apartment) | 80 | - |
| New floor surface–simulation (m2) | 2400 | - |
The Verucchio town index EPAAIEP,VER of 161.78 kWh/m2 year, is the result of the ratio between gross final Verucchio energy consumption (58.297.36 MWh/year) and gross dwelling net floor surface (3463 dwellings for 104.06 m2 average unit floor surface). If we compare the same bottom-up value with these top-down values, the confidence interval is at 29.22%. The comparison between top-down and bottom-up EPAAIEP value shows a high confidence interval gap (≈30%). This may be due to the ratio numerator and denominator and the uncertainty of the total gross floor surface.
As matter of a fact, the value of the total floor surface of the units of the sample of 208 certificates, with average floor surface of 104.06 m
2 × 208 samples is 21,644.48 m
2 whereas the database value is 19,416.81. There is a gap of 10.29% (10,416.81 m
2), in value of the useful surface area of the Database projection. The comparison between index EP
AIEP,DB 159.29 kWh/m
2year of Database and EP
AAIEP,VER 161.78 for the entire Verucchio town (see below) is at 1.54%. In the same way if we proceeded inversely, from index EP to energy consumption (
Table 6) the steps are:
EP
AIEP 11,450 kWh/m
2year (
Table 3);
EPAIEP,corr 11,626 kWh/m2year corrected with 1.54% confidence intervals;
The total energy consumption of Verucchio is 41,895.55 MWh/year, the result of the multiplication of total gross floor surface (19,416.81 m2) by the number of dwellings (3463) and index EPAIEP,vorr 116.26 kWh/m2 year.
Table 6.
Top-down to bottom-up evaluation.
Table 6.
Top-down to bottom-up evaluation.
| Units | [RER] Emilia Romagna | [VER] Verucchio | [DBp] DATABASE projection | [DBm] DATABASE measured | Gap DBm/DBp |
|---|
| - | ⇒ | ⇒ | ⇒ | - | - |
| [E] Energy | 2851 (ktoe) a | - | - | - | - |
| - | 119,342,860 (GJ) | - | - | - | - |
| [E] Energy (MWh) | 33,150,794.44 | 58,297.36 b | 3501.55 c | 3092.87 | 11.67% |
| [GSU] Floor units surface | 190,917,333.25 | 360,359.78 | 21,644.48 c | 19,416.81 d | 10.29% |
| Index EPAAIEP | 173.64 e | 161.78 e | 161.78 e | 159.29 e | 1.54% |
| - | Gap [VER]/[RER]:6.83% | - | - | - |
| Index EPAIEP | 114.50 d | - |
| Correction factor (by 6.01% building with EPC) | EPAIEP/EPAAIEP: 28.12% | - |
| Correct EPAAIEP,corr | 124.20 f | 116.26 g | 116.26 g | 114.50 d | - |
The gap between 41,895.55 MWh/year and the Verucchio total energy consumption of 58,297.36 MWh/ year, is ±28.13 coinciding with the same gap value between EPAAIEP and EPAIEP.
The index EP
AAIEP over 154 EPCs of the database with values excluding those certified with ND (Not Determinable) is equal to index EP
average,sampling at 149.30 kWh/m
2 year, with a gap of 23.31% compared to the mean sample value including the NDs at 6.27% compared to index EP
average value of 159.29 kWh/m
2 year.
Table 7 shows that the path followed in gathering the database values (bottom-up) generally had a reduced error margin.
Table 7.
Bottom-up to top-down evaluation.
Table 7.
Bottom-up to top-down evaluation.
| Indicator units | [RER] Emilia Romagna | [Ve] Verucchio | [DBp] database projection | [DBm] database measured |
|---|
| [E] Energy (MWh) | 33,150,794.44 | 58,297.36 | 3501.55 | 3092.87 |
| [SU] Floor Units Surface (m2) | 190,917,333.25 | 360,359.78 | 21,644.48 | 19,416.81 |
| Index EPAIEP | 173.64 | 161.78 | 161.78 | 159.29 |
| Index EPAAIEP | - | - | - | 114.50 |
| Correction factor (by 6,01% building with EPC) | - | - | - | EPAIEP/EPAAIEP = 28.12% |
| - | ⇐ | ⇐ | ⇐ | - |
| [Epro] Energy consumption–projection (MWh) da EPAAIEP DBm | 23,712,686.12 c | 41,895.55 b | - | 2,223.22 a |
| [Epro] Energy consumption–projection (MWh) with correction factor | 32,988,232.89 g | 58,283.58 f | 3,500.72 e | 3,092.87 d |
| Gap between tra [E] and [Epro,cor] | 0.49% h | 0.02% h | 0.02% h | 0.00% h |
| [Epro] Energy consumption–simple proposition projection (MWh) | 29,281,672.38 l | 51,493.31 (i) | - | 3092.87 |
Table 6, from top-down to bottom-up, shows the path proceeding from the Regional value, accepted data equal to 33,150.80 GWh, and the projection of this value related to the percentage of buildings with EPCs in Verucchio, equal to 3501.55 MWh. The same value measured from the SACE Database is 3092.87 MWh, with a 11.67% error-gap, whereas the 1.54% error gap refers to the EP
AAIEP index. The index EP
tot for each building is the ratio between primary energy consumption in a year, and the surface area, expressed in kWh/m
2 year. The EP
AAIEP Index considers the energy performance index EP
tot as if it referred to a single large building with a primary energy consumption and floor surface area composed of the sum of the total demands and floor surfaces of the certified buildings. The ratio between index EP
AIEP and EP
AAIEP is 28.12%. This value represents the ratio between index EP
tot taken from the average value of EP
tot for each building, compared to the value of index EP
tot data taken as the sum of all the buildings as one. This gap shows how the average value of EP
tot of the buildings is better than the sum of all the demands together.
Table 7 (from bottom-up to top-down) shows the path proceeding from the value measured (from the SACE Database) equal to 3092.87 MWh, and the projection of that value related to the value of the entire Emilia-Romagna Region (projection). This value, equal to 29,281.67 GWh must be corrected by 28.12%, a ratio between the EP
AIEP and EP
AAIEP indices. Therefore the projection of the Regional value of consumption is equal to 32,988.23 GWh, with a gap of 0.49%.
The next data elaboration step is to simulate five scenarios to verify which statistical analysis values could be used to measure real estate energy savings and characteristics.
The five scenarios described in
Table 8 are as follows:
scenario 1: new EPCs having the same energy class percentage distribution as the existing database;
scenario 2: casual subdivision of energy classes;
scenario 3: equal energy class distribution;
scenario 4: worst situation, all new EPCs belonging to energy classes E, F, G or ND;
scenario 4: best situation, all new EPCs belonging to energy classes A, B or C.
Table 8.
Scenarios sharing new EPC divided by number of EPCs and energy class, in percentage.
Table 8.
Scenarios sharing new EPC divided by number of EPCs and energy class, in percentage.
| Scenario | Class A | Class B | Class C | Class D | Class E | Class F | Class G | ND | Total |
|---|
| Scenario 1 | 3.33% | 10.00% | 20.00% | 16.67% | 6.67% | 10.00% | 13.33% | 20.00% | 100% |
| Scenario 2 | 10.00% | 13.33% | 20.00% | 13.33% | 6.67% | 10.00% | 13.33% | 13.33% | 100% |
| Scenario 3 | 13.33% | 13.33% | 13.33% | 13.33% | 13.33% | 13.33% | 13.33% | 13.33% | 100% |
| Scenario 4 | 0.00% | 0.00% | 0.00% | 0.00% | 26.67% | 26.67% | 26.67% | 20.00% | 100% |
| Scenario 5 | 40.00% | 40.00% | 20.00% | 0.00% | 0.00% | 0.00% | 0.00% | 0.00% | 100% |
| Index EP kWh/m2 year | 30 | 50 | 70 | 110 | 150 | 180 | 250 | 0 | - |
The statistical analysis value for each scenario is shown in
Table 9 and
Table 10.
Table 9.
Statistical analysis indicator and scenarios.
Table 9.
Statistical analysis indicator and scenarios.
| letters | Indicator units | Actual data | Scenario 1 | Scenario 2 | Scenario 3 | Scenario 4 | Scenario 5 |
|---|
| (A) | n.° of total building in Verucchio by ISTAT Census | 3463 | 3463 | 3463 | 3463 | 3463 | 3463 |
| (B) | Number of EPC sampling | 208 | 230 | 230 | 230 | 230 | 230 |
| (C) = A/B | Sampling incidence (A/B) | 5.78% | 6.64% | 6.64% | 6.64% | 6.64% | 6.64% |
| (D) | Sampling increase percentage | - | 13.04% | 13.04% | 13.04% | 13.04% | 13.04% |
| (E) | Index EPAAIEP Sampling statistic average (x) | 121.31 | 121.65 | 120.61 | 121.16 | 128.76 | 113.33 |
| (F) | Index EP Median | 87.61 | 88.33 | 87.61 | 88.33 | 98.42 | 75.88 |
| (G) | Standard deviation (δ) | 106.23 | 103.07 | 103.08 | 102.81 | 103.81 | 103.23 |
| (H) | Expected value (μ) | 213.88 | 208.69 | 208.39 | 208.06 | 212.19 | 206.96 |
The sampling statistic average value is very variable: increased in the worst case scenario 4 and decreased in the best case scenario 5. In other scenarios this value has a variability of about 1.00%, and is insignificant. The median value has the same trend as the sampling statistic average, with more differences between the worst and best case scenarios.
This distribution is shown in
Table 11 and the confidence interval in
Table 12. It evidences how the best case scenario 5 has a greater number of EPCs (63.03%) with a
sampling statistic average EP index smaller than EP
AIEP, whereas in the worst case scenario 4, it is smaller, at 59.48%. As confirmation one can note how the same difference is found in the median value.
Table 10.
Energy and statistical indicator for each of the scenarios.
Table 10.
Energy and statistical indicator for each of the scenarios.
| Indicator units | [RER] Emilia Romagna | [VER] Verucchio | [DBp] database projection | [DBm] database measured |
|---|
| [E] Energy (MWh) | 33,150,794.44 | 58,297.36 | 3501.55 | 3092.87 c |
| [GSU] Gross units floor surface (m2) estimation | 190,917,333.25 | 360,359.78 | 21,644.48 | 19,416.81 |
| [Epro] Energy—Projection (MWh) | 31,072,054.01 | 54,641.79 | 3281.98 | 2898.93 |
| [GSUpro] Total units floor surface (m2) estimation | 211,919,560.42 b | 400,001.85 b | 24,025.52 b | 21,816.81 a 10.29% d |
| EPAAIEP [Scenario-1] | - | - | - | 121.65 e |
| Index EPAAIEP,pro | 163.20 f | 152.05 f | 173.98 f | 169.24 f |
| [Epro,DBm] Energy database projection | - | - | - | 2362.05 g |
| [Epro,corr] Energy projection correct | 34,585,998.12 h | 60,821.24 i | 4180.03 m | 3692.17 l |
| Difference (MWh) | 1,435,203.68 n | 2523.88 n | 678.49 n | |
| Gap (%) | 4.15% | 4.15% | 16.23% ° | |
| EPAAIEP [Scenario-2] | - | - | - | 120.61 |
| Index EPAAIEP,pro | 161.81 | 150.75 | 172.50 | 167.79 |
| [Epro,DBm] Energy database projection | - | - | - | 2,631.33 |
| [Epro,corr] Energy projection correct | 34,290,318.40 | 60,301.27 | 4,144.30 | 3660.60 |
| Difference (MWh) | 1,139,523.96 | 2,003.91 | 642.75 | - |
| Gap (%) | +3.32% | +3.32% | +15.51% | - |
| EPAAIEP [Scenario-3] | - | - | - | 121.16 |
| Index EPAAIEP,pro | 161.81 | 151.44 | 173.28 | 168.55 |
| [Epro,DBm] Energy database projection | - | - | - | 2643.31 |
| [Epro,corr] Energy projection correct | 34,290,687.48 | 60,576.25 | 4163.20 | 3677.30 |
| Difference (MWh) | 1,295,893.04 | 2,278.89 | 661.65 | - |
| Gap (%) | +3.76% | +3.76% | +15.89% | - |
| EPAAIEP [Scenario-4] | - | - | - | 128.75 |
| Index EPAAIEP,pro | 172.73 | 151.44 | 184.14 | 159.41 |
| [Epro,DBm] Energy database projection | - | - | - | 2499.91 |
| [Epro,corr] Energy projection correct | 36,604,580.83 | 60,576.25 | 4,163.20 | 3477.79 |
| Difference (MWh) | 3,453,786.39 | 2,278.89 | 661.65 | - |
| Gap (%) | +9.44% | +9.44% | +15.89% | - |
| EPAAIEP [Scenario-5] | - | - | - | 113.33 |
| Index EPAAIEP,pro | 152.04 | 141.65 | 162.08 | 157.66 |
| [Epro,DBm] Energy database projection | - | - | - | 2472.50 |
| [Epro,corr] Energy projection correct | 32,220,560.35 | 56,661.50 | 3894.15 | 3439.65 |
| Difference (MWh) | −930,234.09 | −1,635.86 | 392.60 | - |
| Gap (%) | −2.89% | −2.89% | +10.08% | - |
Table 11.
Statistical analysis indicator and scenarios: percentage increase.
Table 11.
Statistical analysis indicator and scenarios: percentage increase.
| Letters | Indicator units | Actual data | Scenario 1 | Scenario 2 | Scenario 3 | Scenario 4 | Scenario 5 |
|---|
| (E) | Index EPAAIEP Sampling statistic average (x) | 0.00% | 0.28% | −0.58% | −0.13% | 6.14% | −6.58% |
| (F) | Index EP Median | 0.00% | 0.82% | 0.00% | 0.82% | 12.35% | −13.39% |
| (G) | Standard deviation (δ) | 0.00% | −2.97% | −2.97% | −3.22% | −2.27% | −2.82% |
| (H) | Expected mean value (μ) | 0.00% | −3.24% | −2.40% | −3.09% | −7.93% | 4.02% |
Table 12.
Scenarios confidence interval of statistical index.
Table 12.
Scenarios confidence interval of statistical index.
| Sampling statistic average (x) | Actual data | Scenario 1 | Scenario 2 | Scenario 3 | Scenario 4 | Scenario 5 |
|---|
| Confidence interval (+) | 133.67 | 132.83 | 131.79 | 132.31 | 140.02 | 124.53 |
| Confidence interval (−) | 108.96 | 110.47 | 109.43 | 110.01 | 117.50 | 102.14 |
| Gap | 24.71 | 22.36 | 22.36 | 22.30 | 22.52 | 22.39 |
7. Results of the SACE Database as of 2011 and Verification
On 20 June 2011 there was another survey on the SACE Database for Verucchio to check the progress of the EPCs.
7.1. SACE Database 2011: Statistical Analysis
The comparison between the 2010 and 2011 SACE databases revealed some surprises. Firstly, the EPC trends saw a bigger increase of +40.09% (
Table 13). This growth may depend on the obligation to issue EPCs when apartments are rented out and not only when sold or purchased, thus the increase of buildings with bad energy performances.
Table 13.
Verucchio EPC Database—Gab between 2010 and 2011 value of Volume, number energy and Index EPtot.
Table 13.
Verucchio EPC Database—Gab between 2010 and 2011 value of Volume, number energy and Index EPtot.
| Building tipology | Volume (m3) | Numbers | Energy (MWh) | AAI EPtot | AI EPtot |
|---|
| E.1 Dwellings | 48.59% | 41.24% | 55.41% | −10.90% | 34.00% |
| E.2 Offices | 7.37% | 5.00% | 4.04% | −2.72% | −3.23% |
| E.3 Hospitals | - | - | - | - | - |
| E.4 Recreational activities | 29.41% | 33.33% | 40.74% | 17.86% | 9.87% |
| E.5 Markets/shopping centers | 0.84% | 35.00% | 2.96% | 71.35% | −198.14% |
| E.6 Sport building | 0.00% | 0.00% | 0.00% | 4.13% | −4.30% |
| E.7 School activities | 0.00% | 0.00% | 0.00% | 13.19% | −15.19% |
| E.8 Production activities | 21.85% | 54.55% | 37.75% | 24.12% | 7.54% |
| TOTAL | 7.14% | 40.09% | 29.33% | 17.35% | −0.52% |
Table 14 shows the percentage distribution of scenario 4 as being similar to that of the 2011 SACE Database.
In comparing
Table 6 (from
top-down to
bottom-up values) we have a more accurate view of the detailed sampling statistics, and the gap between the values of index EP
AAIEP and Index EP
AIEP decreases from 28.12% to 18.95%. Thus the average value of index EP
tot calculated with the top-down methodology is more accurate. In comparing
Table 7 (from
bottom-up to
top-down value) we observe how the regional energy consumption projections are more accurate if we use the index of energy consumption projection [E
pro] instead of the index of energy consumption projection with the correction factor [E
pro,corr].
Table 14.
Energy Class distribution confrontation between database 2010, Scenario 4 and database 2011.
Table 14.
Energy Class distribution confrontation between database 2010, Scenario 4 and database 2011.
| Database and scenarios | Class A | Class B | Class C | Class D | Class E | Class F | Class G | ND | Total |
|---|
| Database 2010 | 4 | 25 | 57 | 43 | 27 | 18 | 34 | 49 | 257 |
| Scenario 4 increase | 0 | 0 | 0 | 0 | 8 | 8 | 8 | 6 | 30 |
| Scenario 4 | 4 | 25 | 57 | 43 | 35 | 26 | 42 | 55 | 287 |
| Database 2011 | 4 | 29 | 82 | 77 | 50 | 40 | 87 | 60 | 429 |
| Scenario 4 percentage distribution | 1.39% | 8.71% | 19.86% | 14.98% | 12.20% | 9.06% | 14.63% | 19.16% | 100.00% |
| Database 2011 percentage distribution | 0.93% | 6.76% | 19.11% | 17.95% | 11.66% | 9.32% | 20.28% | 13.99% | 100.00% |
| [A] Gap 2010/Scenario 4 | 0.00% | 0.00% | 0.00% | 0.00% | 22.86% | 30.77% | 19.05% | 10.91% | - |
| [B] Gap 2010/2011 | 0.00% | 13.79% | 30.49% | 44.16% | 46.00% | 55.00% | 60.92% | 18.33% | - |
| [C] Gap Scenario 4/2011 | 0.00% | 13.79% | 30.49% | 44.16% | 30.00% | 35.00% | 51.72% | 8.33% | - |
| Gap [A]/[B] | 0.00% | 0.00% | 0.00% | 0.00% | 49.69% | 55.94% | 31.27% | 49.40% | - |
The comparison also shows the increase by 7% of the certified volume, compared to the increase of 48.59% only for the residential units, whereas from the viewpoint of energy consumption (MWh), there was an increase of 29.33%, with an increase of 55.41% for dwellings. This confirms a lower incidence of energy performance of dwellings in the total buildings, but not in energy consumption. The Average Index EPAIEP (AIEPtot) shows an increase in cases of dwellings (+34.00%) and a smaller reduction for total buildings (−0.52%).
The Aggregate Average Index EPAAIEP (AAIEP) showed a decrease in cases of dwellings (−10.90%) and an increase for total buildings (+17.35%). This means that dwellings register an increase of total energy performance (AAIEPtot) but not for single buildings (AIEPtot), or rather some dwellings have such a high single index EPtot as to alter the average index EPtot value.
On the other hand, compared to the total buildings the single index EPs (expressed in kWh/m
3year) remain unchanged, but the AAIEP index worsens, and proves the impact of the heating of buildings with big volumes. Among the simulation scenarios in
Table 9, the final result resembles that of Scenario 4: the worst case.
Table 15 shows how, compared to the gap foreseen for 2010/Scenario 4, the real gap for 2010/2011 for classes E, F, G and ND has an increased percentage, ranging between 31.27% and 55.94%. Of the EP
AAIEP,pro index indicators the situation of Scenario 4 is the worst, due to the fact that the increase is caused by the obligation to issue the EPCs in cases of lease and these refer above all to the existing buildings. The results confirm the fact that specific energy policies have not been adopted.
Table 15.
Statistical data for database 2011 and gap between 2010 and 2011 database.
Table 15.
Statistical data for database 2011 and gap between 2010 and 2011 database.
| Dwelling enclosed EPC with energy class not determinable (ND) | EPtot | EPinv | EPacs |
|---|
| Indexes | value | Gap 2010/2011 | value | Gap 2010/2011 | value | Gap 2010/2011 |
|---|
| Dwelling including those with EPC with Energy Class not determinable (ND) |
| Number of simple samples | 346 | +39.88% | 346 | +39.88% | 346 | +39.88% |
| Index EPAIEP—Sampling statistic average | 140.61 | +18.57% | 133.95 | +22.77% | 6.66 | −65.92% |
| Index EP—Sampling Median | 120.50 | +27.15% | 105.51 | +31.25% | 0.00 | - |
| Index EP—Standard deviation (δ) | 120.06 | +4.45% | 118.80 | +7.46% | 11.61 | −8.10% |
| Dwelling only EPC with Energy Class |
| Number of simple samples | 291 | +47.08% | 291 | +47.08% | 291 | +47.08% |
| Index EPAIEP—Sampling statistic average | 167.57 | +10.90% | 159.46 | +15.56% | 8.11 | −80.64% |
| Index EP—Sampling Median | 129.88 | +6.17% | 124.94 | +15.44% | 0.00 | - |
| Index EP—Standard deviation (δ) | 112.08 | +3.00% | 112.62 | +4.94% | 11.61 | −4.82% |
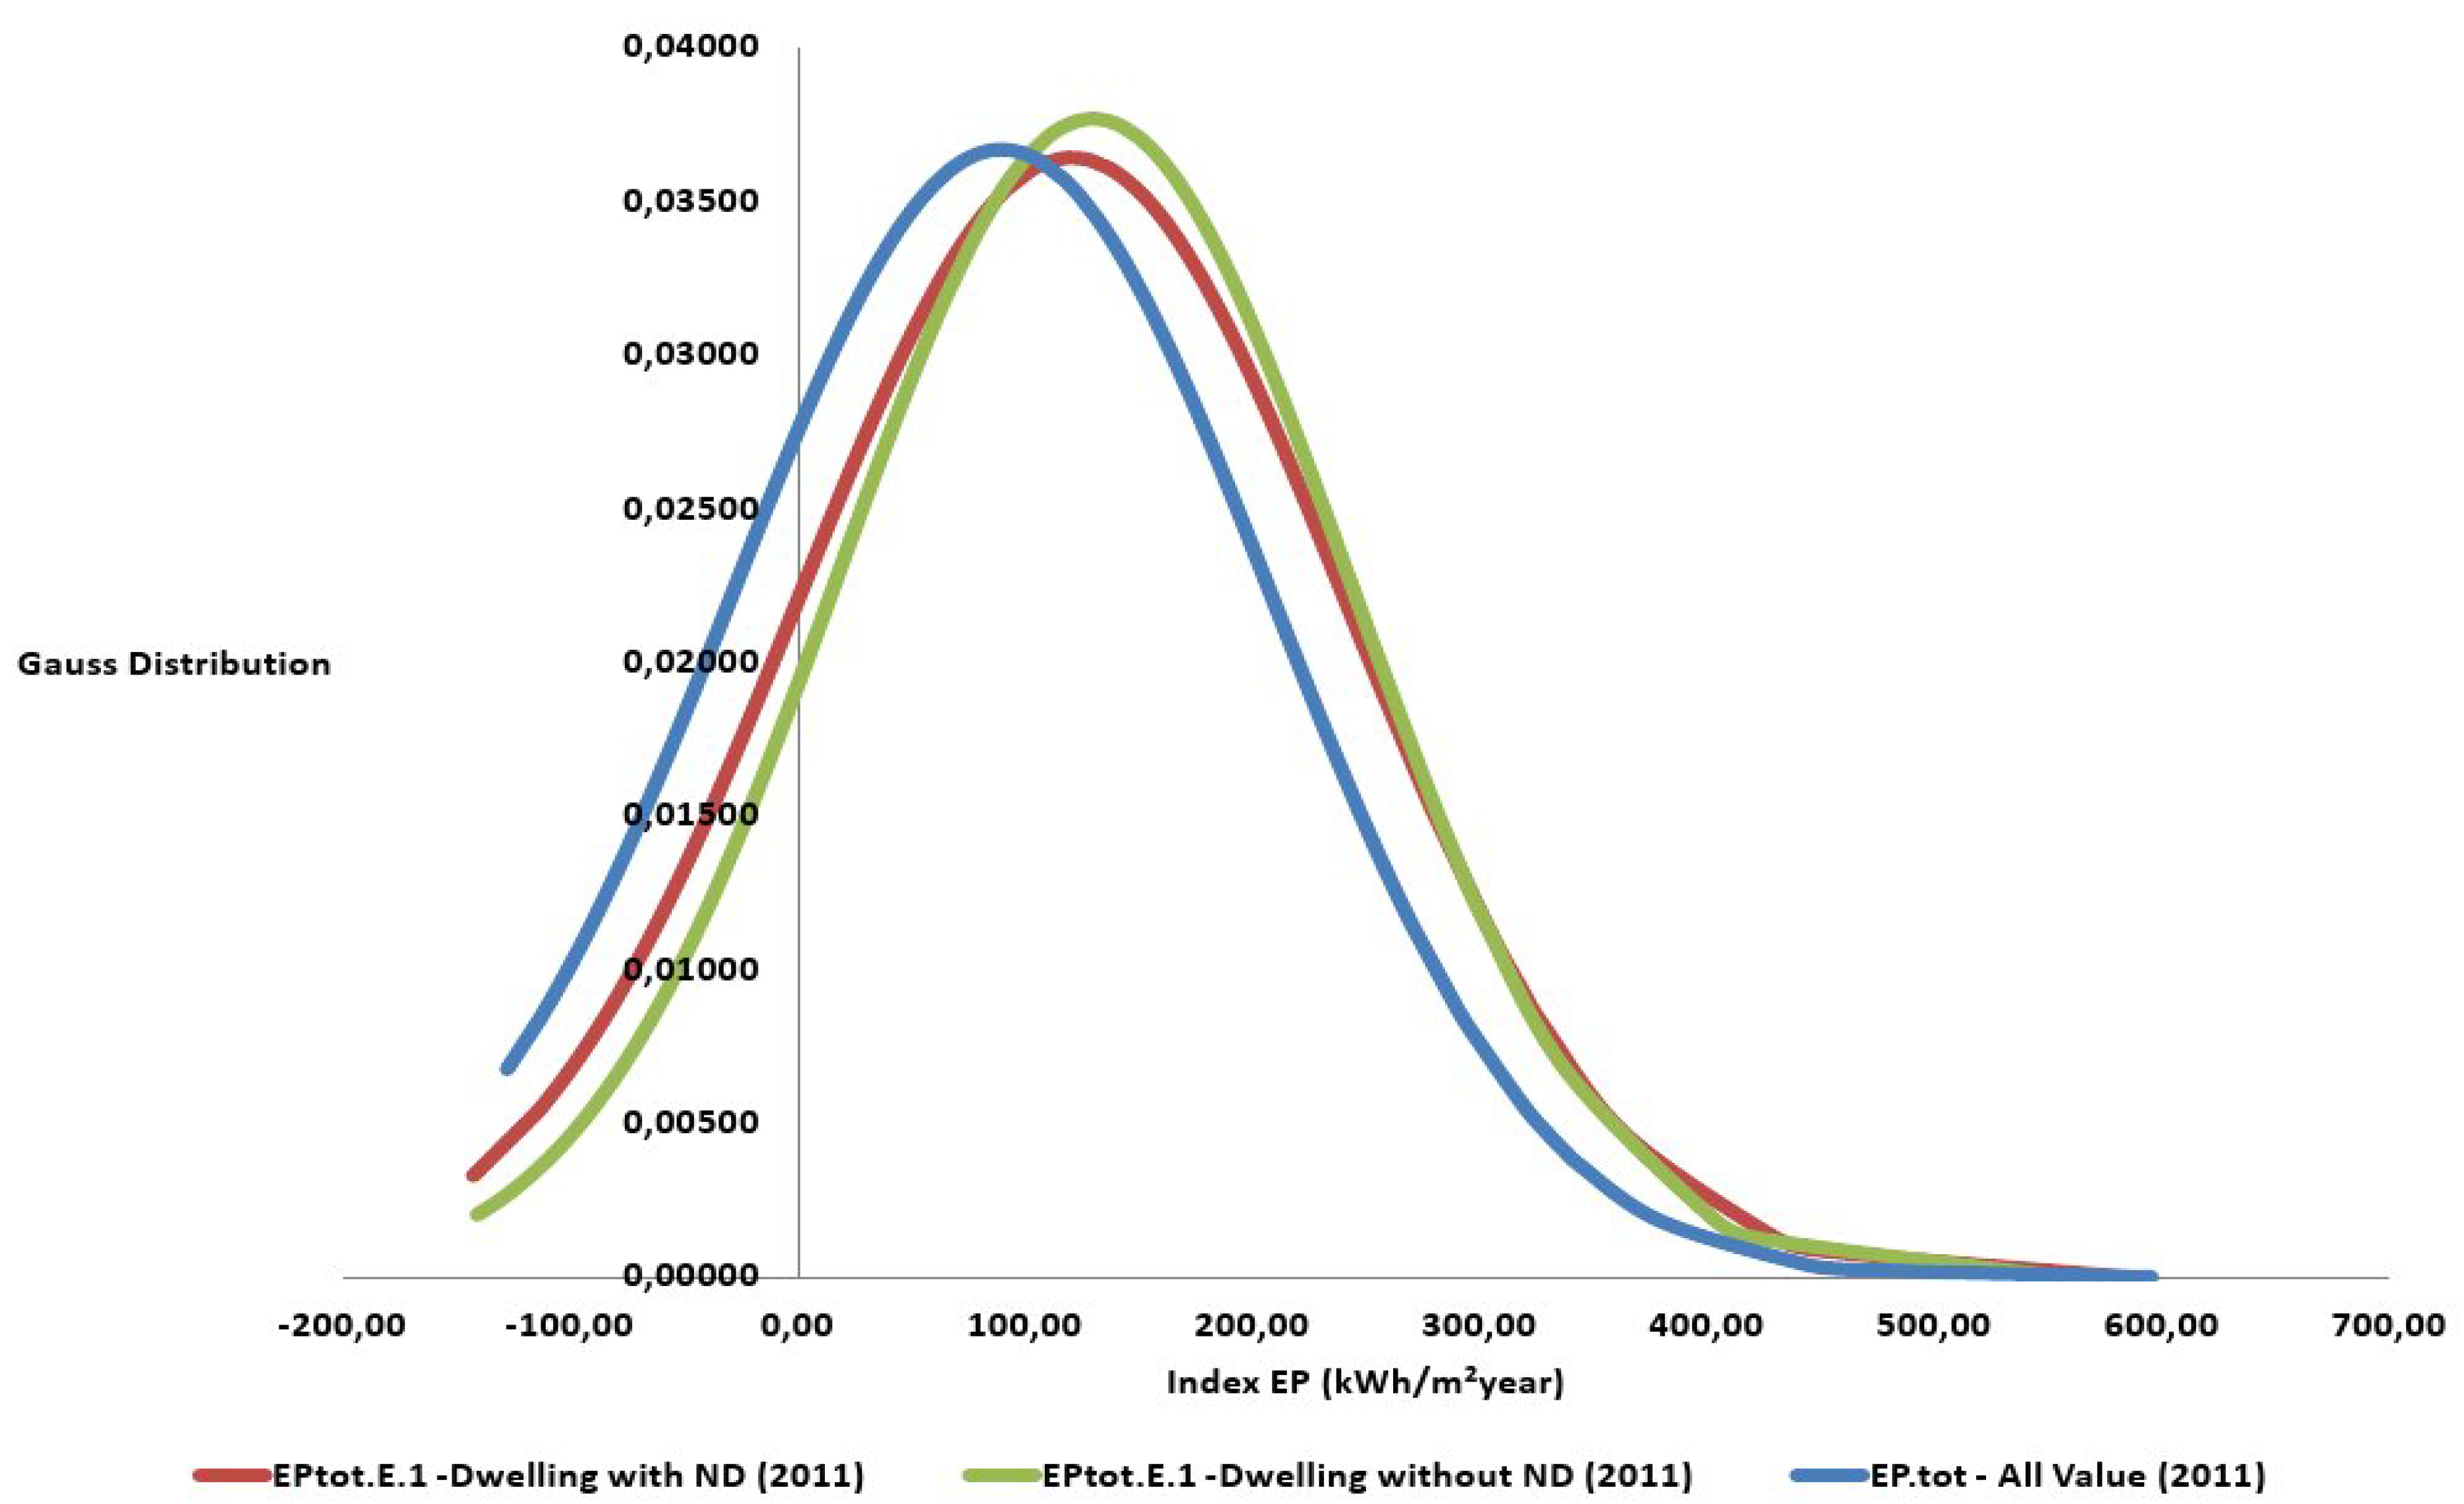
Figure 4 shows the Gaussian curve for Database 2010 and 2011, evidencing that the curve for EPC dwellings without ND is higher and narrower compared to the total value, reducing the error of single EPCs.
Figure 4.
Indexes EP 2010 and 2011 comparison of Gaussian distribution.
Figure 4.
Indexes EP 2010 and 2011 comparison of Gaussian distribution.
7.2. Comparison between Bottom-Up and Top-Down Evaluation for Database 2011
The comparison between bottom-up and top-down evaluation for database 2011 (
Table 16) reports an increase of the incidence of urban units and dwellings (with EPC values). The incidence of urban units with EPC with respect to the total number in Verucchio (sampling) increased from 7.42% to 12.39% for all buildings, and from 4.45% at 8.40% for dwelling units with EPC values.
The incidence of buildings with EPCs is at 12.39% of the total and 8.40% for dwellings, and these values are representative of the single commune. On the other hand, Verucchio has a smaller incidence compared to the Emilia-Romagna Region: 0.12% of the territory and 0.18% of dwelling apartments. The reduction of this representative model is reflected in the error between bottom-up and top-down methods.
Table 17 reports the evaluation of the Top-down to Bottom-up method. The energy consumption measured by the SACE Database (DBm = 6936.70 MWh) is greater than the projection (DBp = 5824.69 MWh) and the gap DBm/DBp is −19.09%. The energy consumption projection from top-down to bottom-up value is underestimated with respect to the real measurements performed by the Database 2011. This error depended on the fact that the GSU projection was lower than the GSU measured (−11.05%), and also because the average urban units surface of Verucchio is estimated at 104.96 m
2, but the measured value is 115.56 m
2. Therefore, the Database projection value [DBm] is lower than the Database measured [DBm]. Therefore to compare with
Table 7, the gap between the 2010 and 2011 index EP
AIEP is smaller than the index EP
AAIEP,corr, corrected by ratio coefficient: EP
AIEP/EP
AAIEP. (18.95%).
Table 16.
Verucchio: ISTAT Data and SACE Database 2011.
Table 16.
Verucchio: ISTAT Data and SACE Database 2011.
| Urban units | Number of buildings | Incidence database/ISTAT |
|---|
| Urban units by ISTAT | 3,463 | - |
| Urban units by SACE Database | 429 | 12.39% |
| Residential urban units by SACE Database | 346 | 9.99% |
| Residential urban units by SACE Database exclude EPC without energy rating | 291 | 8.40% |
Table 17.
Database 2011: top-down to bottom-up evaluation.
Table 17.
Database 2011: top-down to bottom-up evaluation.
| Indexes | [RER] Emilia Romagna | [VER] Verucchio | [DBp] database projection | [DBm] database measured | Gap DBm/DBp a |
|---|
| Flow chart | ⇒ | ⇒ | ⇒ | - | - |
| [E] Energy (MWh) | 33,150,794.44 | 58,297.36 b | 5824.69 c | 6936.70 | 19.09% |
| [GSU] Floor units surface | 190,917,333.25 | 360,359.78 | 36,004.76 c | 39,983.17 d | −11.05% |
| Index EPAAIEP | 173.64 e | 161.78 e | 161.78 e | 173.49 e | −7.24% |
| - | Gap [VER]/[RER]: 6.83% | - | - | - |
| Index EPAIEP | 140.61 d | - |
| Correction factor (by 8.40% building with EPC) | EPAIEP/EPAAIEP: 18.95% | - |
| - | ⇐ | ⇐ | ⇐ | - | - |
| Correct EPAAIEP,corr | 161.10 f | 150.80 g | 150.80 g | 140.61 d | - |
Table 18 gives the evaluation from the Bottom-up to Top-down method. In this case the energy consumption projection [E
pro] has a gap of +7.22%. The result of the projection of energy consumption from Database values measured (6,983.70 MWh), is higher than the Regional Energy Actual Program 2011–2013: E
pro,corr = 37,947,956.37 (MWh) in comparison to the Regional value E = 33,150,794.44 (MWh) with a gap of 14.47%. The same error occurs also when adopting a simple proposition compared to the incidence of the sample and the territory (19.09%). The
error gap (7.22% or 19.09%) projected for both assessments cannot depend on the difference between the estimated GSU and the real one, given that the Database project 2011 has a gap of −11.05% whereas for Database 2010 the gap is at 10.29% (
Table 7). In reality, what was called the
error gap (7.22% or –19.09%) projected must be considered as an increase of energy consumption [E], from 33,150 GWh to 37.947 GWh or 39,379 GWh, during the years 2007–2011. The lack of feedback from the current consumption at 2011 has been verified.
Table 18.
Database 2011: bottom-up to top-down evaluation.
Table 18.
Database 2011: bottom-up to top-down evaluation.
| Indexes | [RER] Emilia Romagna | [Ve] Verucchio | [DBp] database projection | [DBm] database measured |
|---|
| [E] Energy (MWh) | 33,150,794.44 | 58,297.36 | 3501.55 | 3092.87 |
| [SU] Floor Units Surface (m2) | 190,917,333.25 | 360,359.78 | 36,004.76 | 39,983.17 |
| Index EPAIEP | 173.64 | 161.78 | 161.78 | 173.49 |
| Index EPAAIEP | 140.61 |
| Correction factor (by 8.40% building with EPC) | EPAIEP/EPAAIEP = 18.95% |
| - | ⇐ | ⇐ | ⇐ | |
| [Epro] Energy consumption—projection (MWh) from EPAAIEP DBm | 30,756,549.85 c | 54,340.64 b | | 5622.15 a |
| - | Gap between [E]/[Epro]: 7.22% | | |
| [Epro,corr] Energy consumption—projection (MWh) with corr. factor | 37,947,956.37 g | 67,046.42 f | 6698.83 e | 6983.70 d |
| Gap between [E]/[Epro,cor] | −14.47% h | −14.47% h | | −15.01% h |
| - | ⇐ | ⇐ | ⇐ | |
| [Epro,simple-prop] Energy consumption—simple proposition (MWh) | 39,479,763.78 l | 69,427.17 i | - | 6936.70 |
| - | Gap between [E]/[Epro,simple-prop]: −19.09% | - | - |
8. Conclusions
Before drawing a conclusion, we would like to make an analogy between energy consumption in the foregoing with that in the transport sector.
The energy consumption in the transport sector depends on the energy performance of the single means of transport (car, bus, van, etc.). The approach used to study a solution for the reduction of energy consumption could concern a single means of transport, such as engine efficiency, or the use of a different kind of fuel (gasoline, GPL, natural gas, fuel cell) or hybrid systems. On the other hand, a second approach to be used to study reduction of energy consumption in transport could concern land settlement and focus on the route taken by each vehicle, that is, road traffic. Efficient as the single vehicles may be, either petrol consumption is stopped or else they have to use fuel from 100% renewable energy resources. However, even if energy consumption can be reduced, it depends on the length of the route, and therefore, on traffic. Therefore, to reduce energy consumption in the traffic sector we must work on the flow of traffic, the route and length, and amplify the approach from the single vehicle to the territorial settlement.
This uncommon analogy allows us to clarify the approach adopted in this paper, since it could be transferred to the building sector where the single item is a building (or urban units), already subjected to several studies, and a settlement area is a town or region. In this paper we studied a statistical energy index and energy benchmarking which could pinpoint a territory for energy planning. If we would like to reduce energy consumption, we must act on all the players involved in the building process: designers, contractors, builders, etc. and also policymakers, and regarding the latter, offer a tool that can measure the effectiveness of energy policy decisions.
To conclude:
The EPC database allows us to gather data on the actual situation with the AAIEP and AIEP indices (although consideringthe error due to the independent experts) as well as energy class percentage distribution which, if expressed in percentage, only measures the characteristics of buildings. As a matter of fact, in 2011 energy distribution worsened compared to 2010, since only the EPCs of existing buildings increased (we thus excluded the error of independent experts since this was aggregate data, and with the possibility of fraud).
We could avail of statistical indicators, that can help monitor the trend; as seen, the median or standard deviation (δ) allowed us to avoid misconstructions due to the excessive increase in the database 2011.
The comparison between top-down to bottom-up evaluation methodologies and vice versa, should be refined with statistical and poll surveys. In any case it is evident that the relation between the geometry (territorial extension or GSU) and energy consumption is not linear, and the error gap may also reach 20%. However, the comparison between both top-down and bottom-up methods is able to identify the error gap, in this case, between ±14.47% and ±19.09%.
The Scenarios could be useful tools in choosing energy options, as long as they elaborate a statistical index to measure top-down and bottom-up results, and their error gaps.
This approach could be repeated in other situations, also without the SACE database, if we adopted other kinds of energy databases as long as the data are related to the single urban units or single buildings: e.g., the databases of energy distributors or retail energy sales companies.


