Article

Effects of Pulsed Nd:YAG Laser Welding Parameters on Penetration and Microstructure Characterization of a DP1000 Steel Butt Joint

1
School of Mechanical Engineering and Automation, Fuzhou University, Fuzhou 350116, China
2
Centre for Mechanical Technology and Automation, Department of Mechanical Engineering, University of Aveiro, 3810-193 Aveiro, Portugal
*
Author to whom correspondence should be addressed.
Metals 2017, 7(8), 292; https://doi.org/10.3390/met7080292
Submission received: 13 June 2017 / Revised: 23 July 2017 / Accepted: 27 July 2017 / Published: 1 August 2017
(This article belongs to the Special Issue Laser Welding)

Abstract

:
Of particular importance and interest are the effects of pulsed Nd:YAG laser beam welding parameters on penetration and microstructure characterization of DP1000 butt joint, which is widely used in the automotive industry nowadays. Some key experimental technologies including pre-welding sample preparation and optimization design of sample fixture for a sufficient shielding gas flow are performed to ensure consistent and stable testing. The weld quality can be influenced by several process factors, such as laser beam power, pulse duration, overlap, spot diameter, pulse type, and welding velocity. The results indicate that these key process parameters have a significant effect on the weld penetration. Meanwhile, the fusion zone of butt joints exhibits obviously greater hardness than the base metal and heat affected zone of butt joints. Additionally, the volume fraction of martensite of dual-phase steel plays a considerable effect on the hardness and the change of microstructure characterization of the weld joint.

1. Introduction

The need to reduce fuel consumption and greenhouse gas emissions motivates vehicle manufacturers to utilize lightweight metals with better ductility and strength [1,2]. Nowadays, dual-phase (DP) have already built a good reputation for performance and safety [3,4]. Meanwhile, the application of DP steels unavoidably involves welding in the manufacturing process and the properties of welded joints due to the integrity and safety requirements. Although such traditional welding methods as resistance spot welding (RSW) [5], tungsten inert gas welding (TIG) [6], metal inert-gas welding (MIG) [7], and gas arc [8,9] have been widely used, the advantages of laser welding are also well known: energy efficiency, slight heat-affected zone, little heat input per unit volume, and deep penetration [10]. The chief limitation, i.e., cost per watt, is swiftly falling with new advances in laser technology [11]. Although in some cases a proper filler material may be demanded when an interfacial gap attends to be filled [12], autogenous welding is still one of the most common forms of laser welding.
Recently, many efforts have been performed to understand the sensitivity of the laser welding process in advanced high-strength steels. Pulsed Nd:YAG laser welding has especially attracted attention recently in many academic research and industry applications [13,14,15,16,17,18,19]. Tzeng [20] used zinc-coated steel and attempted to make a laser welding joint without gas-formed porosity. Xia et al. [21] used laser welding of DP steels and investigated the sensitivity of heat input and martensite on adjacent heat-affected zone (HAZ) softening. Several Nd:YAG and diode laser welds were made on DP450, DP600, and DP980 steels over a wide range of heat input. Dong et al. [22] studied the rate-dependent properties by means of a wide strain rate range, deformation, and fracture behavior of DP600 steel and its welded joint (WJ) subjected to the Nd:YAG laser welding. Their results showed that the DP600 WJ exhibits continuous yielding at quasi-static strain rates and develops a yield point at higher strain rates. Baghjari et al. [23] paid attention to the Nd:YAG laser welding of AISI420 martensitic stainless steel as well as the sensitivities of voltage, laser beam diameter, energy frequency, pulse duration, and welding velocity to the size and deformation of the welded joint. However, previous studies [24,25,26,27,28] indicated that the mechanical properties of DP steel butt joint have effects evident in the process operation parameters. This may be due to the soft zone formed in the adjacent heat-affected zone (HAZ). Then the question arises how the welding parameter manipulates the mechanical properties of DP steel butt joints by using laser welding. Although many efforts have been made to improve the tensile properties of DP steel butt joints, investigations into the penetration and microstructure properties of this kind of weld are limited. Therefore, it is essential to characterize the weld penetration and microstructure in terms of multiple welding parameters.
The purpose of this article is to experimentally investigate the influences of key process parameter on weld penetration of the fusion zone during pulsed Nd:YAG laser beam welding, and to analyze the hardness and microstructure evolution of DP steel butt joint. In Section 2, the base material used, DP1000, was characterized by some general mechanical tests. Section 3 introduces the main experimental procedures including cutting surface preparation for pre-welding sample, pulsed Nd:YAG laser beam welding, optimization design of welding sample fixture and the microstructure, and hardness testing method. Section 4 provides some corresponding process parameter dependent theory for a better understanding of the interaction between weld quality and process parameters. In Section 5, the influences of laser welding parameters on depth penetration and micro-hardness are analyzed and discussed, as well as the microstructure evolution before and after welding process.

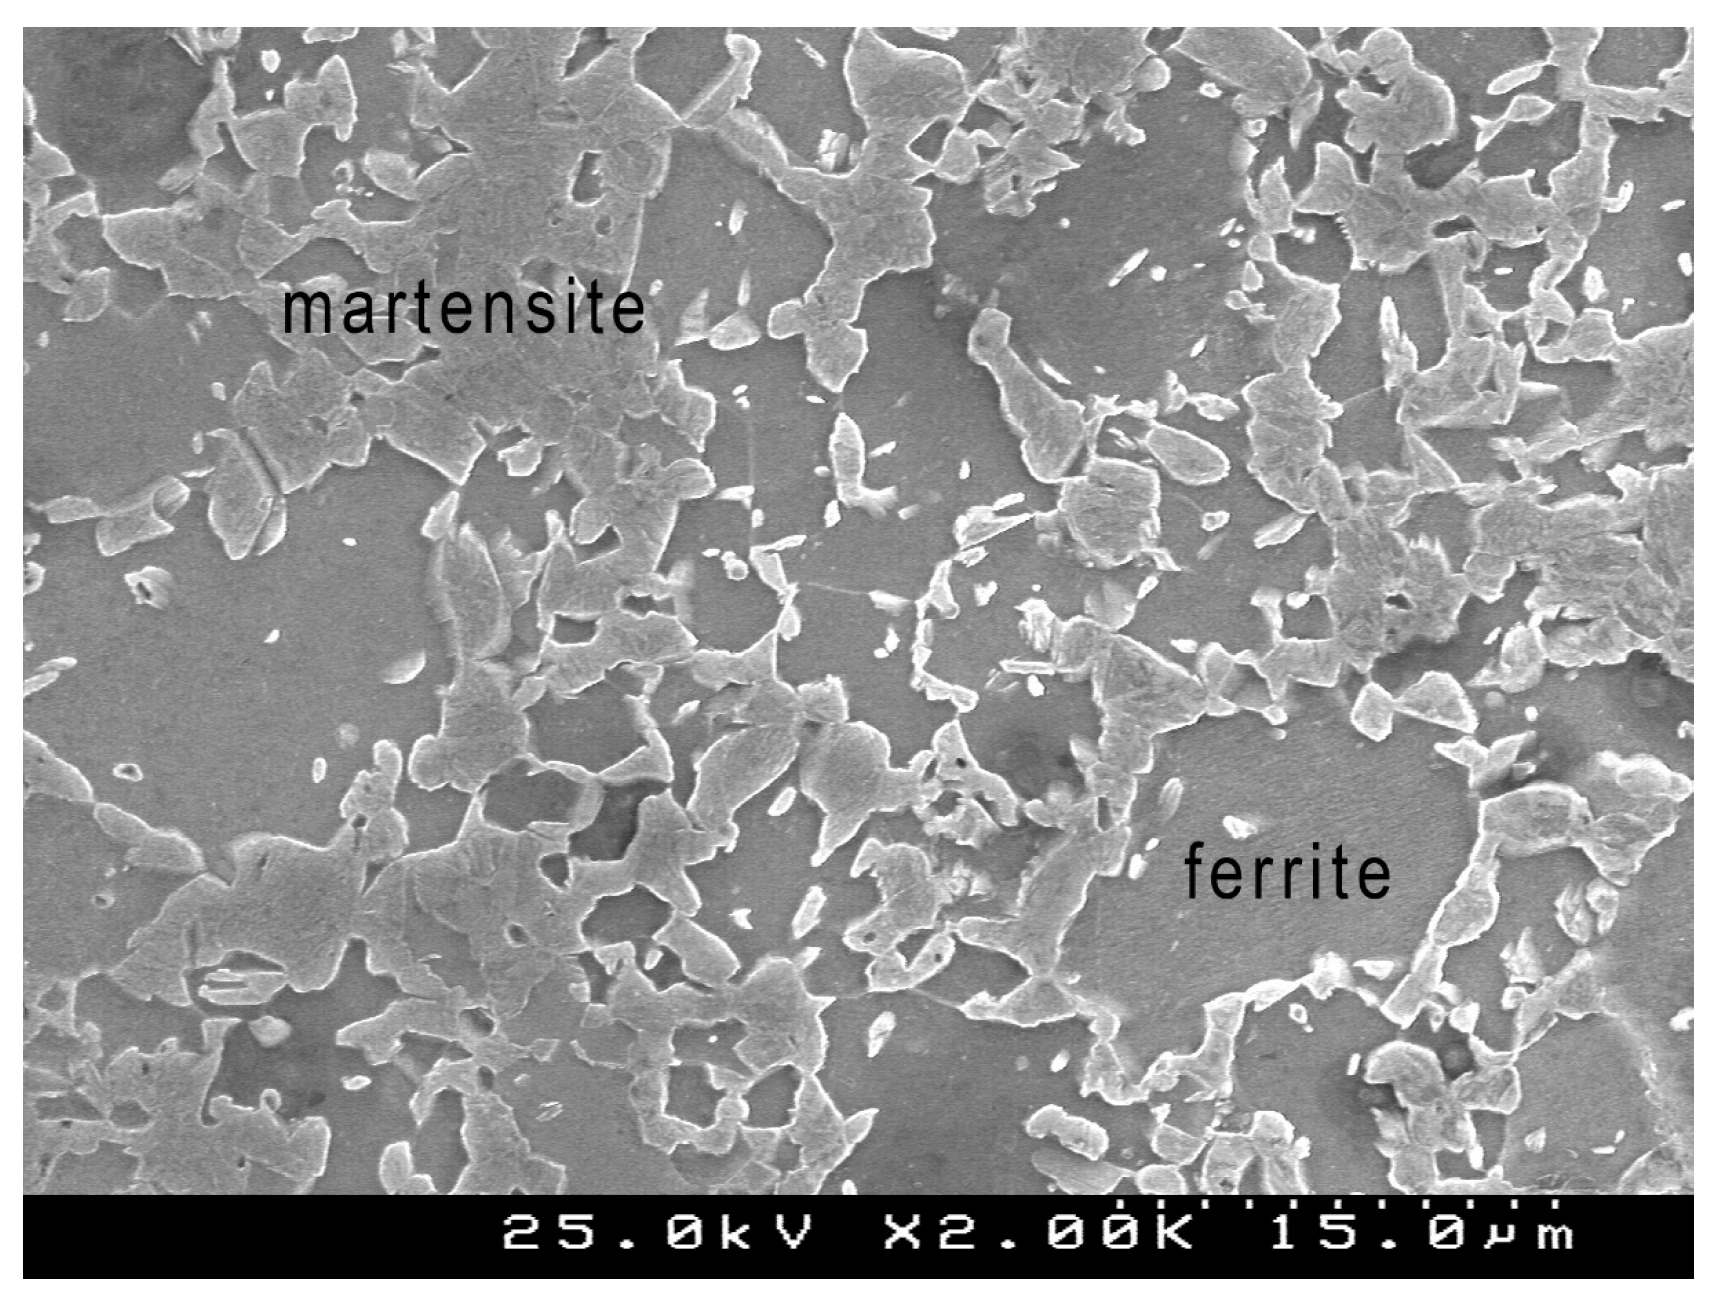
2. Base Material Characterization: DP1000 Steel

The studied dual-phase steel (DP1000) sheet, a type of advanced high-strength steel (AHSS), has been widely utilized in automotive or shipping structures such as frames, wheels, and bumpers. DP steel contains a soft ferrite matrix with hard martensitic “islands”. It exhibits good performance during the forming processes [29]. Figure 1 shows the microstructure of the experimental base material by means of a Scanning Electron Microscope (SEM) (Hitachi, Tokyo, Japan). The selected DP1000 steel with sheet thickness of 1.0 mm was supplied by the SSAB (Stockholm, Sweden) in as-received state. Two identical sheets with dimensions of 40 mm × 14 mm (length × width) were in one butt joint configuration after welding. The chemical composition is presented in Table 1.
In order to obtain the basic mechanical properties, as listed in Table 2, uniaxial tension tests along the rolling direction (RD) were carried out with a nominal strain rate of 10−4 s−1. A Shimadzu universal tensile testing machine (Schimadzur, Kyoto, Japan) was used with a top capacity 100 kN. All tension samples were cut by a water-jet and the dimensions complied with the ASTM E8 standard [30]. The test was repeated four times to verify the reproducibility of the tested results. In order to accurately measure the strain, a digital image correlation (DIC) system was adopted to capture the displacement fields. The ARAMIS-5M commercial code [31] was utilized to obtain the strain from numerous optical images. More detailed descriptions on this measurement technology can be found in previous works [9,32,33,34]. The macroscopic hardness of the base material was obtained using a Vickers hardness tester, namely Shimadzu HMV-2000 (Schimadzu, Kyoto, Japan).

3. Experimental Procedures

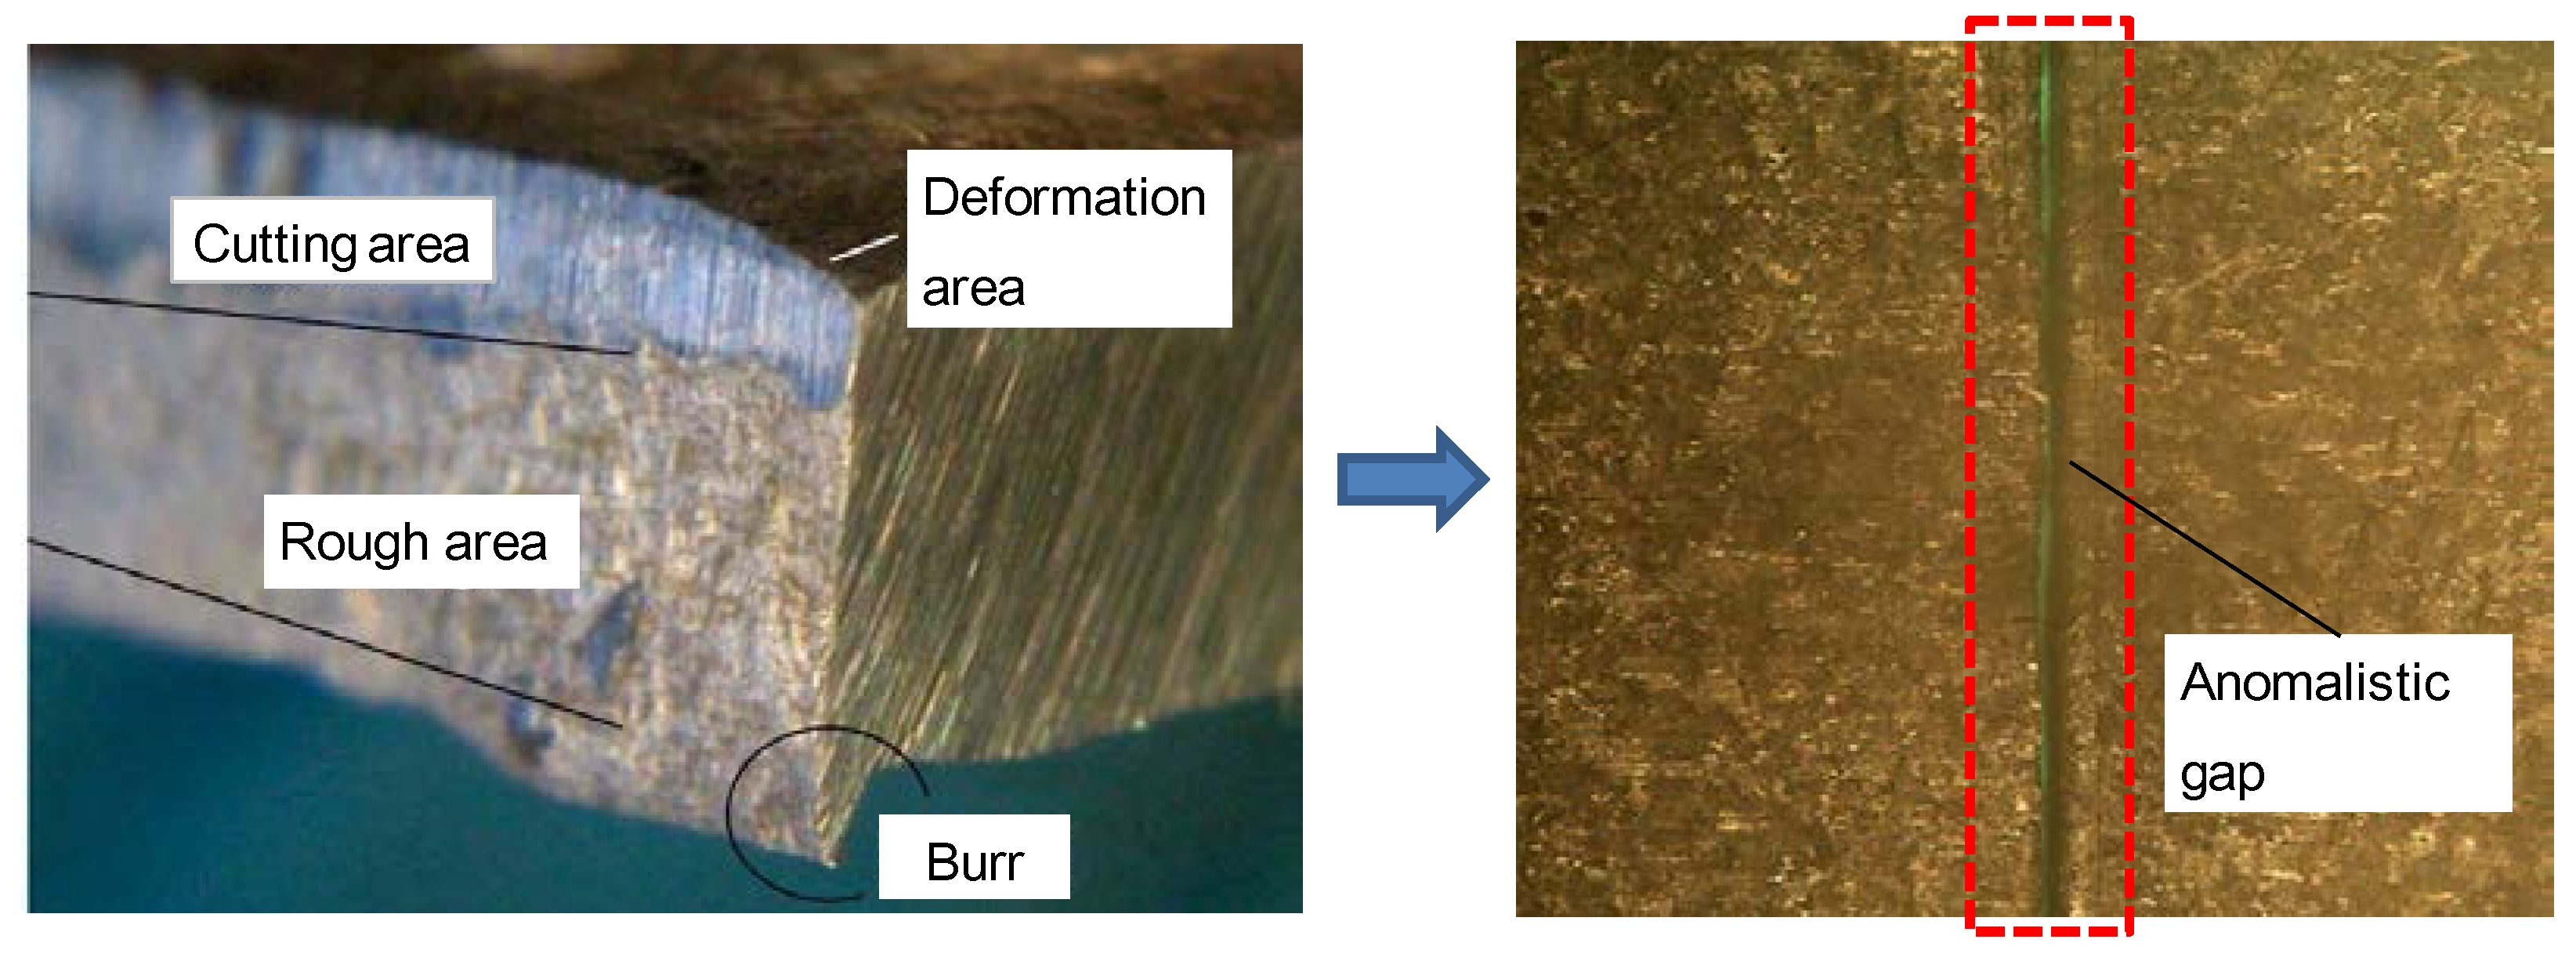
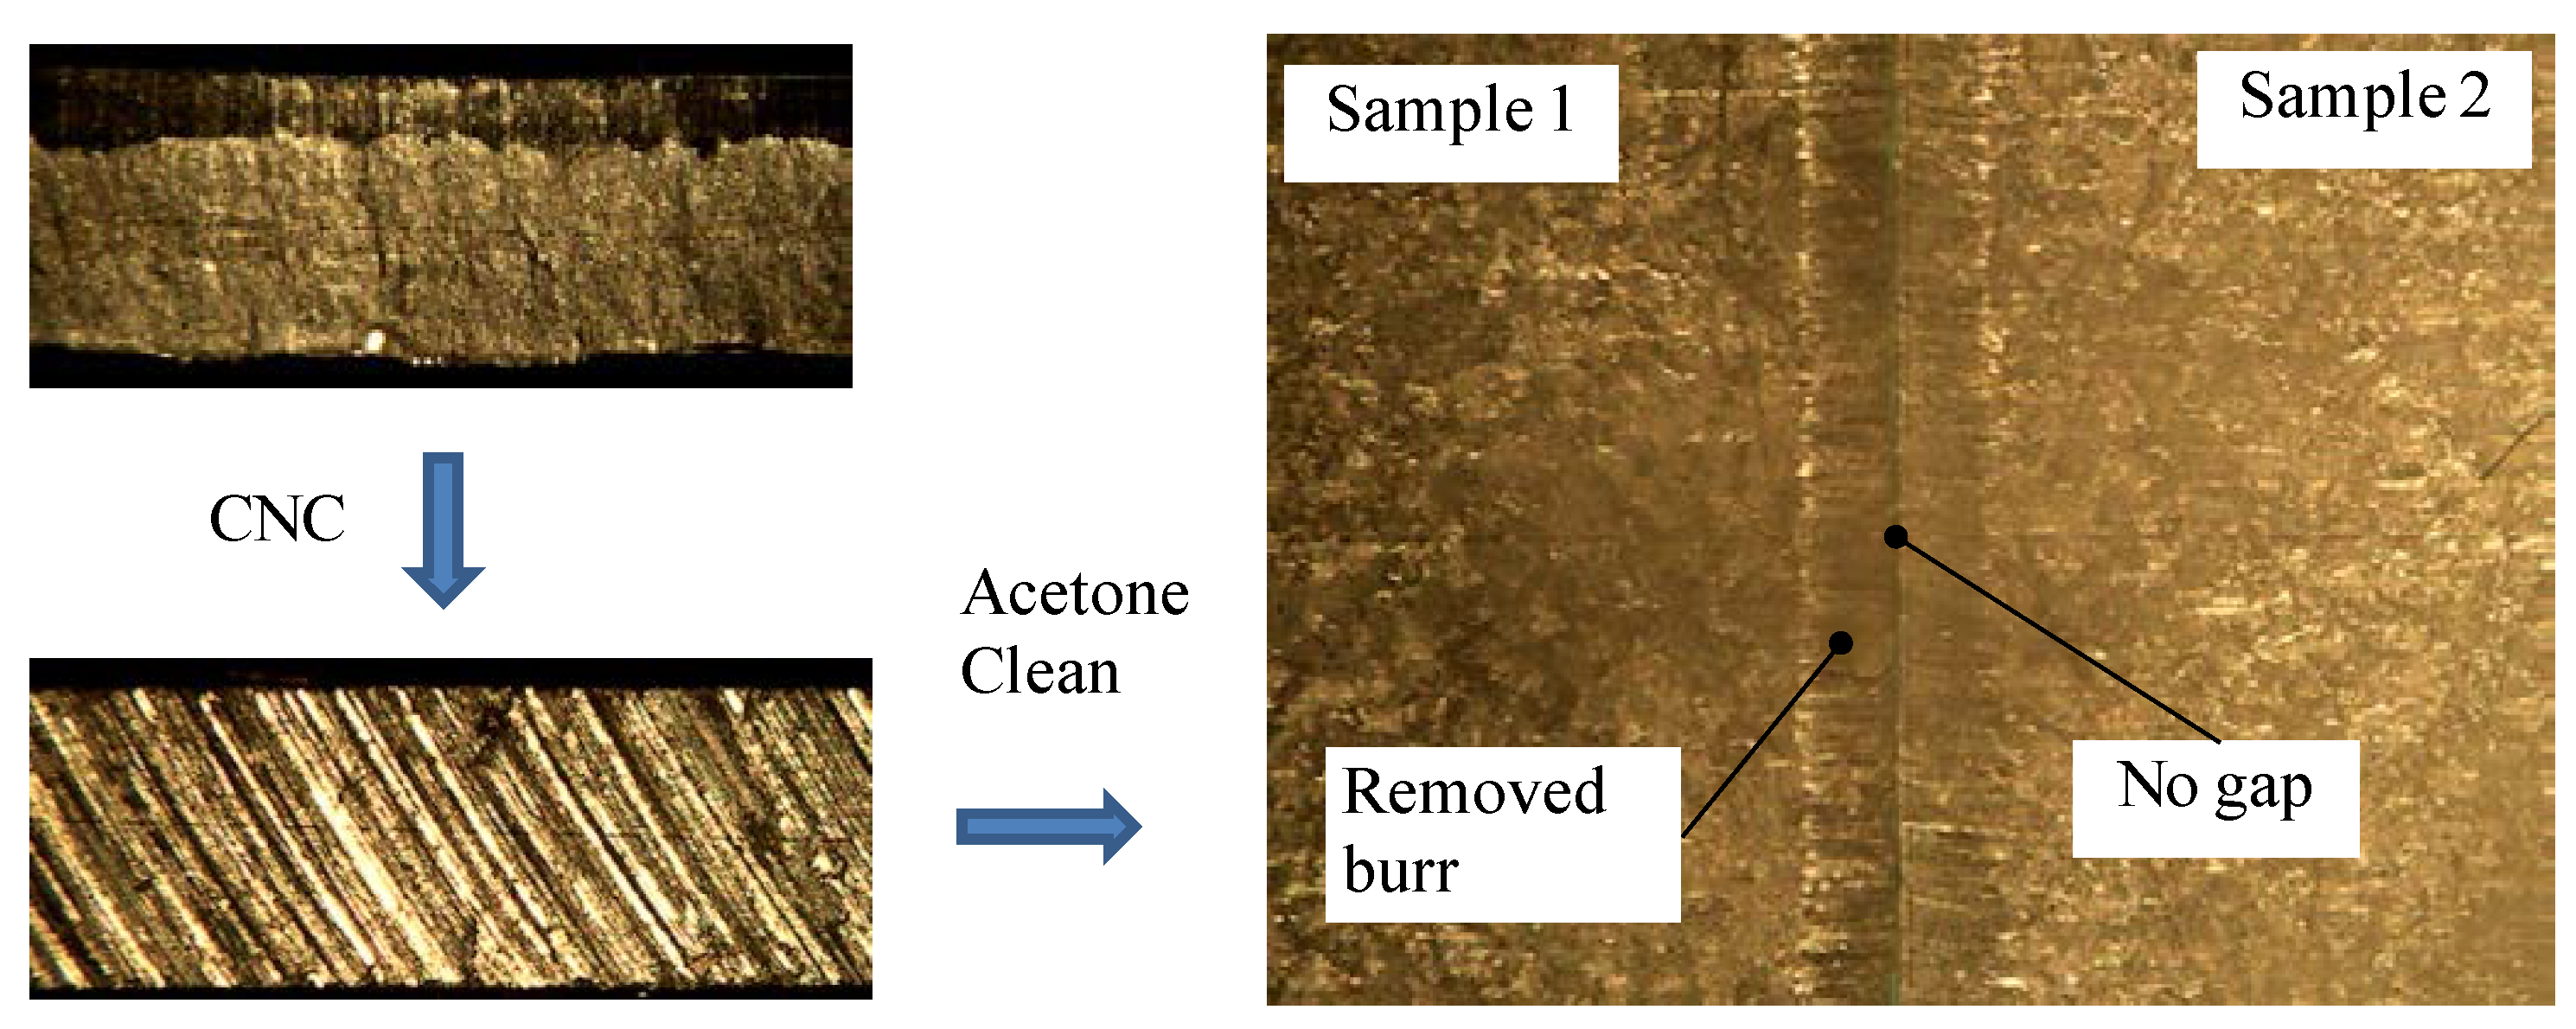
3.1. Cutting Surface Preparation for Pre-Welding Sample

The sheet cutting processes usually involve heating and melting of a material. This can lead to inhomogeneous microstructure changes and influence the performance of the materials used in the subsequent welding process. For instance, Figure 2 illustrates a typical cross-sectional surface cut by a guillotine, mainly including a cutting area, deformation area, rough area, and butt. This leads to a significant anomalistic gap at the pre-welding sample inspection. In fact, laser beam welding is seriously dependent on the position and surface quality of the prepared samples, especially when a narrow laser beam is adopted. Thus, it is vital to cut precise edges for almost no gap between the samples to be welded.
In this work, to ensure all the samples are welded under the same configuration, the inhomogeneous cross section of the cut sample was firstly machined flat using computer numerical control (CNC) and then the burr was carefully removed with sandpaper. To remove oil or other impurities, the machined samples were cleaned with acetone. Figure 3 illustrates this additional and important experimental preparation work, namely cutting surface preparation. It can be observed that there is almost no gap, which leads to consistency in pre-welding inspection.

3.2. Pulsed Nd:YAG Laser Welding Set-Up

In this work, pulsed Nd:YAG laser tested system, i.e., SISMA SWA300, was utilized to perform experiments. Figure 4 shows the experimental apparatus used. The main parameters of the control system are as follows: maximum mean power of 300 W, wave length of 1064 nm, maximum peak laser power of 12 kW, maximum pulse energy of 100 J, and the range of pulse range from 0.2 ms to 25 ms. To ensure the pool of the butt joint against the oxidation, argon shielding gas with high purity (99.99%) was supplied to both bottom and top surfaces of the specimens at a gas flow rate of 10 L/min. A solid state pulsed Nd:YAG laser with the above parameters is appropriate for fiber passing from the resonator to the laser beam head. This ensures that little welding occurs far from the laser source. It is particularly useful for large or complex structures. In this work, the distance between the laser exit and the sample was set at a value of 105 mm with optimal resolution.

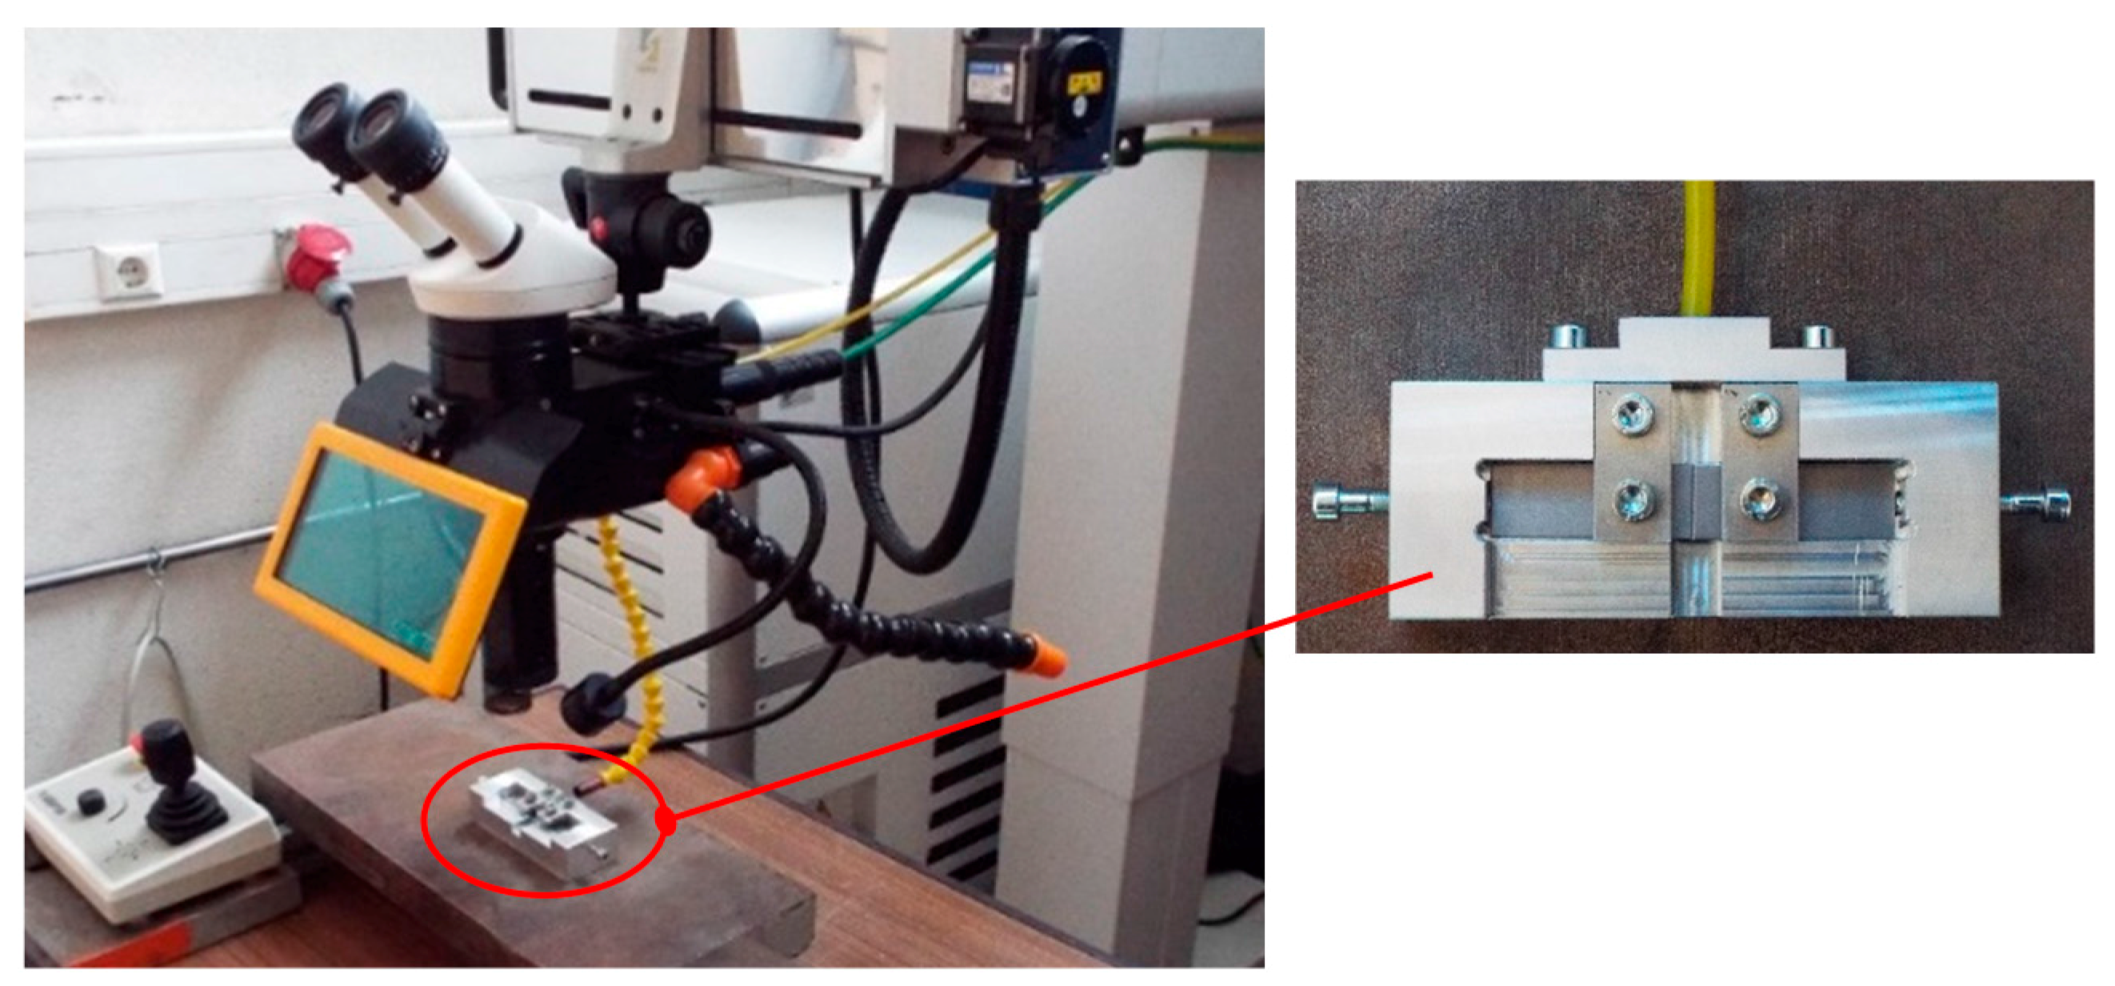
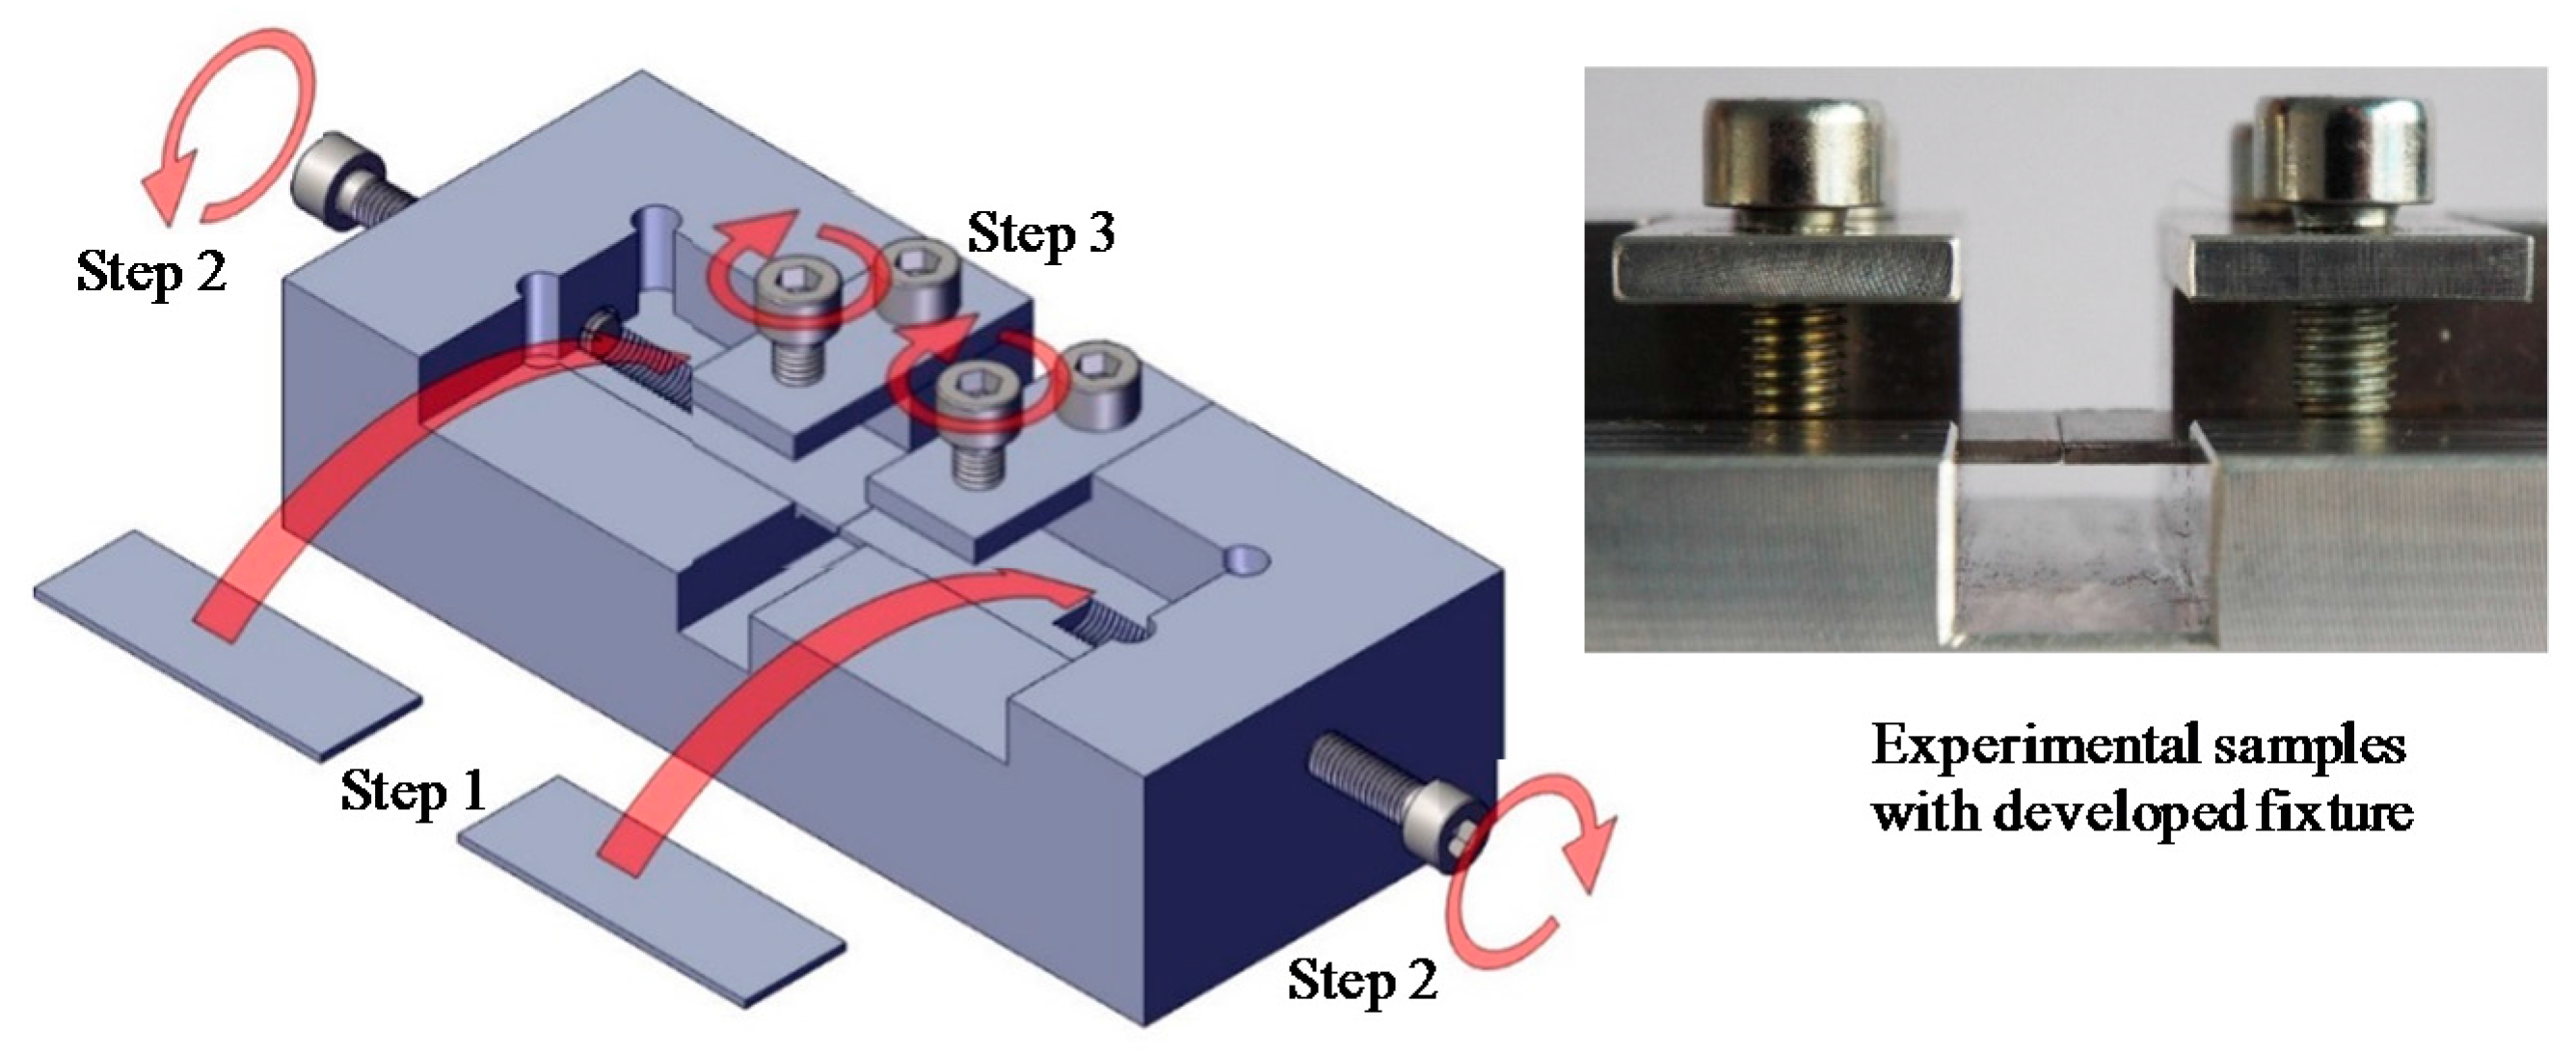
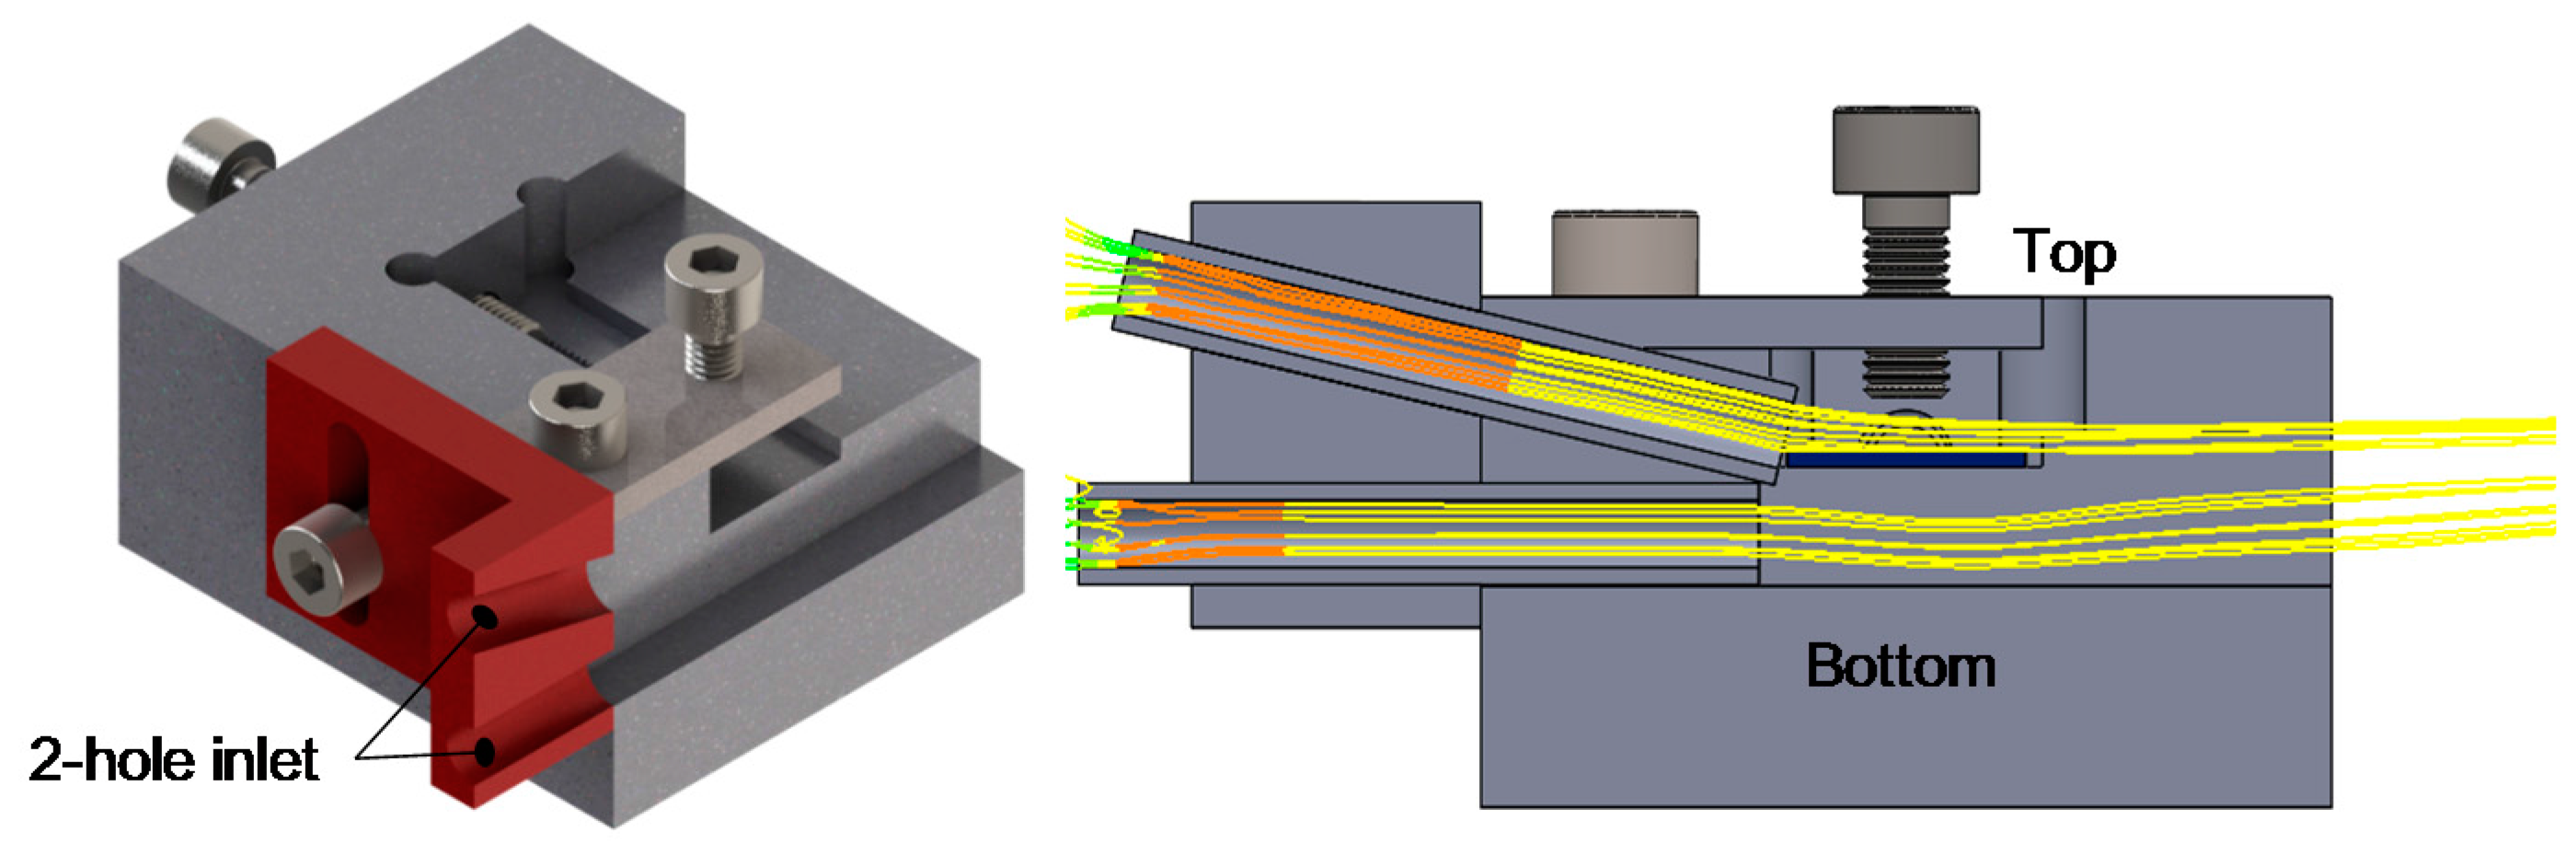
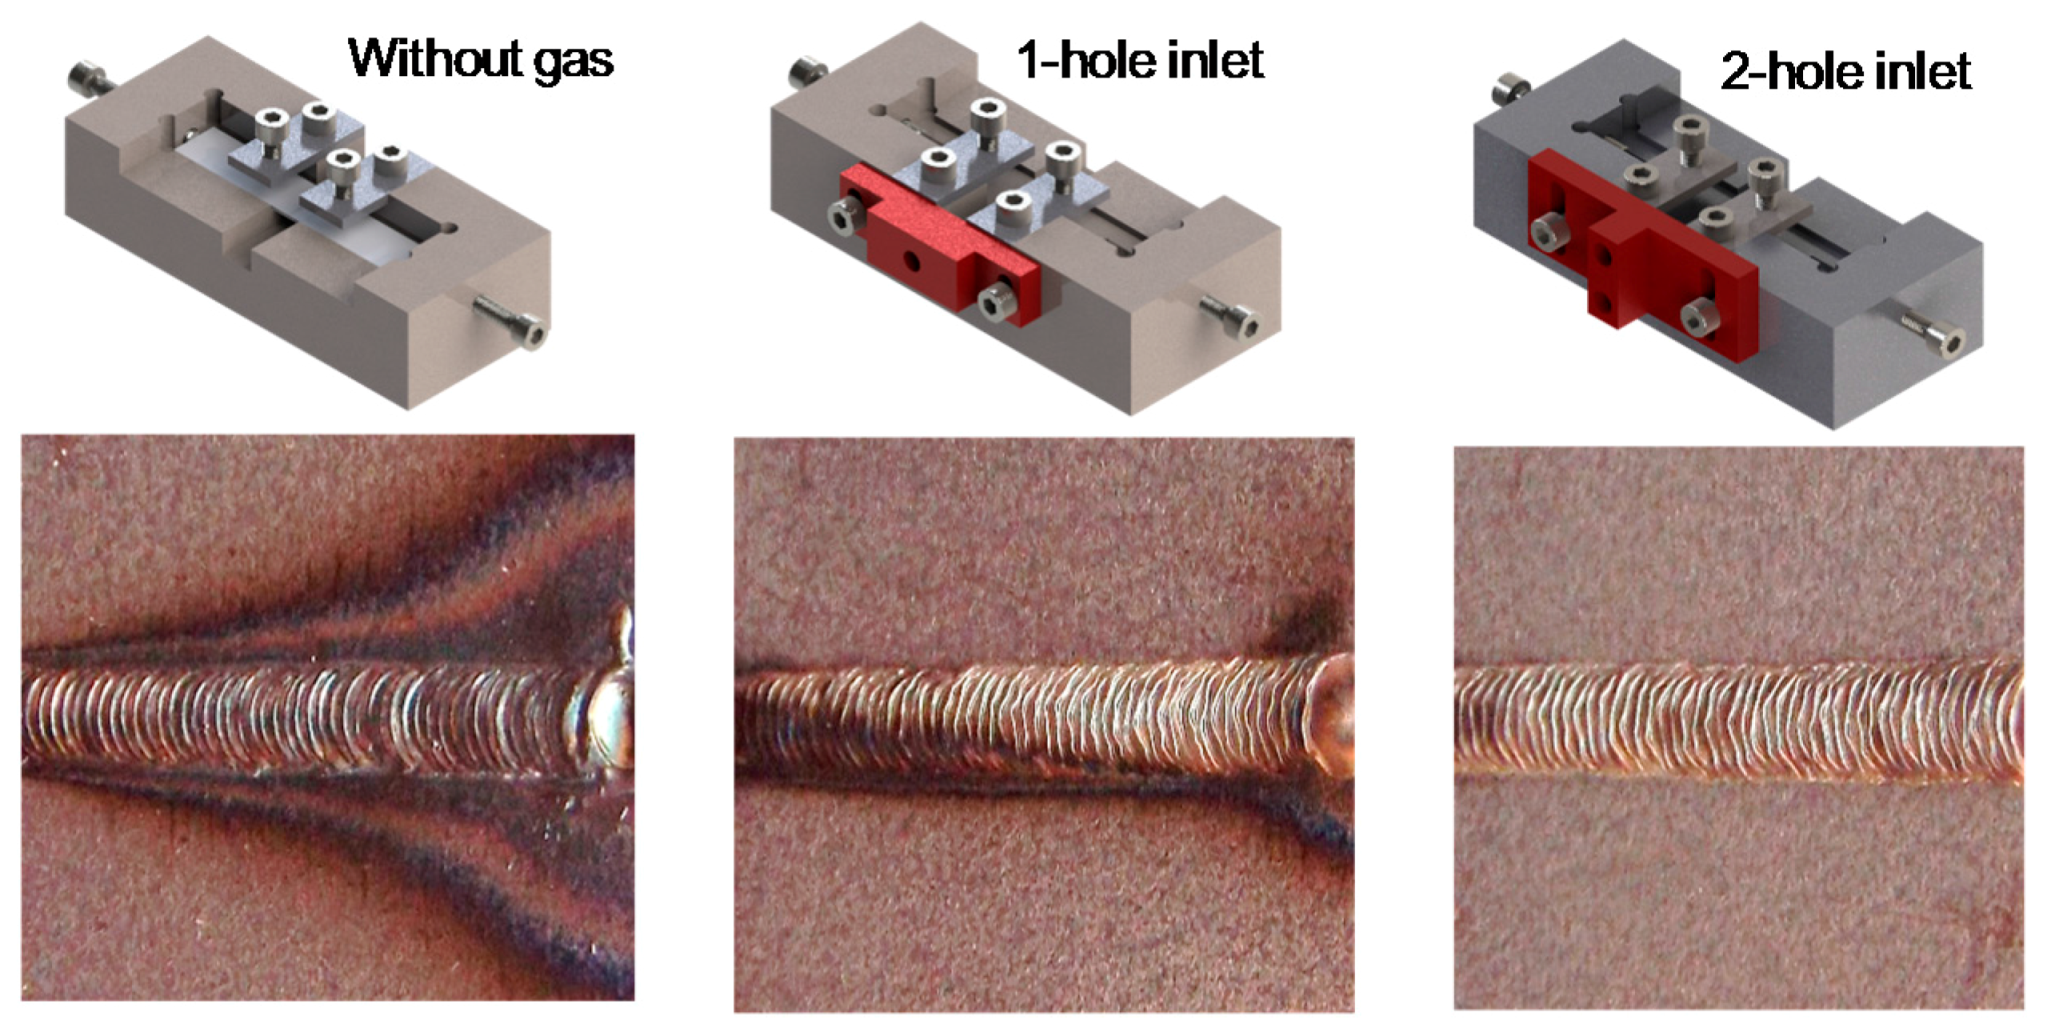
3.3. Design Optimization of Welding Sample Fixture

In order to avoid accidental misalignment or movement during laser welding, a characteristic welding sample fixture has been designed to ensure stable and consistent experimental tests. It is a relatively simple but good enough sheet metal sample fixture. It includes three steps to assemble the welding samples, as shown in Figure 5. The samples snap into place and clamp with screws along the longitudinal and normal directions.
For laser welding, the flow ways of assisted gas inlet are usually ignored or at casual placement during the pre-welding preparation. In this work, a two-hole inlet structure design (see Figure 6) of assisted gas flow was developed to ensure that both the top and bottom surfaces of the welding sample have entire shielding gas during the welding process. Figure 7 compares three types of assisted gas solutions, i.e., without assisted gas, one-hole inlet structure, and two-hole inlet structure. It indicates that the design with a two-hole inlet structure allows the possibility of reducing the oxidation on both the top and bottom weld surfaces.

3.4. Microstructure and Micro-Hardness Testing

The microstructure examination was conducted by means of scanning electron microscope (SEM). The etching condition was carried out through the immersion of the samples with 5% nital solution. The first macro-hardness tests were performed with a holding time 10 s using a Vickers hardness tester, namely Shimadzu HMV-2000 (Shimadzu, Kyoto, Japan). The test force of 20 mN can be used as well as the application of 115° triangular pyramid indenter. The distance between the test positions is 0.25 mm. The second is a CSM Nano-indenter (TTX-NHT, CSM Instruments, Neuchatel, Switzerland) used for the small-scale micro-hardness measurement. The tested samples were polished by emery particle paper TTP2000 (Zebra Technologies, Lincolnshire, IL, USA). For the measurement of weld penetration, a microscope, namely MitutoyoTM (Kanagawa-ken, Tokyo, Japan), was used. All the corresponding experimental tests were sufficiently spaced to prevent any underlying obstruction of strain fields giving rise to contiguous indentations.

4. Process Parameter Dependent Theory

4.1. Process Parameters Relationship of General Laser Welding

To obtain exhaustive penetrated high-quality joint after laser beam welding, it is essential to study the optimal process conditions. Generally, they consist of three main groups: laser beam parameters (diameter, wavelength, power, and divergence), sample capabilities (material density, thermal conductivity, thickness, potential heat of melting and cooling), and key welding parameters (velocity, shielding gas direction, surface absorptivity, and focusing element length). Compared to absorptivity about 10–20% at room temperature for most steels, it is able to increase to 80–90% during heating and leaps when the material’s melting point is reached. The basic relationship of necessary heat Q and mass m can be explained by [35]:
Q = m [ c ( T m T 0 ) + L m ] ,
where c, T m , T 0 , and L m are the particular heat, melting and initial temperatures, and potential heat of melting, respectively. For continuous laser beam welding, the above relationship can be transformed as follows:
Q / t = ρ D h υ [ c ( T m T 0 ) + L m ] ,
where Q / t denotes requested power for melting. ρ , D , h , and υ are the density, laser diameter, penetration, and welding velocity, respectively. The depth of penetration is obtained by:
h = Q / t ρ D υ [ c ( T m T 0 ) + L m ] .
Including the absorption of weld surface and the losses of heat conduction, the calculation of penetration is estimated as:
h = κ P D υ ,
where P and κ are the power and a constant associated with surface absorption and latent energy losses. P / υ defines the ratio of heat input to a unit length. The penetration depth is related to the adopted power and is proportionally opposite to laser spot diameter and welding velocity. More detailed descriptions of pulsed laser parameters can be seen in the next section.

4.2. Pulse Welding Parameters

For a pulsed laser, the main conditions, i.e., flash lamp charging voltage U (V), frequency f (Hz), and pulse duration t (ms) are three key process parameters in terms of laser source. The practical pulse energy E (J) can be defined by the above parameters. Peak power P p e a k (kw) is given by a portion of laser beam energy and pulse duration as follows:
P p e a k = E / t .
For a given spot size, the laser beam intensity is dependent on peak power. Average laser power P (W) is defined as a product of practical energy and frequency:
P = E f ,
and gives the laser welding velocity. Nowadays, the first general pulsed laser welding method is spot welding. It is also generally applied for rude fixing of structures to be subsequently seam process. One typical advantage of this procedure is to mitigate dimensional distortions caused by high thermal gradients with respect to power density. To obtain successive strict welds, pulse overlap (PO) must be adopted as well as the appropriate combination of welding parameters. Thus, pulse overlap can be given by:
P O = 1 υ D f .
Compared to conventional and continuous laser beam welding, higher pulse densities result in higher thermal transformation rates. This could induce weld defects and inhomogeneous microstructure. Thus, another important parameter, namely effective peak power density ( D e p p ), should be considered for the important contribution of weld quality. It can be defined by a product of peak power density ( D p p ) and overlapping factor O f :
D e p p = O f × D p p ,   w i t h   O f = 1 1 P O .

4.3. Design of Experiments for Laser Welding

In order to explore the effects of each single process factor on penetration and microstructure properties of DP steel, experimental design is performed. First, determine the parameters that ensure fairly good laser quality. In other words, the full weld penetration should be obtained. Then, based on the full weld penetration, further process parameters optimization can be performed to analyze the effect of microstructure properties, e.g., micro-hardness. Additionally, the optimal weld should ensure no cracks, high resistance, a suitable size and shape of melting fusion, and so on.
Table 3 presents the selected welding parameters of the experimental plan. More detailed lists of each analyzed welding parameter are given in the Appendix A, Table A1, Table A2, Table A3, Table A4, Table A5 and Table A6. In each set of one-factor experiments, only one parameter was varied, keeping all the other parameters fixed to identify the sensitivity of the one tested parameter. Seven different types of pulse, i.e., a simple rectangular pulse, a modular pulse with three sections, a rectangular pulse with a ramp start, a rectangular pulse with a ramp end, a rectangular pulse with a ramp start and end, the emission of laser beam pulses with three consecutive equal intervals of 1 ms, and a pulse with simple power divided to be better resolution at low power, were analyzed and discussed. It should be noted that the first simple rectangular pulse is the best and most widely used in real or experimental tests.

5. Results and Discussions

5.1. Effects of Laser Beam Parameters on Weld Penetration

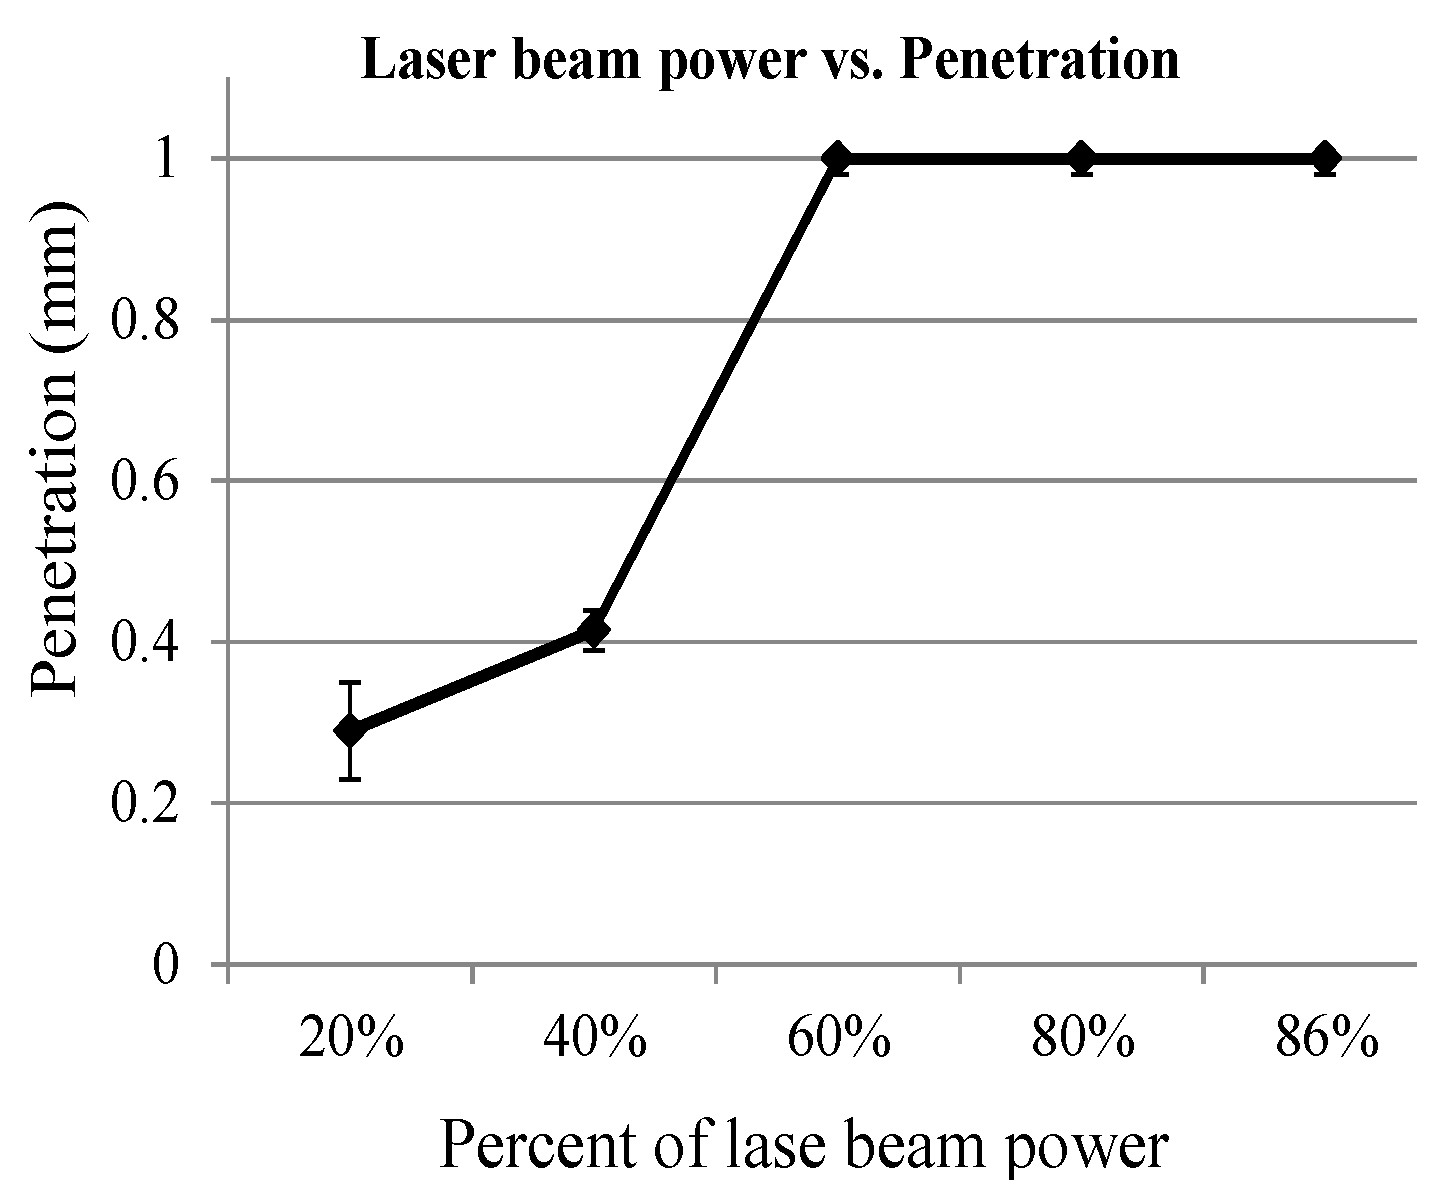
5.1.1. Effects of Laser Beam Power on Weld Penetration

Laser beam power was changed in the interval from 20% to 80%. Figure 8 shows the weld surfaces on the top and bottom and at the beginning (left side) and end (right side) of the perpendicular longitudinal section. It can be observed that the weld penetrations reach almost full when the power percentages are higher than 60%. However, the 40% laser power is obviously insufficient. In addition, there are some spatters on the top weld surface when the laser power percent is larger than 60%. This might be due to the clamping force on the samples. The potential question of thermodynamic instability in the welding pool arises.
As shown in Figure 9, it is possible to estimate that the ideal power for the welding of the studied case should be between 40% and 60%. Weld penetration has a sharp rise in this range of laser power. However, the sensitivity of the weld penetration to laser beam power greater than 60% becomes less pronounced. In a word, the effects of power on penetration are significant and must be taken into account during laser welding applications.

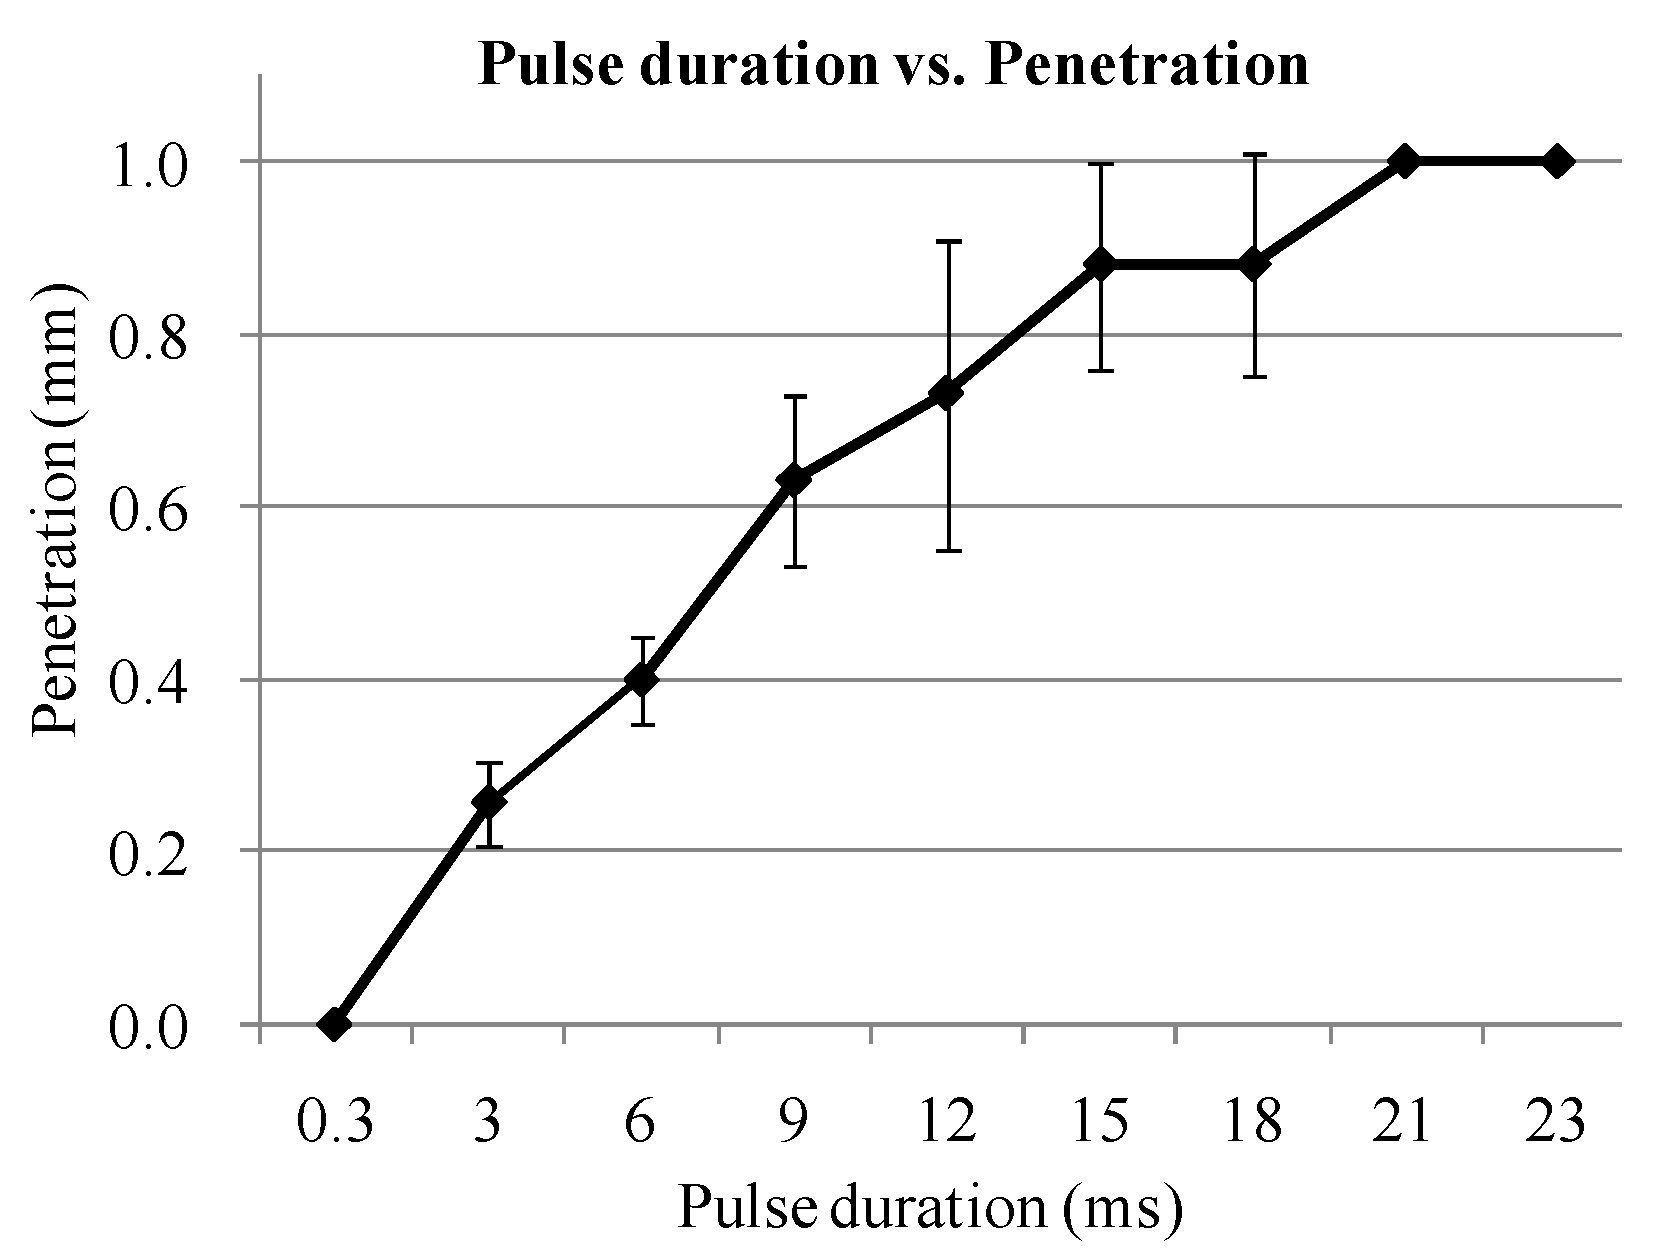
5.1.2. Effects of Pulse Duration on Weld Penetration

Figure 10 reveals that the greater the pulse duration the deeper the weld penetration. The longest pulse duration of 21 ms and/or 23 ms induces full penetration. By varying the pulse duration and keeping the energy constant, the longer the pulse duration, the lower the energy received by the part, leading to a decrease in penetration. However, in reality, the high pulse duration is not recommended. This is because too high a pulse duration can cause the pulse overlap to not be constant, especially for continuous laser beam welding. Therefore, the experimental results of these samples over a long time are not reliable, but only provide a trend or sensitivity reference. For the analyzed DP1000 steel, the optimal duration of the pulse should be in the middle range, from 9 ms to 15 ms.

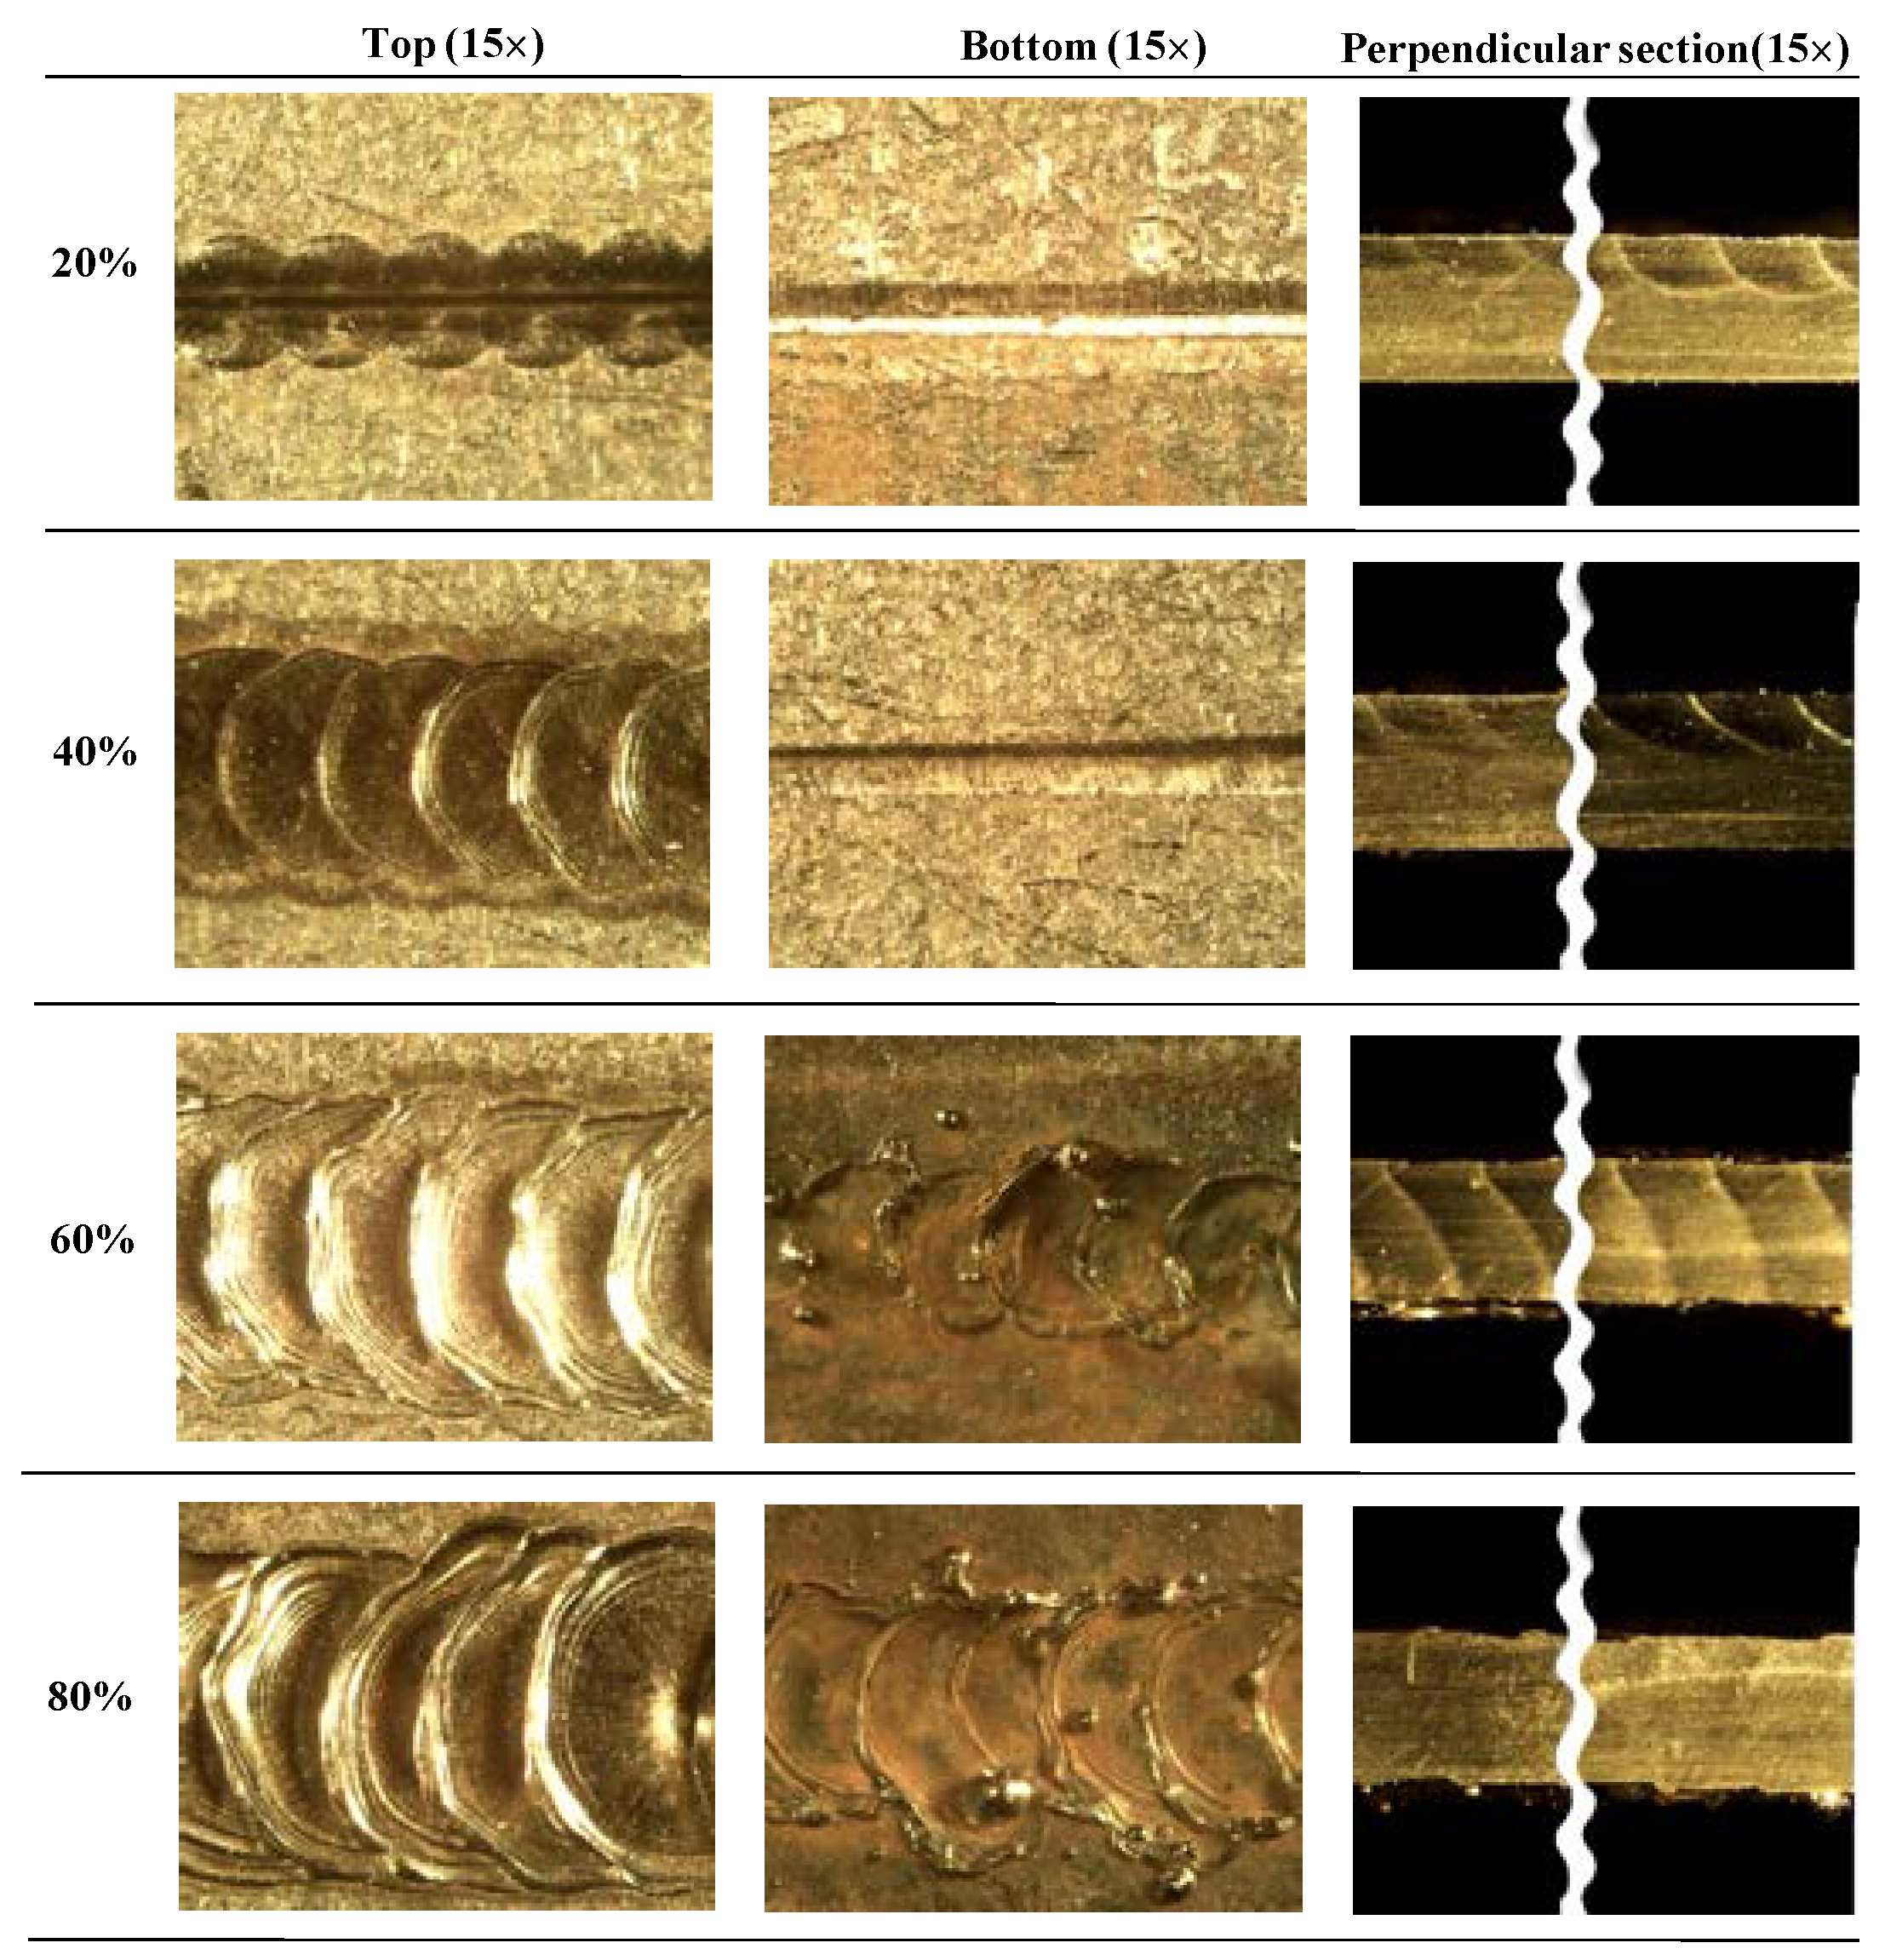
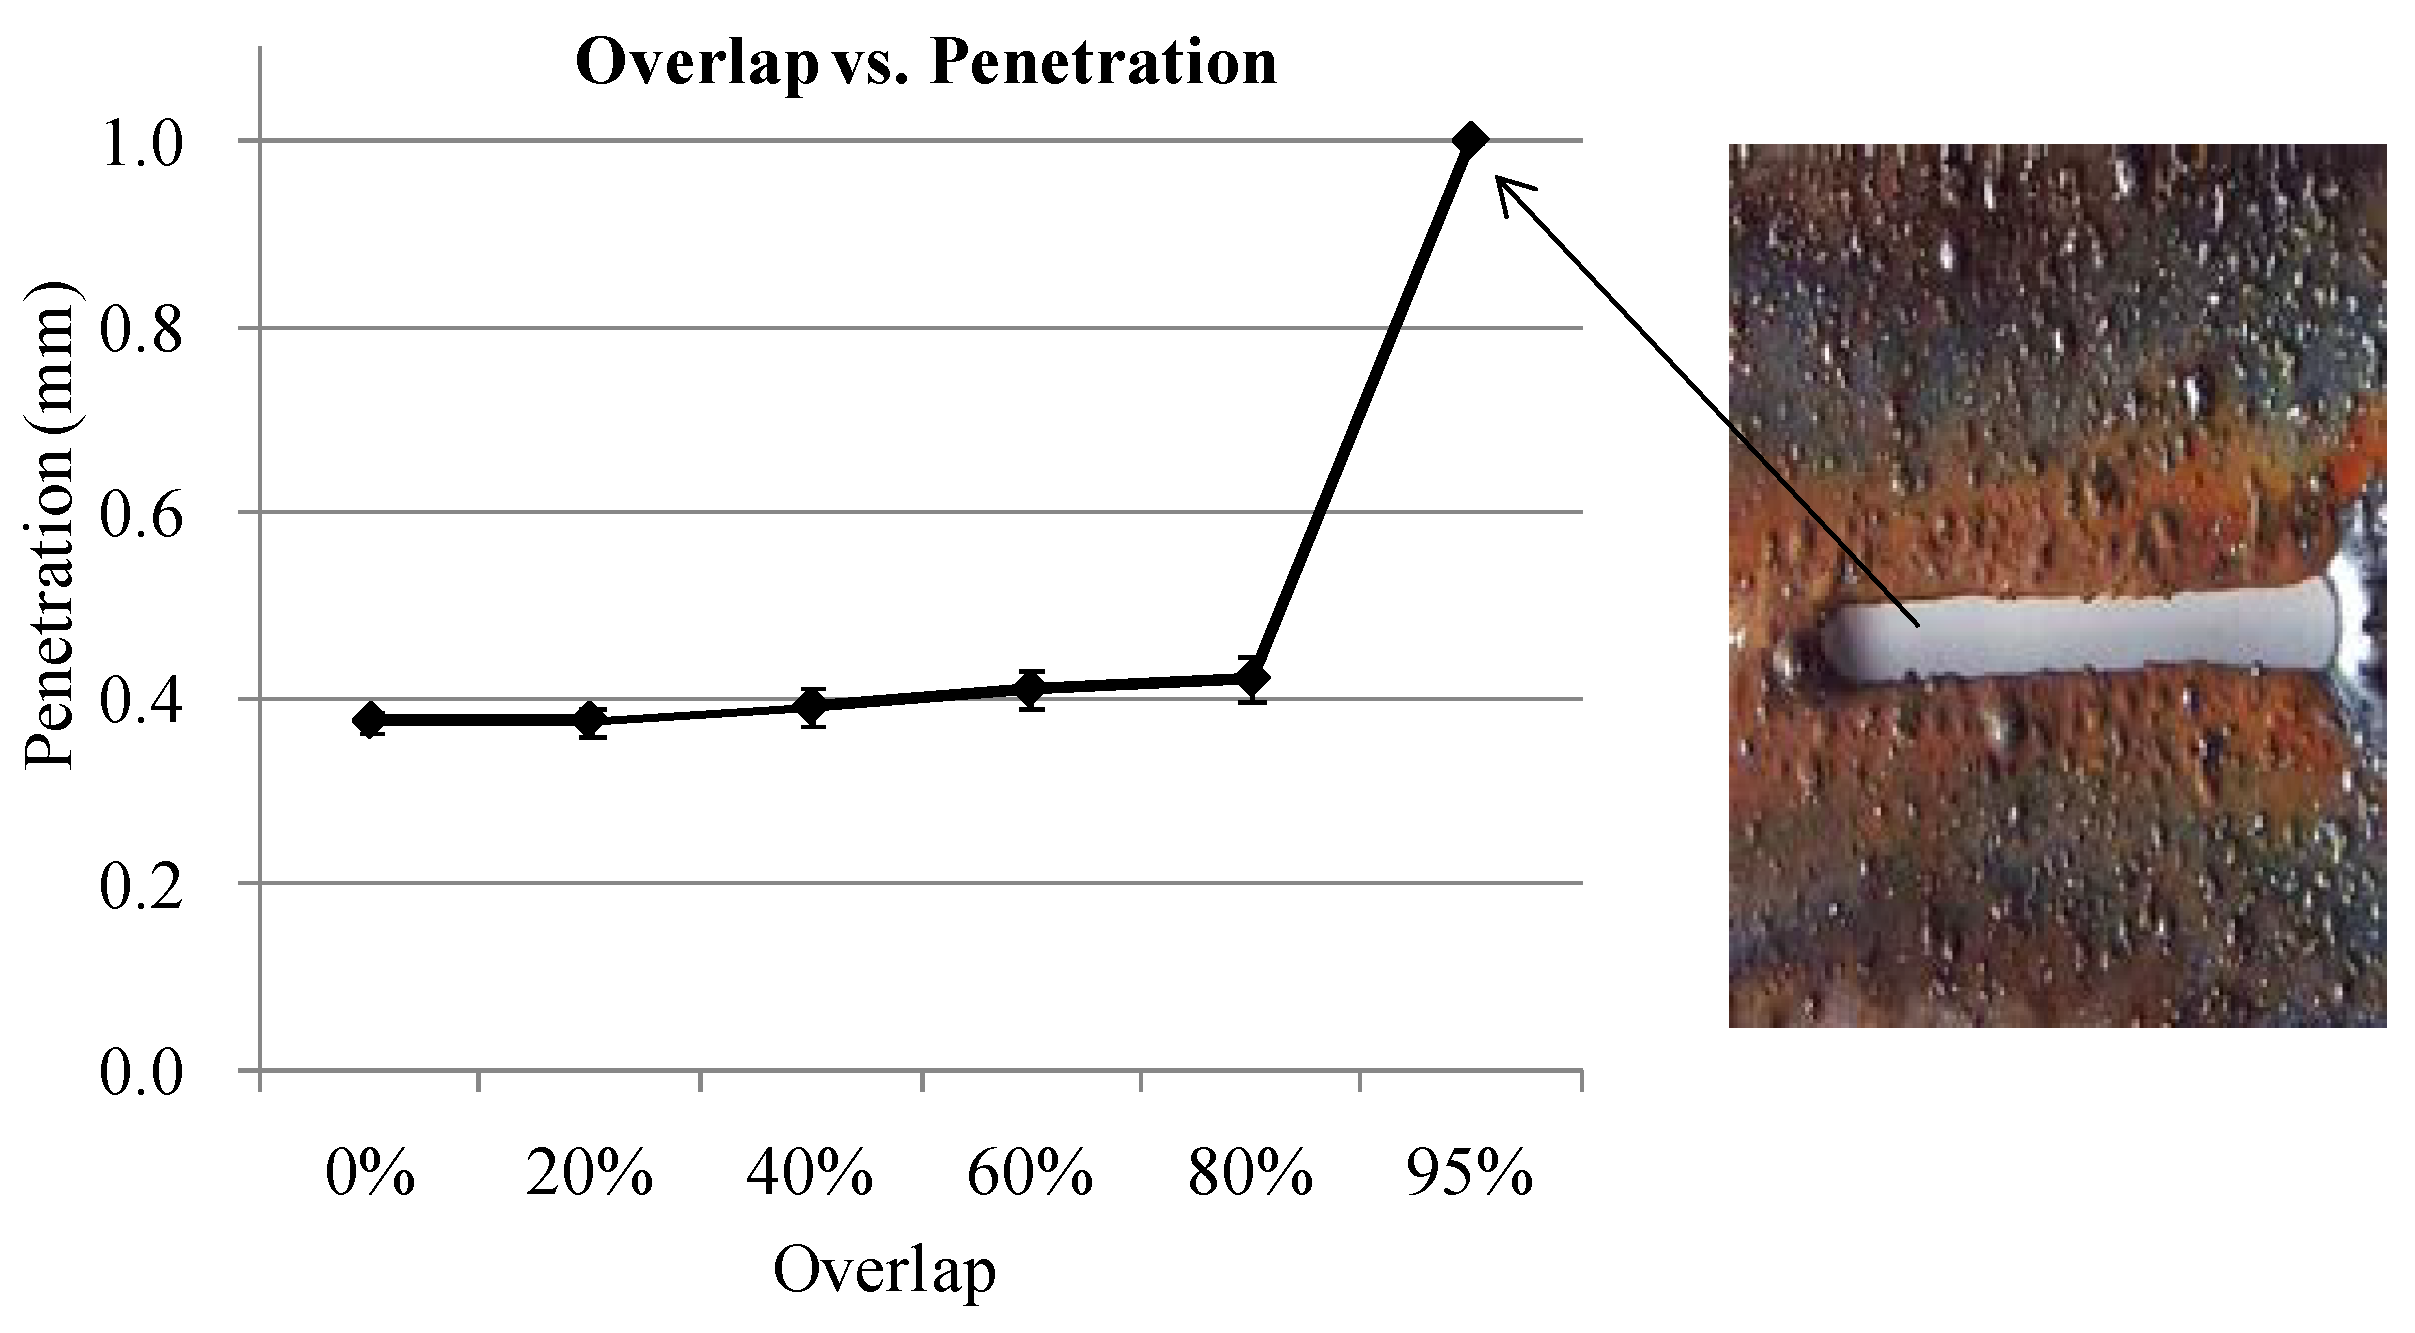
5.1.3. Effects of Overlap on Weld Penetration

It can be understood from Equations (7) and (8) that overlapping is related to the selection of pulse duration, spot size (diameter), and traverse velocity for a specific mean power. In this work, a series of overlap values were tested experimentally to assess the effects on weld penetration. Figure 11 shows that the overlap seems not to affect the weld penetration, but only up to the value of 80%. For the last sample applied to an overlap of 95%, the laser pulse is similar to the continuous laser as the pulses are almost constant. For this value of overlap, the samples are completely melted and crossed by the beam. The suitable overlap should be less than 80%, although it hardly affects weld penetration for pulsed Nd:YAG laser beam welding.

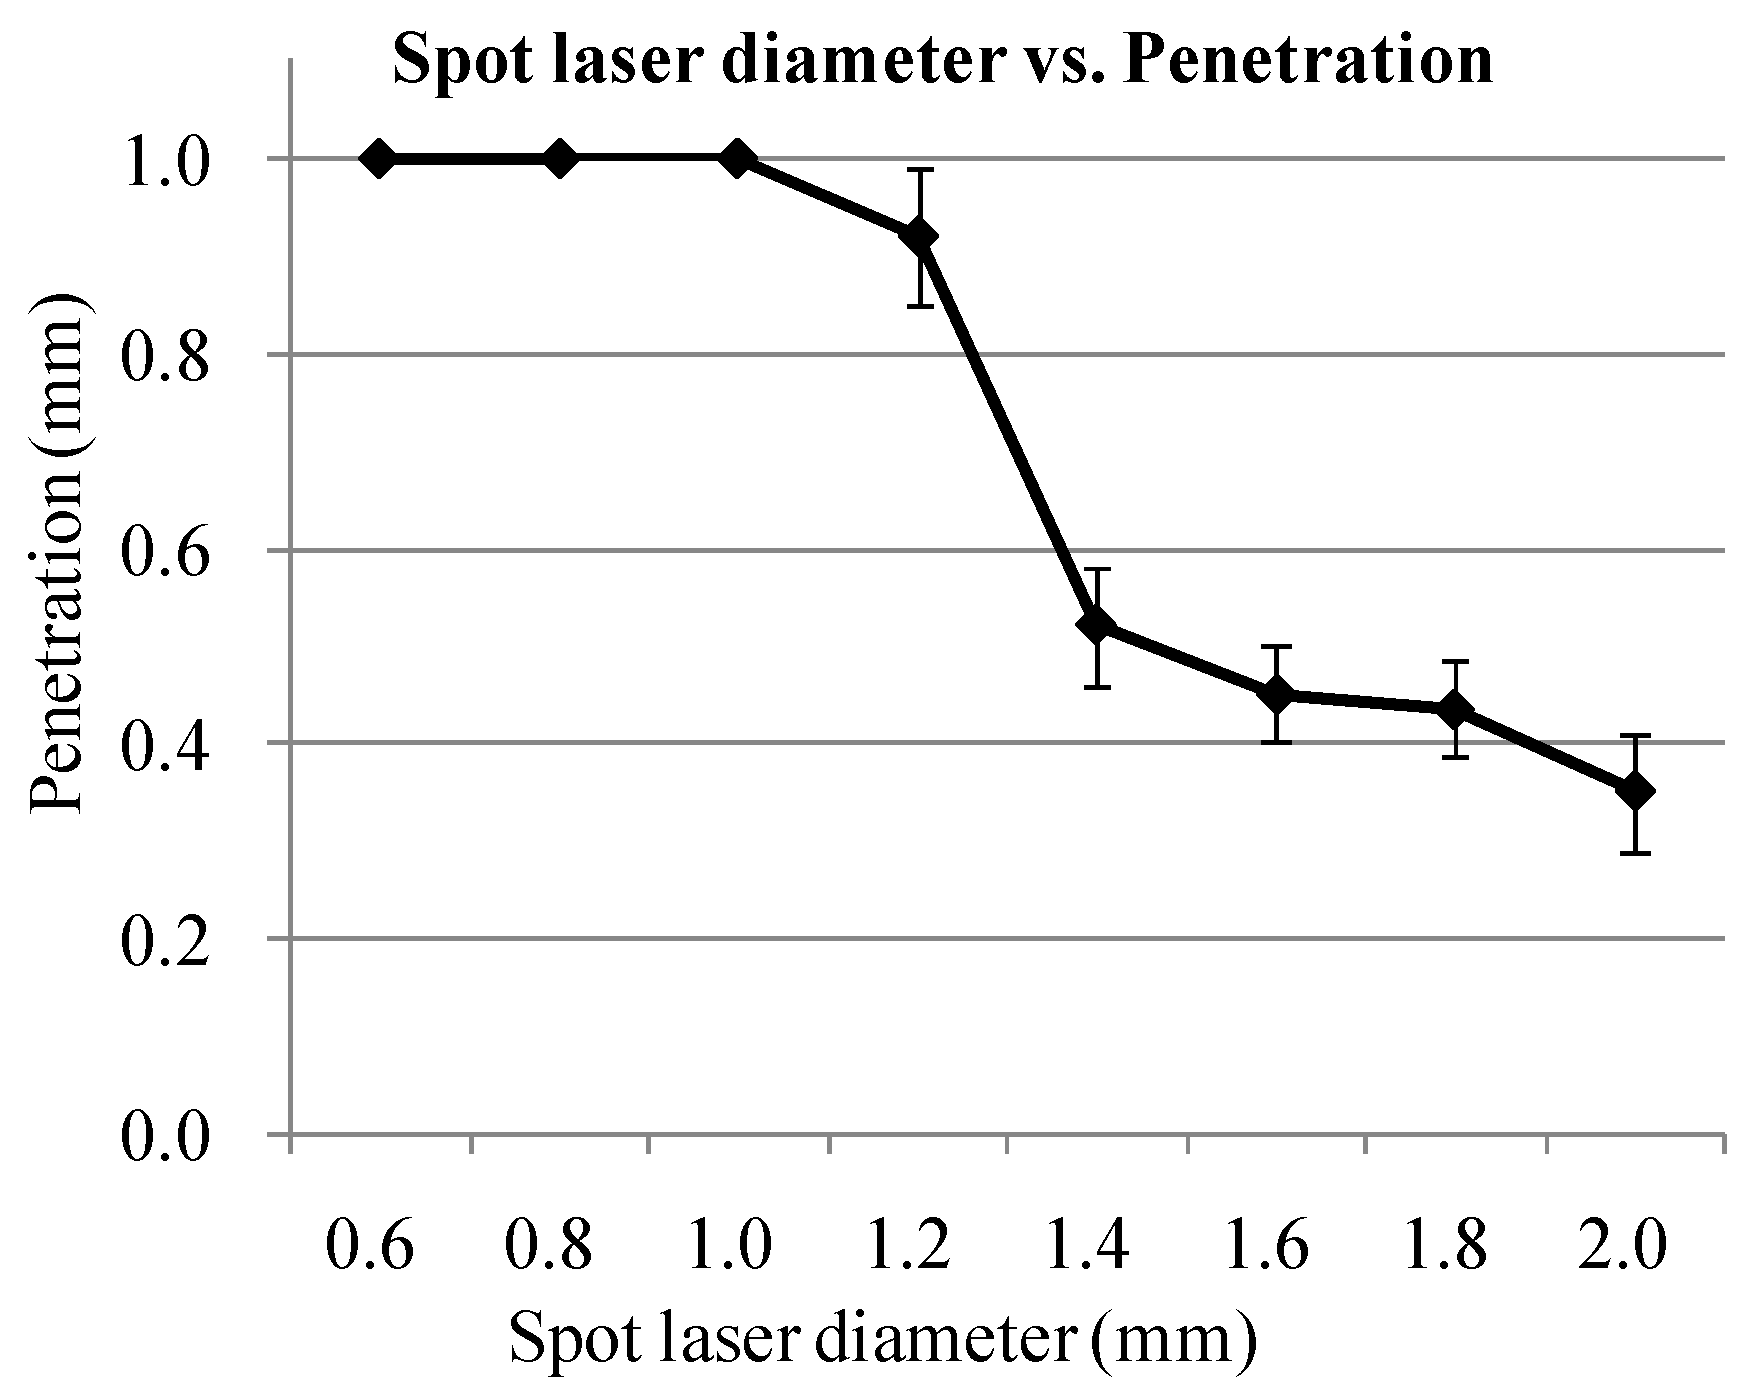
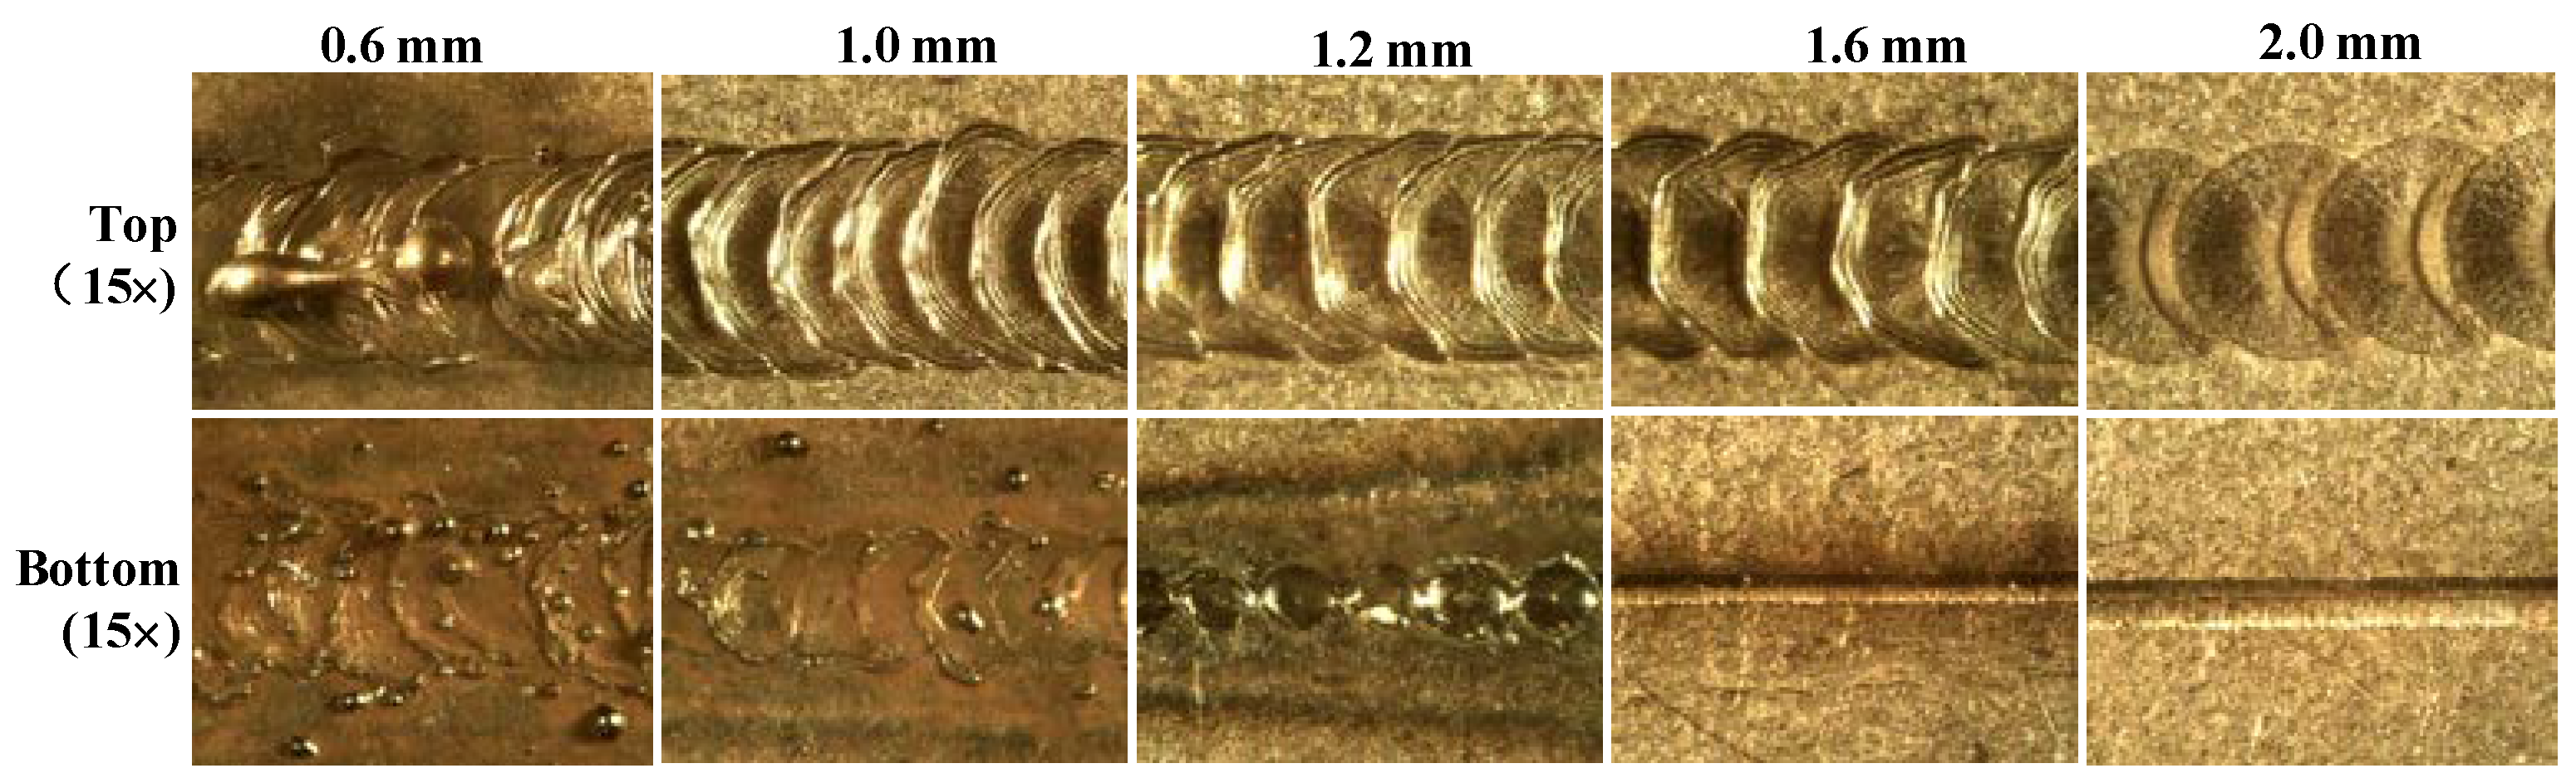
5.1.4. Effects of Spot Laser Diameter on Weld Penetration

Figure 12 shows that an increase of diameter decreases the weld penetration. This experimental result is consistent with the theoretical relationship in Equation (4). It is known that a greater diameter leads to smaller power density due to the larger area in the same laser beam power. The small power density induces a decrease in the laser impact in the piece. In other words, when the diameter decreases or the power is channeled to a smaller point, the laser beam should be more concentrated and potent, causing an increase in weld penetration.
Figure 12 indicates that the penetration decreases sharply when the applied spot diameter increases from 1.2 mm to 1.4 mm. To further observe the distinction, the weld surfaces under different spot diameters are compared in Figure 13. Meanwhile, there are some significant fusion spatters on the top and bottom weld surfaces when the spot diameter is smaller than 1.0 mm. This might be because the thermodynamic behavior in the welding pool manifests shrinkage when a small laser beam spot size is applied. These additional spatters imply that the weld penetrations are sufficient.

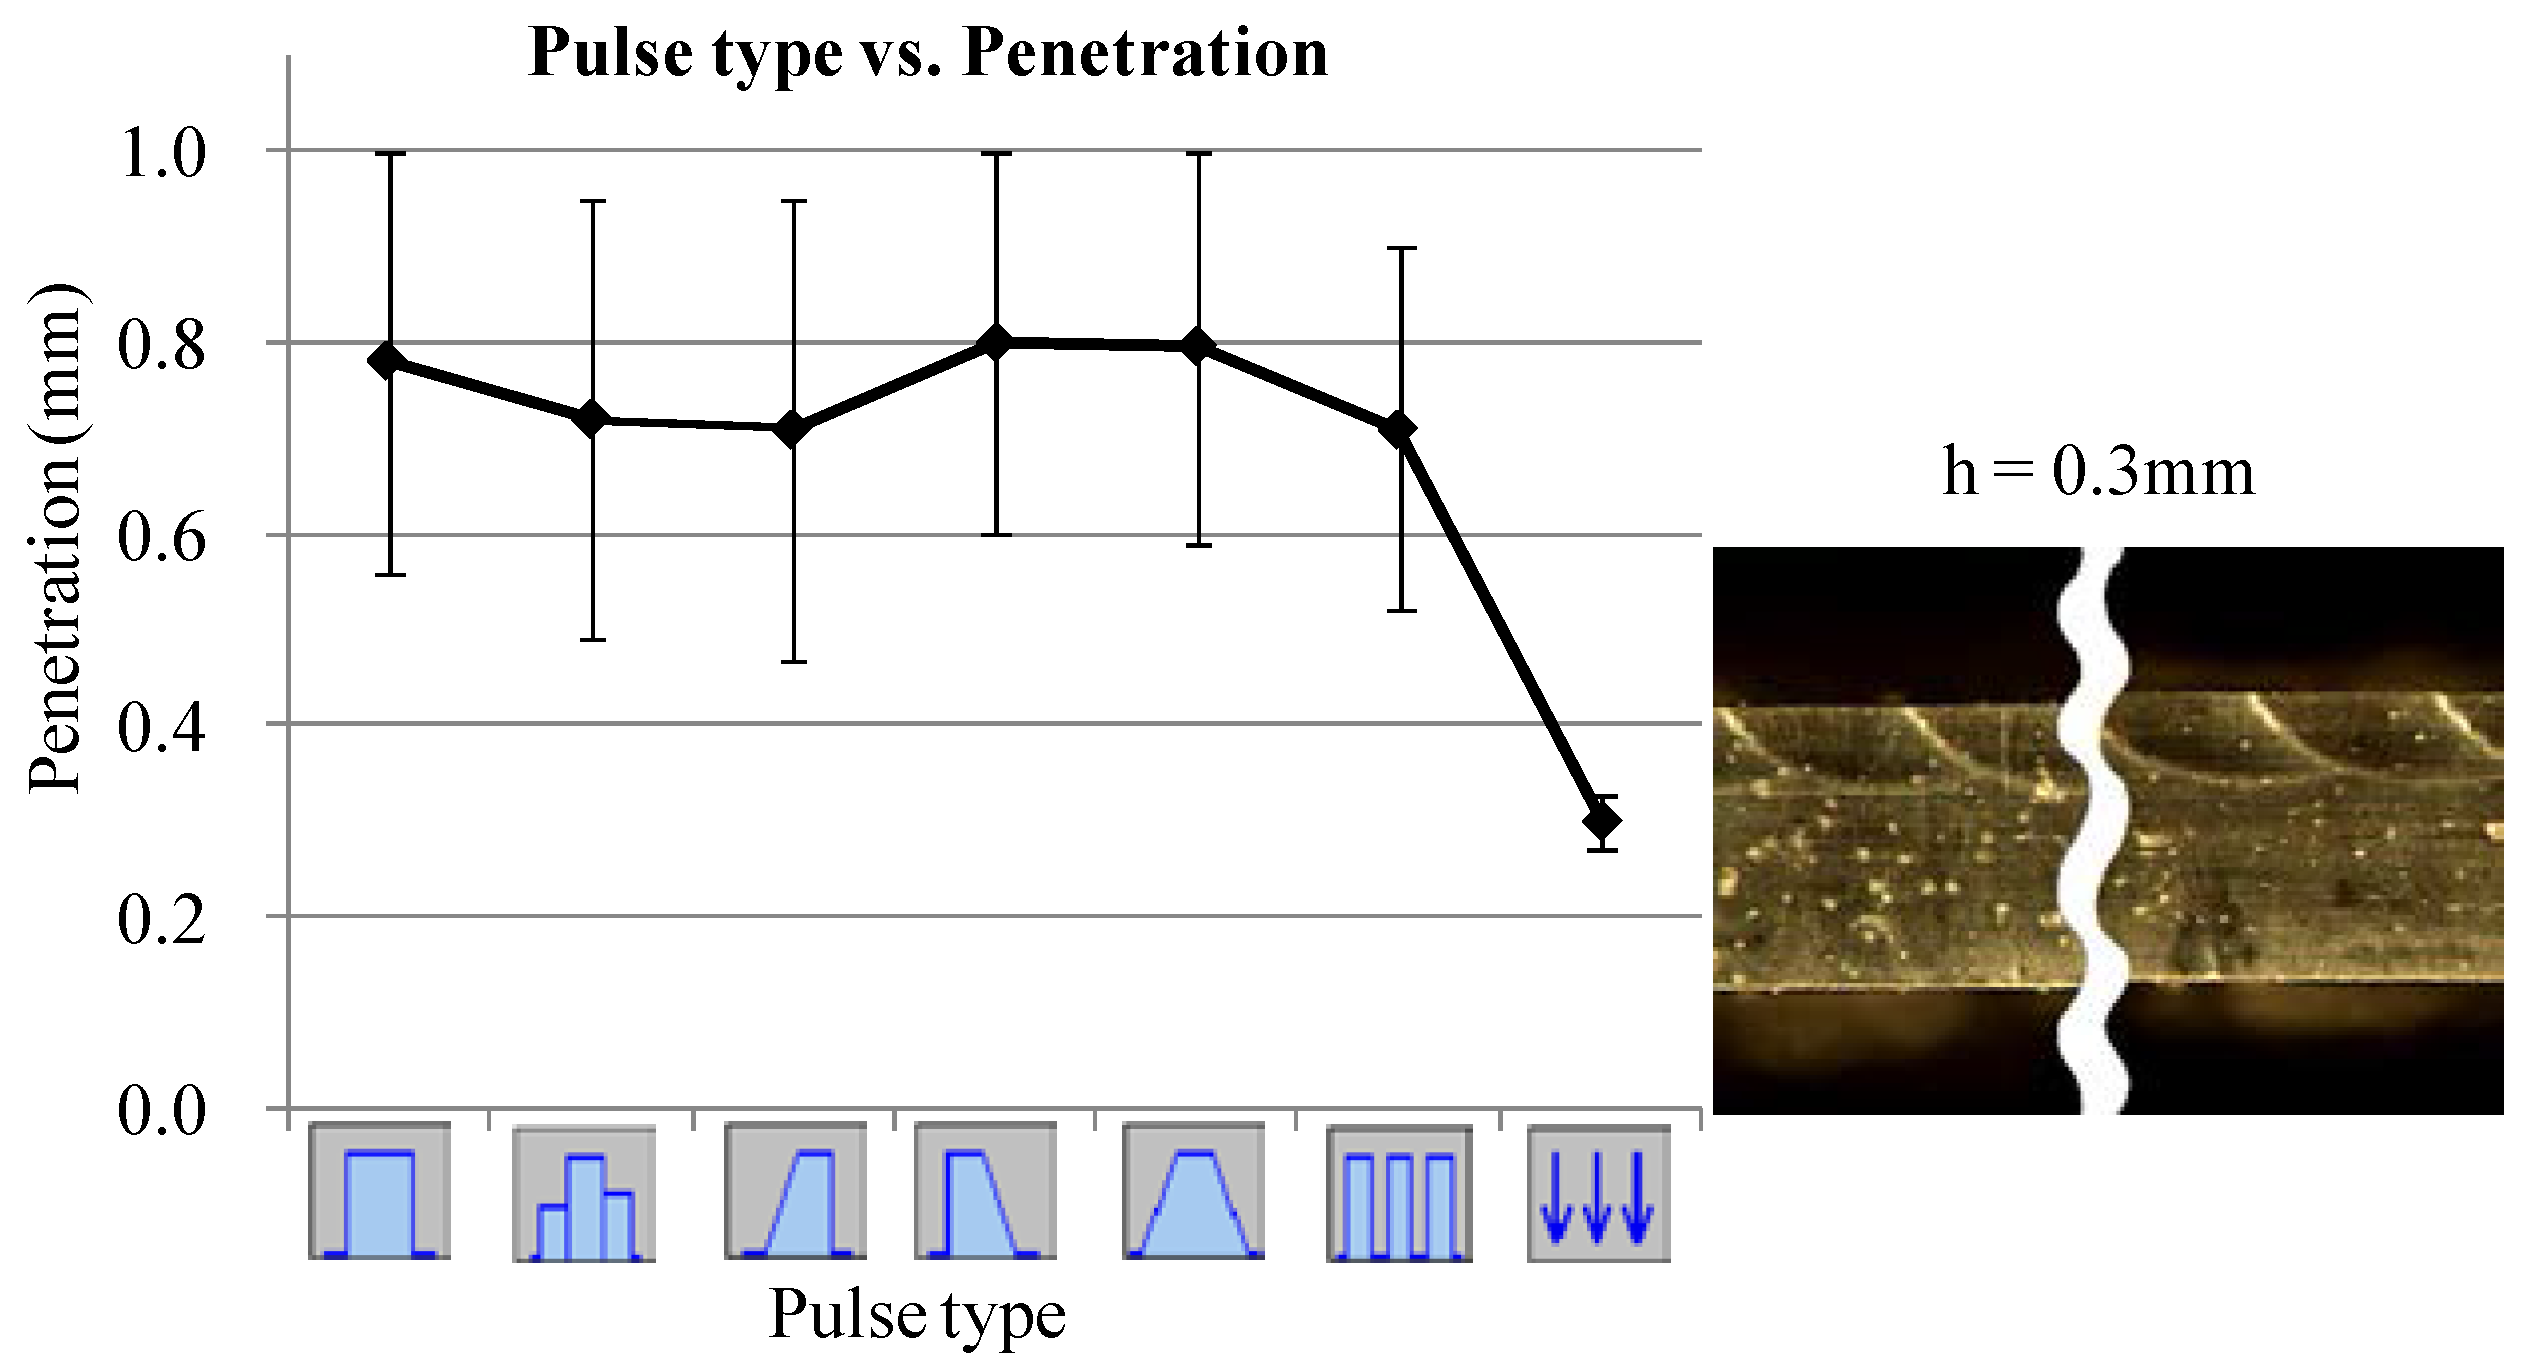
5.1.5. Effects of Pulse Type on Penetration

Figure 14 compares the effects of seven different pulse types on weld penetration. It indicates that the pulse type has no significant effect on penetration, with the exception of the last type, namely scale expanded pulse. This special pulse type results in a low penetration (Height h = 0.3 mm) compared to the others (between 0.5 mm and 1.0 mm). This is because the pulse with simple power is divided to be better resolution at low power. However, this kind of pulse maintains a penetration that is virtually constant throughout the cord. It should be noted that the “scale expanded” pulse is used mainly as heat treatment.

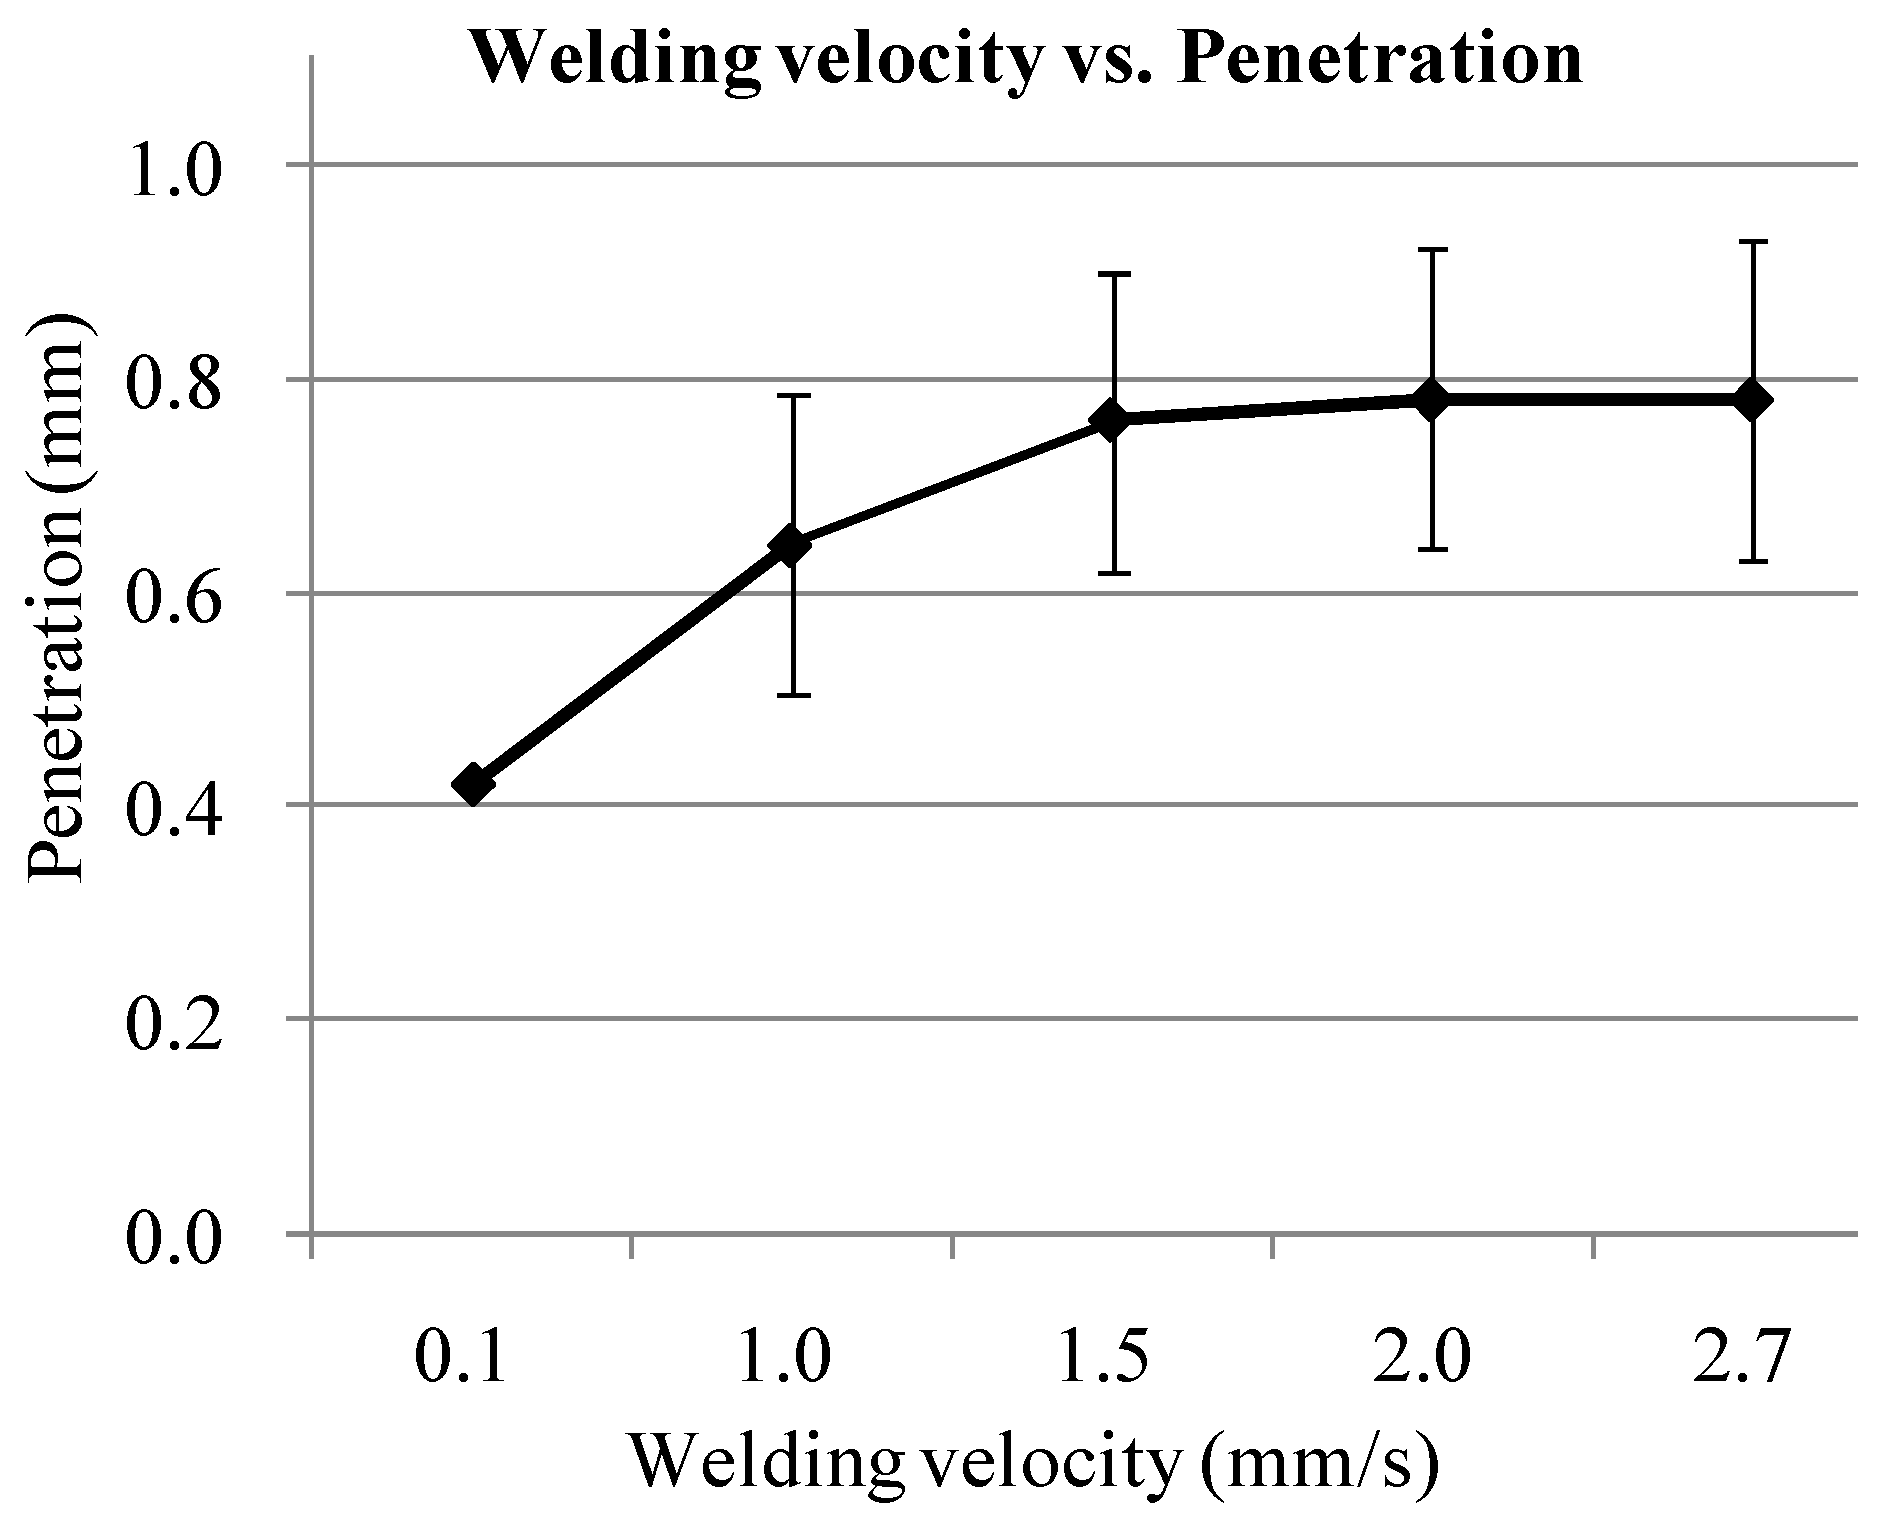
5.1.6. Effects of Welding Velocity on Weld Penetration

As shown in Figure 15, the penetration seems to be directly influenced by the welding velocity: The higher the welding velocity, the deeper the weld penetration. In the case of DP1000 laser beam welding, weld penetration has an obvious increase for the low bound of the acceptable welding velocity that the welding velocities are less than 1.5 mm/s. The relationship between welding velocity and penetration may be explained as follows: The greater the welding speed, the less time the material has to cool, so the temperature of the material increases until the end of the weld. The fusion material becomes “softer” and facilitates the penetration of the laser beam, especially for a thin sheet. In addition, the cycle of heating and cooling makes a different change in the microstructure of the material, e.g., causing an increase in the hardness of the material, hindering further penetration.

5.1.7. ANOVA for Quadratic Model of Weld Penetration

According to the design of experiments for welding parameters listed in Table 3, the second-order polynomial (regression) equation used to represent the response surface R ^ ( x ) is given by:
R ^ ( x ) = β 0 + i = 1 n β i x i + i = 1 n β i i x i 2 + i j > 1 β i j x i x j + η ,
where β is the polynomial coefficient, η is the minor error, and n is the number of design variables (six factors in this work). Statistical testing of the empirical models has been done by Fisher’s statistical test for Analysis of Variance—ANOVA. Table A7 shows that the ANOVA tests applied to the individual coefficients in the model are significant. The F-value is the ratio of the mean square due to regression to the mean square due to residual. The Model F-value of weld penetration response is 12.94, which implies that the models are significant. There is only 0.36% chance in the weld penetration response model that the “Model F-Value” could occur due to noise. The determination coefficient of the regression analysis results is R2 = 0.966, indicating a high degree of correlation between the experimental values and empirical calculated values obtained from the response models.

5.2. Effects of Laser Parameters on Hardness and Its Microstructure Observation

In order to evaluate the microstructure evolution of the material before and after laser beam welding, one of the optimal welding parameters, as listed in Table 4, can be obtained through the above experimental sensitivity analyses. The tested sample had full penetration with almost no oxidation and spatter on both top and bottom surfaces. Figure 16 shows the weld surfaces of fusion zone using these optimal parameters.

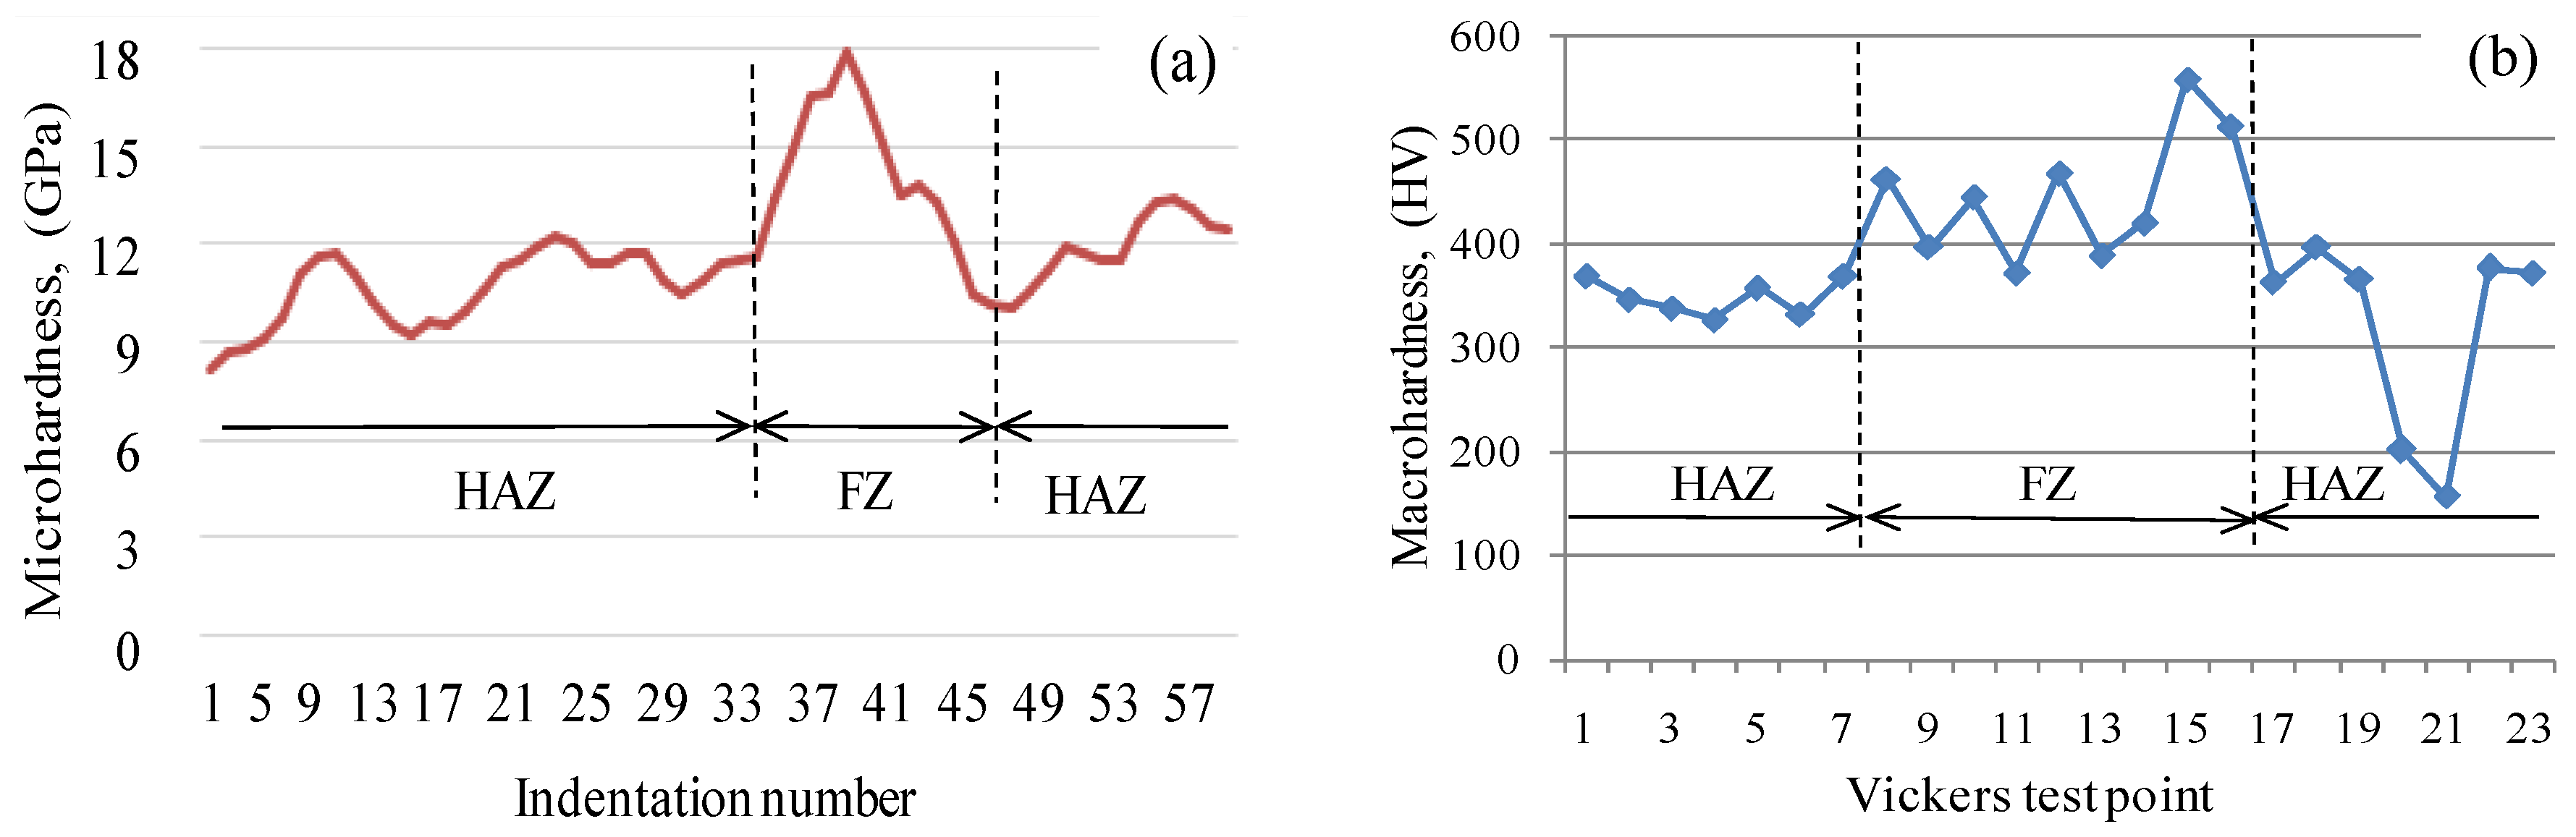
5.2.1. Microscopic and Macroscopic Hardness

The hardness is considered an important indicator of welded joint properties and performance. Too much hardness inside the fusion and the heat-affected zones require higher pre-heat temperatures, slower cooling, and more complicated hydrogen controlled welding procedures [16]. The laser Nd:YAG process gives higher hardness values compared to other processes [20]. Thus, the mechanism of formation of softening zones HAZ and fusion zone (FZ) of the welded joint should account for the high capability of the welds. In this work, the metallurgical properties of the welded joint of DP1000, including the variations of microscopic and macroscopic hardness of FZ and HAZ under optimal welding parameters, are observed experimentally. According to Taylor et al. [31], the microscopic and macroscopic hardness can be transformed into the same unit for comparison, as listed in Table 5.
Figure 17 shows the micro-indentation hardness distribution and measured macroscopic hardness of laser welded DP1000 steel butt joints. The fusion zone (FZ) of welded joints shows higher hardness than the base metal and HAZ of butt joints. Table 5 shows that the hardness in the HAZ is lower compared to the base metal. The previous study indicates that the soft zone in the HAZ of the dual-phase butt joints is caused by the tempering of pre-existing martensite [20].

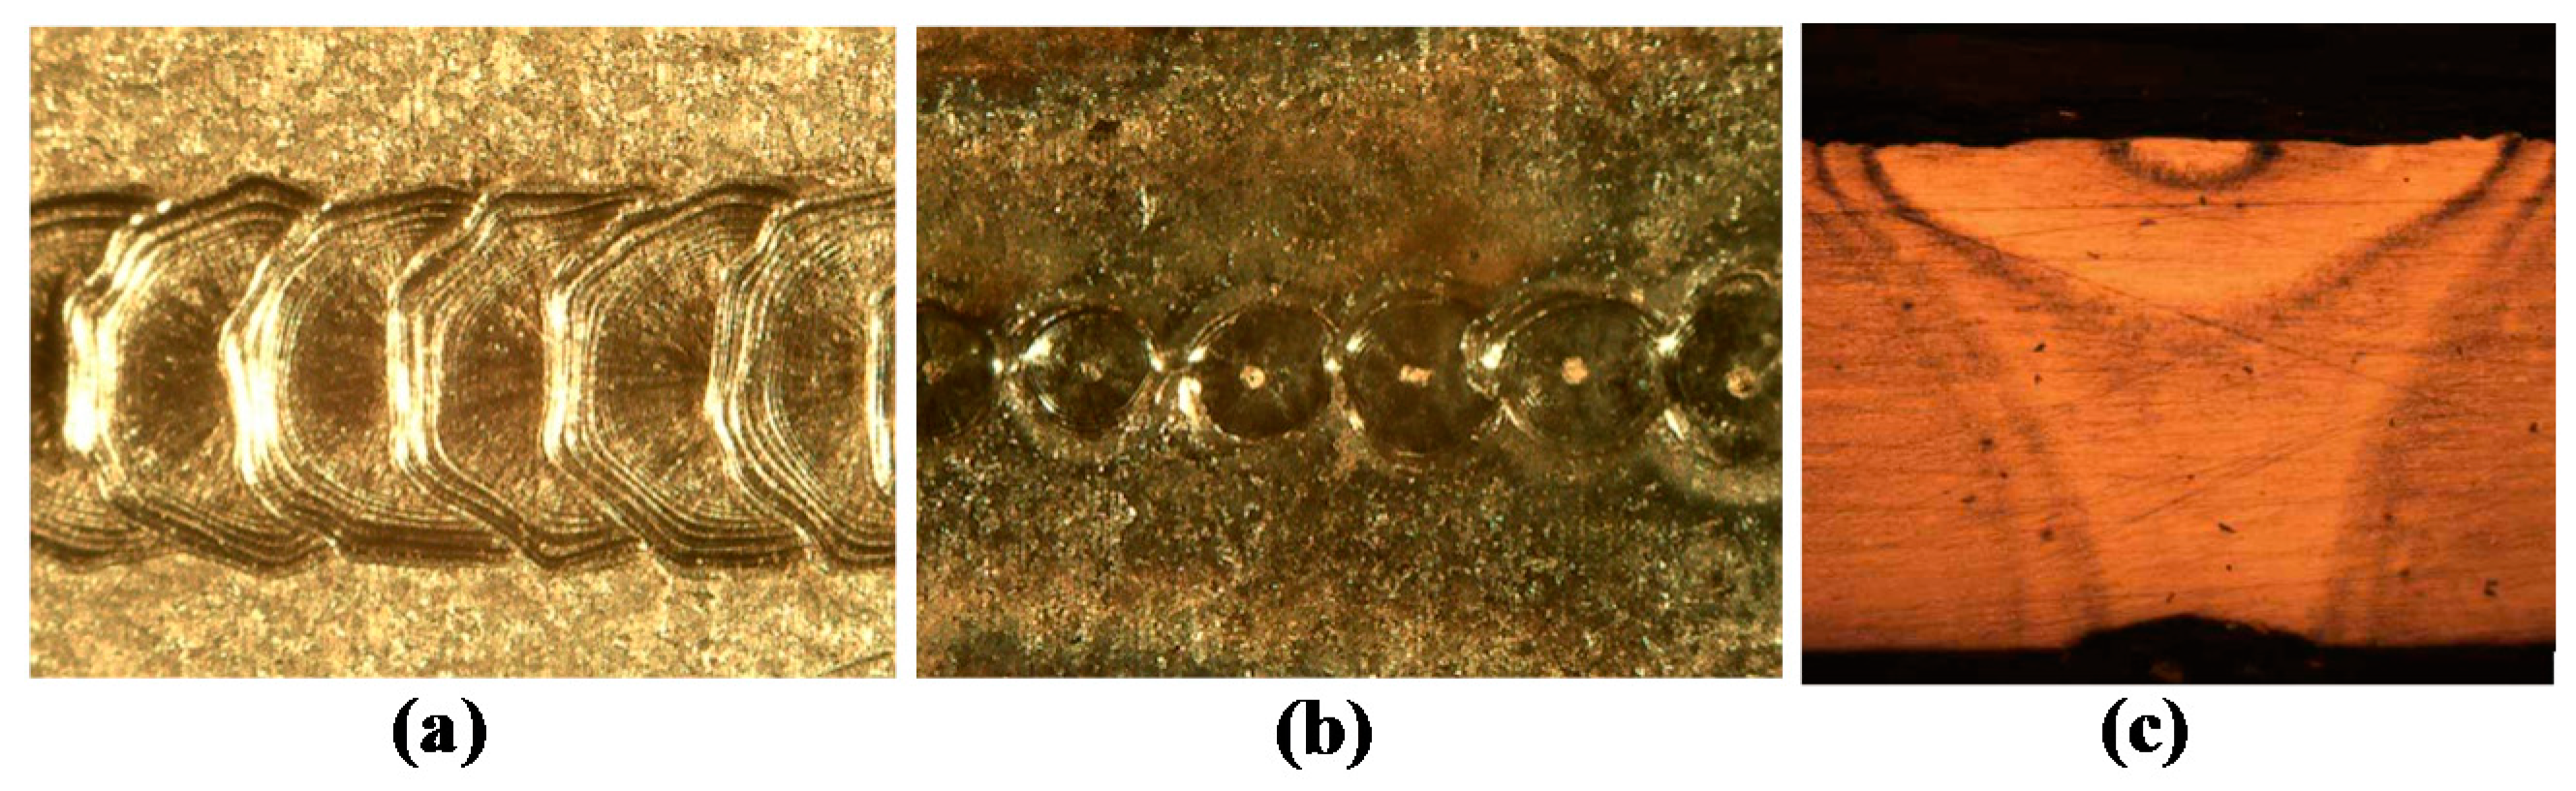
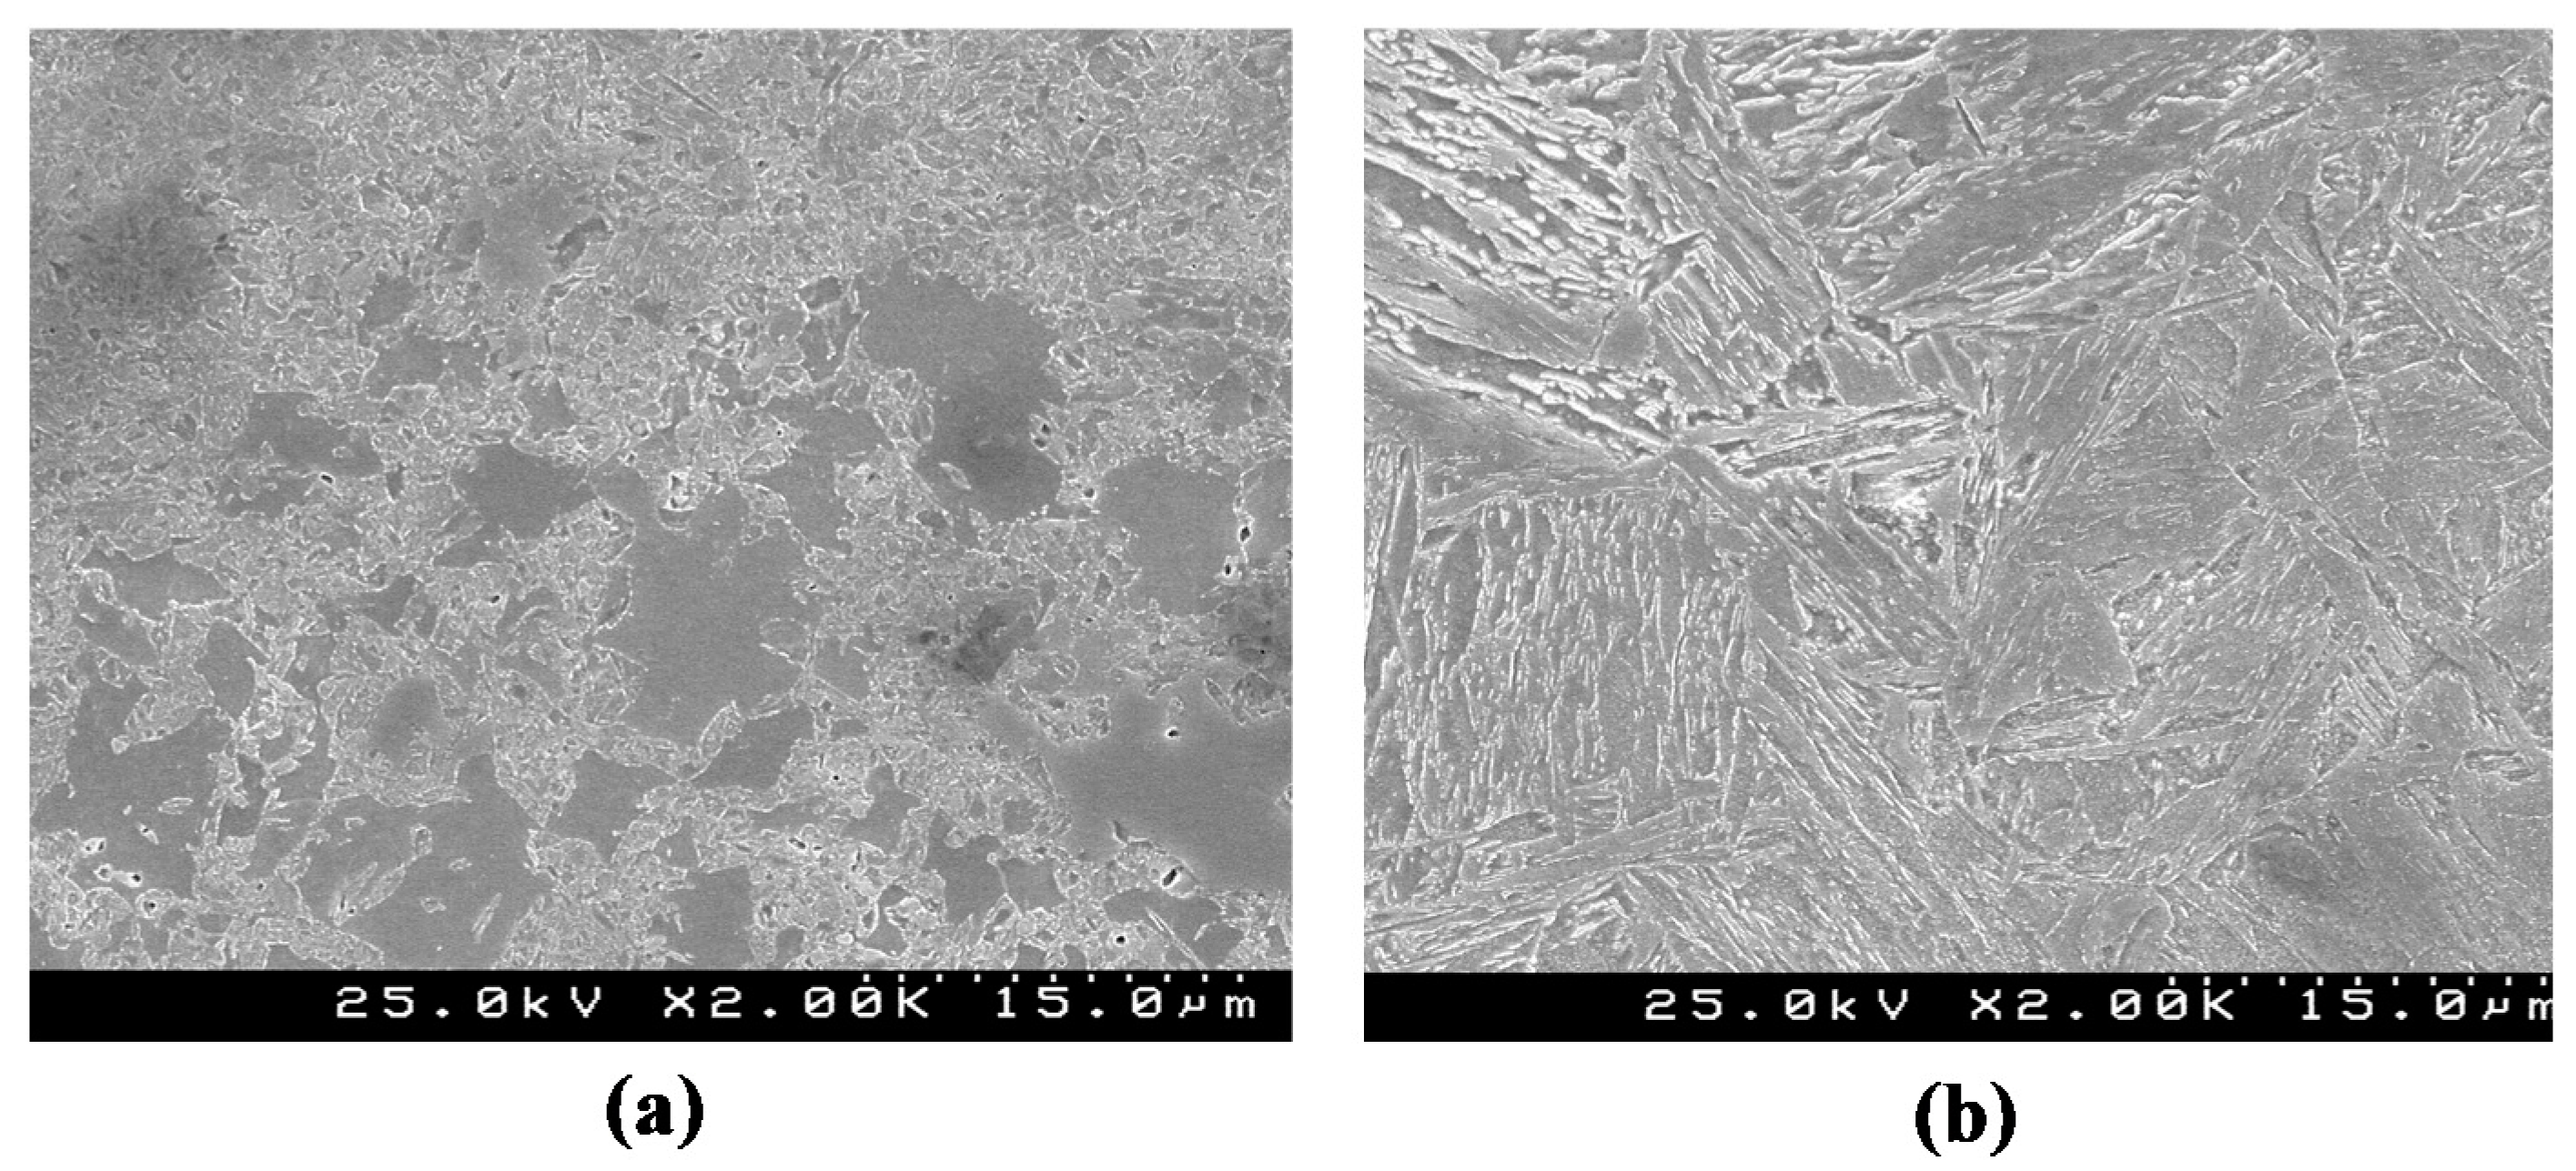
5.2.2. Microstructure Characterization of Nd:YAG Laser Welded Joint

The SEM examinations of HAZ and FZ regions, as shown in Figure 18, indicate that the microstructure of DP1000 steel butt joints in FZ region is martensitic together with a few encompassing ferrite and bainite molecules. The changeable hardness in the FZ of DP1000 butt joints reveals the existence of a so-called multiple-ingredient microstructure. The quick-cooling process of the weld butt pool during the laser welding should lead to the production of martensite in the FZ region. Thus, the martensite volume fraction of dual-phase steels should play a considerable effect on the change of microstructure characterization during the laser beam welding.
This may be explained as follows: Firstly, the peak temperature experienced in the soft zone during laser beam welding seems to result in a partial disappearance of pre-existent martensite. It is likely that the peak temperature in the soft zone can be high enough to stimulate partial martensite-to-austenite solid state transformation. Meanwhile, the subsequent cooling phase might not provide a trigger of the backward austenite-to-martensite solid state transformation, or full martensite-to-austenite transformation in the heating phase and partial austenite-to martensite transformation in the cooling phase, or both partial transformations in the heating and cooling phases during the welding thermal cycle. Actually, the occurrence of the microstructure change depends on the location within the welded joint, in terms of the complexity of the temperature field changes. Secondly, if there was no occurrence of the abovementioned solid-state phase transformations, the presence of a higher amount of martensite in the DP steels might cause greater tempering of pre-existing martensite in the HAZ, giving rise to more severe softening in this material.

6. Conclusions

The pulsed Nd:YAG laser beam welding of dual-phase DP1000 steel is addressed using theoretical and experimental methods. Some key experimental technologies, including cutting surface preparation for pre-welding sample and optimization design of welding sample fixture for a sufficiently shielding gas flow, are performed to ensure consistent and stable testing. For a better understanding of the interaction between weld quality and process parameters, a parameter-dependent theory is introduced. The main conclusions are as follows.
  • The ideal laser beam power for welding in the studied case should be between 40% and 60% with a sharp rise. However, the sensitivity of the weld penetration to the greater than 60% laser beam power becomes less pronounced.
  • The greater the pulse duration, the deeper the weld penetration.
  • The overlap seems not to affect the weld penetration, but only up to the value of 80%.
  • The weld penetration has a sharp decrease when the applied spot diameter increases from 1.2 mm to 1.4 mm.
  • The pulse type has no significant effect on penetration, with the exception of the scale expanded pulse.
  • The penetration seems to be directly influenced by the welding velocity, i.e., the higher the welding velocity, the deeper the weld penetration.
  • The ANOVA tests applied to the individual coefficients in the regression model show that the Model F-value of weld penetration response is 12.94, which implies that the models are significant. The determination coefficient of the regression analysis results indicates that a high degree of correlation between the experimental values and empirical calculated values is obtained from the models.

Acknowledgments

The authors would like to thank Engineer António Festos for support concerning the experimental tool machining. This work was funded by the Portuguese Foundation of Science and Technology (UID/EMS/00481/2013 and SFRH/BPD/114823/2016 and CENTRO-01-0145-FEDER-022083) and the Scientific Program of Fuzhou University (0020-650421 and 0020-650425).

Author Contributions

António B. Pereira and José Amorim conceived and designed the experiments; José Amorim performed the experiments; Xin Xue and José Amorim analyzed the data; Juan Liao and António B. Pereira contributed reagents/materials/analysis tools; Xin Xue, José Amorim, and Juan Liao wrote the paper.

Conflicts of Interest

The authors declare no conflict of interest.

Appendix A

The detailed design of experiments on the effects of each analyzed welding parameter on weld penetration are presented in this section.
Table A1. Experimental plan for the effects of laser beam power on weld penetration.
SeriesPower (%)Duration (ms)Overlap (%)Diameter (mm)Pulse TypeEnergy (J)Velocity (mm/s)Max. Velocity (mm/s)
A120----24.0-6.3
A24043.53.5
A36066.12.2
A48091.61.6
A586100.01.4
Table A2. Experimental plan for the effects of pulse duration on weld penetration.
SeriesPower (%)Duration (ms)Overlap (%)Diameter (mm)Pulse TypeEnergy (J)Velocity (mm/s)Max. Velocity (mm/s)
B1500.3501.3Simple rectangular1.31.410
B2313.010
B3626.15.8
B4939.13.9
B51252.22.9
B61565.22.3
B71878.31.9
B82191.31.6
B923100.01.4
Table A3. Experimental plan for the effects of overlap on weld penetration.
SeriesPower (%)Duration (ms)Overlap (%)Diameter (mm)Pulse TypeEnergy (J)Velocity (mm/s)Max. Velocity (mm/s)
C15012.501.3Simple rectangular54.30.25.5
C2204.4
C3403.3
C4602.2
C5801.1
C6950.2
Table A4. Experimental plan for the effects of spot laser diameter on weld penetration.
SeriesPower (%)Duration (ms)Overlap (%)Diameter (mm)Pulse TypeEnergy (J)Velocity (mm/s)Max. Velocity (mm/s)
D15012.5500.6Simple rectangular54.31.21.2
D20.81.7
D31.02.1
D41.22.5
D51.43.0
D61.63.4
D71.83.8
D82.04.3
Table A5. Experimental plan for the effects of pulse type on weld penetration.
SeriesPower (%)Duration (ms)Overlap (%)Diameter (mm)Pulse TypeEnergy (J)Velocity (mm/s)Max. Velocity (mm/s)
E15012.5501.3 Metals 07 00292 i00254.32.62.7
E2 Metals 07 00292 i00354.52.7
E3 Metals 07 00292 i00459.02.6
E4 Metals 07 00292 i00559.02.6
E5 Metals 07 00292 i00656.92.6
E6 Metals 07 00292 i00753.42.8
E7 Metals 07 00292 i00828.55.3
Table A6. Experimental plan for the effects of velocity on weld penetration.
SeriesPower (%)Duration (ms)Overlap (%)Diameter (mm)Pulse TypeEnergy (J)Velocity (mm/s)Max. Velocity (mm/s)
F15012.5501.3Simple rectangular54.30.12.7
F21.0
F31.5
F42.0
F52.7
Table A7. ANOVA for quadratic model of weld penetration.
SourceSSDFMSF-Valuep-ValueEvaluation
Model1.446140.1312.940.0036Significant
A0.11510.1210.370.0181-
B0.01010.0100.880.3839
C0.37910.37934.130.0011
D0.01410.0141.300.2976
E0.00310.0031.020.3505
F0.00810.0082.590.1587
AB0.07410.0746.650.0419
AC0.13810.13812.400.0125
AD0.00310.0030.280.6188
AE0.06010.0605.360.0599
AF0.04510.0454.020.0919
BC0.09910.0998.910.0245
BD0.07310.07323.420.0029
BE0.02010.0206.480.0437
BF0.06510.06520.660.0039
CD0.07910.07925.350.0024
CE0.04010.04012.730.0118
CF0.00910.0092.810.1447
DE0.00710.0072.400.1724
DF0.01910.0195.930.0508
EF0.15410.15449.400.0004
A20.00110.0010.090.7744
B20.00110.0010.050.8341
C20.01310.0131.130.3293
D20.00210.0020.170.6938
E20.08010.08025.610.0023
F20.00710.0072.300.1798
Residual0.06760.011--
Total1.51220---
R2 = 0.966; SS—sum of square; DF—degree of freedom; MS—mean square.

References

  1. Rossinia, M.; Spena, P.R.; Cortese, L.; Matteis, P.; Firrao, D. Investigation on dissimilar laser welding of advanced high strength steel sheets for the automotive industry. Mater. Sci. Eng. A 2014, 628, 288–296. [Google Scholar] [CrossRef]
  2. Blacha, S.; Weglowski, M.S.T.; Dymek, S.; Kopuscianski, M. Microstructural characterization and mechanical properties of electron beam welded joint of high strength grade S690QL. Arch. Metall. Mater. 2016, 61, 1193–1200. [Google Scholar] [CrossRef]
  3. Grouve, W.J.B.; Warnet, L.; Akkerman, R.; Wijskamp, S.; Kok, J.S.M. Weld strength assessment for tape placement. Int. J. Mater. Form. 2010, 3, 707–710. [Google Scholar] [CrossRef]
  4. Hernandez, V.H.B.; Panda, S.K.; Kuntz, M.L.; Zhou, Y. Nanoindentation and microstructure analysis of resistance spot welded dual phase steel. Mater. Lett. 2010, 64, 207–210. [Google Scholar] [CrossRef]
  5. Ramazani, A.; Mukherjee, K.; Abdurakhmanov, A.; Abbasi, M.; Prahl, U. Characterization of microstructure and mechanical properties of resistance spot welded DP600 Steel. Metals 2015, 5, 1704–1716. [Google Scholar] [CrossRef] [Green Version]
  6. Huang, Y.M.; Wu, D.; Zhang, Z.F.; Chen, H.B.; Chen, S.B. EMD-based pulsed TIG welding process porosity defect detection and defect diagnosis using GA-SVM. J. Mater. Process. Technol. 2017, 239, 92–102. [Google Scholar] [CrossRef]
  7. Narwadkar, A.; Bhosle, S. Optimization of MIG welding parameters to control the angular distortion in Fe410WA Steel. Mater. Manuf. Process. 2015, 31, 2158–2164. [Google Scholar] [CrossRef]
  8. Ahmadzadeh, M.; Farshi, B.; Salimi, H.R.; Fard, A.H. Residual stresses due to gas arc welding of aluminum alloy joints by numerical simulations. Int. J. Mater. Form. 2013, 6, 233–247. [Google Scholar] [CrossRef]
  9. Ramazani, A.; Mukherjee, K.; Abdurakhmanov, A.; Prahl, U.; Schleser, M.; Reisgen, U.; Bleck, M. Micro-macro-characterisation and modelling of mechanical properties of gas metal arc welded (GMAW) DP600 steel. Mater. Sci. Eng. A 2014, 589, 1–14. [Google Scholar] [CrossRef]
  10. Mei, L.F.; Chen, G.Y.; Jin, X.Z.; Zhang, Y.; Wu, Q. Research on laser welding of high-strength galvanized automobile steel sheets. Opt. Lasers Eng. 2009, 47, 1117–1124. [Google Scholar] [CrossRef]
  11. Sharma, R.S.; Molian, P. Yb:YAG laser welding of TRIP780 steel with dual phase and mild steels for use in tailor welded blanks. Mater. Des. 2009, 30, 4146–4155. [Google Scholar] [CrossRef]
  12. Xu, W.; Westerbaan, D.; Nayak, S.S.; Chen, D.L.; Goodwin, F.; Zhou, Y. Tensile and fatigue properties of fiber laser welded high strength low alloy and DP980 dual-phase steel joints. Mater. Des. 2013, 43, 373–383. [Google Scholar] [CrossRef]
  13. Ghaini, F.M.; Hamedi, M.J.; Torkamany, M.J.; Sabbaghzadeh, J. Weld metal microstructural characteristics in pulsed Nd:YAG laser welding. Scr. Mater. 2007, 56, 955–958. [Google Scholar]
  14. Mahamood, R.M.; Akinlabi, E.T. Scanning speed and powder flow rate influence on the properties of laser metal deposition of titanium alloy. Int. J. Adv. Manuf. Technol. 2017, in press. [Google Scholar] [CrossRef]
  15. Hazratinezhad, M.; Arab, N.B.M.; Sufizadeh, A.R.; Torkamany, M.J. Mechanical and metallurgical properties of pulsed neodymium-doped yttrium aluminum garnet laser welding of dual phase steels. Mater. Des. 2012, 33, 83–87. [Google Scholar] [CrossRef]
  16. Mirakhorli, F.; Malek Ghaini, F.; Torkamany, M.J. Development of weld metal microstructures in pulsed laser welding of duplex stainless steel. J. Mater. Eng. Perform. 2012, 21, 2173–2176. [Google Scholar] [CrossRef]
  17. Seang, C.; David, A.K.; Ragneau, E. Effect of Nd:YAG laser welding parameters on the hardness of lap joint: Experimental and numerical approach. Phys. Proc. 2013, 41, 38–40. [Google Scholar] [CrossRef]
  18. Sun, Q.; Di, H.S.; Li, J.C.; Wang, X.N. Effect of pulse frequency on microstructure and properties of welded joints for dual phase steel by pulsed laser welding. Mater. Des. 2016, 105, 201–211. [Google Scholar] [CrossRef]
  19. Wang, J.F.; Yang, L.J.; Sun, M.S.; Liu, T.; Li, H. A study of the softening mechanisms of laser-welded DP1000 steel butt joints. Mater. Des. 2016, 97, 118–125. [Google Scholar] [CrossRef]
  20. Tzeng, Y.F. Effects of operating parameters on surface quality for the pulsed laser welding of zinc-coated steel. J. Mater. Process. Technol. 2000, 100, 163–170. [Google Scholar] [CrossRef]
  21. Xia, M.S.; Biro, E. Effects of heat input and martensite on HAZ softening in laser welding of dual phase steels. ISIJ Int. 2008, 48, 809–814. [Google Scholar] [CrossRef]
  22. Dong, D.Y.; Liu, Y.; Yang, Y.L.; Li, J.F.; Ma, M.; Jiang, T. Microstructure and dynamic tensile behavior of DP600 dual phase steel joint by laser welding. Mater. Sci. Eng. A 2014, 594, 17–25. [Google Scholar] [CrossRef]
  23. Baghjari, S.H.; Akbari Mousavi, S.A.A. Effects of pulsed Nd:YAG laser welding parameters and subsequent post-weld heat treatment on microstructure and hardness of AISI 420 stainless steel. Mater. Des. 2013, 43, 1–9. [Google Scholar] [CrossRef]
  24. Farabia, N.; Chen, D.L.; Zhou, Y. Microstructure and mechanical properties of laser welded dissimilar DP600/DP980 dual-phase steel joints. J. Alloys Compd. 2011, 509, 982–989. [Google Scholar] [CrossRef]
  25. Lee, J.H.; Park, S.H.; Kwon, H.S.; Kim, G.S.; Lee, C.S. Laser, tungsten inert gas, and metal active gas welding of DP780 steel: Comparison of hardness, tensile properties and fatigue resistance. Mater. Des. 2014, 64, 559–565. [Google Scholar] [CrossRef]
  26. Reisgen, U.; Schleser, M.; Mokrov, O.; Ahmed, E. Shielding gas influences on laser weldability of tailored blanks of advanced automotive steels. Appl. Surf. Sci. 2010, 257, 1401–1406. [Google Scholar] [CrossRef]
  27. Schemmann, L.; Zaefferer, S.; Raabe, D.; Friedel, F.; Mattissen, D. Alloying effects on microstructure formation of dual phase steels. Acta Mater. 2015, 95, 386–398. [Google Scholar] [CrossRef]
  28. Wang, X.N.; Chen, C.J.; Wang, H.S.; Zhang, S.H.; Zhang, M.; Luo, X. Microstructure formation and precipitation in laser welding of microalloyed C-Mn steel. J. Mater. Process. Technol. 2015, 226, 106–114. [Google Scholar] [CrossRef]
  29. Liao, J.; Sousa, J.A.; Lopes, A.B.; Xue, X.; Barlat, F.; Pereira, A.B. Mechanical, microstructural behaviour and modelling of dual phase steels under complex deformation paths. Int. J. Plast. 2017, 93, 269–290. [Google Scholar] [CrossRef]
  30. Xue, X.; Liao, J.; Vincze, G.; Pereira, A.B.; Barlat, F. Experimental assessment of nonlinear elastic behaviour of dual-phase steels and application to springback prediction. Int. J. Mech. Sci. 2016, 117, 1–15. [Google Scholar] [CrossRef]
  31. ARAMIS—3D Motion and Deformation Sensor. Available online: http://www.gom.com/metrology-systems/aramis.html (accessed on 30 July 2017).
  32. Tasan, C.C.; Diehl, M.; Yan, D.; Zambaldi, C.; Shanthraj, P.; Roters, F.; Raabe, D. Integrated experimental-simulation analysis of stress and strain partitioning in multiphase alloys. Acta Mater. 2014, 81, 386–400. [Google Scholar] [CrossRef]
  33. Ghadbeigi, H.; Pinna, C.; Celotto, S. Quantitative strain analysis of the large deformation at the scale of microstructure: Comparison between digital image correlation and micro grid techniques. Exp. Mech. 2012, 52, 1483–1492. [Google Scholar] [CrossRef]
  34. Alharbi, K.; Ghadbeigi, H.; Efthymiadis, P.; Zanganeh, M.; Celotto, S.; Dashwood, R.; Pinna, C. Damage in dual phase steel DP1000 investigated using digital image correlation and microstructure simulation. Model. Simul. Mater. Sci. 2015, 23, 085005. [Google Scholar] [CrossRef]
  35. Duley, W.W. Laser Welding; John Wiley & Sons: Hoboken, NJ, USA, 1998; ISBN 978-0-471-24679-4. [Google Scholar]
Figure 1. Microstructure observation of dual-phase DP1000 steel used.
Metals 07 00292 g001
Figure 2. Illustration of a typical cross-sectional surface cut by guillotine and the anomalistic gap at the pre-welding inspection.
Metals 07 00292 g002
Figure 3. Cutting surface preparation for pre-welding inspection by using computer numerical control (CNC).
Metals 07 00292 g003
Figure 4. Experimental apparatus of pulsed Nd:YAG laser welding.
Metals 07 00292 g004
Figure 5. Design of welding sample fixture.
Metals 07 00292 g005
Figure 6. Optimization design of assisted gas flow solution with two-hole inlet structure.
Metals 07 00292 g006
Figure 7. Comparison of welding top surface quality with different assisted gas inlet structures.
Metals 07 00292 g007
Figure 8. Comparison of weld surfaces under different laser beam powers.
Metals 07 00292 g008
Figure 9. The effects of laser beam power on penetration.
Metals 07 00292 g009
Figure 10. The effects of pulse duration on weld penetration.
Metals 07 00292 g010
Figure 11. Effects of overlap on weld penetration.
Metals 07 00292 g011
Figure 12. Effects of spot laser diameter on weld penetration.
Metals 07 00292 g012
Figure 13. Comparison of weld surfaces under different spot diameters.
Metals 07 00292 g013
Figure 14. Effects of pulse type on weld penetration.
Metals 07 00292 g014
Figure 15. Effects of welding velocity on penetration.
Metals 07 00292 g015
Figure 16. Weld surfaces of fusion zone using the optimal parameters: (a) Top surface (15×); (b) bottom surface (15×); (c) perpendicular longitudinal section.
Metals 07 00292 g016
Figure 17. (a) Micro-indentation hardness; (b) measured macroscopic hardness (HAZ: Heat-affected zone; FZ: Fusion zone).
Metals 07 00292 g017
Figure 18. SEM micrographs showing the microstructure change of laser welded DP1000 steel butt joints: (a) HAZ; (b) FZ.
Metals 07 00292 g018
Table 1. Chemical composition of the studied DP 1000 steel in wt %.
CSiMnPSNCrNiCuAlVBNbCekv
0.140.201.460.0130.0030.0020.030.030.010.0510.010.00040.0140.39
Cekv = C + Mn/6 + (Cr + Mo + V)/5 + (Ni + Cu)/15
Table 2. Basic mechanical properties of the studied DP1000 (RD: Rolling direction).
DirectionElastic Modulus, E (GPa)Poisson’ Ratio υYield Stress σy (MPa)Ultimate Stress σu (MPa)Elongation e (%)Hardness HV0.5
RD2100.377911259.35382
Table 3. Design of experiments for welding parameters.
SeriesParametersVariation of Single Factor
APower percent (%)20, 40, 60, 80, 86
BDuration (ms)0.3, 3, 6, 9, 12, 15, 18, 21, 23
COverlap (%)0, 20, 40, 60, 80, 95
DLaser beam diameter (mm)0.6, 0.8, 1.0, 1.2, 1.4, 1.6, 1.8, 2.0
EPulse type Metals 07 00292 i001
FVelocity (mm/s)0.1, 1.0, 1.5, 2.0, 2.7
Table 4. Optimal welding parameters of DP 1000 steel used.
MaterialPower (%)Pulse Duration (ms)Overlap (%)Diameter (mm)Velocity (mm/s)Energy (J)Pulse Type
DP1000579.0600.60.345Rec.
Table 5. Comparison of average measured hardness.
Material TestedMicro-IndentationVickers
Base DP 1000 steel425 HV (10.7 GPa)382 HV
Heat-affected zone372 HV (9.36 GPa)316 HV
Fusion zone of weld504 HV (14.5 GPa)449 HV

