Article

Investigation on Hot Deformation Behavior and Hot Processing Map of BSTMUF601 Super-Alloy

School of Mechanical Engineering, University of Science and Technology Beijing, Beijing 100083, China
*
Author to whom correspondence should be addressed.
Metals 2016, 6(3), 70; https://doi.org/10.3390/met6030070
Submission received: 23 January 2016 / Revised: 9 March 2016 / Accepted: 15 March 2016 / Published: 19 March 2016
(This article belongs to the Special Issue Superalloys)

Abstract

:
Isothermal compression tests of BSTMUF601 super-alloy in the temperature range of 950 °C–1200 °C and at the strain rates of 0.2 s−1, 5 s−1, 10 s−1 were performed on a Gleeble-1500D thermo-mechanical simulator. Based on the hyperbolic sine function, the unified constitutive equations and hot processing maps during the hot deformation process were established. The flow stress predicted by the constitutive equations shows good agreement with the corrected stress. Hot processing maps for hot working conditions were established based on exploring the effect of power dissipation efficiency and the instability coefficient associated with various kinds of temperatures and stain rates. Subsequently, power dissipation efficiency and the instability coefficient were interpreted based on hot processing maps under a series of strains, temperatures and strain rates. The results show that power dissipation efficiency increases gradually with the increasing temperature and the decreasing stain rate, and instability domains reduce first, then increase with the increase of true strain. The optimum hot working condition of BSTMUF601 super-alloy was obtained.

1. Introduction

The nickel-based super-alloy used for the muffle furnace should provide good mechanical properties, oxidation resistance and especially excellent, high temperature, creep-resistant performance [1]. The BSTMUF601 super-alloy is a nickel-based super-alloy developed independently by Baosteel and applied to produce plates for muffle furnaces, and it possesses great elevated temperature performance at a less expensive cost. Under the working condition, when the temperature is 1095 °C and stress is 12.4 MPa, the steady creep rate of BSTMUF601 super-alloy is 10−6 s−1, which is close to that of Inconel601 super-alloy. The creep rupture strength at the elevated temperature obtained through persistent tensile experiment is at the same level compared with similar foreign materials. Additionally, BSTMUF601 super-alloy has excellent welding performance, and high temperature strength of the welded joints is 100 MPa under 950 °C and the room temperature strength is 630 MPa.
In the past years, research on the BSTMUF601 super-alloy was mainly focused on creep properties and oxidation behavior [2,3]. However, little research has been carried out on investigating the manufacturing technologies for this alloy, especially analyzing the processes to attain a fine and uniform microstructure in a hot-wrought/rolled state. The flow stress is the most basic parameter for characterizing plastic deformation properties of metals and alloys, and it determines the load and energy needed during the plastic deformation [4]. In recent years, the processing map based on the dynamic materials model (DMM) has been considered an important method for optimizing hot working processes and controlling the microstructure in the forming process [5,6]. Based on the processing map, the deformation mechanisms under different deformation conditions can be predicted, and then the deformation temperature and strain rate corresponding to the local peak efficiency of power dissipation are chosen as the optimum processing parameters for the hot working of materials [7,8].
The objective of this paper is to study the hot deformation behavior of BSMUF601 super-alloy based on the results of isothermal compression tests. The processing maps of this alloy are constructed in order to analyze the instability region and optimize the hot working parameters.

2. Materials and Methods

An experimental BSTMUF601 super-alloy was melted in vacuum in an electro-slag furnace (Baosteel special steel, Shanghai, China), and then exposed to solid solution strengthening and hot forging before specimen preparation, which was provided by Baosteel special steel. The chemical composition (wt %) of the BSTMUF601 super-alloy is shown in Table 1. Cylindrical specimens for compression tests (8 mm in diameter and 12 mm in height) were cut and machined from the forged bar. To investigate the effects of the deformation temperature and flow stress, the isothermal compression tests were performed on a Gleeble-1500D thermo-mechanical simulator (Dynamic Systems Inc. Poestenkill, New York, NY, USA) at the temperature range of 950 °C–1200 °C with intervals of 50 °C and at strain rate range of 0.2, 5 and 10 s−1, respectively. A thermocouple was used to monitor and control the temperature of the specimen during testing. Graphite foil pastes were used between the specimens and the plate to minimize the friction during deformation [9].
Considering the actual characteristics of hot working process, to obtain uniform microstructure, each specimen was heated to the testing deformation temperature at a rate of 10 °C/s, and held for 3 min. All the specimens were deformed with the desired deformation strain rate and 50% reduction in height corresponding to a true strain of 0.69, and then quenched to room temperature immediately in water.

3. Results and Discussion

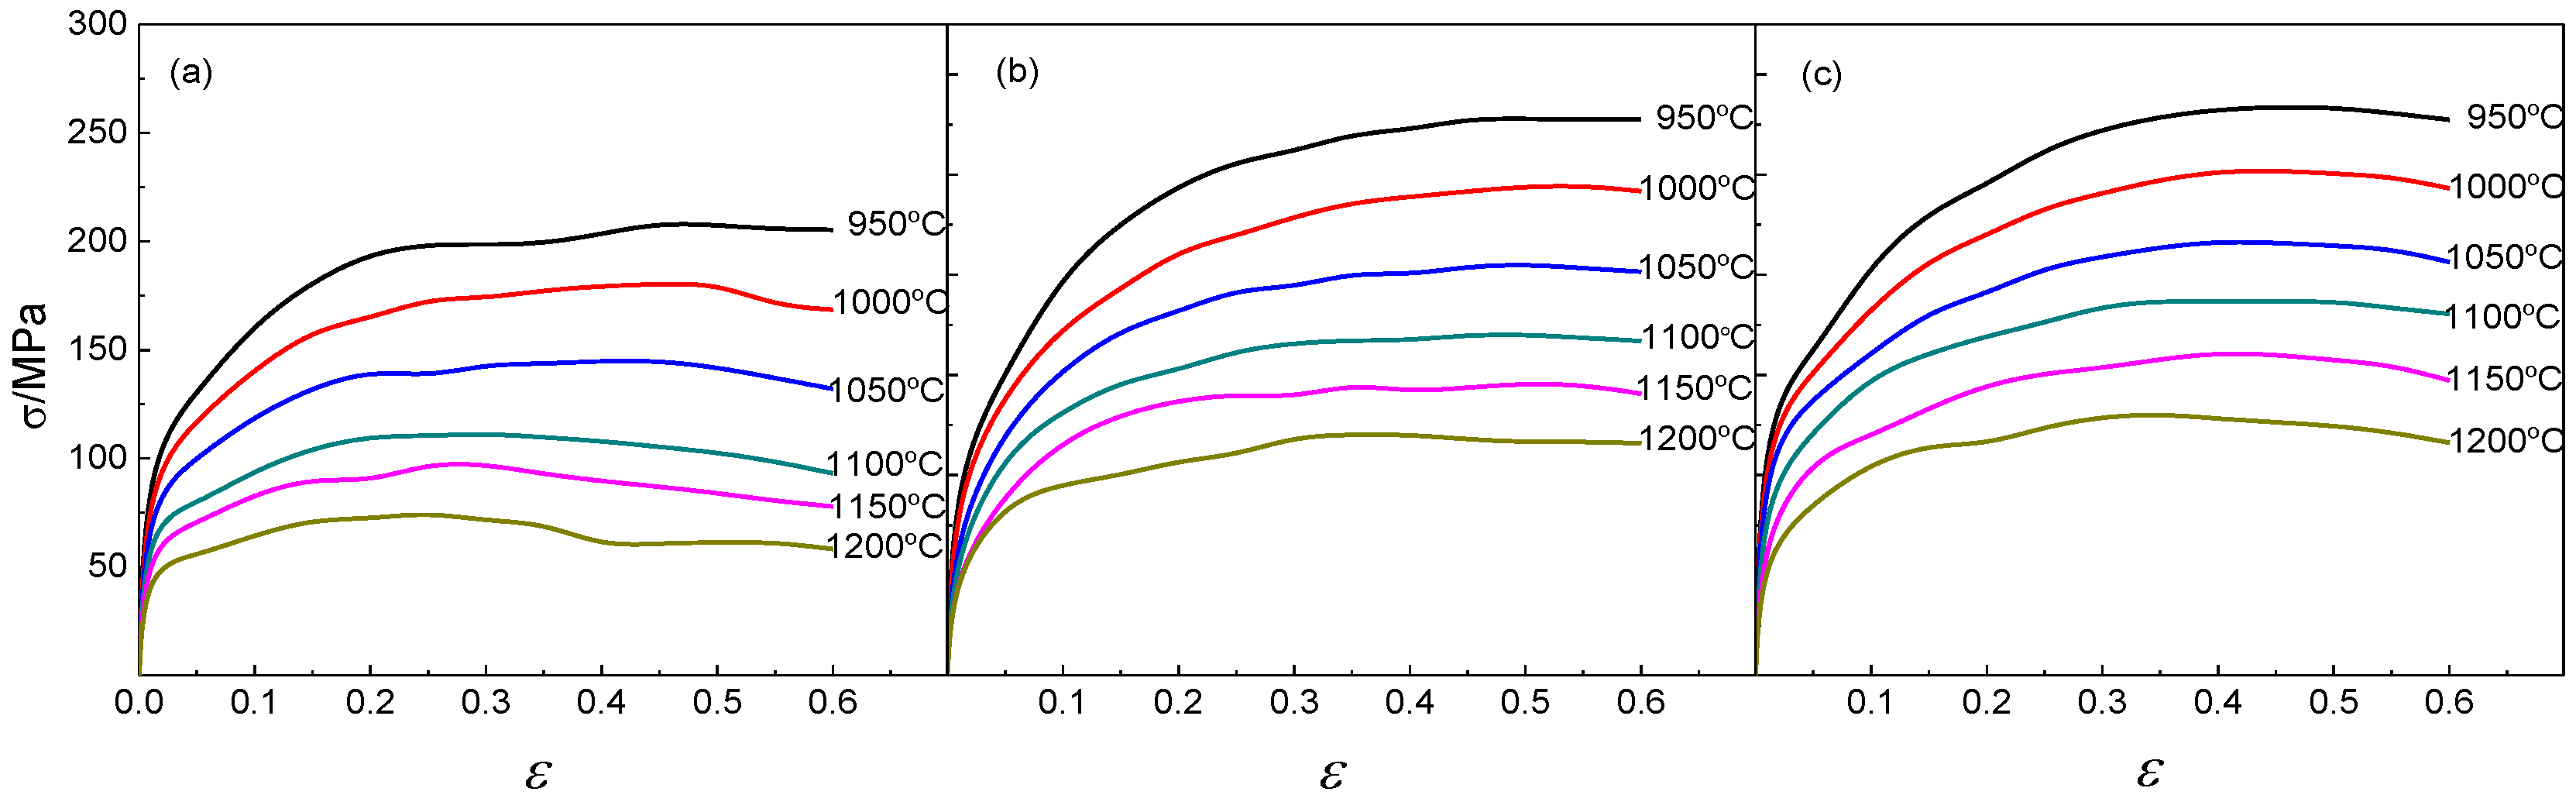
3.1. Flow Stress-Strain Curves

The flow stress-strain curves of experimental BSTMUF601 super-alloy at the temperature range of 950 °C–1200 °C and at strain rates of 0.2, 5 and 10 s−1 are shown in Figure 1. As expected, the flow stress is sensitively dependent on both the deformation temperature and strain rate. At the lower strain, the flow stress increased rapidly with the increase of the strain, caused by the increase of the average value of dislocation density which appears to have higher resistance to further compression. Some of the stress curves showed a broad and flat peak, which indicates the occurrence of dynamic recrystallization (DRX) and dynamic recovery (DRV) [10,11]. The flow stress decreases with the increase of deformation temperature at the same strain rate, and increases with the decrease of the strain rate at the same deformation temperature. This is easy to understand because the mobility of the grain boundary and dislocation could be accelerated or improved at a higher temperature, while it would take a longer time at a lower strain rate, according to the higher effect of the apparent activation energy of the deformation and lower shearing stress. Additionally, higher deformation temperature and lower strain rate could be beneficial for completing the DRX process including nucleation and growth.

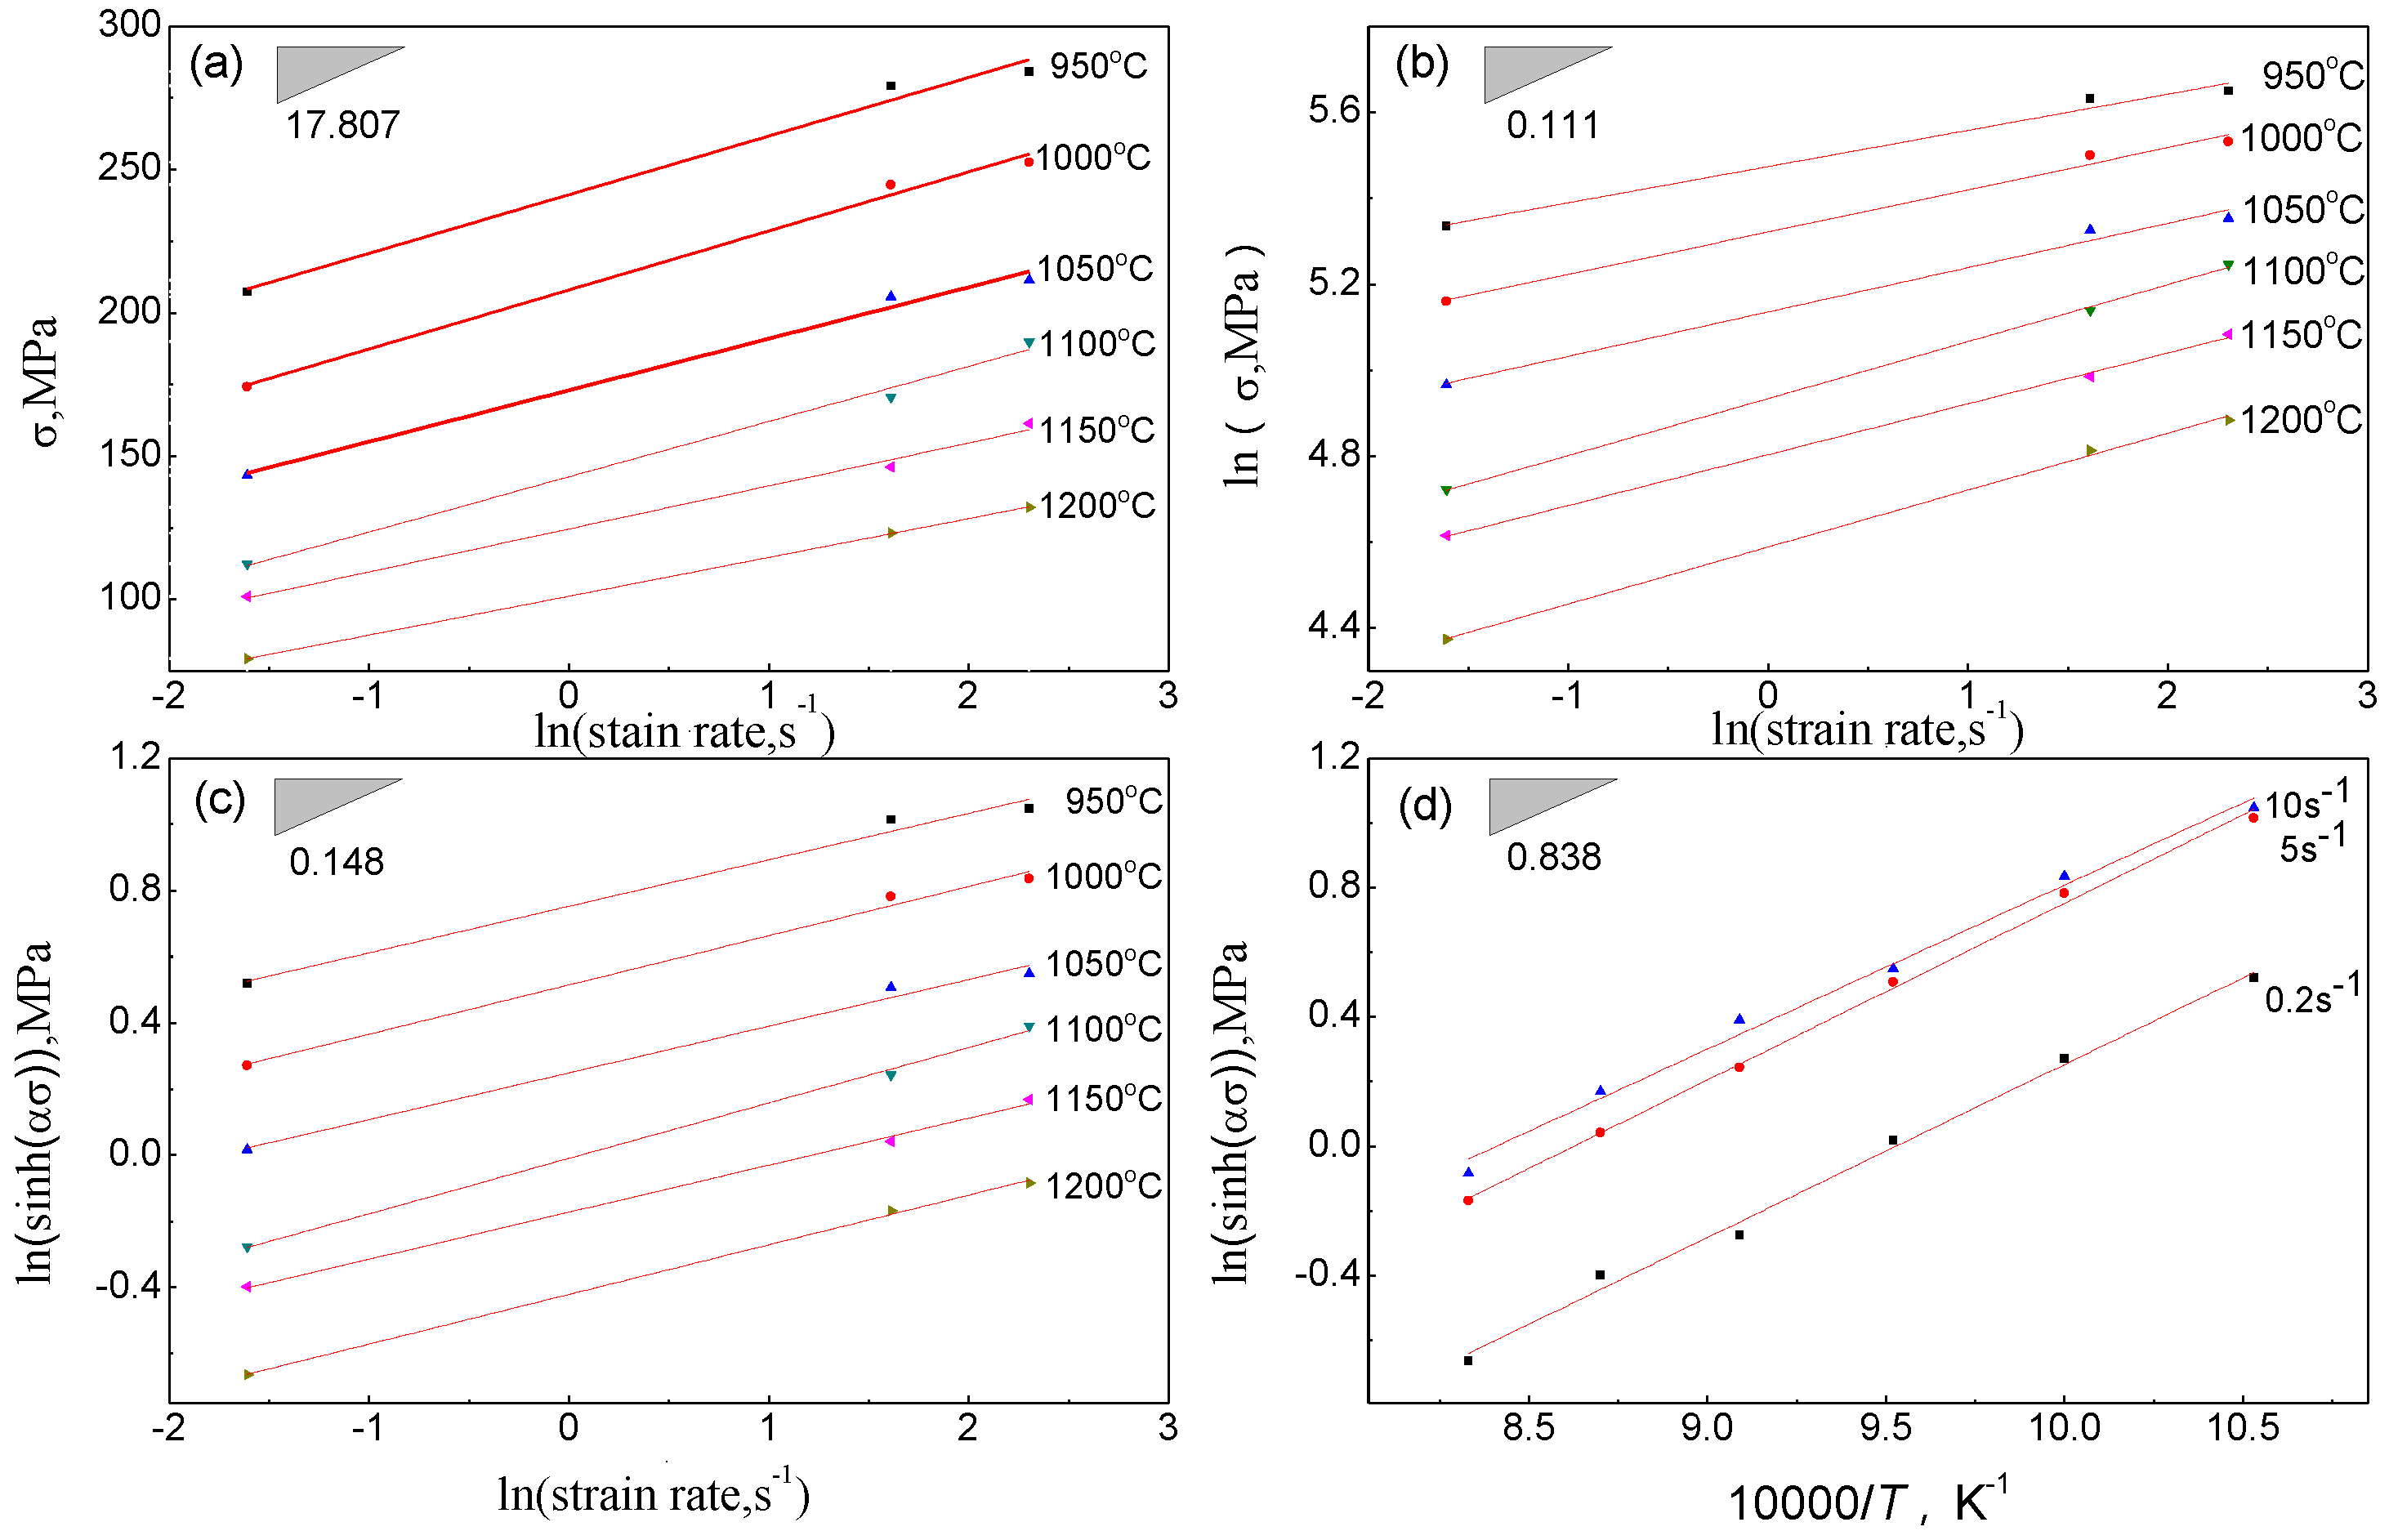
3.2. Constitutive Model of Peak Stress

Among all the flow stress constitutive equations, the Arrhenius-type equation proposed by Sellars et al. is the most widely used [12,13]. These equations are described as follows:
ε ˙ exp ( Q R T ) = A 1 exp ( n 1 σ )
ε ˙ exp ( Q R T ) = A 2 σ n 2
ε ˙ exp ( Q R T ) = A sinh ( α σ ) n
where ε ˙ is the strain rate (s−1), Q is the apparent activation energy of deformation (J/mol), R is the universal gas constant (8.314 J·mol−1·K−1), T is the absolute temperature (K), σ is the flow stress (MPa), n1, n2, n are material parameters which are called the stress exponents, A, A1, A2, are material parameters which relate to the strain rate–sensitive parameter.
Taking the natural logarithm of Equations (1)–(3) yields:
ln ε ˙ = ln A + 2 n 1 σ Q / ( R T )
ln ε ˙ = ln A 1 + n 2 ln σ Q / ( R T )
ln ε ˙ = ln A + n ln sinh ( α σ ) Q / ( R T )
Generally, the different descriptions of the Arrhenius-type equations are used for different regions. The exponential law in Equation (5) could predict the flow stress for the high stress level while the power law in Equation (4) could only be used for the low stress level. However, the hyperbolic sine law in Equation (6) is applicable for both low stress and high stress levels [8]. In the study, the flow stress ranges from 50 to 300 MPa; therefore, the hyperbolic sine law in Equation (6) is the most optimum constitutive equation. Obviously, the material parameters α, n, n1, n2 and Q should be identified at first to analyze the flow behavior of the studied steel, and according to reference [14], α = n1/n2.
By linear fitting and plotting σ against ln ε ˙ , n1 could be obtained from the slope of the linear regression lines, as shown in Figure 2a. The average value of n1 was calculated to be 0.0562. Additionally, n2 = 9.01 could be obtained from the slope of the linear regression lines, as shown in Figure 2b. Then, α = n1/n2 = 0.111/17.807 = 0.00623.
The value of n was calculated to be 6.757, obtained from the slope of the linear regression lines, as shown in Figure 2c. To calculate the apparent activation energy Q, Q = 1000 × n × R × K, where K = ln sinh ( α σ ) / ( 10000 / T ) | ε ˙ , R is the universal gas constant, T is the deformation temperature, by plotting the lnsinh(ασ) against 1000/T at a constant strain rate, K could be obtained from the slope of the linear regression lines, as shown in Figure 2d. The average value of K is 0.53 from the slope of the three linear regression lines at different strain rates. Therefore, the apparent activation energy was calculated to be 470.5 kJ/mol. In the same way, the value of lnA = Q/(RT) – h × n can be obtained from the intercept h of the ln sinh ( α σ ) ln ε ˙ , and lnA is 25.64. Therefore, A is 1.37 × 10¹¹ in the present study.
By filling the obtained material parameters (α, n, Q and A) into Equation (3), the hyperbolic sine equation for the peak stress of BSTMUF601 super-alloy is developed as following:
ε ˙ = 1.37 × 10 11 [ sinh ( 6.23 × 10 3 σ ) ] 6.757 exp [ 4.705 × 10 5 / ( R T ) ]

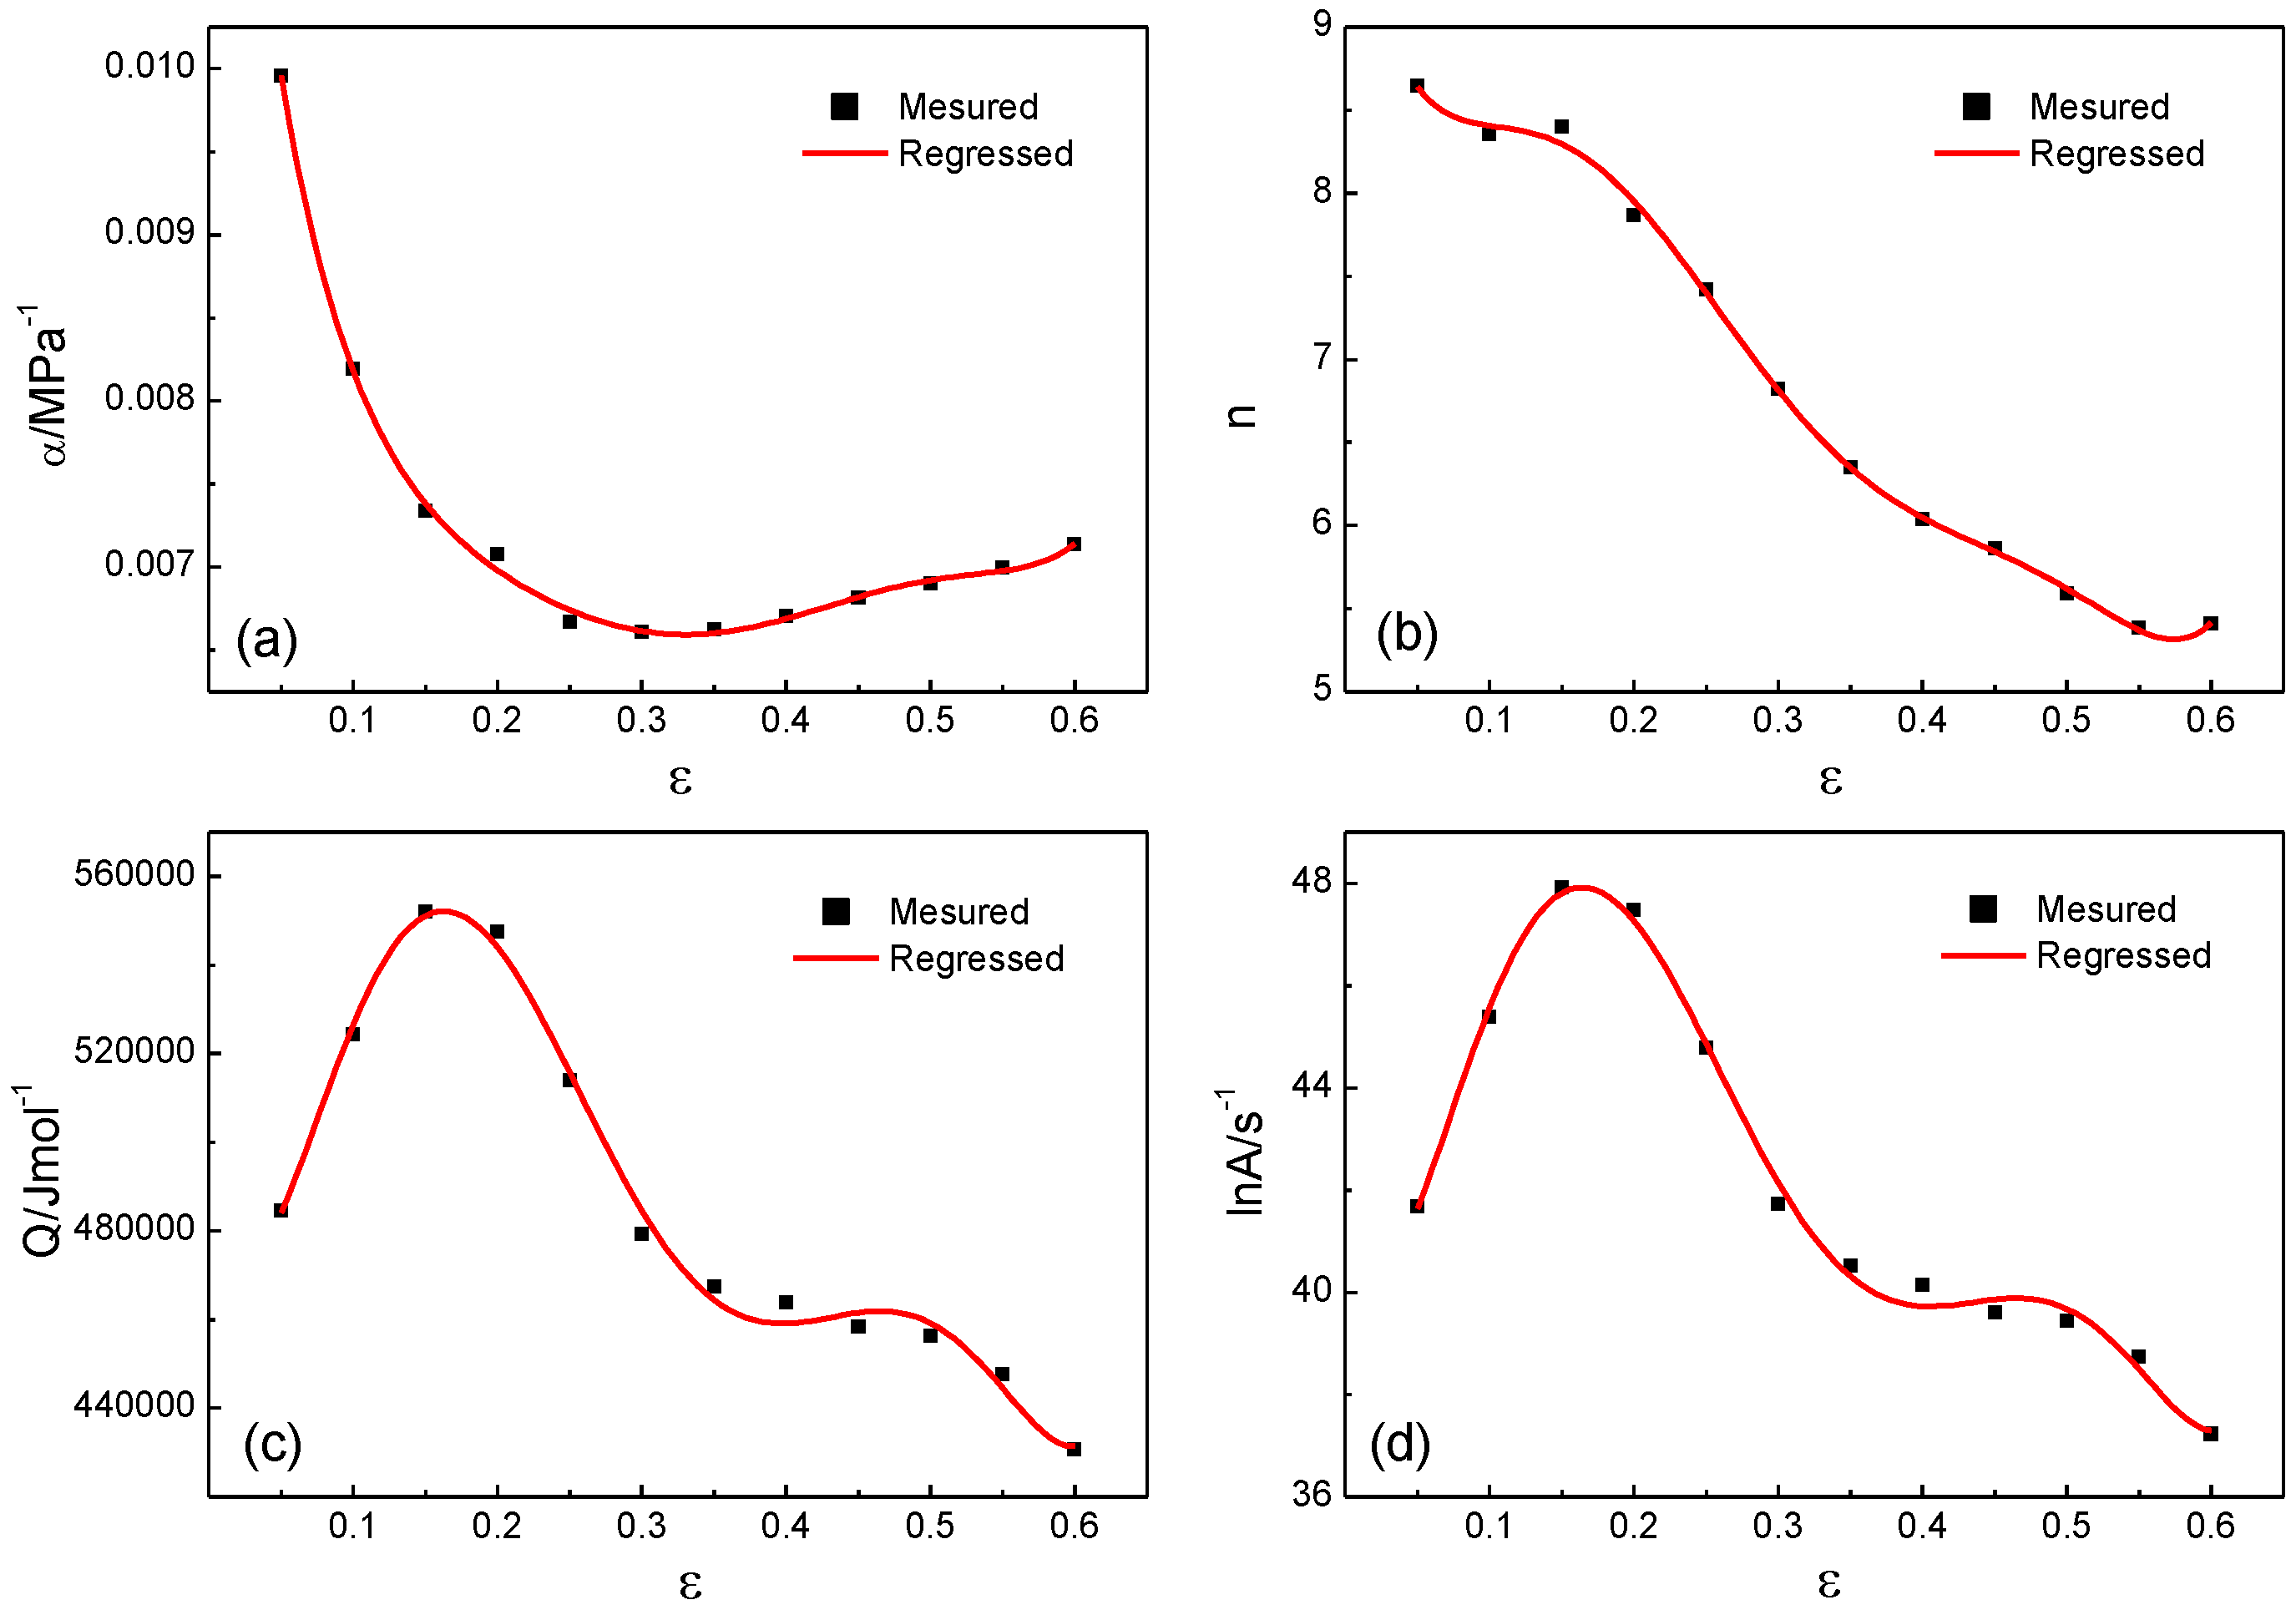
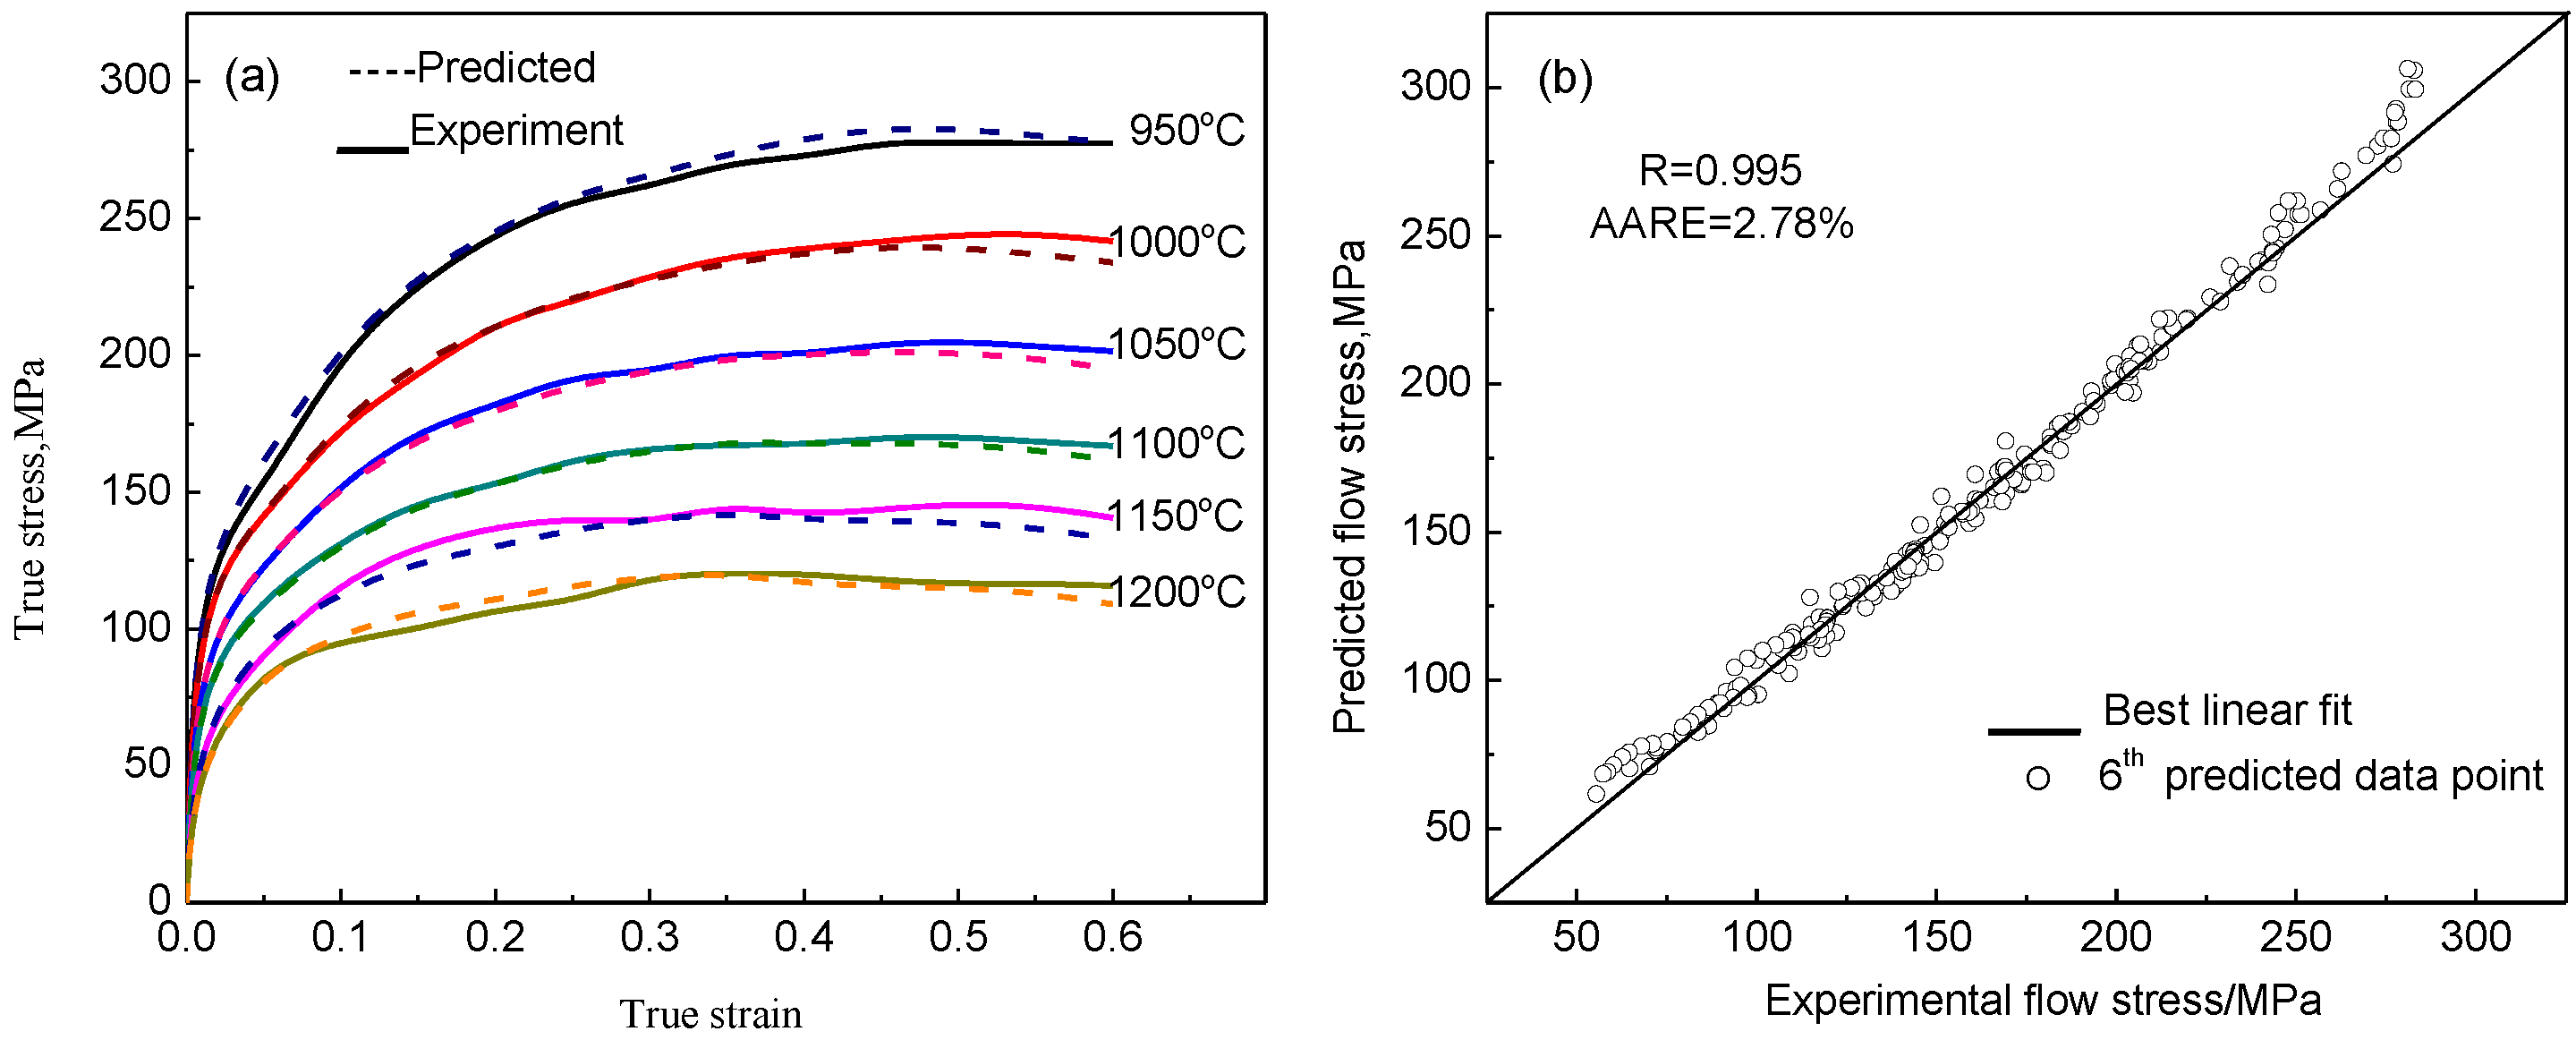
3.3. Unified Constitutive Model

At higher deformation temperature and lower strain rate, flow stress decreases with the increase of the true strain, which declares flow stress is sensitive to true strain at the material hot deformation process [15]. Therefore, effects of the strain on flow stress should be considered in the established constitutive model process. In order to achieve a primitive estimation of the flow stress in the plastic deformation, the material parameters’ (α, n, Q and A) values were obtained individually at 12 different true strains between 0.05 and 0.6 with 0.05 intervals, similar to the method used for establishing the constitutive model of peak stress. The material parameters (α, n, Q and A) have functional relations with true strain; furthermore, relations between the material parameters and true strain could be well fitted with six-order polynominal functions [16], shown as Equation (8), plotting material parameters against true strain, as shown in Figure 3. The material parameters (α, n, Q and A) could be accurately calculated by Equation (8); hence, flow stress could be obtained through Equation (3).
{ Q / 10000 = 48.58 123.81 ε + 3462.54 ε 2 24542.6 ε 3 + 72972.3 ε 4 98514.7 ε 5 + 49872.3 ε 6 ln A = 41.01 82.34 ε + 2752.32 ε 2 19910.79 ε 3 + 59299.40 ε 4 79801.05 ε 5 + 40202.88 ε 6 n = 10.07 52.99 ε + 651.71 ε 2 3811.26 ε 3 + 10556.13 ε 4 13879.26 ε 5 + 7007.21 ε 6 α = 0.014 0.110 ε + 0.795 ε 2 3.258 ε 3 + 7.515 ε 4 8.939 ε 5 + 4.248 ε 6
Comparing flow stress calculated from the unified constitutive model to experimental values when the strain rate is 5 s−1, as shown in Figure 4a, it is easy to see that flow stress calculated from the unified constitutive model is fits well with the experimental values. The correlation between the flow stress of experimental values and calculated values was fine, as shown in Figure 4b, and the correlation is 0.995. Additionally, the average relative error (AARE) was calculated at the experimental conditions, and the value of the AARE is 2.78%. That declared that the predicted flow stress from the unified constitutive model agreed well with the experimental results. It is worth mentioning that the predicted flow stress has a great difference with experimental flow stress at a higher flow stress, and it should be attributed to softening caused by the adiabatic temperature rise at a high strain rate.

4. Hot Processing Map

4.1. Approach Processing Map

The processing maps have been proved to be useful tools for understanding the hot deformation behavior of metals and alloys over a wide range of temperatures, strains, and strain rates [17,18,19,20,21]. According to the dynamic materials model (DMM), processing maps are composed of two superimposed power efficiency and instability maps at a constant strain [22]. The dynamic materials model assumes that the total instantaneous power P absorbed from the equipment is dissipated through the temperature rise and microstructure change. The dissipated powers caused by the temperature rise and microstructure change are named content G and co-content J. Most of the instantaneous power P absorbed by the work-piece is dissipated by the dissipater content G, which is the power dissipated via plastic deformation. The dissipater co-content J, which is the work related to metallurgical evolution via various mechanisms such as DRV, DRX and phase transition, occurs dynamically to dissipate power. The total power absorbed P can be expressed as:
P = σ ε ˙ = G + J = 0 σ σ d ε ˙ + 0 σ ε ˙ d σ
The ratio of dJ/dG is equivalent to the strain rate sensitivity exponent m. For an ideal linear dissipater, m = 1 and J max = σ ε ˙ / 2 . By normalizing the instantaneous J with the maximum value, the efficiency of power dissipation η can be expressed as:
η = J J m a x = 2 m m + 1
The power dissipation map is obtained by plotting the parameter η against temperature and strain rate for different strains in the form of a contour map.
A continuum criterion for the occurrence of flow instability is obtained by utilizing the principle of the maximum rate of entropy production, which was proposed by Ziegler, and is given as:
ξ ( ε ˙ ) = ln [ m / ( m + 1 ) ] ln ε ˙ + m < 0
where ξ( ε ˙ ) is the instability coefficient. The instability map can be obtained by plotting the instability coefficient against the temperature and strain rate for different strains where the negative values of the instability coefficient indicate domains of instability.
The processing map can not only be used to provide optimum deformation conditions but it also can be used to describe the flow instability domains. The processing map is obtained through superimposing an instability map on a power dissipation map.

4.2. Processing Map of BSTMUF601 Super-Alloy

The function relationship between lnσ and ln ε ˙ is obtained by cubic curve fitting, and then the strain rate sensitivity exponent m can be obtained. According to Equation (10), the efficiency of power dissipation η was obtained. The power dissipation map is obtained by plotting the parameter η against temperature and strain rate for different strains in the form of a contour map. According to Equation (11), the value of the instability coefficient was calculated. The instability map can be obtained by plotting the instability coefficient against temperature and strain rate for different strains where the negative values of the instability coefficient, gray areas, indicate flow instability regions. The processing maps for BSTMUF601 super-alloy obtained in the temperature range of 950 °C–1200 °C and at the strain rate range of 0.2, 5 and 10 s−1 at true strains of 0.2, 0.4 and 0.6, through superimposing the instability maps on the power dissipation maps are shown in Figure 5, respectively.
Generally, the maximum η represents the optimal processing window. From Figure 5, the power dissipation efficiency will be elevated with the increase of the deformation temperature and the decrease of the strain rate; the safety regions are in the low strain rate regions, and furthermore, instability domains reduce first, then increase with the increase of the true strain, implying that the true strain has a significant effect on the instability domains.
At true strain 0.2, the peak efficiency appears at strain rate 0.2 s−1 and deformation temperature of about 1150 °C; as also, the instability regions appeared at the strain rate range of 2–10 s−1 and deformation temperature range of 950 °C–1040 °C and 1140 °C–1170 °C, as shown in Figure 5a. It should be noted that the space between the contour lines becomes close in the temperature range of 1100 °C–1150 °C and the strain rate range of 0.2–0.35 s−1, implying that the value is relatively sensitive to the changes of both temperature and strain rate. At true strains 0.4 and 0.6, the peak efficiency appeared at strain rate 0.2 s−1 and deformation temperature of about 1200 °C, as shown in Figure 5b,c. The optimum hot working condition of BSTMUF601 super-alloy for all the true strains occurs in the strain rate range of 0.2–0.4 s−1, the temperature range of 1100 °C–1130 °C and the temperature range of 1170 °C–1200 °C as well. The power dissipation efficiency of these two domains is higher than that in the other regions.

5. Conclusions

Hot deformation behavior of BSTMUF601 super-alloy was studied in the temperature range of 950 °C–1200 °C and the strain rate range of 0.2–10 s−1. The following conclusions were drawn.
(1) The material parameters (α, n, Q and A) have six-order polynominal functional relations with the true strain, and the unified constitutive equations of BSTMUF601 super-alloy were established. The apparent activation energy for hot deformation is 470.5 kJ/mol.
(2) The power dissipation efficiency will be elevated with the increase of deformation temperature and the decrease of strain rate; the safety regions are in the low strain rate regions, and the instability domains reduce first, then increase with the increase of the true strain, implying that the true strain has a significant effect on the instability domains.
(3) The BSTMUF601 super-alloy possesses a large instability region and limited hot-working region at large strain. The optimum hot working conditions of BSTMUF601 super-alloy were the strain rate range of 0.2–0.4 s−1, and the temperature ranges of 1100 °C–1130 °C and 1170 °C–1200 °C.

Acknowledgments

The authors would like to thank the financial support of “High-end CNC Machine Tool and Manufacturing Equipment” Science and Technology Major Special Project of China (NO. 2014ZX04014-051) and Open Research Fund of Key Laboratory of High Performance Complex Manufacturing, Central South University (NO. Kfkt2015-01).

Author Contributions

Chaoyang Sun and Xun Zuo conceived and designed the experiments; Chaoyang Sun, Xun Zuo and Yu Xiang performed the experiments; Chaoyang Sun, Xun Zuo, Yu Xiang and Jing Yang analyzed the data; Chaoyang Sun and Xun Zuo contributed to writing and editing of the manuscript.

Conflicts of Interest

The authors declare no conflict of interest.

References

  1. Ye, N.W.; Lv, X.B.; Sun, C.Y. Research and application about muffle material for bright annealing of grand stainless strip. Heavy Mach. 2013, 3, 37–41. [Google Scholar]
  2. Sun, C.Y.; Shi, B.; Wu, C.B.; Ye, N.W.; Ma, T.J.; Xu, W.L.; Yang, J. High temperature creep deformation mechanism of BSTMUF601 super-alloy. Acta Metall. Sin. 2015, 51, 349–356. [Google Scholar]
  3. Sun, C.Y.; Chen, G.C.; Wu, C.B.; Xu, W.L.; Ma, T.J.; Yang, J. High temperature oxidation behavior of typical Nickel-based super-alloys. Corros. Sci. Prot. Technol. 2014, 26, 345–349. [Google Scholar]
  4. Pan, Q.L.; Li, B.; Wang, Y.; Zhang, Y.W.; Yin, Z.M. Characterization of hot deformation behavior of Ni-base super-alloy Rene’41 using processing map. Mater. Sci. Eng. A 2013, 585, 371–378. [Google Scholar] [CrossRef]
  5. Zhang, C.; Zhang, L.; Shen, W.; Li, M.F.; Gu, S.D. Characterization of hot deformation behavior of hastelloy C-276 using constitutive equation and processing map. J. Mater. Eng. Perform. 2015, 24, 149–157. [Google Scholar] [CrossRef]
  6. Zhou, H.; Wang, Q.D.; Ye, B.; Guo, W. Hot deformation and processing maps of as-extruded Mg–9.8Gd–2.7Y–0.4Zr Mg alloy. Mater. Sci. Eng. A 2013, 576, 101–107. [Google Scholar] [CrossRef]
  7. Li, H.Z.; Wang, H.J.; Liang, X.P.; Liu, H.T.; Liu, Y.; Zhang, X.M. Hot deformation and processing map of 2519A aluminum alloy. Mater. Sci. Eng. A 2011, 528, 1548–1552. [Google Scholar] [CrossRef]
  8. Sun, C.Y.; Liu, G.; Zhang, Q.D.; Li, R.; Wang, L. Determination of hot deformation behavior and processing maps of IN 028 alloy using isothermal hot compression test. Mater. Sci. Eng. A 2014, 595, 92–98. [Google Scholar] [CrossRef]
  9. Guo, H.Z.; Zhang, W.; Zhao, Z.L.; Yao, Z.K. The super plastic tensile deformation behavior and structure evolution of new type titanium alloy-TC21. Rare Metal Mater. Eng. 2005, 34, 1935–1939. [Google Scholar]
  10. Taylor, A.S.; Hodgson, P.D. Dynamic behavior of 304 stainless steel during high deformation. Mater. Sci. Eng. A 2011, 528, 3310–3320. [Google Scholar] [CrossRef]
  11. Zhang, W.F.; Li, X.L.; Sha, W.; Wang, W.; Shan, Y.Y. Hot deformation characteristics of a nitride strengthened martensitic heat resistant steel. Mater. Sci. Eng. A 2014, 590, 199–208. [Google Scholar] [CrossRef]
  12. Sellars, C.M.; Tegart, W.J.M. Hot workability. Int. Mater. Rev. 1971, 17, 1–24. [Google Scholar] [CrossRef]
  13. Sun, C.Y.; Luan, J.D.; Liu, G.; Li, R.; Zhang, Q.D. Predicted constitutive modeling of hot deformation for AZ31 magnesium alloy. Acta Metall. Sin. 2012, 48, 853–860. [Google Scholar] [CrossRef]
  14. Mirzadeh, H.; Cabrera, J.M.; Prado, J.M.; Najafizadeh, A. Hot deformation behavior of a medium carbon microalloyed steel. Mater. Sci. Eng. A 2011, 528, 3876–3882. [Google Scholar] [CrossRef]
  15. Sun, C.Y.; Liu, J.R.; Li, R.; Zhang, Q.D. Constitutive modeling for elevate temperature flow behavior of Incoloy 800H superalloy. Acta Metall. Sin. 2011, 47, 191–196. [Google Scholar]
  16. Sun, C.Y.; Liu, J.R.; Li, R.; Zhang, Q.D. Effect of process parameters on the exit temperature of IN690 alloy tubes during hot extrusion. J. Univ. Sci. Technol. B 2010, 32, 1483–1488. [Google Scholar]
  17. Zeng, W.D.; Zhou, Y.G.; Zhou, J.; Yu, H.Q. Recent development of processing map theory. Rare Metal Mater. Eng. 2006, 35, 673–677. [Google Scholar]
  18. Wang, L.; Liu, F.; Cheng, J.J.; Zuo, Q.; Chen, C.F. Hot deformation characteristics and processing map analysis for Nickel-based corrosion resistant alloy. J. Alloy. Compd. 2015, 623, 69–78. [Google Scholar] [CrossRef]
  19. Kong, Y.P.; Chang, Q.P.; Li, Q.; Xie, L.X.; Zhu, S.G. Hot deformation characteristics and processing map of nickel-based C276 superalloy. J. Alloy. Compd. 2015, 622, 738–744. [Google Scholar] [CrossRef]
  20. Robi, P.S.; Dixit, U.S. Application of neural networks in generating processing map for hot working. J. Mater. Process. Technol. 2003, 142, 289–294. [Google Scholar] [CrossRef]
  21. Li, M.Q.; Li, X.L.; Li, L.; Xu, G.X. Deformation behavior and processing map of high temperature deformation of TA15 alloy. Rare Metal Mater. Eng. 2006, 35, 1354–1358. [Google Scholar]
  22. Prasad, Y.V.R.K. Processing maps: A status report. J. Mater. Eng. Perform. 2003, 12, 638–645. [Google Scholar] [CrossRef]
Figure 1. Flow stress-strain curves of BSTMUF601 super-alloy under different strain rates: (a) 0.2 s−1; (b) 5 s−1; (c) 10 s−1.
Metals 06 00070 g001
Figure 2. The linear regression (a) σ against ln ε ˙ ; (b) lnσ against ln ε ˙ ; (c) lnsinh(ασ) against ln ε ˙ ; and (d) lnsinh(ασ) against (10000/T).
Metals 06 00070 g002
Figure 3. Relations between material parameters and (a) α; (b) n; (c) Q; (d) lnA.
Metals 06 00070 g003
Figure 4. (a) Comparisons between predicted and experimental flow stress; (b) Correlation between predicted and experimental flow stress.
Metals 06 00070 g004
Figure 5. Hot processing maps at different strains of BSTMUF601 super-alloy. (a) The strain is 0.2; (b) the strain is 0.4; and (c) the strain is 0.6.
Metals 06 00070 g005
Table 1. Chemical composition of the BSTMUF601 super-alloy (in wt %).
CSiMnSPCrFeNi
0.0130.020.210.0020.00529.199.49balance

