
Glass Forming Ability and Corrosion Resistance of Zr-Cu-Ni-Al-Ag Bulk Metallic Glass

Abstract
:1. Introduction
2. Experiment
3. Results and Discussion
4. Conclusions
Acknowledgments
Author Contributions
Conflicts of Interest
References
- Wang, W.H.; Dong, D.; Shek, C.H. Bulk metallic glasses. Mater. Sci. Eng. R 2004, 44, 45–89. [Google Scholar] [CrossRef]
- Schroers, J. Processing of bulk metallic glass. Adv. Mater. 2010, 21, 1566–1597. [Google Scholar] [CrossRef] [PubMed]
- Kumar, G.; Tang, H.X.; Schroers, J. Nanomoulding with amorphous metals. Nature 2009, 457, 868–872. [Google Scholar] [CrossRef] [PubMed]
- Inoue, A.; Takeuchi, A. Recent development and application products of bulk glassy alloys. Acta Mater. 2011, 59, 2243–2267. [Google Scholar] [CrossRef]
- Inoue, A.; Shen, B.L.; Koshiba, H.; Kato, H.; Yavari, A.R. Ultra-high strength above 5000 MPa and soft magnetic properties of Co-Fe-Ta-B bulk glassy alloys. Acta Mater. 2004, 52, 1631–1637. [Google Scholar] [CrossRef]
- Schuh, C.A.; Hufnagel, T.C.; Ramamurty, U. Mechanical behavior of amorphous alloys. Acta Mater. 2007, 12, 4067–4109. [Google Scholar] [CrossRef]
- Mattern, N. Structure formation in liquid and amorphous metallic alloys. J. Non-Cryst. Solids 2007, 353, 1723–1731. [Google Scholar] [CrossRef]
- Lou, H.B.; Wang, X.D.; Xu, F.; Ding, S.Q.; Cao, Q.P.; Hono, K.; Jiang, J.Z. 73 mm-diameter bulk metallic glass rod by copper mould casting. Appl. Phys. Lett. 2011, 99, 051910. [Google Scholar] [CrossRef]
- Chen, N.; Martin, L.; Luzguine-Luzgin, D.V.; Inoue, A. Role of alloying additions in glass formation and properties of bulk metallic glass. Materials 2010, 3, 5320–5339. [Google Scholar] [CrossRef]
- Inoue, A.; Nishiyama, N.; Kimura, H. Preparation and thermal stability of bulk amorphous Pd40Cu30Ni10Pd20 alloy cylinder of 72 mm in diameter. Mater. Trans. JIM 1997, 38, 179–183. [Google Scholar] [CrossRef]
- Xu, K.; Ling, H.B.; Li, Q.; Li, J.F.; Yao, K.F.; Guo, S.F. Effects of Co substitution for Fe on the glass forming ability and properties of Fe80P13C7 bulk metallic glasses. Intermetallics 2014, 51, 53–58. [Google Scholar] [CrossRef]
- Wang, J.F.; Wang, L.G.; Guan, S.K.; Zhu, S.Z.; Li, R.; Zhang, T. Effects of boron content on the glass-forming ability and mechanical properties of Co-B-Ta glassy alloys. J. Alloy. Compd. 2014, 617, 7–11. [Google Scholar] [CrossRef]
- Zhu, C.L.; Wang, Q.; Wang, Y.M.; Qiang, J.B.; Dong, C. Ni-based B-Fe-Ni-Si-Ta bulk metallic glasses designed using cluster line, minor alloying, and element substitution. Intermetallics 2010, 18, 791–795. [Google Scholar] [CrossRef]
- Zheng, Q.; Ma, H.; Ma, E.; Xu, J. Mg-Cu-(Y, Nd) pseudo-ternary bulk metallic glasses: The effects of Nd on glass-forming ability and plasticity. Scr. Mater. 2006, 55, 541–544. [Google Scholar] [CrossRef]
- Zhou, W.; Kong, L.T.; Li, J.F.; Zhou, Y.H. Effects of Cr addition on glass-forming ability and mechanical properties of Cu-Zr-Al bulk metallic glass. J. Mater. Sci. 2012, 47, 4996–5001. [Google Scholar] [CrossRef]
- Sun, Y.J.; Qu, D.D.; Huang, Y.J.; Liss, K.D.; Wei, X.S.; Xing, D.W.; Shen, J. Zr-Cu-Ni-Al bulk metallic glasses with superhigh glass-forming ability. Acta Mater. 2009, 57, 1290–1299. [Google Scholar] [CrossRef]
- Wang, W.H. Roles of minor additions in formation and properties of bulk metallic glasses. Prog. Mater. Sci. 2007, 52, 540–596. [Google Scholar] [CrossRef]
- Shen, Y.T.; Xing, L.Q.; Kelton, K.F. Formation and crystallization of ZrCuTi metallic glasses. Philos. Mag. 2005, 85, 3673–3682. [Google Scholar] [CrossRef]
- Jiang, Q.K.; Wang, X.D.; Nie, X.P.; Zhang, G.Q.; Ma, H.; Fecht, H.J.; Bendnarcik, J.; Franz, H.; Liu, Y.G.; Cao, Q.P.; et al. Zr-(Cu, Ag)-Al bulk metallic glasses. Acta Mater. 2008, 56, 1785–1796. [Google Scholar] [CrossRef]
- Liu, Y.H.; Wang, G.; Wang, R.J.; Zhao, D.Q.; Pan, M.X.; Wang, W.H. Super plastic bulk metallic glasses at room temperature. Science 2007, 315, 1385–1388. [Google Scholar] [CrossRef] [PubMed]
- Mattern, N.; Kuhn, U.; Hermann, H.; Ehrenberg, H.; Neuefeind, J. Short-range order of Zr62−xTixAl10Cu20Ni8 bulk metallic glasses. Acta Mater. 2002, 50, 305–314. [Google Scholar] [CrossRef]
- Xu, D.H.; Duan, G.; Johnson, W.L. Unusual glass-forming ability of bulk amorphous alloys based on ordinary metal copper. Phys. Rev. Lett. 2004, 92, 245504. [Google Scholar] [CrossRef] [PubMed]
- Greer, A.L. Confusion by design. Nature 1993, 366, 303–304. [Google Scholar] [CrossRef]
- Takeuchi, A.; Inoue, A. Classification of bulk metallic glasses by atomic size difference, heat of mixing and period of constituent elements and its application to characterization of the main alloying element. Mater. Trans. 2005, 46, 2817–2829. [Google Scholar] [CrossRef]
- Miedema, A.R. On the heat of formation of solid alloys II. J. Less Common Met. 1976, 46, 67–83. [Google Scholar] [CrossRef]
- Xu, D.H.; Lohwongwatana, B.; Johnson, W.L.; Garland, C. Bulk metallic glass formation in binary Cu-rich alloy series-Cu100−xZrx (x = 34, 36, 38.2, 40 at %) and mechanical properties of bulk Cu64Zr36 glass. Acta Mater. 2004, 52, 2621–2624. [Google Scholar] [CrossRef]
- Tan, H.; Zhang, Y.; Ma, D.; Feng, Y.P.; Li, Y. Optimum glass formation at off-eutectic composition and its relation to skewed eutectic coupled zone in the La based La-Al-(Cu, Ni) pseudo ternary system. Acta Mater. 2003, 51, 4551–4561. [Google Scholar]
- Wang, D.; Li, Y.; Sun, B.B.; Sui, M.L.; Lu, K.; Ma, E. Bulk metallic glass formation in the binary Cu-Zr system. Appl. Phys. Lett. 2004, 84, 4029–4031. [Google Scholar] [CrossRef]
- Zhou, W.; Hou, J.X.; Zhong, Z.Z.; Li, J.F. Effect of Ag content on thermal stability and crystallization behavior of Zr-Cu-Ni-Al-Ag bulk metallic glass. J. Non-Cryst. Solids 2015, 411, 132–136. [Google Scholar] [CrossRef]
- Gostin, P.F.; Gebert, A.; Schultz, L. Comparison of the corrosion of bulk amorphous steel with conventional steel. Corros. Sci. 2010, 52, 273–281. [Google Scholar] [CrossRef]
- Tam, M.K.; Pang, S.J.; Shek, C.H. Corrosion behavior and glass-forming ability of Cu-Zr-Al-Nb alloys. J. Non-Cryst. Solids 2007, 353, 3596–3599. [Google Scholar] [CrossRef]
- Cai, A.H.; Xiong, X.; Liu, Y.; An, W.K.; Zhou, G.J.; Luo, Y.; Li, T.L. Corrosion behavior of Cu55Zr35Ti10 metallic glass in the chloride media. Mater. Chem. Phys. 2012, 134, 938–944. [Google Scholar] [CrossRef]
- Hua, N.B.; Huang, L.; Wang, J.F.; Cao, Y.; He, W.; Pang, S.J.; Zhang, T. Corrosion behavior and in vitro biocompatibility of Zr-Al-Co-Ag bulk metallic glasses: An experimental case study. J. Non-Cryst. Solids 2012, 358, 1599–1604. [Google Scholar] [CrossRef]


| Element | Zr | Cu | Ni | Al | Ag |
|---|---|---|---|---|---|
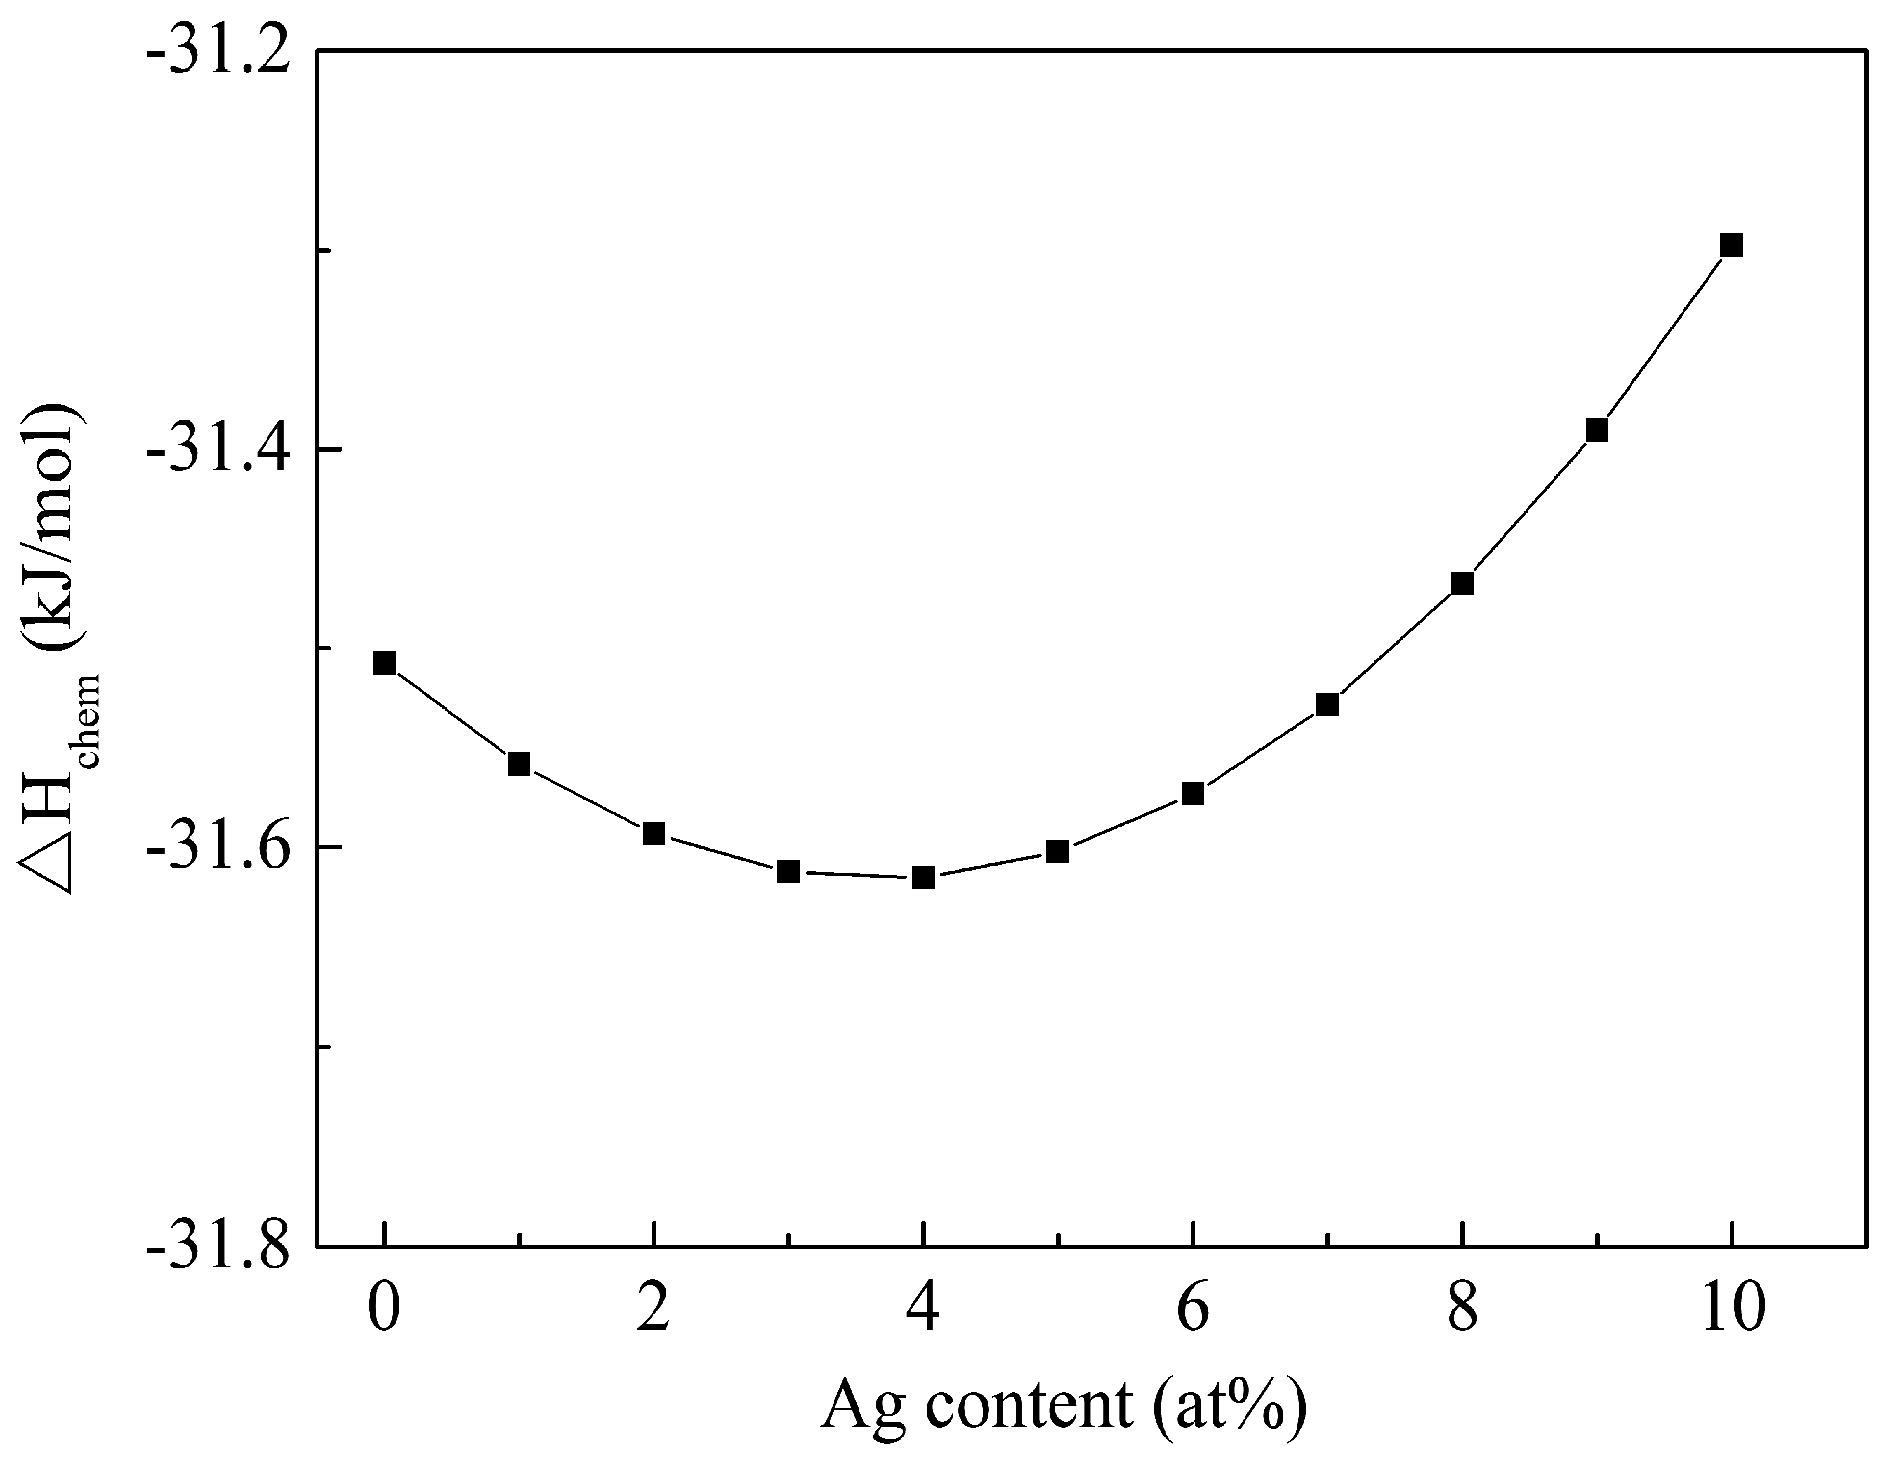
| Zr (1.60 Å) | - | −23 | −49 | −44 | −20 |
| Cu (1.28 Å) | - | - | +4 | −1 | +2 |
| Ni (1.24 Å) | - | - | - | −22 | +15 |
| Al (1.43 Å) | - | - | - | - | −4 |
| Ag (1.44 Å) | - | - | - | - | - |
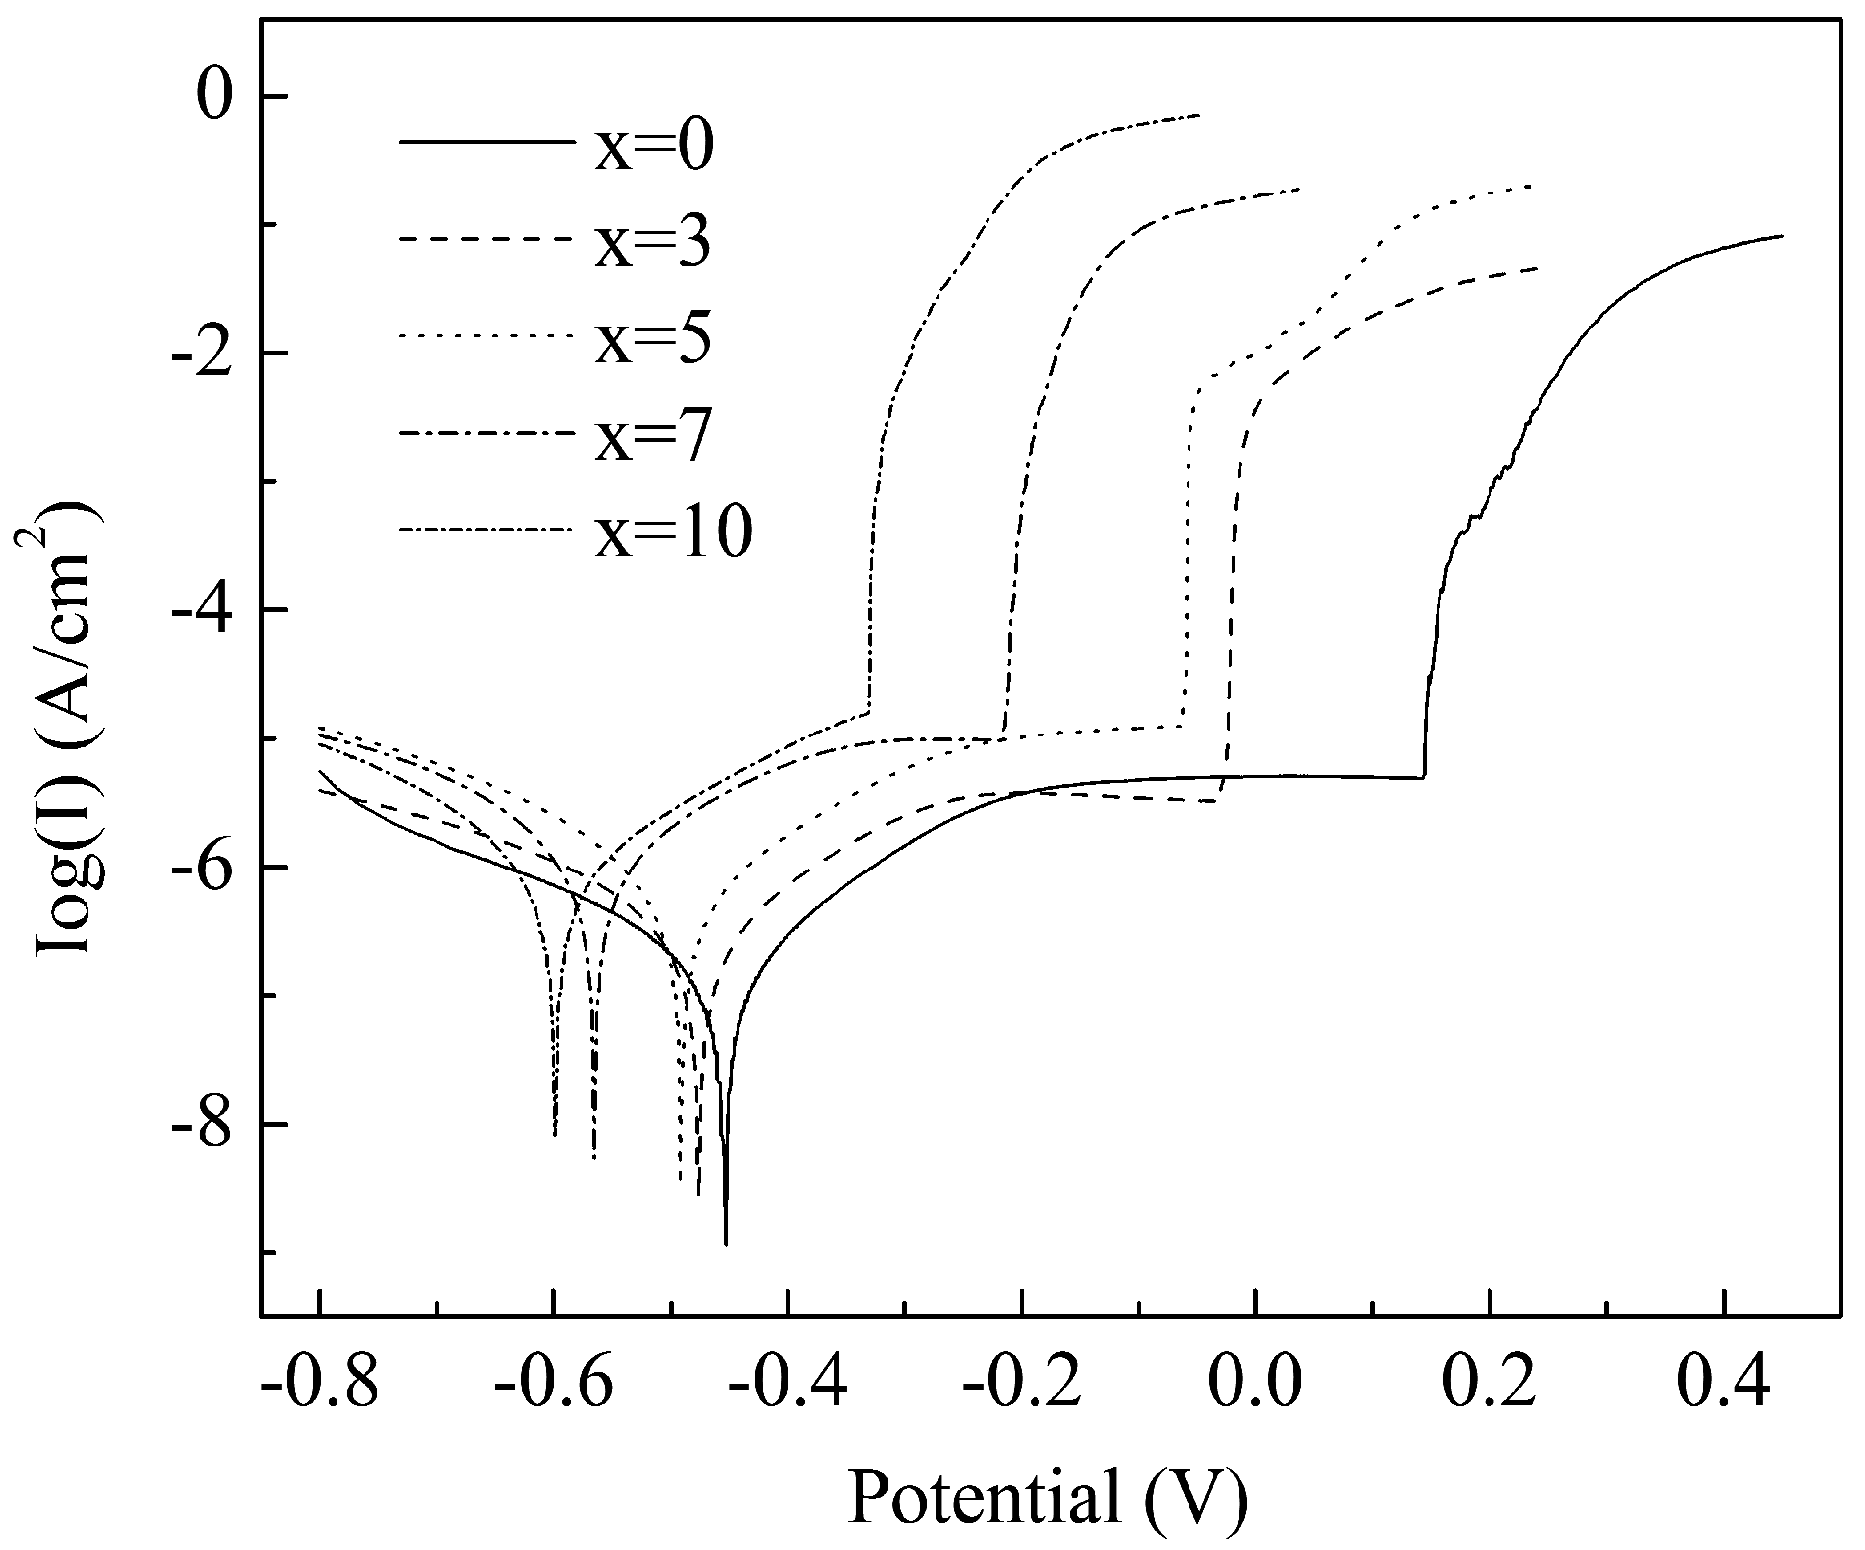
| Alloys | Ecorr (mV) | Epit (mV) | Epit–Ecorr (mV) | Icorr (A·cm−2) |
|---|---|---|---|---|
| x = 0 | −454 ± 5 | 144 ± 4 | 598 ± 5 | 1.7 ± 0.4 × 10⁻⁷ |
| x = 3 | −476 ± 4 | −26 ± 2 | 450 ± 3 | 4.1 ± 0.2 × 10⁻⁷ |
| x = 5 | −492 ± 3 | −62 ± 2 | 430 ± 4 | 7.6± 0.3 × 10⁻⁷ |
| x = 7 | −565 ± 6 | −213 ± 3 | 352 ± 5 | 8.2 ± 0.3 × 10⁻⁷ |
| x = 10 | −599 ± 5 | −331 ± 4 | 267 ± 7 | 1.0 ± 0.2 × 10⁻⁶ |
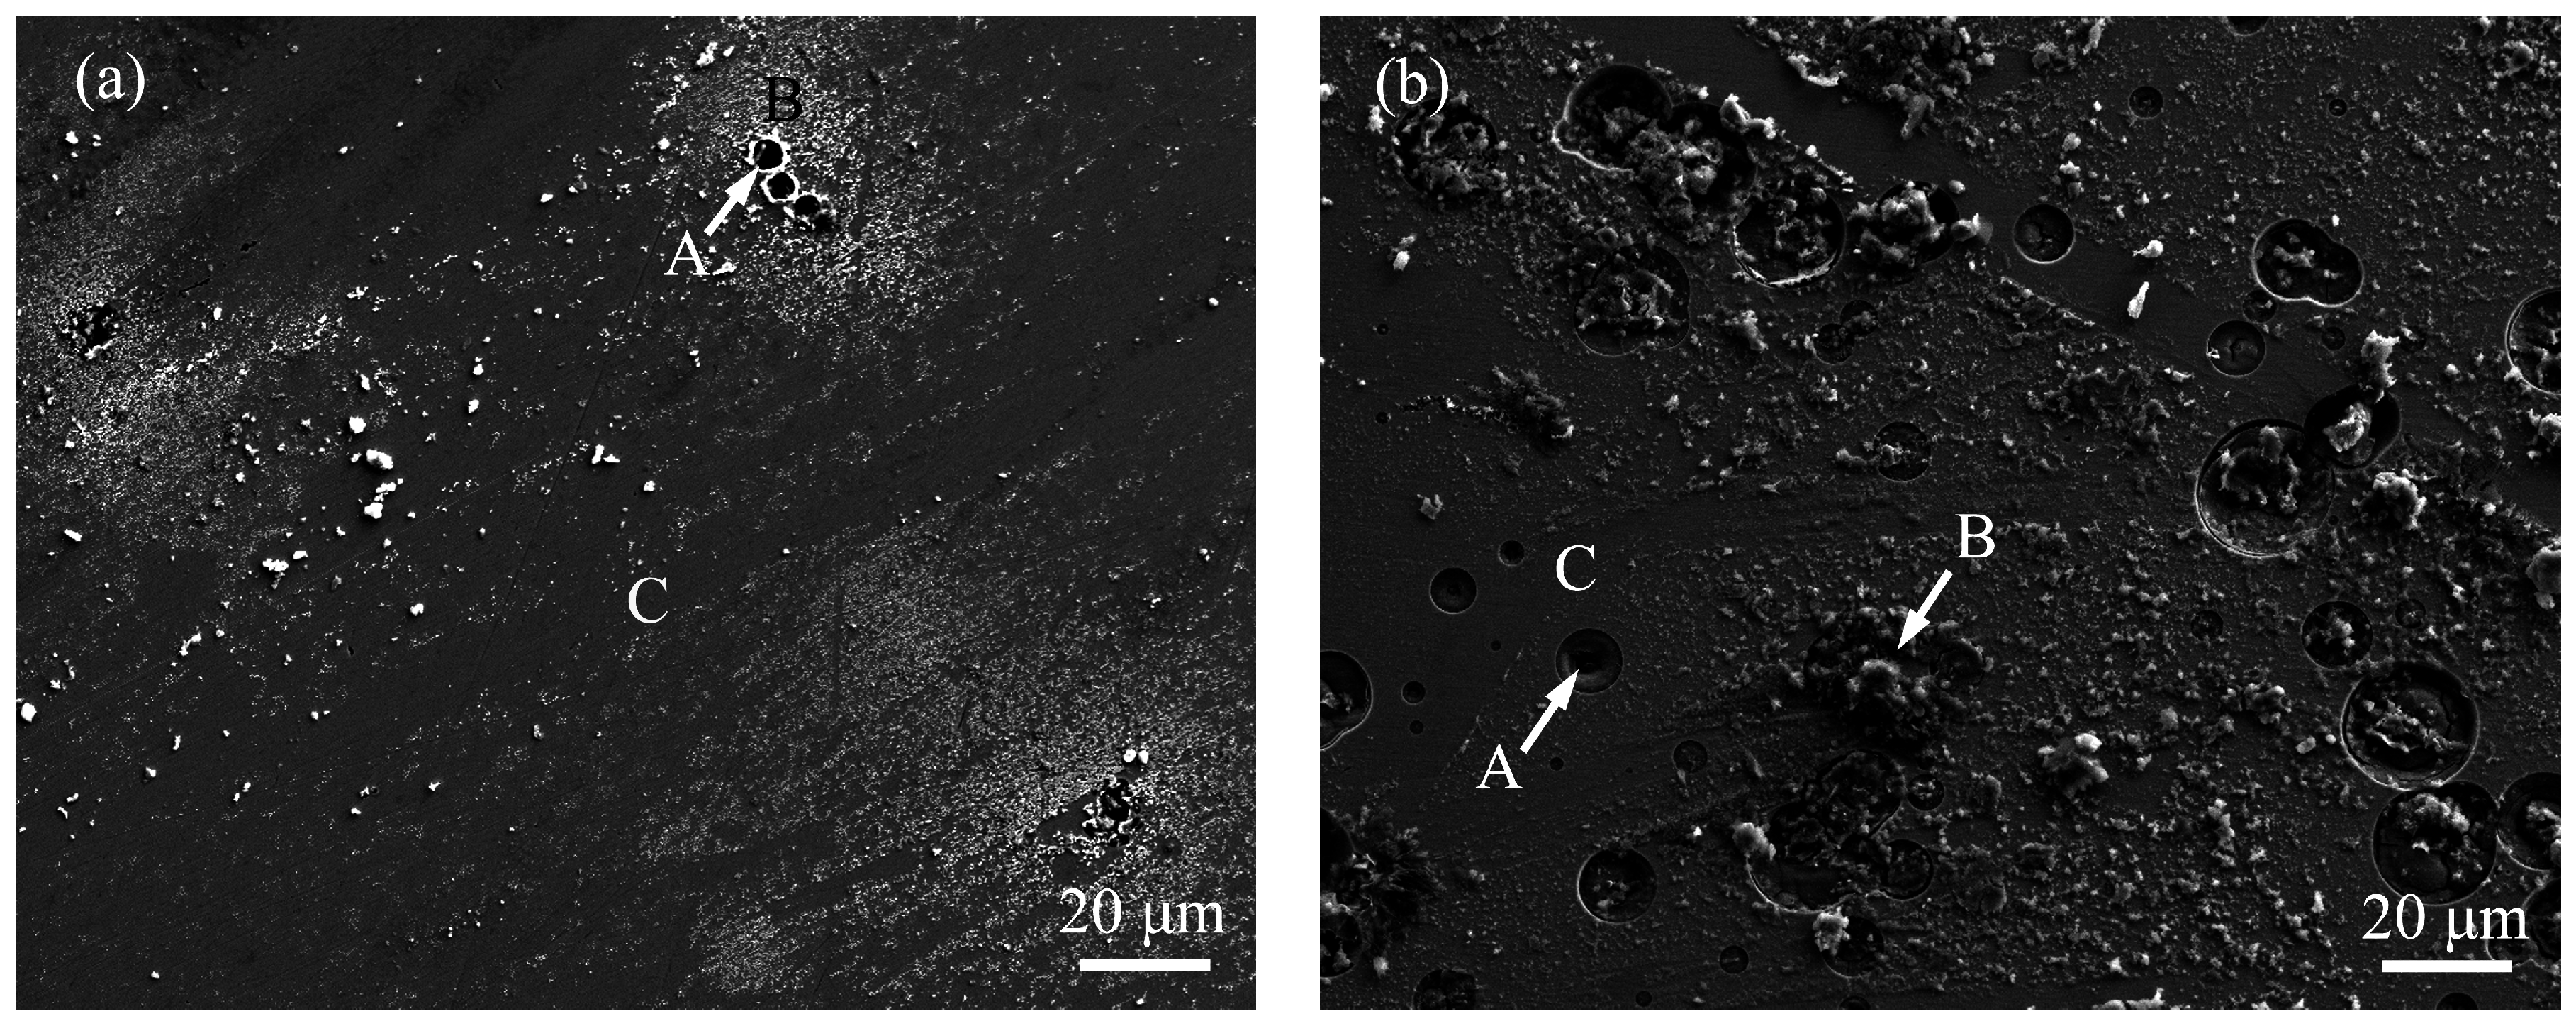
| Alloys | Region | Zr | Cu | Ni | Al | Ag | O | Cl |
|---|---|---|---|---|---|---|---|---|
| x = 0 | A | 54.23 | 13.45 | 6.72 | 2.31 | - | 22.27 | 1.02 |
| B | 52.81 | 7.56 | 5.98 | 2.07 | - | 28.15 | 3.43 | |
| C | 61.12 | 7.94 | 6.19 | 2.78 | - | 20.71 | 1.26 | |
| x = 5 | A | 48.83 | 14.62 | 6.40 | 1.96 | 3.14 | 23.70 | 1.35 |
| B | 47.33 | 8.24 | 6.87 | 2.18 | 2.69 | 29.42 | 3.27 | |
| C | 55.27 | 9.21 | 7.15 | 2.66 | 2.97 | 21.73 | 1.01 |
© 2016 by the authors; licensee MDPI, Basel, Switzerland. This article is an open access article distributed under the terms and conditions of the Creative Commons Attribution (CC-BY) license (http://creativecommons.org/licenses/by/4.0/).
Share and Cite
Zhou, W.; Zhang, C.; Sheng, M.; Hou, J. Glass Forming Ability and Corrosion Resistance of Zr-Cu-Ni-Al-Ag Bulk Metallic Glass. Metals 2016, 6, 230. https://doi.org/10.3390/met6100230
Zhou W, Zhang C, Sheng M, Hou J. Glass Forming Ability and Corrosion Resistance of Zr-Cu-Ni-Al-Ag Bulk Metallic Glass. Metals. 2016; 6(10):230. https://doi.org/10.3390/met6100230
Chicago/Turabian StyleZhou, Wei, Caiwei Zhang, Minqi Sheng, and Jixin Hou. 2016. "Glass Forming Ability and Corrosion Resistance of Zr-Cu-Ni-Al-Ag Bulk Metallic Glass" Metals 6, no. 10: 230. https://doi.org/10.3390/met6100230