
Effect of Welding Parameters on Microstructure and Mechanical Properties of Cast Fe-40Al Alloy

Bolvadin Vocational School, Afyon Kocatepe University, Afyonkarahisar 03300, Turkey
Metals 2016, 6(10), 229; https://doi.org/10.3390/met6100229
Submission received: 27 June 2016
/
Revised: 8 September 2016
/
Accepted: 20 September 2016
/
Published: 23 September 2016
(This article belongs to the Special Issue Intermetallics 2016)
Abstract
:Friction welding of cast Fe-40Al alloy was carried out at 1000 rmp for various friction times, friction pressures, and forging pressures. The microstructures of the interface of welded samples were analyzed by optical and scanning electron microscopy (SEM). Micrographs demonstrated that excellent welding formed continuously along the interface, except for samples welded for 3 s. Chemical compositions of the interface of the friction welded samples and of the fractured surface of all the specimens were determined using energy dispersive spectroscopy (EDS). After the welding process, shear tests were applied to the welded samples to determine the shear strength of joints. Test results indicated that the maximum shear strength was 469.5 MPa.
1. Introduction
Ordered intermetallic compounds are of interest for high-temperature applications because of their potential for high-temperature stability, high creep resistance, high melting point, and low density. Among the intermetallics, compounds based on the aluminides are of particular interest because of their oxidation resistance due to their ability to form protective oxide films on surfaces [1].
Iron aluminides based on Fe3Al and FeAl are excellent candidates to be used as structural materials for high-temperature service conditions. The advantages of these materials include their low cost, low density, and high sulfurizing and oxidizing resistance at high temperatures [2,3,4,5]. These advantages have enabled several potential uses, including heating elements, furnace fixtures, heat-exchanger piping, and sintered porous gas-metal filters, automobile and other industrial valve components, catalytic converter substrates, and components for molten salt applications [6]. However, these alloys have poor ductility at room temperature, as well as relatively poor high-temperature strength and creep resistance [7].
The development of a joining process is very important for the application of iron aluminides, but the study of welding and/or brazing iron aluminides is very limited in literatures. Joining of iron aluminides plays an important role in practical applications of such alloys. Welding of iron aluminides is difficult due to its inherent low-temperature ductility and poor weldability [8,9]. The low-temperature ductility depends on composition, quenching before testing, grain size, minor alloying additions, dopants on grain boundaries, test environment and strain rate. Grain size refinement is the most attractive way of improving both ductility and strength at the same time. For very fine grain sizes, which are obtained in the presence of dispersoid particles needed to retain the fine grain size, there is some debate about whether such dispersoids may lead to additional improvements in ductility [10,11,12].
Friction welding is one of the available joining techniques, and it has been used in metals and alloys [13,14,15,16,17,18,19,20,21]. Many researchers studied the friction welding of similar and dissimilar materials. Yılbas et al. examined the friction welding of aluminum to steel and copper [20]. They reported that tensile properties were improved for steel-aluminum when the intermetallic thickness extends only 0.2–1 µm; above this value, welds with poor strengths were produced. Tanaka et al. investigated the friction stir welding (FSW) of mild steel to aluminum alloys, and they expressed that the joint strength increased with reduction in the thickness of the intermetallic compound at the weld interface [21]. Watanable et al. studied the friction stir welding of aluminum to steel. They observed formation of a thin intermetallic compound at the upper region of the Fe/Al interface. This phase led to a decrease in the joint strength [22]. Pierpoalo et al. welded aluminum and copper by FSW. They reported that Al2Cu, AlCu, and Al3Cu4 phases formed during the friction stir welding process [23].
There have been several published works on the friction welding of Fe3Al-FeAl type alloys. Sketchley et al. investigated the friction welding of an Fe3Al-based oxide dispersion-strengthened (ODS) alloy and Inkson et al. studied on friction welding of Fe40Al Grade 3 ODS alloy. They achieved good bonding [24,25]. In addition, author and coworkers reported the successful friction welding of Fe3Al and dissimilar Fe-28Al alloy and AISI 316 L [26,27]. In this paper, cast Fe-40Al alloys were welded by friction welding under different conditions. Effect of welding parameters on the microstructure and mechanical properties of the cast Fe-40Al alloy were investigated.
2. Experimental Studies
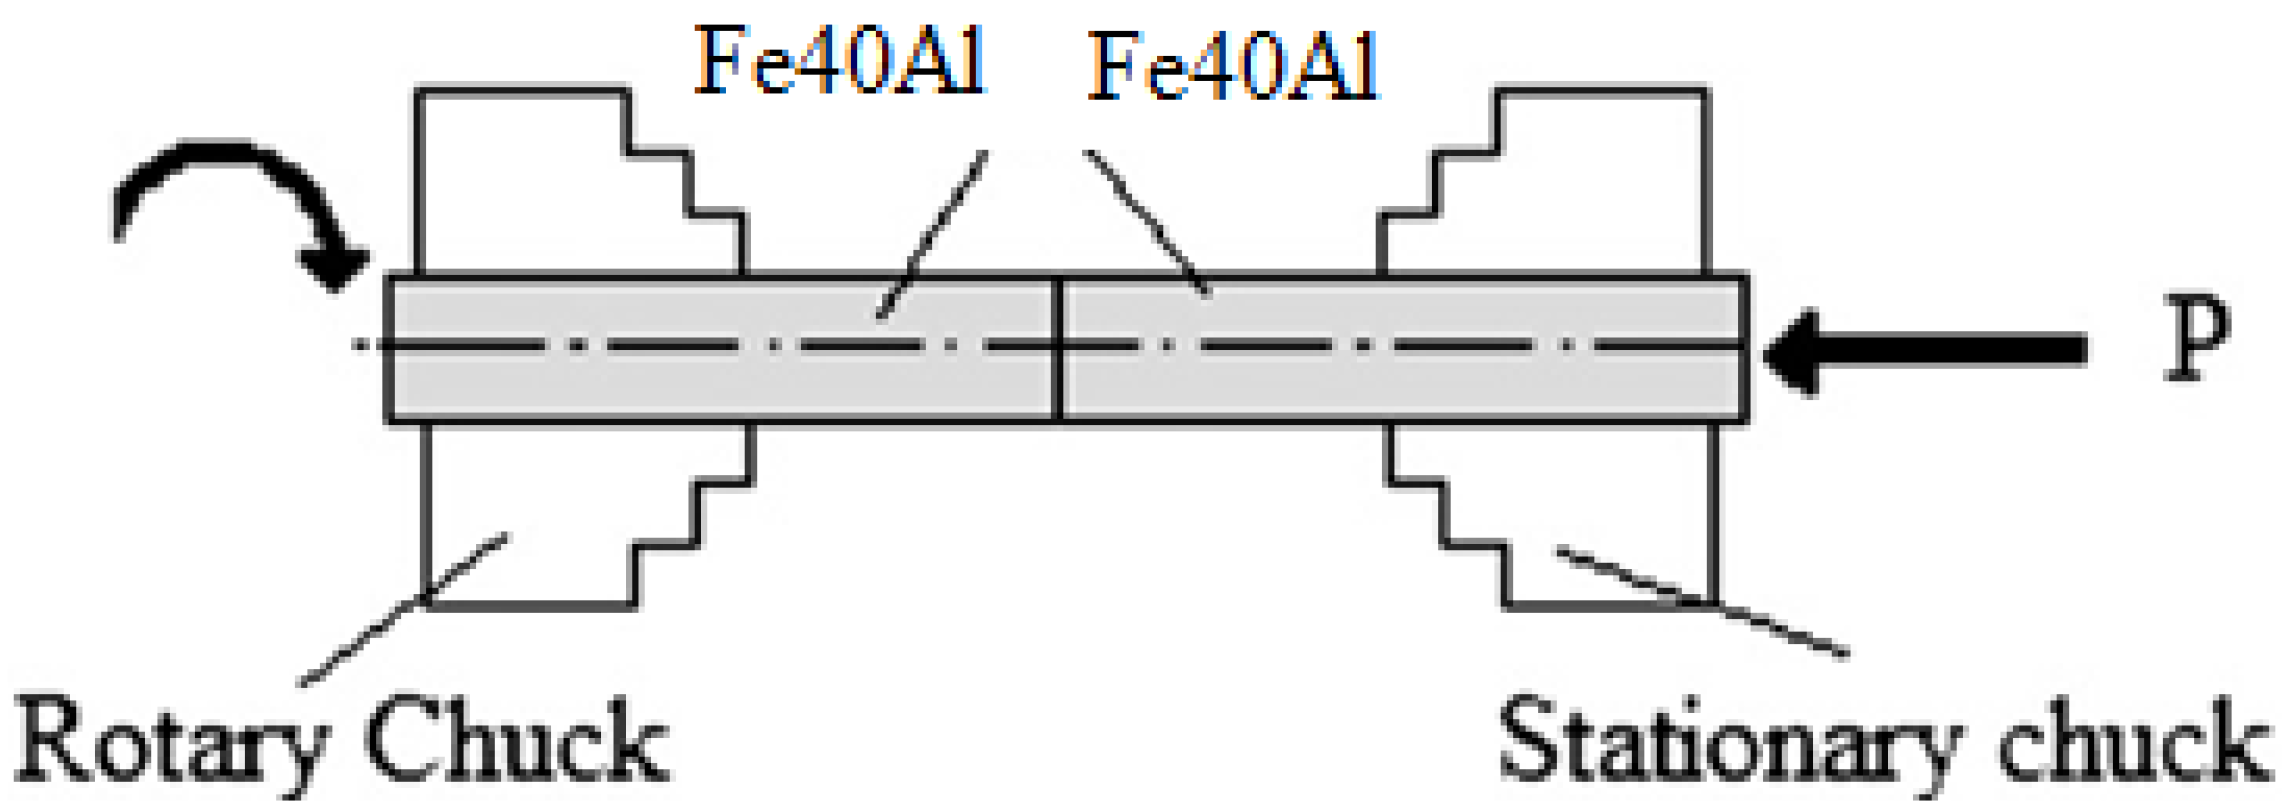
The Fe-40Al alloy was prepared with vacuum arc melting under an argon atmosphere from iron and aluminum with 99.99 wt. % and 99.7 wt. % purity, respectively. The samples were homogenized at 1100 °C for 50 h and cooled in a furnace. Cylindrical cast alloy samples 8 mm in diameter and 50 mm in length were prepared. The friction welding experiments were carried out by a continuous-drive friction welding machine [28] at different forging and friction pressures and friction times under a rotational speed of 1000 rmp (Table 1).
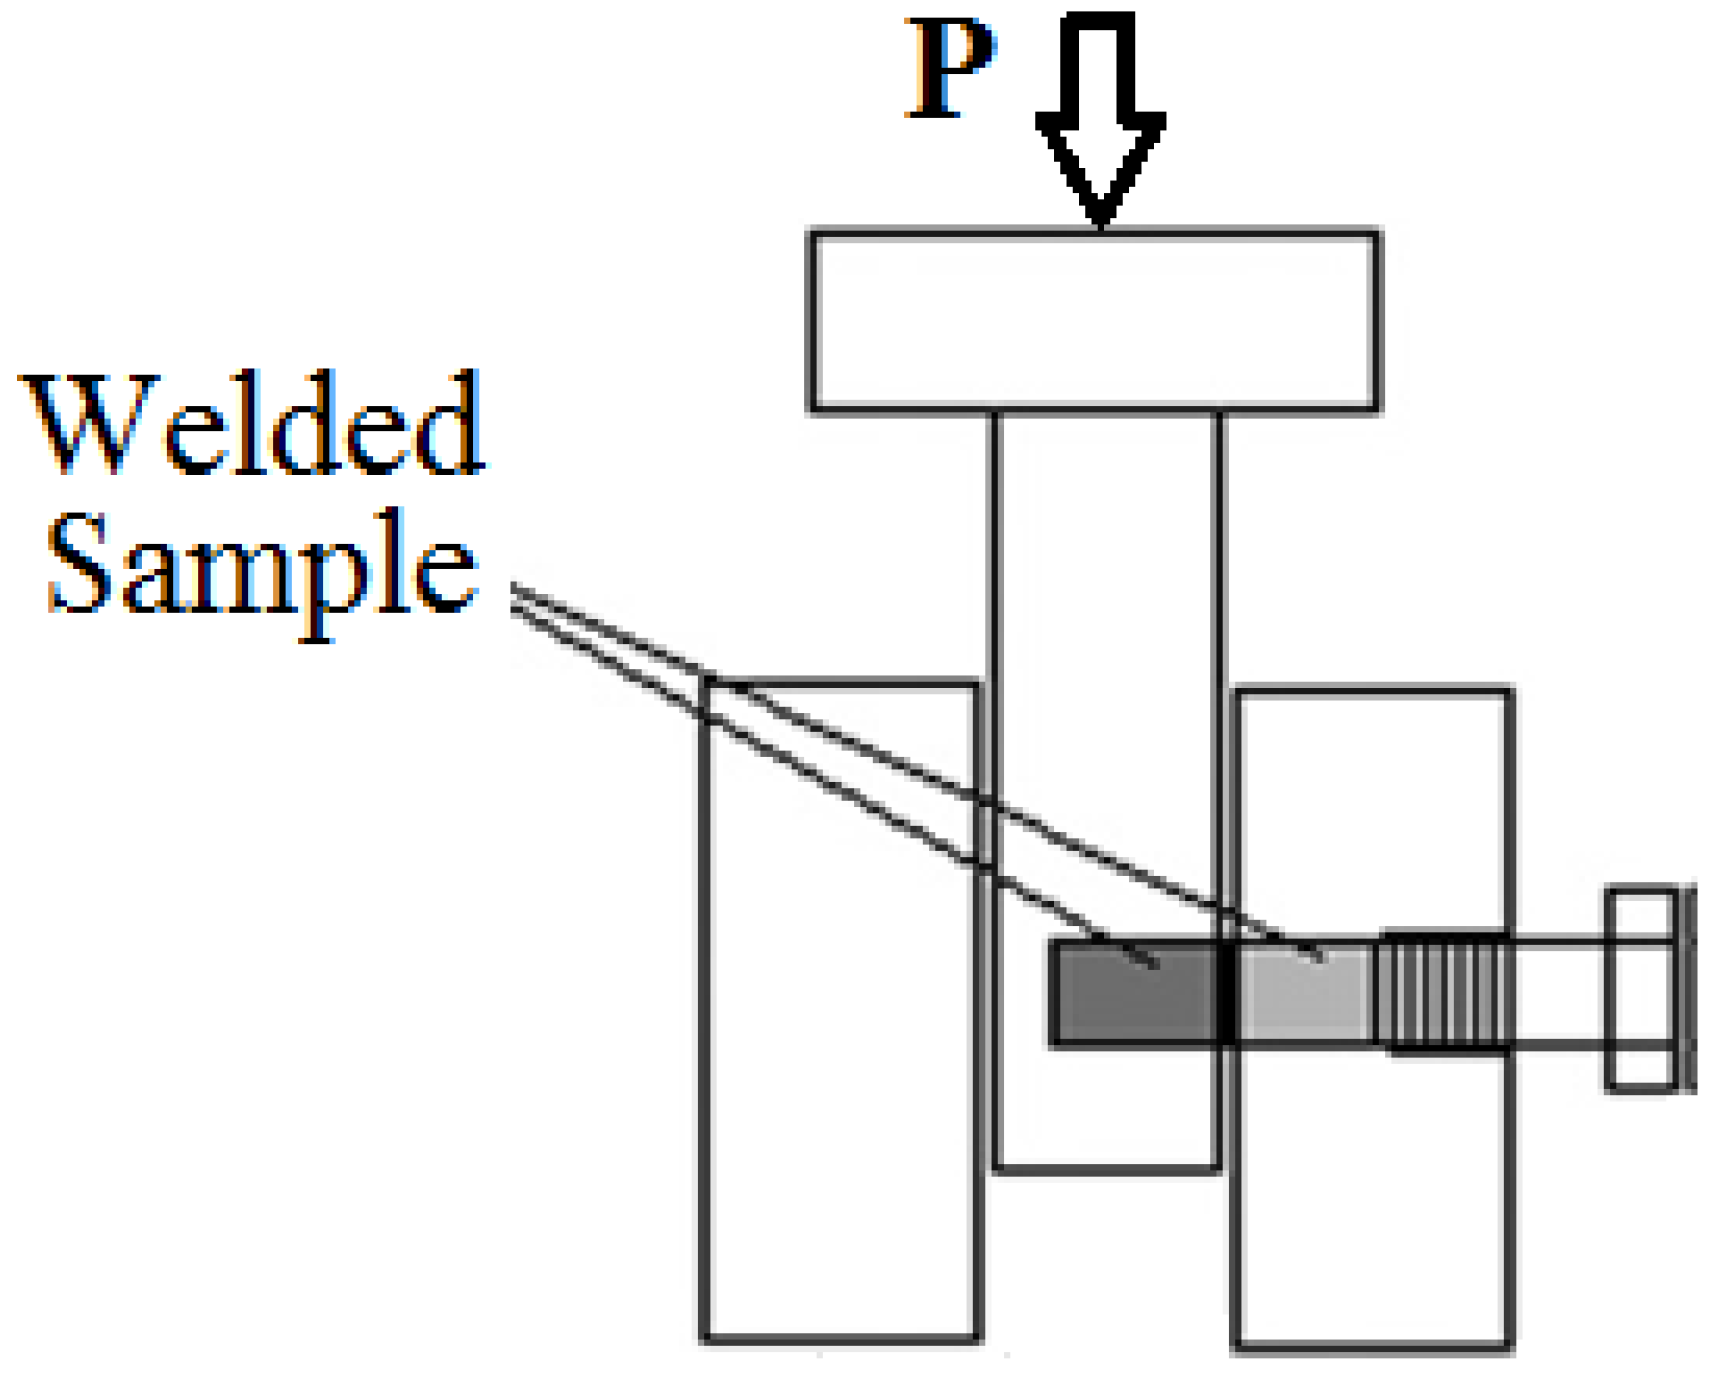
The friction welding process is given schematically in Figure 1. After welding, the welded samples were cut perpendicular to the welding interface. The surfaces of the welded samples were ground with 1200 grinding paper and polished with 1 µm diamond paste, then the samples were etched with a mixture consisting of H2O (30 mL), HNO3 (30 mL), HCl (20 mL), and HF (20 mL). The microstructures were observed under light microscopy (AKÜ, Afyonkarahisar, Turkey) and scanning electron microscopy (SEM, AKÜ, Afyonkarahisar, Turkey). The chemical compositions of the weld zone and the base alloy were determined by using energy dispersive spectroscopy (EDS, AKÜ, Afyonkarahisar, Turkey). Microhardness values were measured on the welded samples by means of Vickers indenter with a load of 100 g.
Shear tests were performed to determine the strength of the weld interface using an electromechanical universal test machine (Shimadzu AG-IS-250, OGÜ, Eskisehir, Turkey) at room temperature. A specially designed specimen holder (Figure 2) was used to measure the shear strength. Three samples were tested for each welding condition. The fractured surfaces of the welds were observed by SEM.
3. Results and Discussion
3.1. Microstructure
Grain size of the samples was very large because samples were homogenized at 1100 °C for 50 h (Figure 3 and Figure 4). As a result of this situation, ductility of the samples might be decreased. Poor ductility influences welding quality of the friction welded Fe-Al alloy. However, the effect of poor ductility on the welding quality of the friction welding of FeAl alloy has not been reported in the literature up to now. Flash formation was observed in all welded samples because of plastic deformation during welding. Friction and forging pressure and friction time play important roles in flash formation. The burn-off increased with increase in the forging pressure. More plastic deformation occurs because of the higher friction pressure and the longer friction time, which produce higher heat in the weld interface. Thus, the burn-off (axial shortening) increases with the increase in plastic deformation (Table 1). Microstructural observation was carried out for the weld interface using both an optical and a scanning electron microscope with energy dispersive spectroscopy. Figure 3 shows the optical micrographs of the weld interface of welded samples for different experimental conditions.
As seen in Figure 3a, large voids were observed at the welding interface of the welded samples for 3 s under 70 MPa friction pressure. Other welded samples were of sound quality and they did not exhibit any voids or crack formation along the weld interface (Figure 3b–d). The friction time of 3 s is not enough to generate the required heat for friction welding. Therefore, these welded samples exhibited large voids at the welded interface.
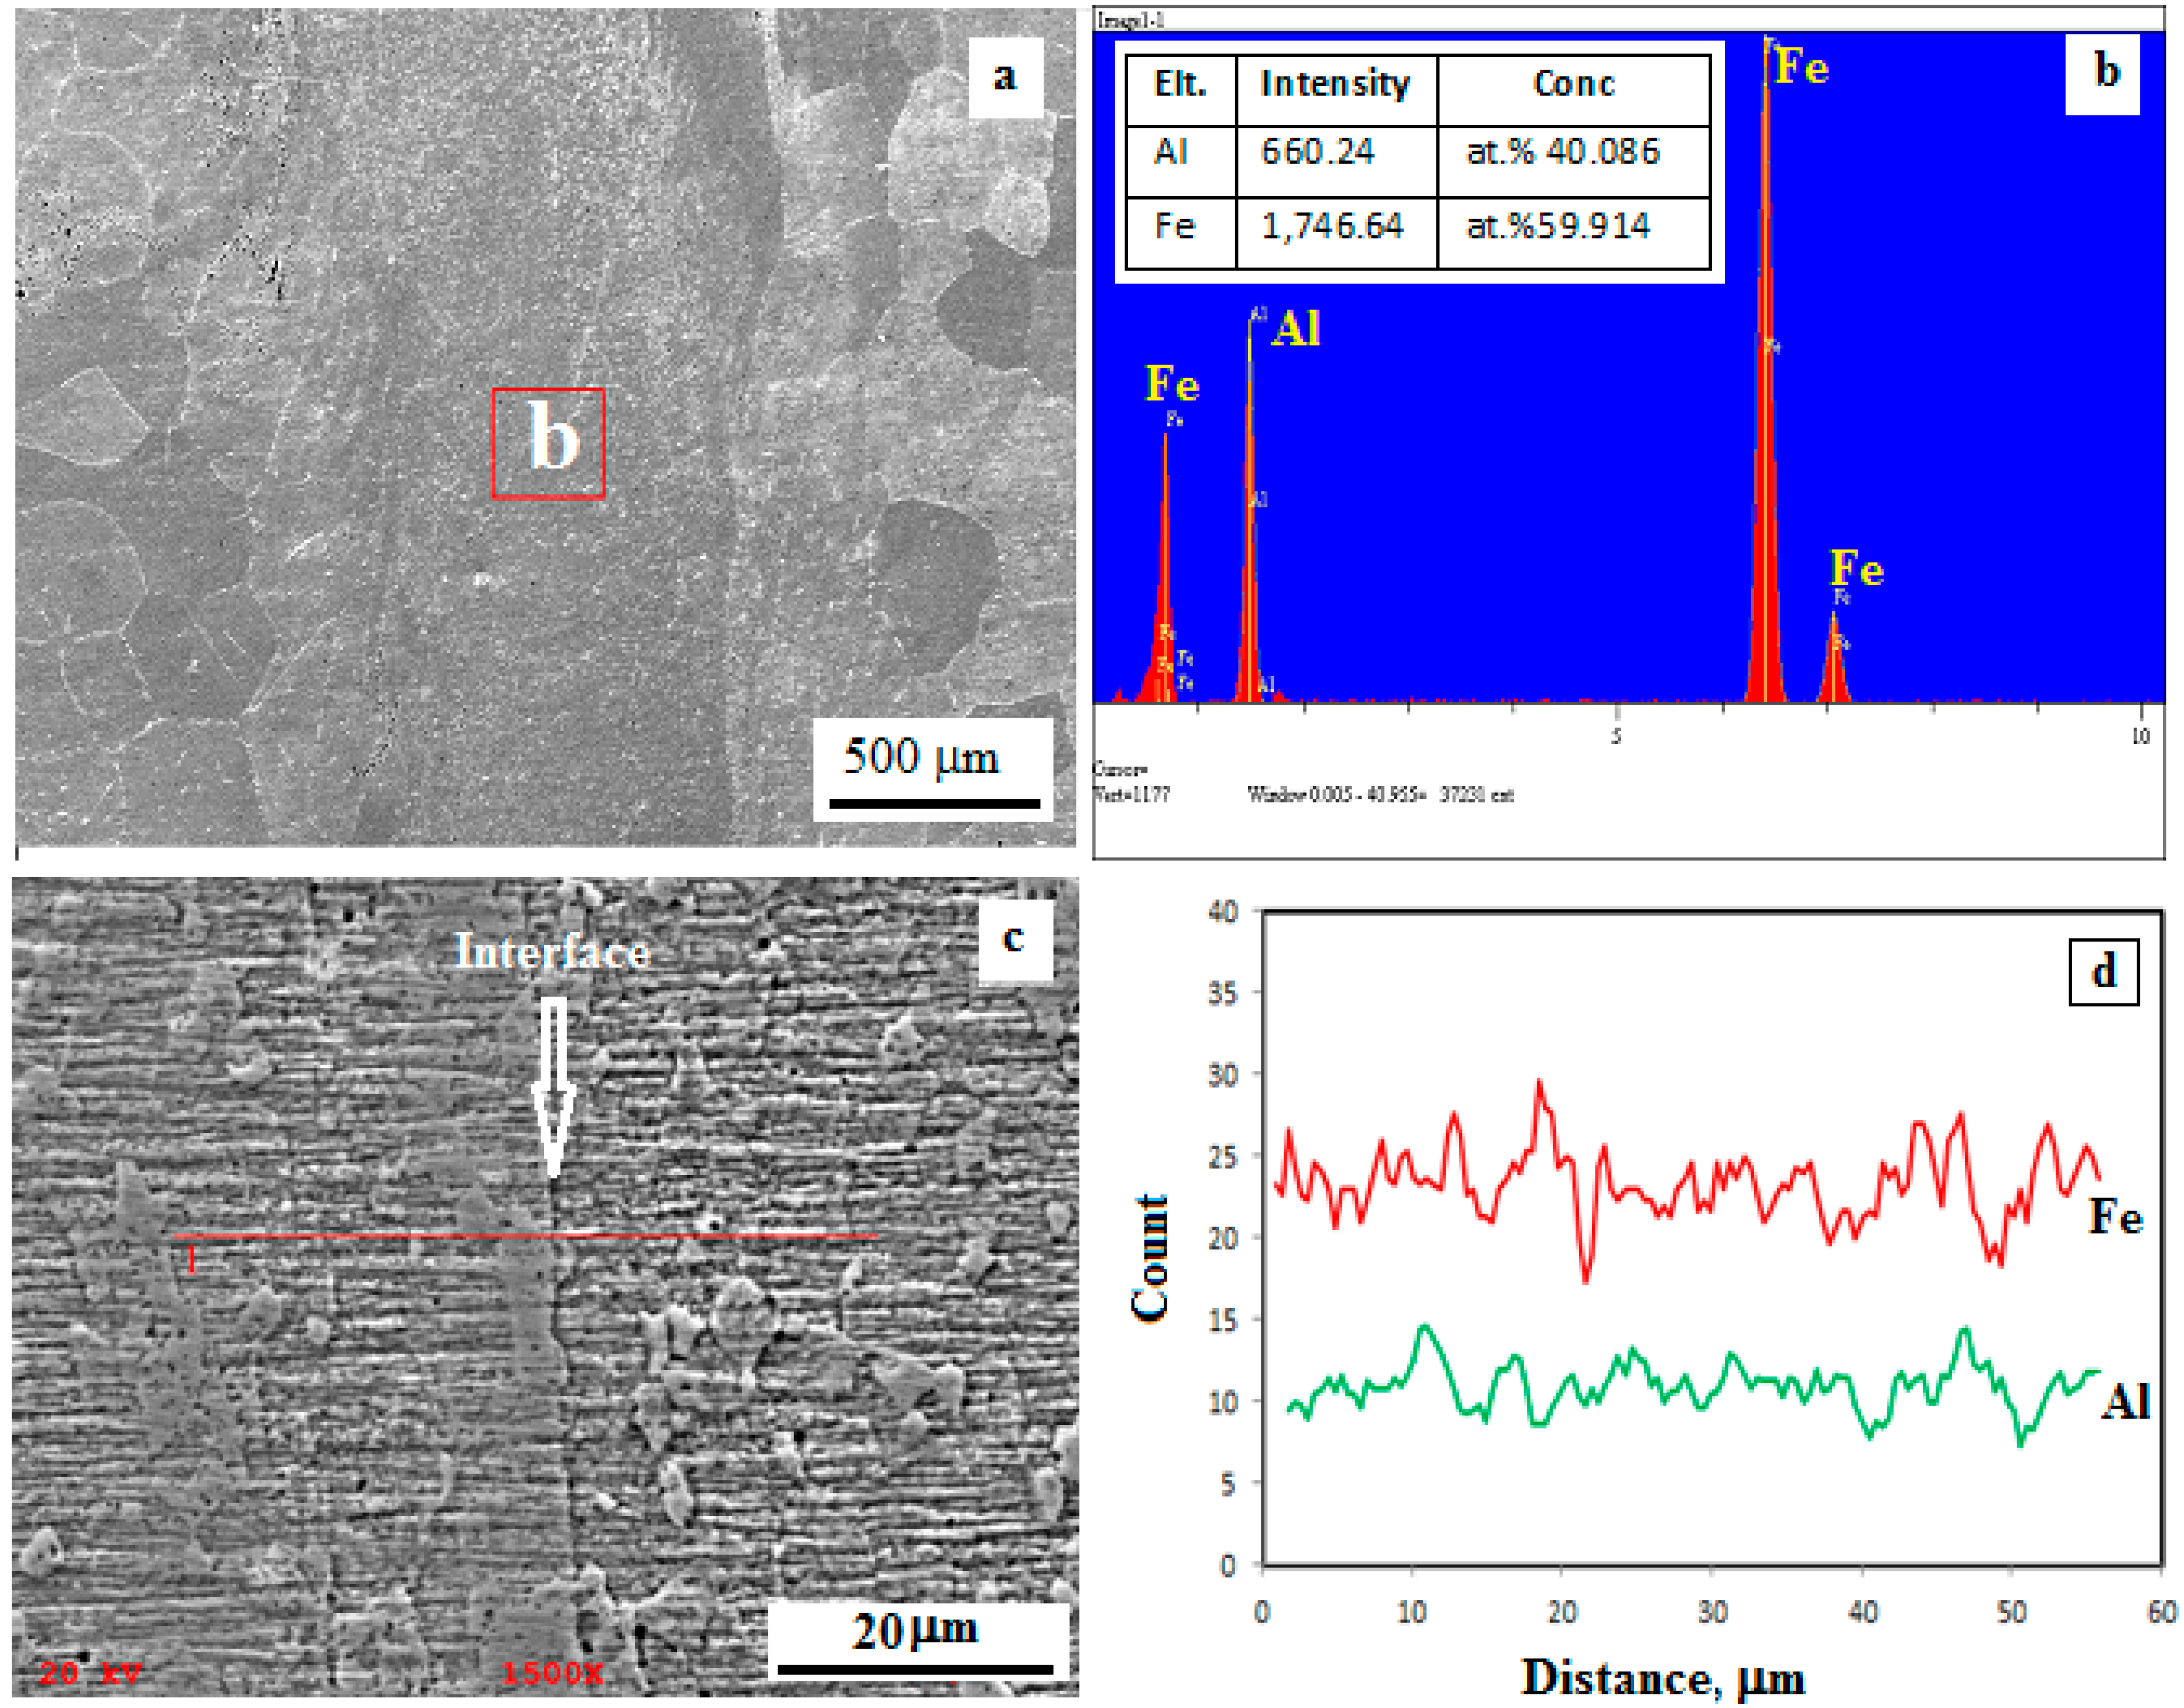
Two main regions are observable at the interface of all of the welded samples: a dynamically recrystallized zone with very fine grains and a plastically deformed zone (Figure 3b–d). Friction welding involves heavy plastic working at higher temperatures close to the melting point of the base materials. This plastic deformation introduces large number of dislocations in materials. As the density of these dislocations increases, they tend to form subgrain cell structure. These low-angle grains rotate to form high-angle strain-free grains resulting in a zone of very fine equiaxed grains compared to the base materials [29,30]. The width of the recrystallized zone for all of the welded samples was approximately between 400 and 600 µm. The micrographs demonstrate an increase in the width of the recrystallized and the deformed zones with an increase in the friction time and pressure. It is known that some intermetallic phases may form at the welding interface for dissimilar materials joined by the friction welding and the friction stir welding [19,20,21,22,23]. However, similar materials joined by the friction welding may have the same chemical compositions with base alloy at the welding interface [26]. SEM-EDS area analysis was done to determine chemical composition at the weld zone of the welded samples. The analysis revealed the composition of alloy elements at the weld zone (Figure 4a,b). Also, a detailed line-scan analysis of the weld zone is given in Figure 4c,d. Analysis results indicate that compositions of welded zone and the base alloy are similar. There was not any change in the chemical composition of the weld zone of the welded samples due to welding of similar alloy. The analysis results confirmed this finding.
3.2. Mechanical Properties
Microhardness values of the welded samples under 140 MPa friction pressure and 200 MPa forging pressure from the weld center to a side are given in Figure 5 and Figure 6. According to the results of the measurements, microhardness profiles for all welding times are found to be similar.
Hardness of the recrystallized zone is higher than that of the base alloy due to formation of very fine grains. In addition, hardness of the recrystallized zone can be increased by vacancy hardening due to rapid cooling from a high temperature after friction welding [11,12].
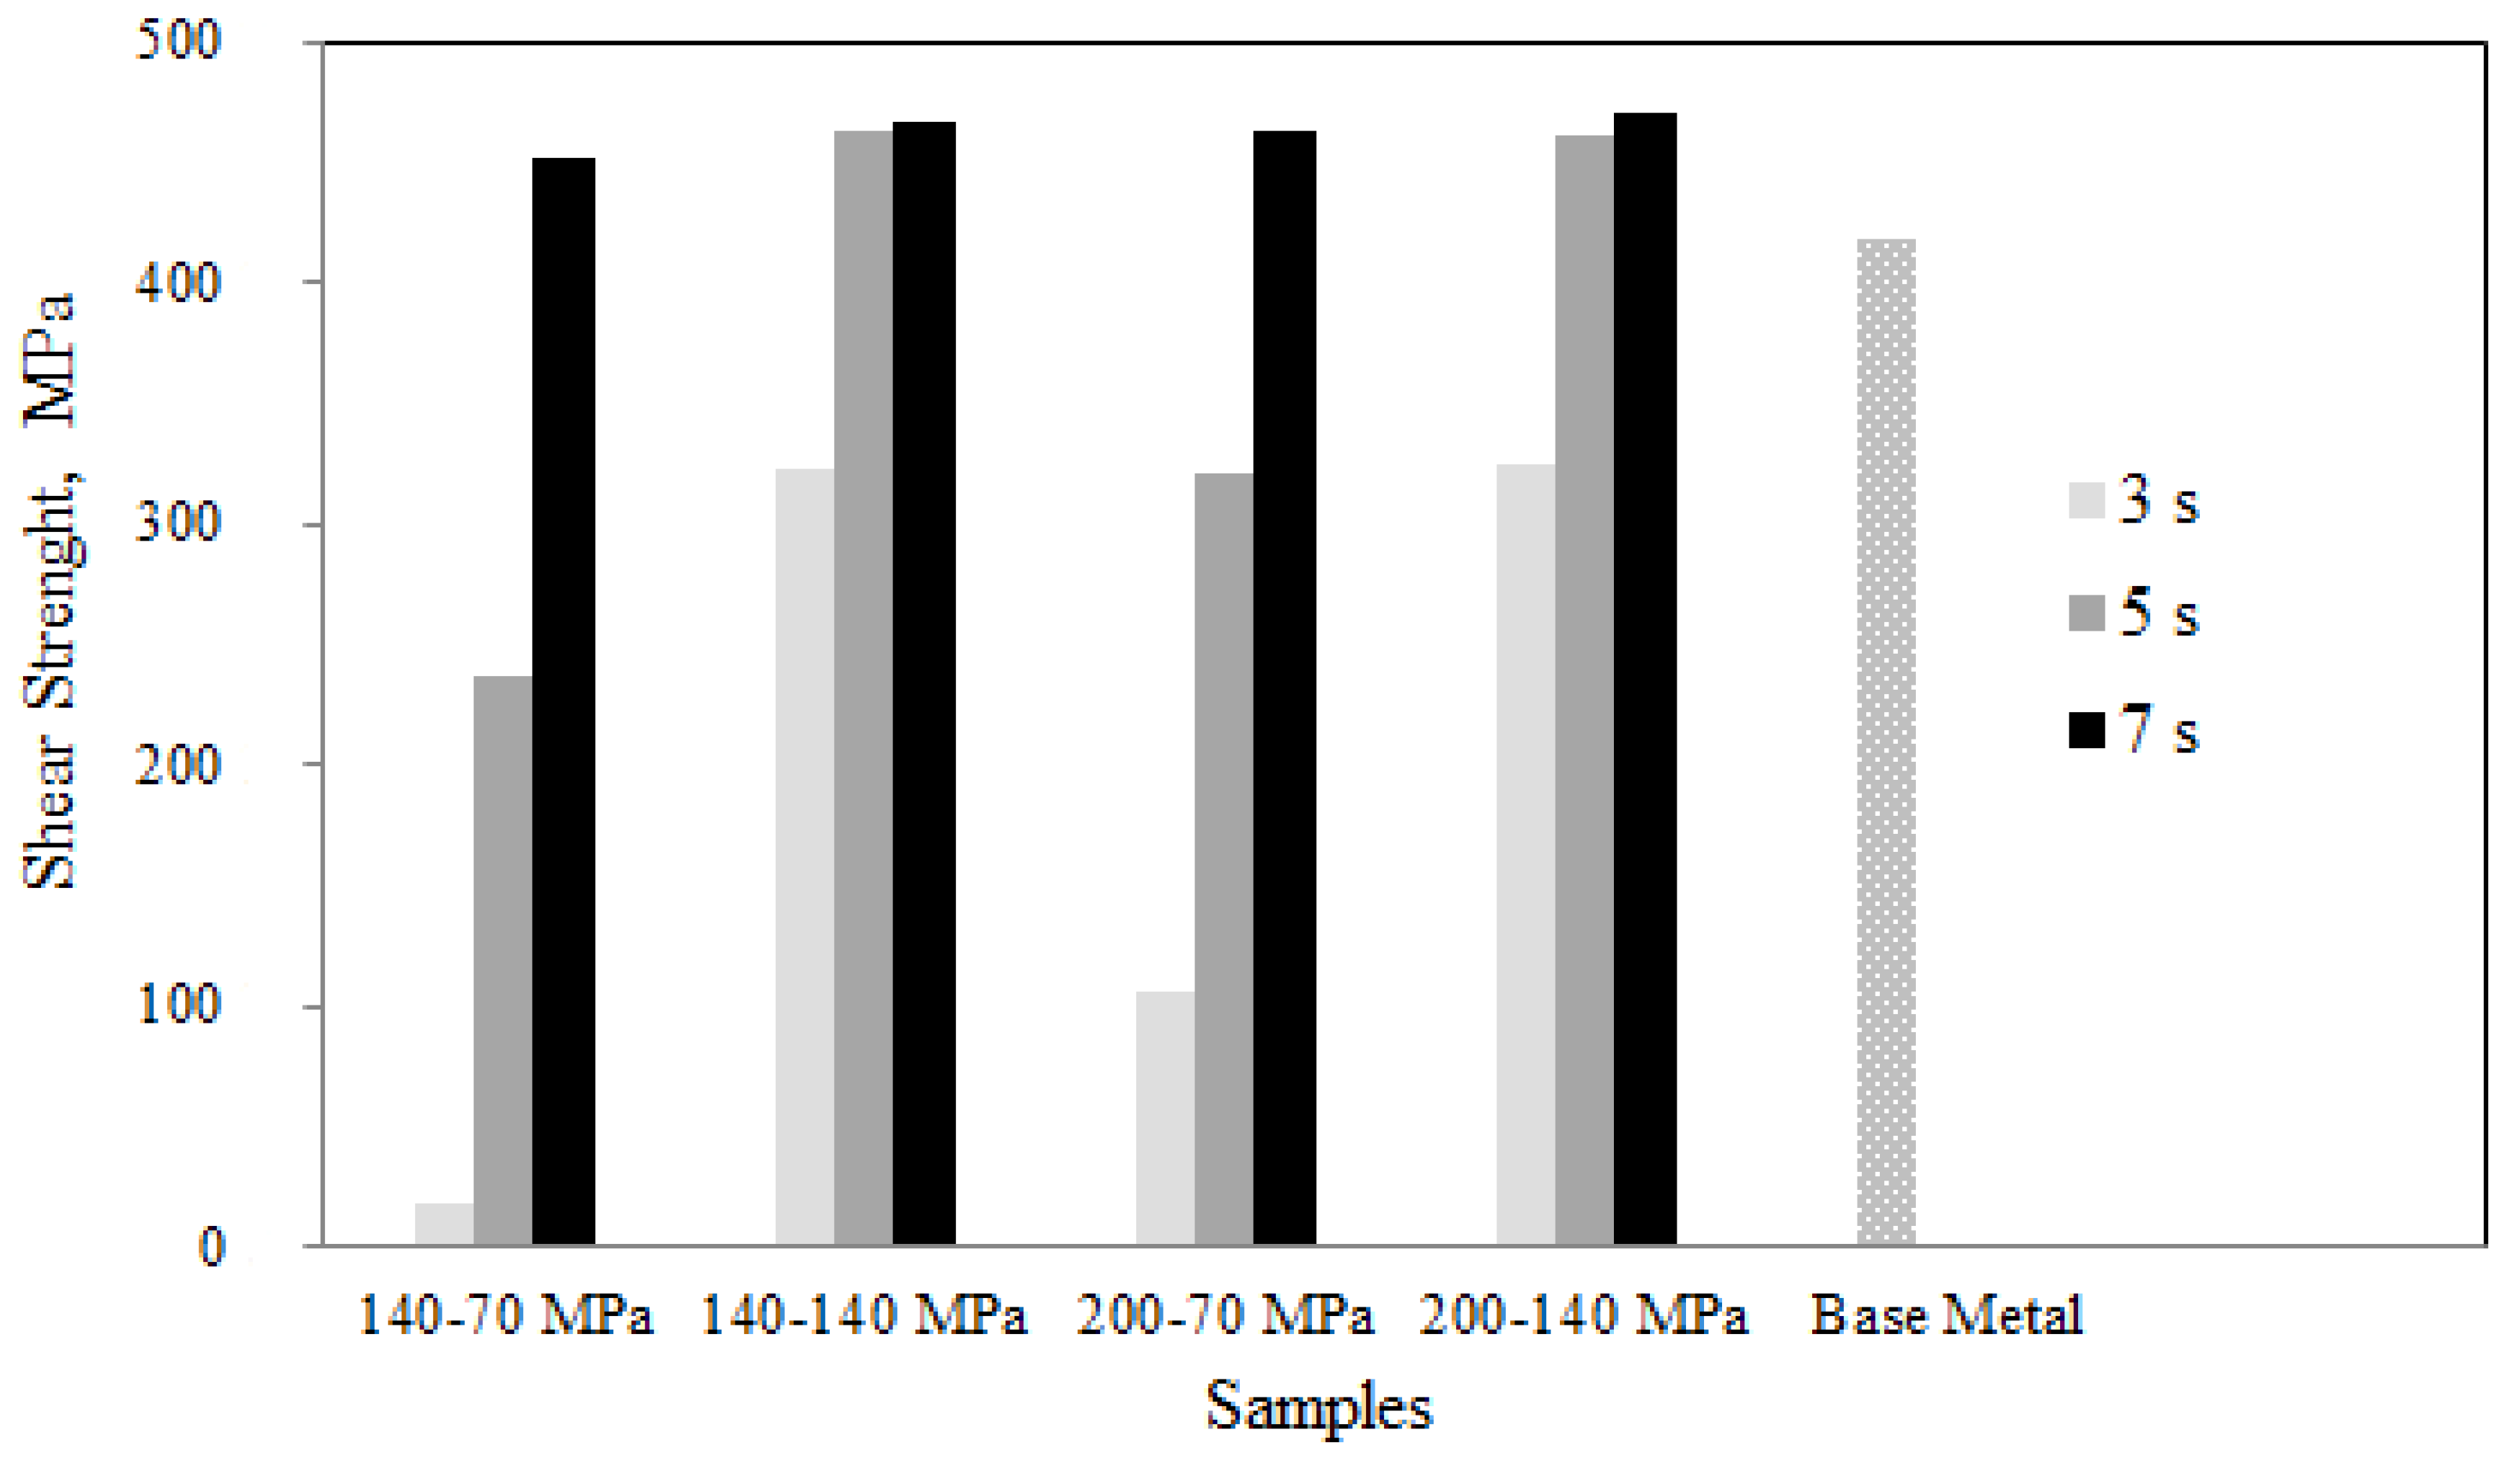
The shear strengths of weld interface of welded samples were determined by using a specially designed testing apparatus. The shear of the welds and the base alloy are shown in Figure 7. Test results demonstrated that the values of the shear strength of the welded samples increased with increasing of the friction time and friction pressure. It can be argued that the shear strength of welds was dependent on the friction time and pressure under the experimental conditions. The shear strength of welded samples for 3 s is much lower due to large voids at the welding interface. The forging pressure affected the shear strength values of the welded samples for 3 and 5 s under friction pressure of 70 MPa. The shear strength values increased with an increase in forging pressure for these times. However, the shear strength of the welds did not show an important change in other welding conditions. Under constant forging pressure conditions, the shear strength of the welds increased with increasing friction pressure. This observation indicates that the increase in the shear strength is related to the magnitude of the accumulated heat input, which depends on the friction time for low and high friction pressures. Test results demonstrate that the shear strength values of the welds are greater than that of the base metal. This situation shows that the structure with very fine grains formed due to dynamic recrystallization during the friction welding has higher strength than the matrix.
3.3. Fractographs
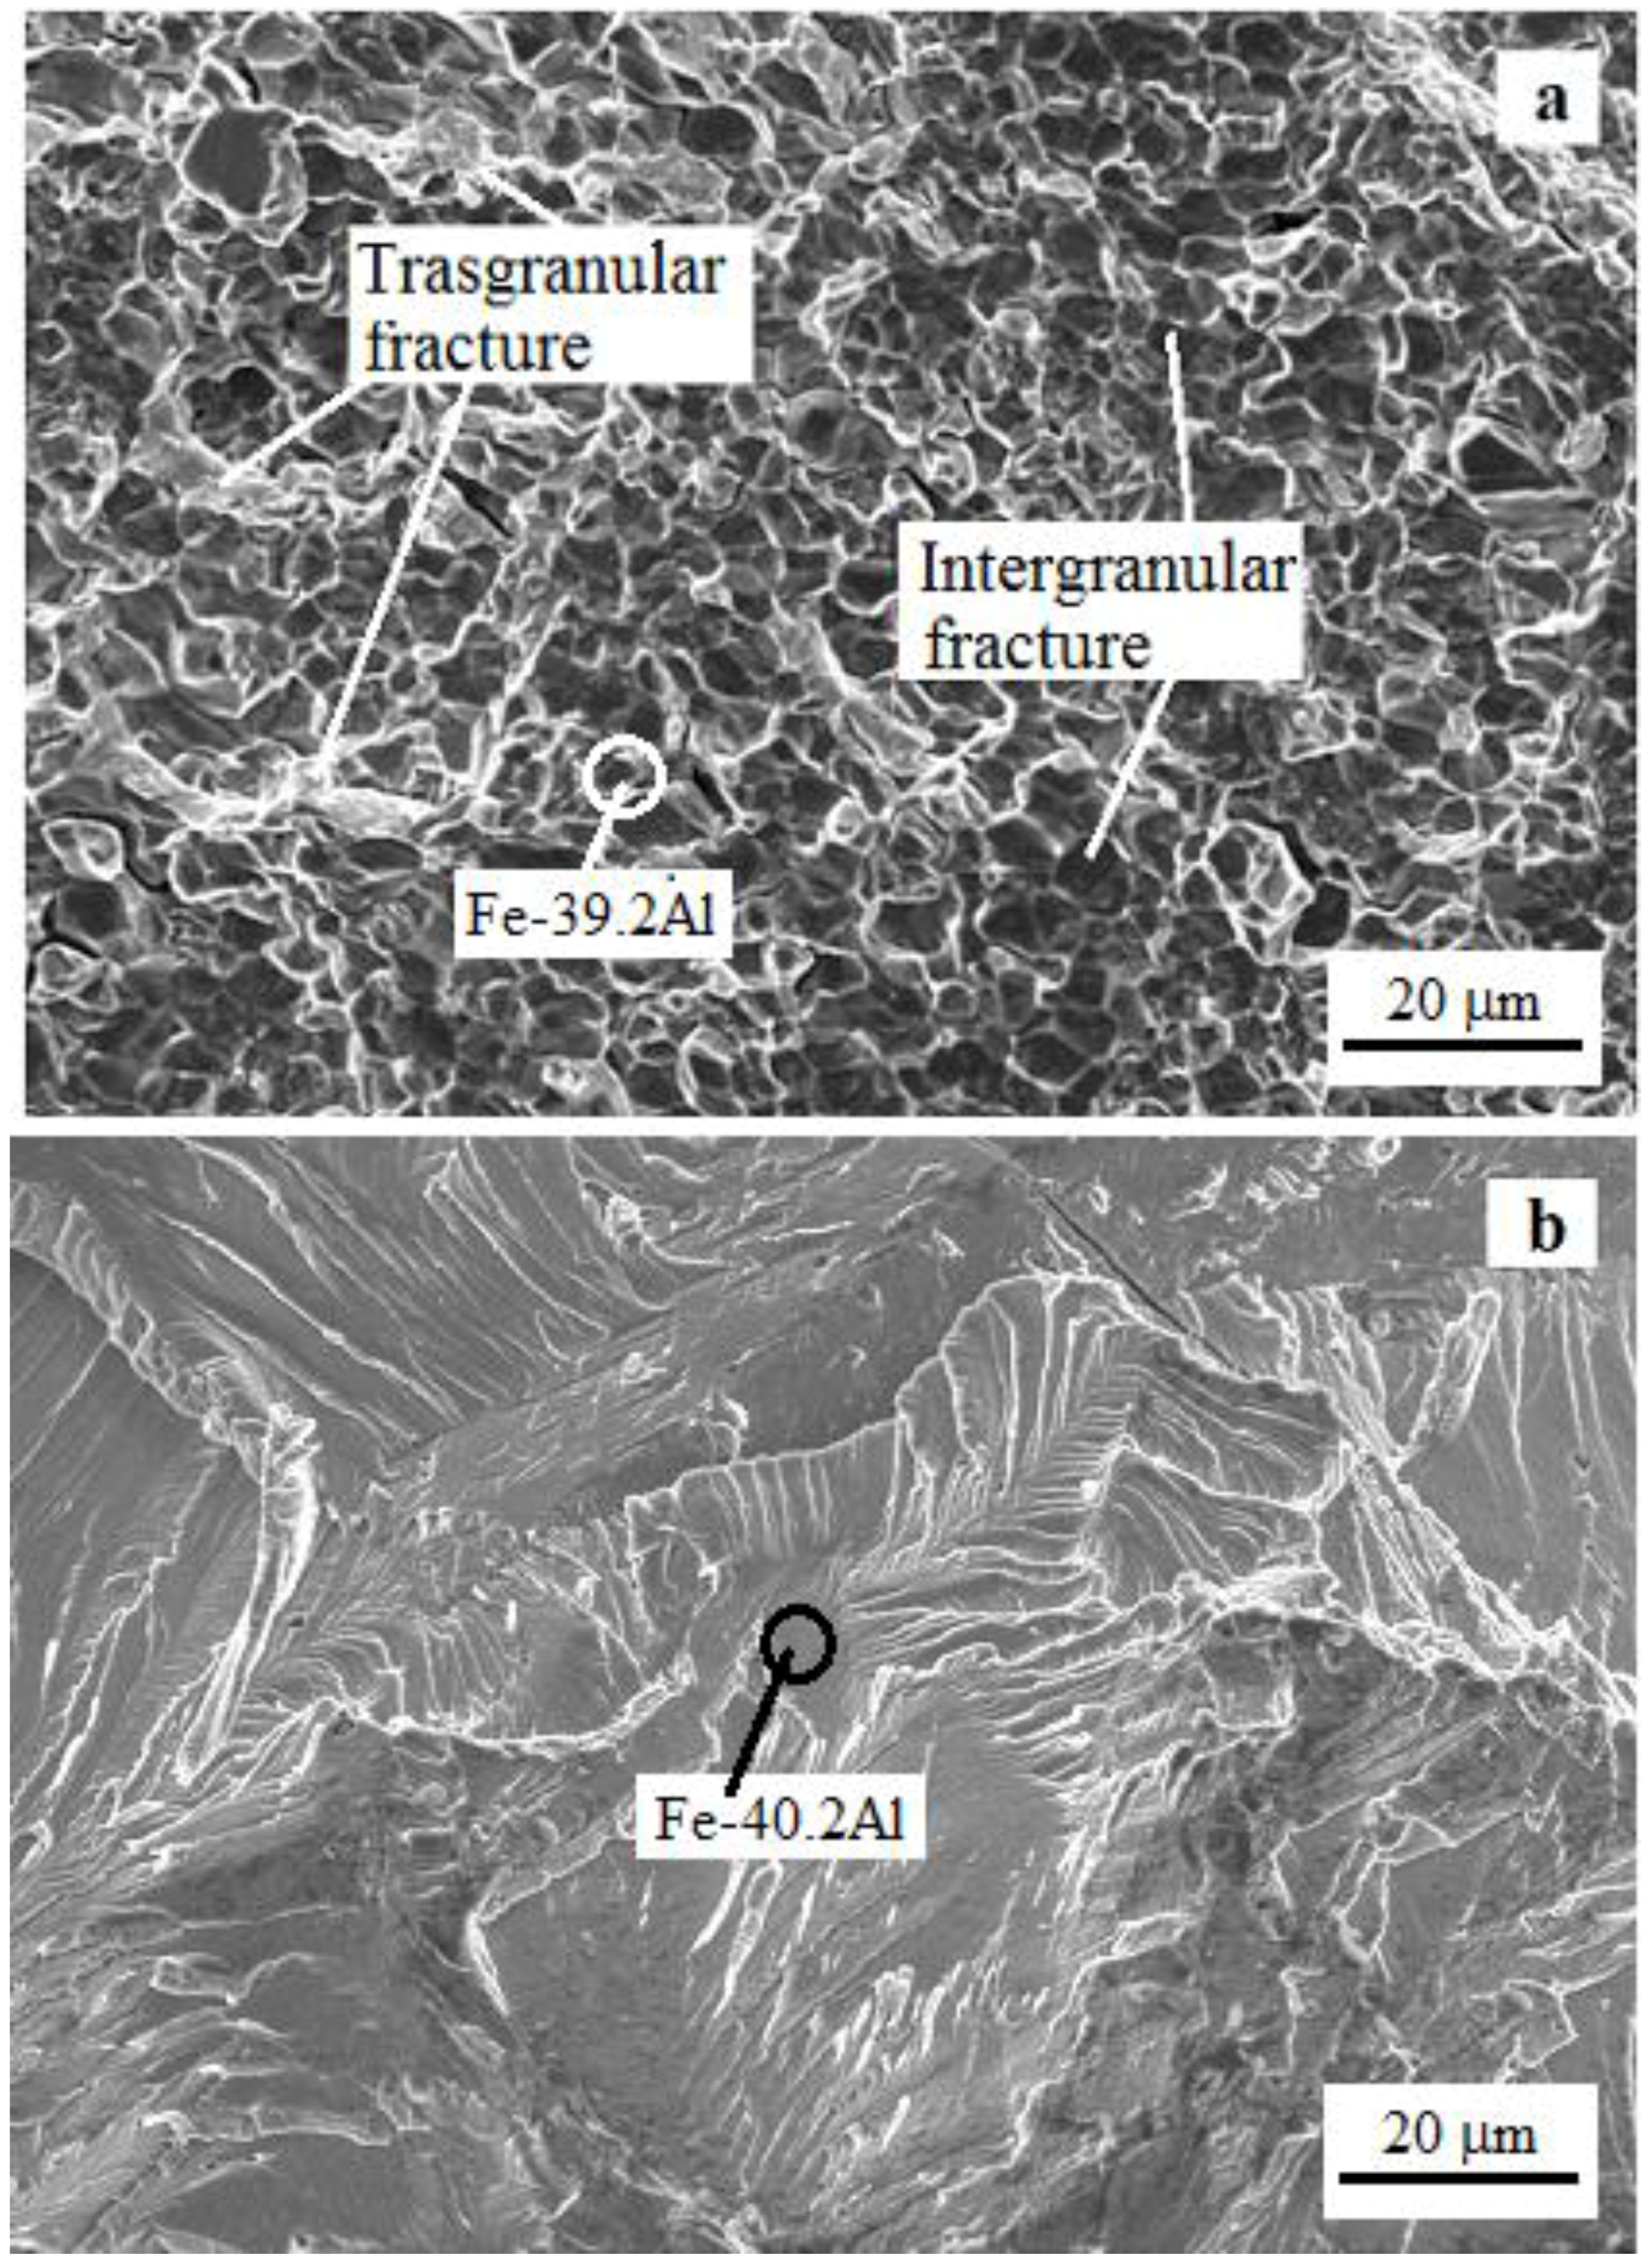
The SEM fractographs of the fractured surface of the welded sample for 7 s under 140 MPa friction pressure and 140 MPa forging pressure and the base metal are shown in Figure 8. The welded samples were inserted into the testing apparatus to fracture from the weld interface during the shear test. The shearing process was performed out the weld interface of the welded samples. Fractographs show that the fractured surface of welded sample has very fine grains with respect to the base alloy (Figure 8a). This finding confirms that failure took place at the recrystallized zone during the shear test. EDS analysis taken from the fractured surface revealed that the Fe and Al atoms exist on the fractured surfaces of welded sample for 7 s under 140 MPa friction pressure and 200 MPa forging pressure.
4. Conclusions
In this study, cast Fe-40Al alloy was welded under different conditions by friction welding method. Microstructure studies showed the presence of two different regions at the weld interface: the recrystallized zone and the deformed zone. There was variation in the width of the recrystallized zone and the deformed zone with an increase in the friction time and pressure. Analysis results indicate that compositions of welded zone and the base alloy are similar. There was no change in the chemical composition of the weld zone of the welded samples due to welding of similar alloy. The microhardness profiles for all the friction welding times and pressures were similar. Hardness of the recrystallized zone is higher than that of the base alloy due to the formation of very fine grains and vacancy hardening. The shear strengths of the welds increased with increase in the process time and friction pressure. The maximum shear strength was 469.5 MPa. The best welding parameter combination was found to be a friction pressure of 140 MPa, a forging pressure of 200 MPa, and a friction time of 7 s.
Acknowledgments
The author is grateful to Afyon Kocatepe University Scientific Research Committee since this study is supported (Project No.: 10.BOLMYO.01).
Conflicts of Interest
The author declares no conflict of interest.
References
- Pank, D.R.; Nathal, M.V.; Koss, D.A. High Temperature Ordered Intermetallics Alloys III; Liu, C.T., Taub, A.I., Stoloff, N.S., Koch, C.C., Eds.; Materials Research Society: Pittsburgh, PA, USA, 1988; pp. 561–565. [Google Scholar]
- Liu, C.T.; Stringer, J.; Mundy, J.N.; Horton, L.L.; Angelini, P. Ordered intermetallic alloys: An assessment. Intermetallics 1997, 5, 579–596. [Google Scholar] [CrossRef]
- Stoloff, N.S.; Liu, C.T.; Deevi, S.C. Emerging applications of intermetallics. Intermetallics 2000, 8, 1313–1320. [Google Scholar] [CrossRef]
- Deevi, S.C.; Sikka, V.K.; Liu, C.T. Processing, properties, and applications of nickel and iron aluminides. Progress. Mater. Sci. 1997, 42, 177–179. [Google Scholar] [CrossRef]
- Deevi, S.C.; Swindeman, R.W. Yielding, hardening and creep behavior of iron aluminides. Mater. Sci. Eng. A 1998, 258, 203–210. [Google Scholar] [CrossRef]
- Stoloff, N.S. Iron aluminides: Present status and future prospects. Mater. Sci. Eng. A 1998, 258, 1–14. [Google Scholar] [CrossRef]
- McKamey, C.G.; DeVan, J.H.; Tortorelli, P.F.; Sikka, V.K. A review of recent developments in Fe3Al based alloys. J. Mater. Res. 1991, 6, 1779–1805. [Google Scholar] [CrossRef]
- Fasching, A.A.; Ash, D.I.; Edwards, G.R.; David, S.A. Hydrogen cracking behavior in an iron aluminide alloy weldment. Scr. Metall. 1995, 32, 389–396. [Google Scholar] [CrossRef]
- Lee, Y.L.; Shiue, R.K.; Wu, S.K. The microstructural evolution of infrared brazed Fe3Al by BNi-2 braze alloy. Intermetallics 2003, 11, 187–195. [Google Scholar] [CrossRef]
- Morris, D.G.; Chao, J.; Garcia Oca, C.; Morris-Munnoz, M.A. Obtaining good ductility in an FeAl intermetallic. Mater. Sci. Eng. A 2003, 339, 232–240. [Google Scholar] [CrossRef]
- Morris, D.G.; Morris-Munnoz, M.A. The infuence of microstructure on the ductility of iron aluminides. Intermetallics 1999, 7, 1121–1129. [Google Scholar] [CrossRef]
- Morris, D.G.; Gutierrez-Urrutia, I.; Morris-Munnoz, M.A. Evolution of microstructure of an iron aluminide during severe plastic deformation by heavy rolling. J. Mater. Sci. 2008, 43, 7438–7444. [Google Scholar] [CrossRef]
- Ozdemir, N. Investigation of the mechanical properties of friction-welded joints between AISI 304L and AISI 4340 steel as a function rotational speed. Mater. Lett. 2005, 59, 2504–2511. [Google Scholar] [CrossRef]
- Ateş, H.; Turker, M.; Kurt, A. Effect of friction pressure on the properties of friction welded MA956 iron-based superalloy. Mater. Des. 2007, 28, 948–953. [Google Scholar] [CrossRef]
- Tao, B.H.; Li, Q.; Zhang, Y.H.; Zhang, T.C.; Liu, Y. Effects of post-weld heat treatment on fracture toughness of linear friction welded joint for dissimilar titanium alloys. Mater. Sci. Eng. A 2015, 634, 141–146. [Google Scholar] [CrossRef]
- Rovere, C.A.D.; Ribeiro, C.R.; Silva, R.; Baroni, L.F.S.; Alcântara, N.G.; Kuri, S.E. Microstructural and mechanical characterization of radial friction welded supermartensitic stainless steel joints. Mater. Sci. Eng. A 2013, 586, 86–92. [Google Scholar] [CrossRef]
- Winiczenko, R.; Kaczorowski, M. Friction welding of ductile iron abd stainless steel. Mater. Process. Technol. 2013, 213, 453–462. [Google Scholar] [CrossRef]
- Kırık, I.; Ozdemir, N.; Çalıgülü, U. Effect of particle size and volume fraction of the reinforcement on the microstructure and mechanical properties of friction welded MMC to AA6061. Kov. Mater. 2013, 51, 221–227. [Google Scholar]
- Davis, C.J. Micro friction welding aluminum studs to mild steel plates. Metal Constr. 1977, 9, 196–197. [Google Scholar]
- Yılbaş, B.S.; Şahin, A.Z.; Kahraman, N.; Garni, Z.A.A. Friction welding of St-Al and Al-Cu materials. J. Mater. Process. Technol. 1995, 49, 431–443. [Google Scholar] [CrossRef]
- Tanaka, T.; Morishige, T.; Hirata, T. Comprehensive analysis of joint strength for dissimilar friction stir welds of mild steel to aluminum alloys. Scr. Mater. 2009, 61, 756–759. [Google Scholar] [CrossRef]
- Watanabe, T.; Takayama, H.; Yanagisawa, A. Joining of aluminum alloy to steel by friction stir welding. J. Mater. Process. Technol. 2006, 178, 342–349. [Google Scholar] [CrossRef]
- Pierpaolo, C.; Antonello, A.; Gaetano, S.P.; Valentino, P.; Antonino, S. Microstructural aspects in Al-Cu dissimilar joining by FSW. Int. J. Adv. Manuf. Technol. 2015, 79, 1109–1116. [Google Scholar]
- Sketchley, P.D.; Threadgill, P.L.; Wright, I.G. Rotary friction welding of an Fe3Al based ODS alloy. Mater. Sci. Eng. A 2002, 329–331, 756–762. [Google Scholar] [CrossRef]
- Inkson, B.J.; Threadgill, P.L. Friction welding of FeAl40 Grade 3 ODS alloy. Mater. Sci. Eng. A 1998, 258, 313–318. [Google Scholar] [CrossRef]
- Torun, O.; Çelikyürek, I.; Baksan, B. Friction welding of cast Fe-28Al alloy. Intermetallics 2011, 19, 1076–1079. [Google Scholar] [CrossRef]
- Çelikyürek, İ.; Torun, O.; Baksan, B. Microstructure and strength of friction-welded Fe–28Al and 316 L stainless steel. Mater. Sci. Eng. A 2011, 528, 8530–8536. [Google Scholar] [CrossRef]
- Karabulut, A.; Tasgetiren, S. Sürekli tahrikli sürtünme kaynak makinesi tasarım ve imalatı. Mak. Teknol. Elektron. Derg. 2004, 3, 38–46. [Google Scholar]
- Misra, M.S.; Ma, Z.Y. Friction stir welding and processing. Mater. Sci. Eng. R Rep. 2005, 50, 1–78. [Google Scholar] [CrossRef]
- Dey, H.C.; Ashfaq, M.; Bhaduri, A.K.; Rao, K.P. Joining of titanium to 304L stainless steel by friction welding. J. Mater. Process. Technol. 2009, 209, 5862–5870. [Google Scholar] [CrossRef]
Figure 1.
Schematic illustration of the friction welding process.

Figure 2.
Schematic illustration of the shear test specimen holder.

Figure 3.
Optical micrographs of the welded samples under 200 MPa forging pressure and 140 MPa friction pressure. (a) 3 s; (b) 5 s; (c) 7 s; (d) higher magnification for 5 s.
Figure 3.
Optical micrographs of the welded samples under 200 MPa forging pressure and 140 MPa friction pressure. (a) 3 s; (b) 5 s; (c) 7 s; (d) higher magnification for 5 s.
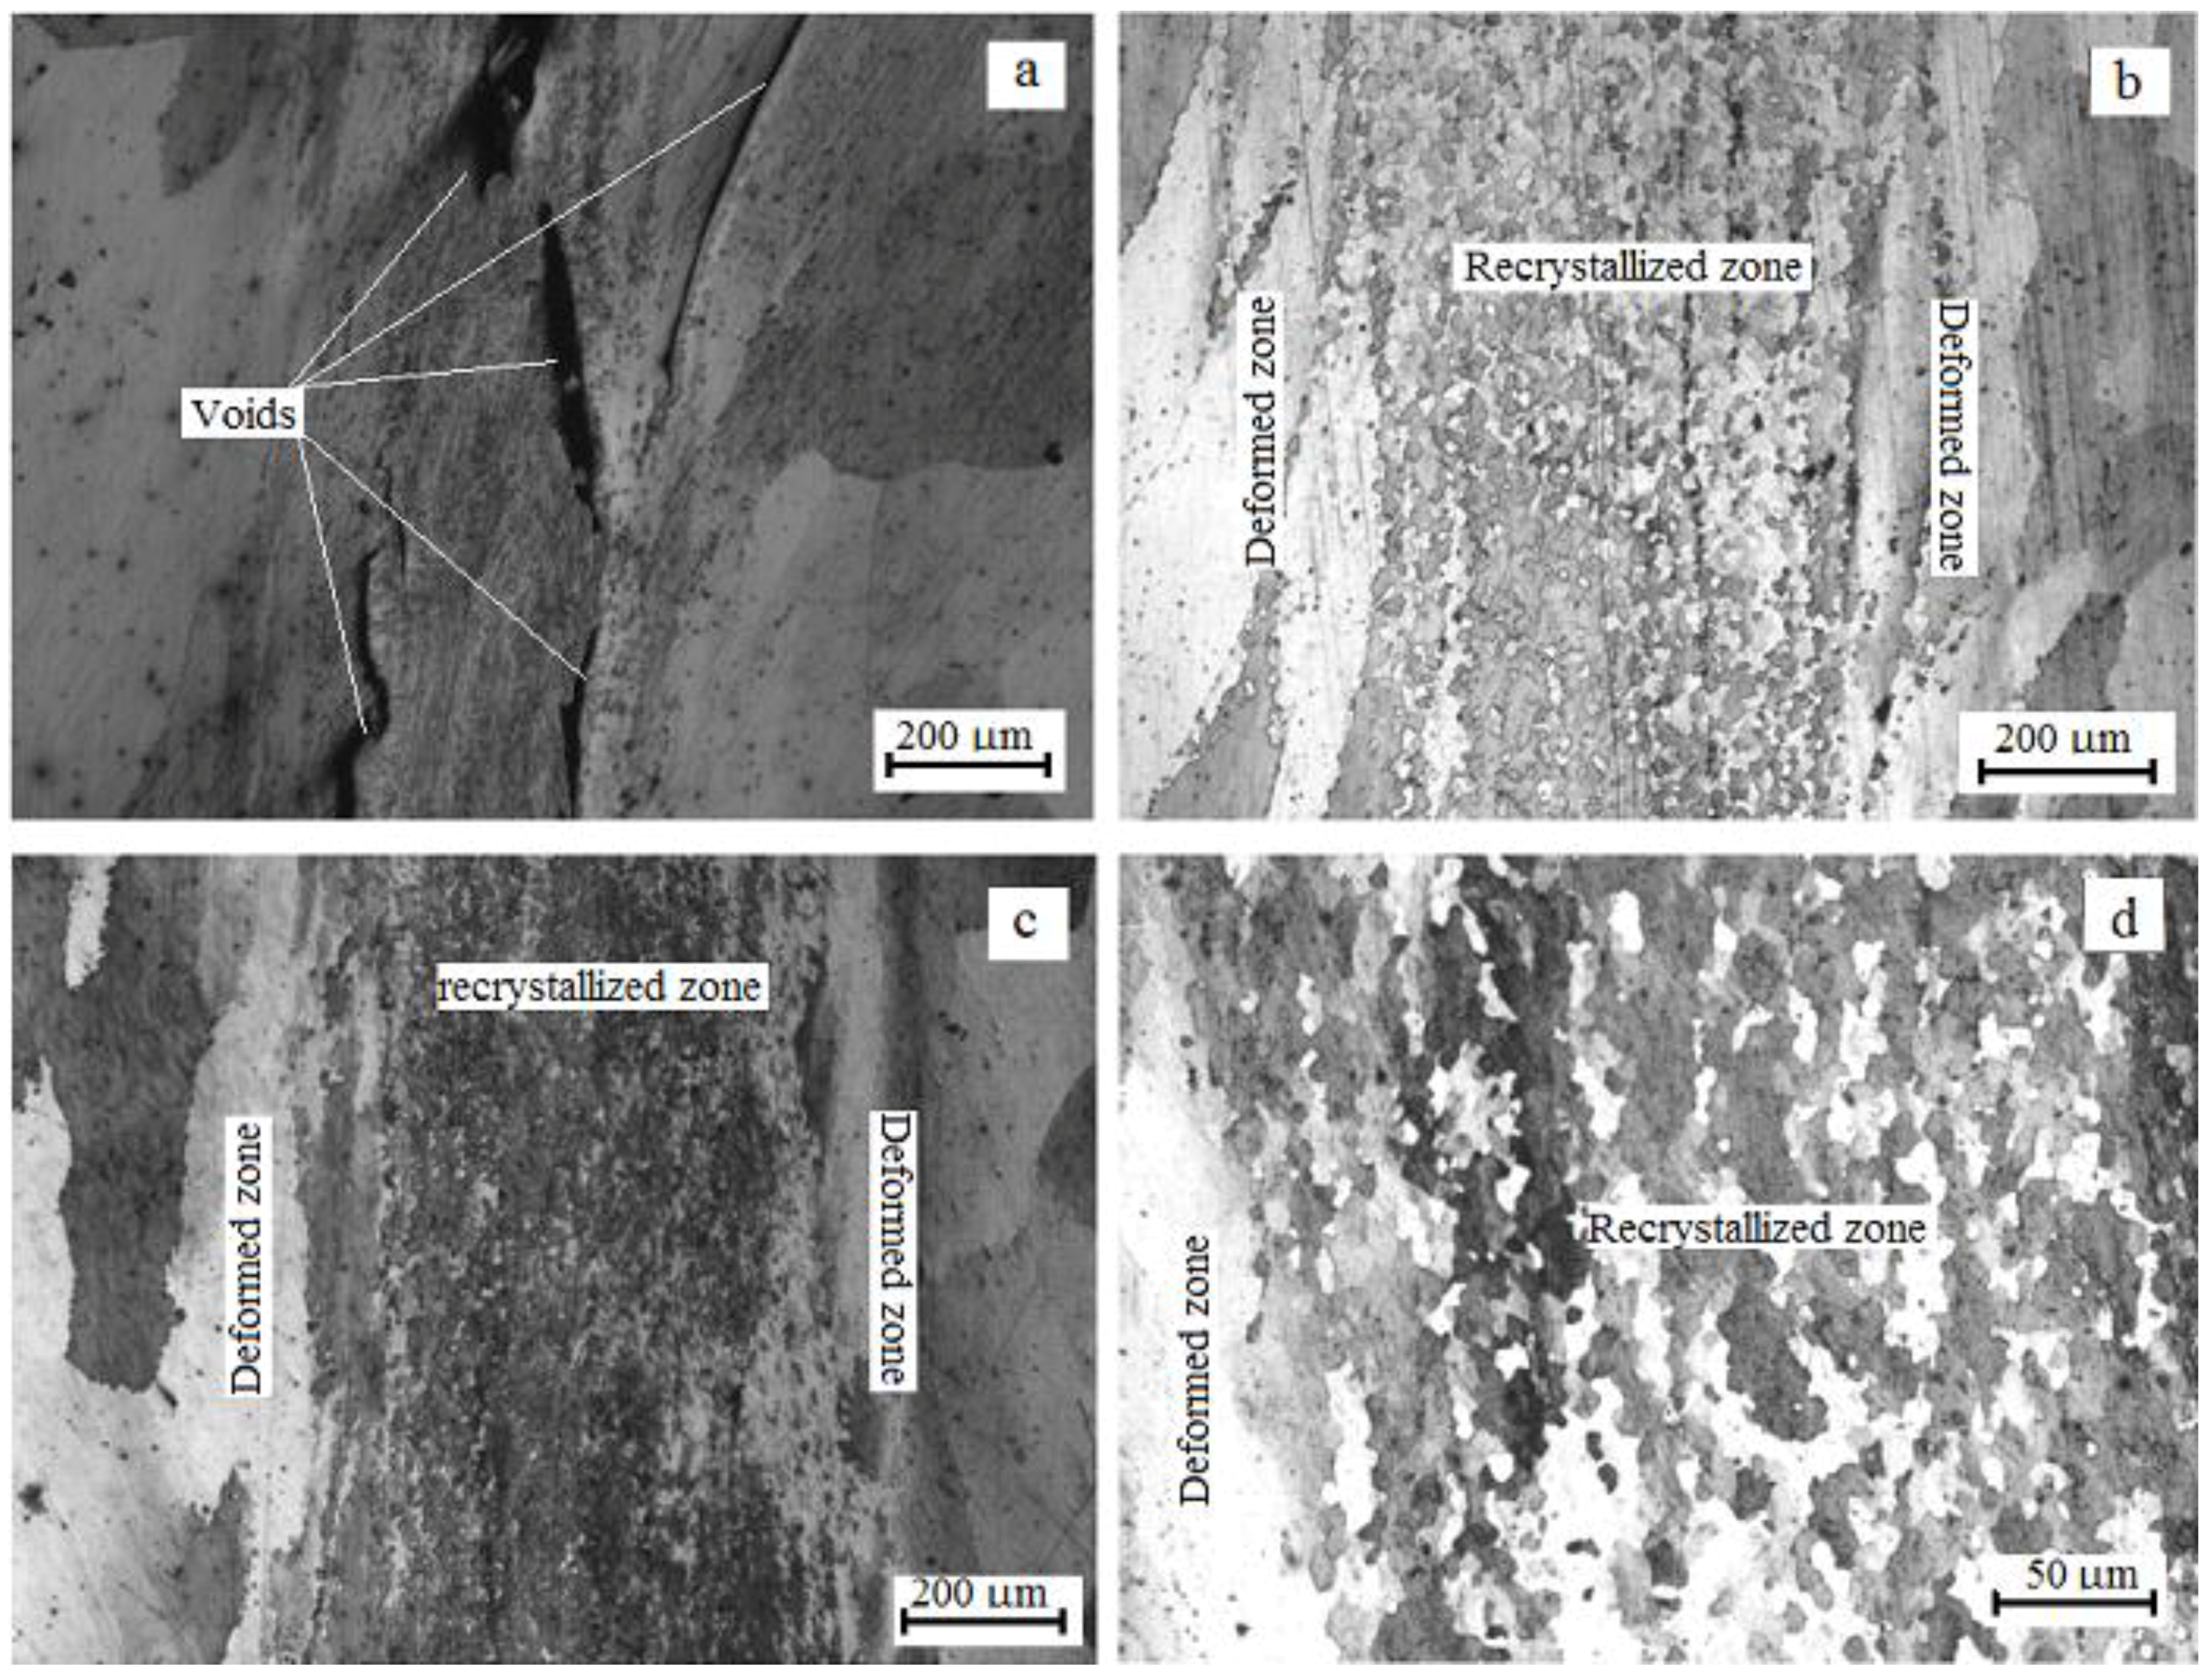
Figure 4.
Scanning electron microscopy (SEM)-energy dispersive spectroscopy (EDS) analysis of welded sample for 7 s under 200 MPa forging pressure and 140 MPa friction pressure. (a) SEM micrograph; (b) EDS analysis; (c) SEM micrograph of weld interface; (d) line-scan analysis.
Figure 4.
Scanning electron microscopy (SEM)-energy dispersive spectroscopy (EDS) analysis of welded sample for 7 s under 200 MPa forging pressure and 140 MPa friction pressure. (a) SEM micrograph; (b) EDS analysis; (c) SEM micrograph of weld interface; (d) line-scan analysis.

Figure 5.
Microhardness profile of welded samples for 7 s under 200 MPa forging pressure and 140 MPa friction pressure from the weld center to a side.
Figure 5.
Microhardness profile of welded samples for 7 s under 200 MPa forging pressure and 140 MPa friction pressure from the weld center to a side.
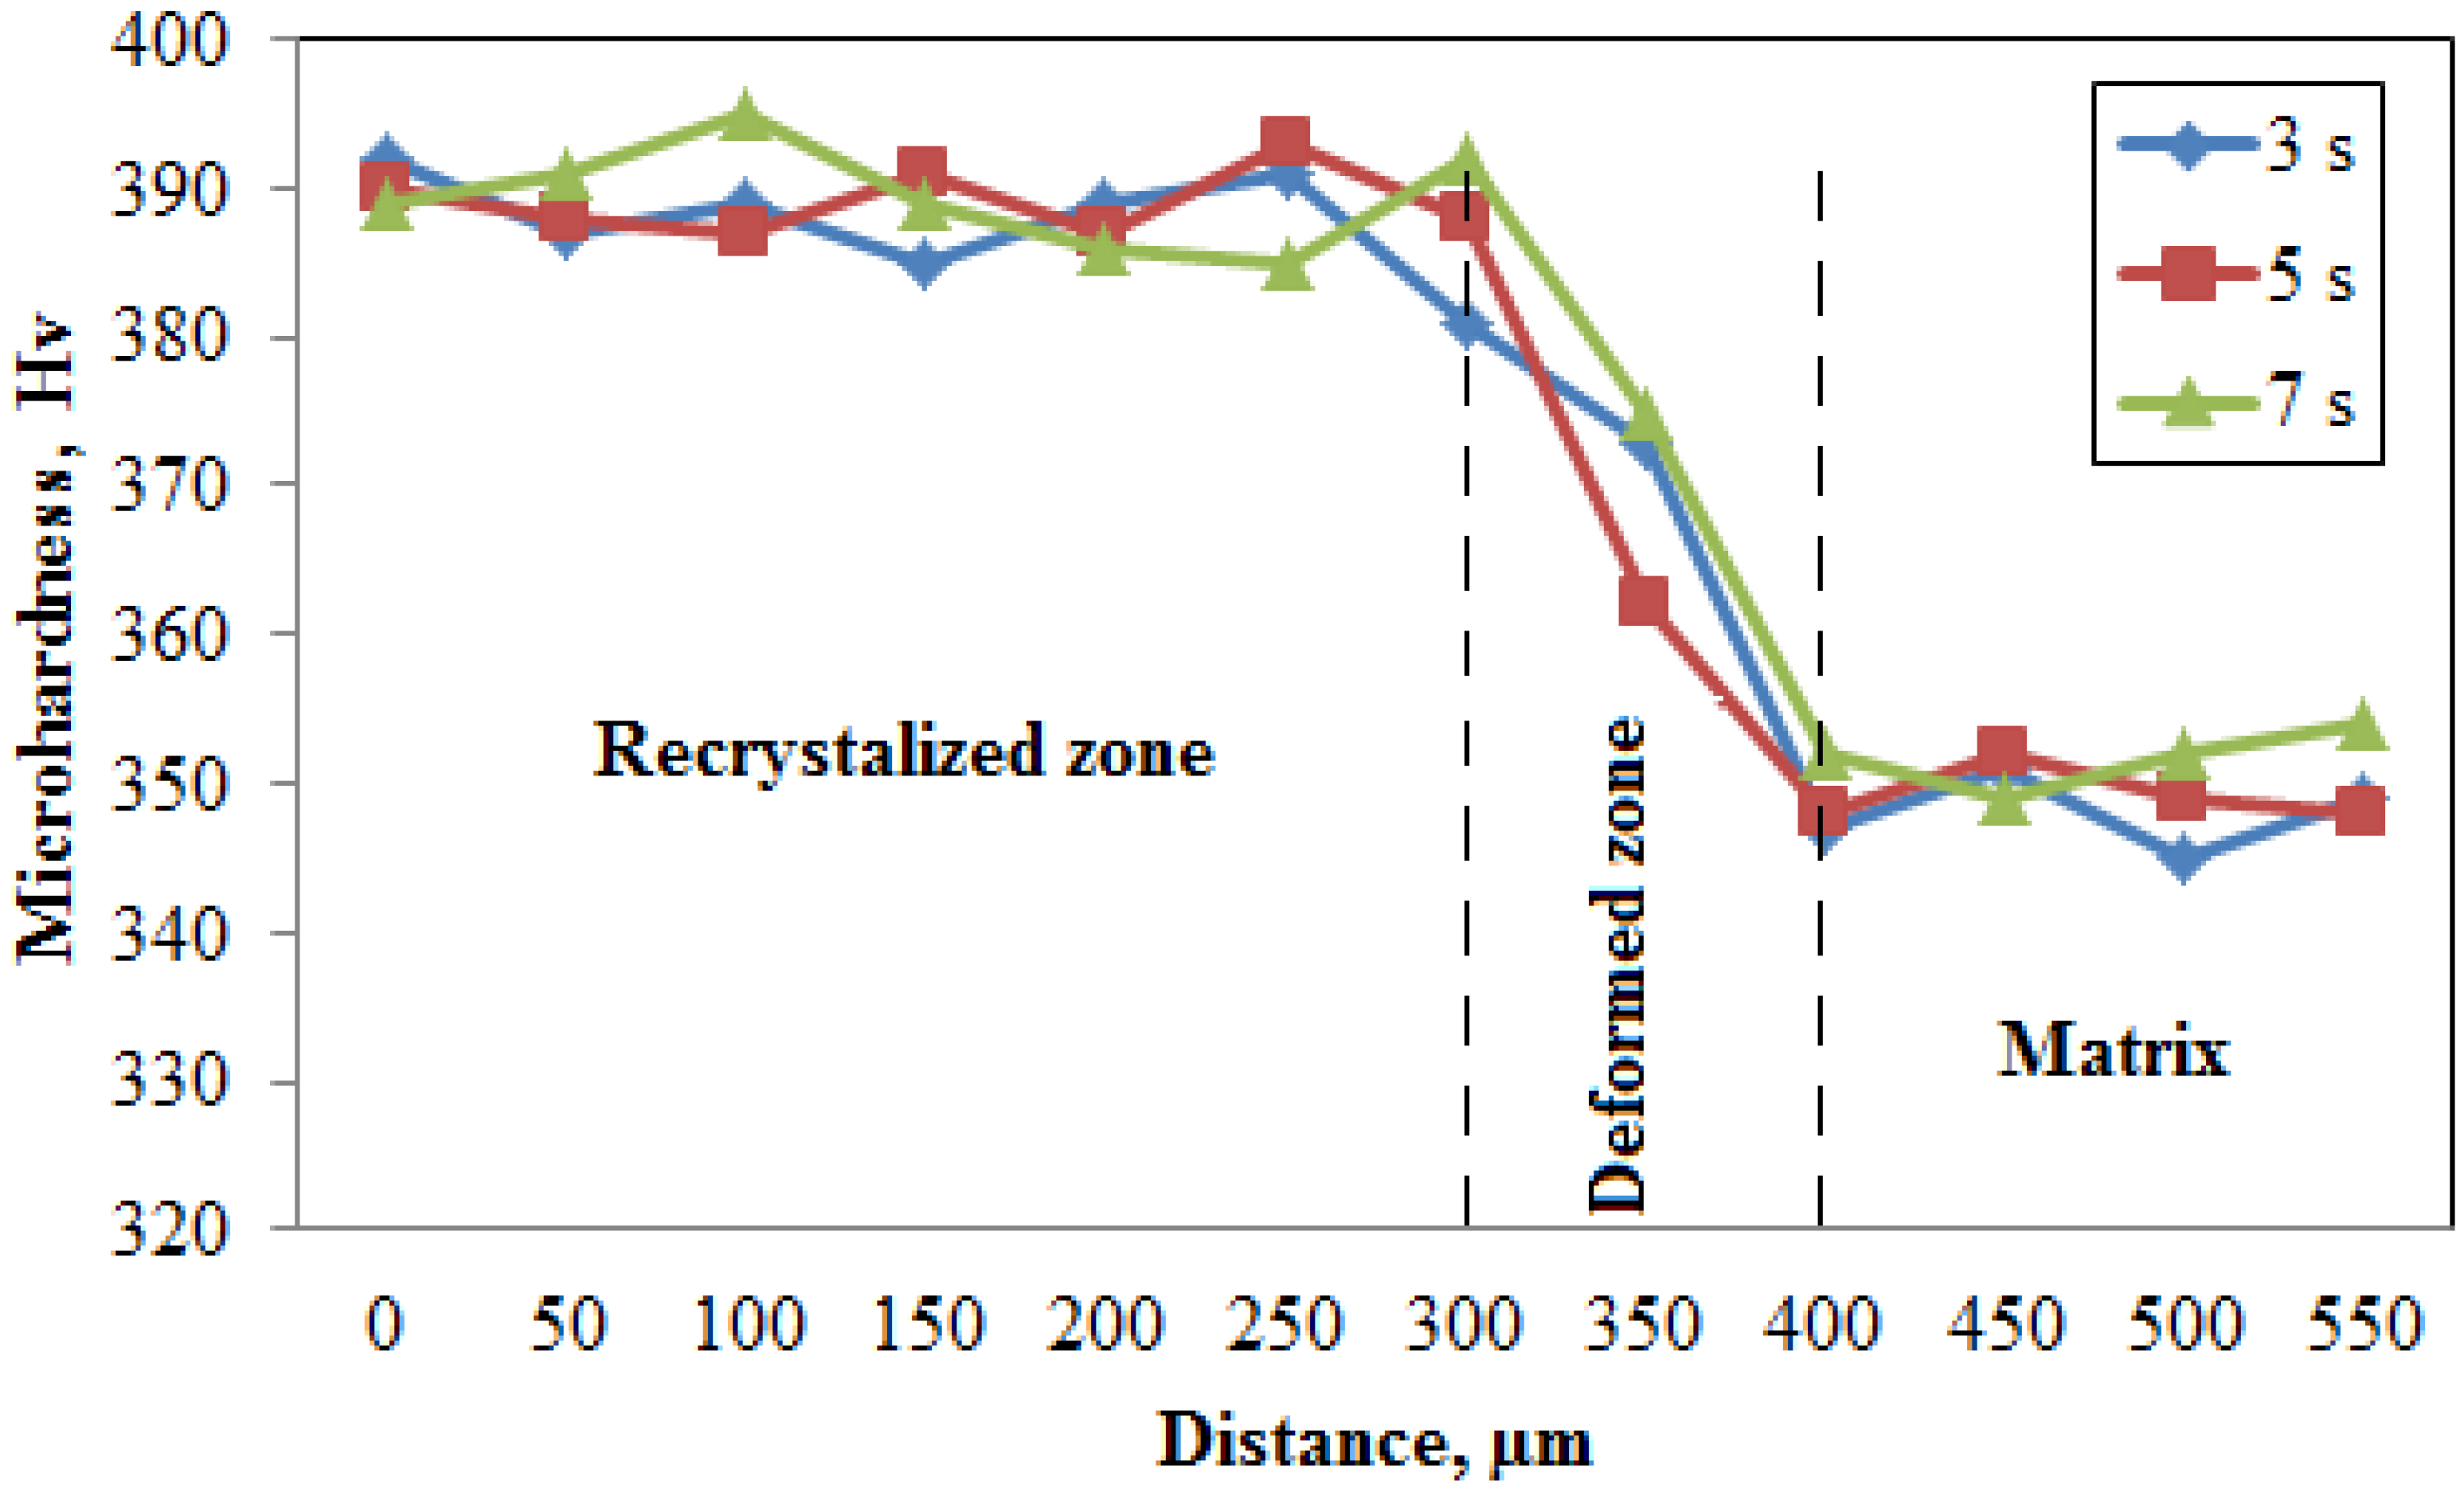
Figure 6.
The hardness values of welded samples for 7 s.
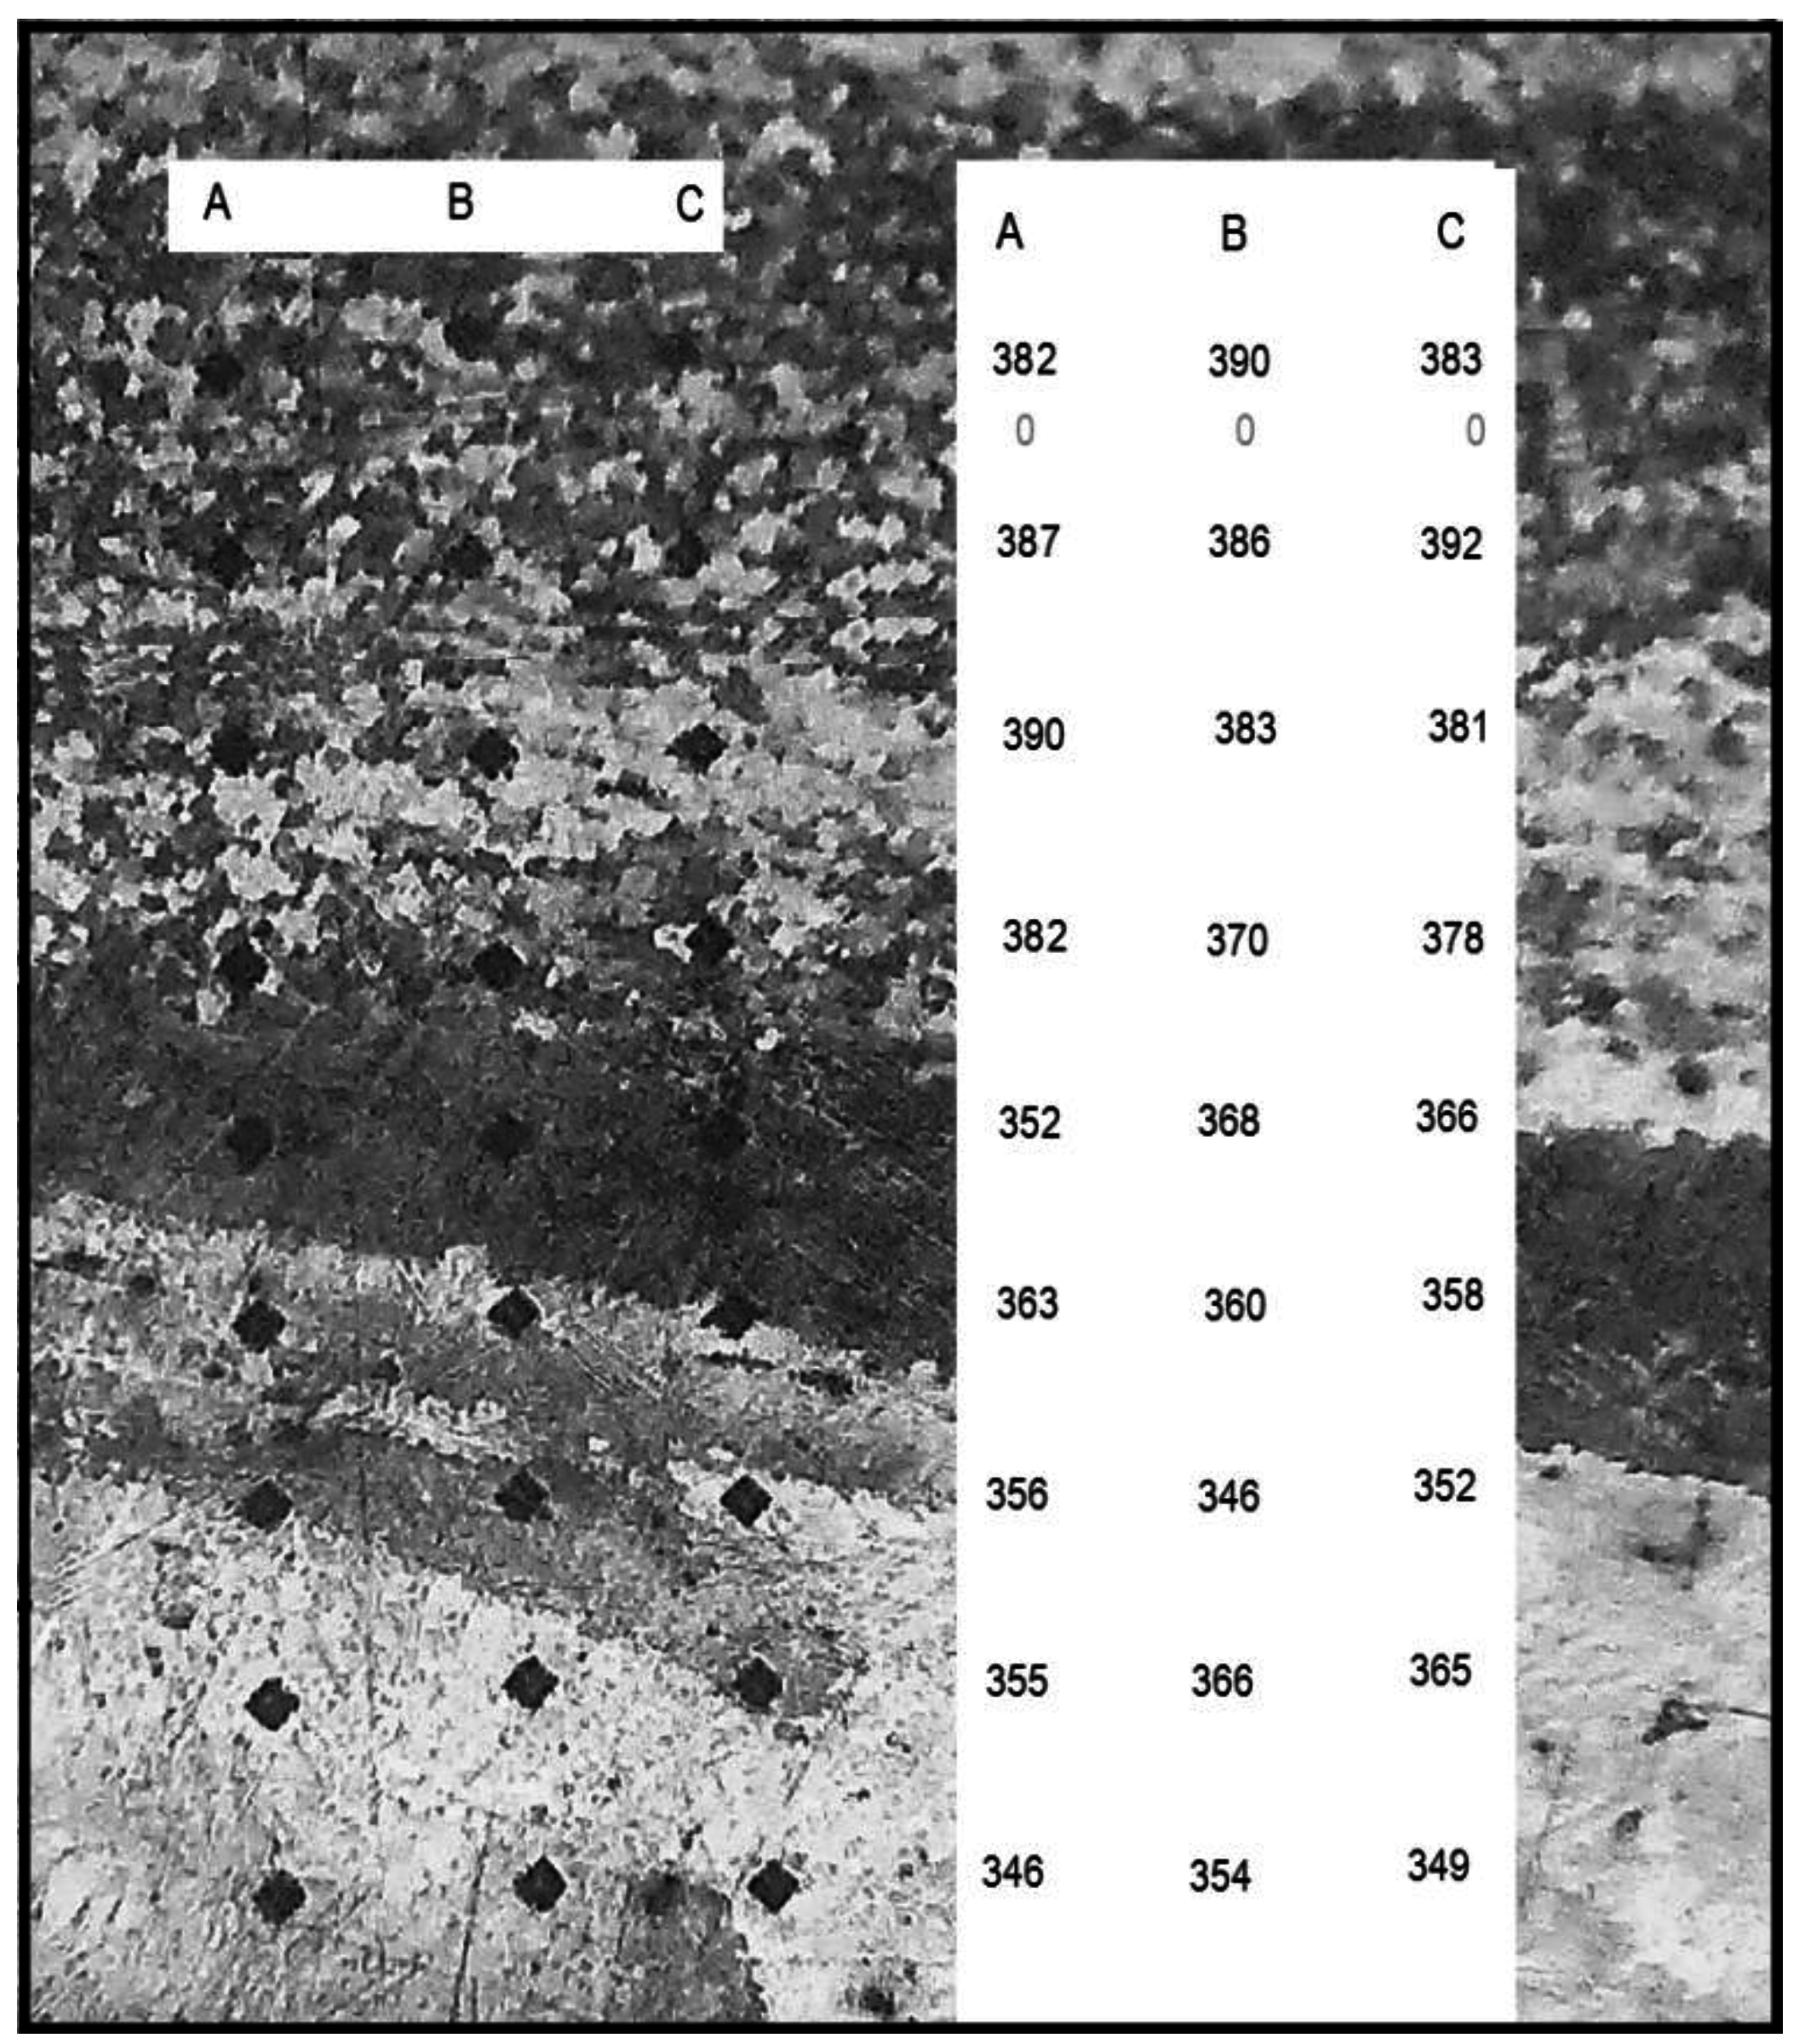
Figure 7.
Shear strengths of the welded samples and base alloy.

Figure 8.
Fractographs of the fractured surface of the welded sample for 7 s under 200 MPa forging pressure and 140 MPa friction pressure and the base alloy. (a) The welded sample; (b) the base alloy.
Figure 8.
Fractographs of the fractured surface of the welded sample for 7 s under 200 MPa forging pressure and 140 MPa friction pressure and the base alloy. (a) The welded sample; (b) the base alloy.


| Friction Speed (rmp) | Forging Pressure (MPa) | Friction Pressure (MPa) | Friction Time (s) | Burn-Off (mm) |
|---|---|---|---|---|
| 1000 | 140 | 70 | 3 | 1.5 |
| 1000 | 140 | 70 | 5 | 4.2 |
| 1000 | 140 | 70 | 7 | 9.2 |
| 1000 | 140 | 140 | 3 | 4.2 |
| 1000 | 140 | 140 | 5 | 10.9 |
| 1000 | 140 | 140 | 7 | 18.5 |
| 1000 | 200 | 70 | 3 | 4.2 |
| 1000 | 200 | 70 | 5 | 10.9 |
| 1000 | 200 | 70 | 7 | 18.5 |
| 1000 | 200 | 140 | 3 | 5.3 |
| 1000 | 200 | 140 | 5 | 11.7 |
| 1000 | 200 | 140 | 7 | 20.5 |
© 2016 by the author; licensee MDPI, Basel, Switzerland. This article is an open access article distributed under the terms and conditions of the Creative Commons Attribution (CC-BY) license (http://creativecommons.org/licenses/by/4.0/).
Share and Cite
MDPI and ACS Style
Torun, O. Effect of Welding Parameters on Microstructure and Mechanical Properties of Cast Fe-40Al Alloy. Metals 2016, 6, 229. https://doi.org/10.3390/met6100229
AMA Style
Torun O. Effect of Welding Parameters on Microstructure and Mechanical Properties of Cast Fe-40Al Alloy. Metals. 2016; 6(10):229. https://doi.org/10.3390/met6100229
Chicago/Turabian StyleTorun, Osman. 2016. "Effect of Welding Parameters on Microstructure and Mechanical Properties of Cast Fe-40Al Alloy" Metals 6, no. 10: 229. https://doi.org/10.3390/met6100229
Note that from the first issue of 2016, this journal uses article numbers instead of page numbers. See further details here.