
Numerical Modeling of Cyclic Deformation in Bulk Metallic Glasses


State Key Laboratory of Mechanics and Control of Mechanical, Nanjing University of Aeronautics and Astronautics, Nanjing 210016, China
Metals 2016, 6(9), 217; https://doi.org/10.3390/met6090217
Submission received: 24 July 2016
/
Revised: 12 August 2016
/
Accepted: 27 August 2016
/
Published: 7 September 2016
(This article belongs to the Special Issue Amorphous Alloys and Related Transitions)
Abstract
:In this paper, a systematic numerical simulation was performed to elucidate the damage mechanisms in bulk metallic glasses (BMGs) subjected to the tension-compression cyclic loading, and then the relation between fatigue life, applied strain, and cycling frequency was therefore presented. The free volume was selected as an internal state variable to depict the shear-band nucleation, growth, and coalescence with the help of free volume theory, which was incorporated into the ABAQUS code via a user material subroutine UMAT. Under cyclic loading, the shear banding initiation mainly stems from the microstructure inhomogeneity in BMGs and, further, the effect of applied strain amplitude and cycling frequency was discussed. The present simulations will shed some light on the fatigue damage mechanisms and fatigue life evaluation of BMG structures.

1. Introduction
As compared with traditional metal materials, bulk metallic glasses (BMGs) have many outstanding properties and, therefore, attract more and more attention in many important domains. For structural materials, more than 90% of mechanical failures are induced by fatigue loading and, therefore, gaining a solid understanding of the fatigue mechanism in BMGs is a necessary prerequisite for their safe applications. Recently, Jia et al. [1] summarized and discussed the fatigue behavior of structural-material substrates coated with thin-film MGs, and their conclusions are equally applicable to BMG samples. Many experiments have been completed to study the fatigue damage mechanism and life time for BMGs. Peter et al. [2] performed fatigue tests on Zr-based BMGs in air and vacuum to elucidate the possible environmental effects. Wang et al. [3] experimentally studied the high-cycle fatigue behavior of Zr41.2Ti13.8Cu12.5Ni10Be22.5 BMG under tension-tension cyclic loading. They found that fatigue resistance relies on the processing conditions of BMGs, and a significant amount of porosities and inclusions would result in the lower resistance. Such casting defects act as crack initiation sites, thus resulting in shorter fatigue lives. Additionally, Wang et al. [4] observed that the fatigue crack could initiate from shear-bands, inclusions, or porosities. Menzel et al. [5] studied the fatigue damage in Zr-based BMGs to elucidate damage initiation and growth mechanisms. Damage was observed to initiate as shear-bands or mixed-mode cracks propagating at 49° against the maximum applied stress axis after only a few stress cycles. Freels et al. [6] also conducted the cyclic compression experiment on the Cu45Zr45Al5Ag5 alloy, and found that the cyclic compression fracture surface displays a morphology that is nearly identical to the monotonic compression fracture surface. Wang et al. [7] performed the uniaxial tension-tension fatigue experiments, and confirmed that an addition of Pd has obvious effects on the fatigue behavior. Launey et al. [8] examined the roles of free volume and residual stress in the fracture and fatigue behavior of a Zr44Ti11Ni10Cu10Be25 BMG, and found that free volume reduction did not show any influence on the fatigue crack growth rates. Fujita et al. [9] carried out fatigue tests on Co- and Fe-based BMGs. Qiao et al. [10] investigated the four-point-bend fatigue behaviors of BMG and the resulting composites. Different fracture mechanisms were observed in the BMG and BMG composite based on their different fatigue-fracture surfaces. The fatigue fracture of BMG includes the formation of shear-bands due to the increase of the free volume under the tension stress. Yue et al. [11] investigated the fatigue behavior of Zr41.2Ti13.8Cu12.5Ni10Be22.5 BMGs under uniaxial tension–tension and three-point bending loading modes. The defects have little to no influence on the crack initiation and the fatigue life in the low cycle fatigue range. However, at a lower stress level, the most detrimental factor was the number of defects that resulted in a fatigue endurance limit discrepancy. Morrison et al. [12] pointed out that the fatigue lifetimes in four-point bending were greater than those reported in uniaxial loading. On the contrary, the fatigue lifetimes were found to be highly dependent upon surface defects and material quality. Jang et al. [13] conducted the compression-compression and bending fatigue experiments on Zr50Cu40Al10 BMG cylinders with 1.6 μm and 4.5 μm diameters. The 1.6 μm diameter Zr-based BMGs under compressive fatigue cycling did not fail after 40 × 106 cycles.
On the other hand, numerical methods were also adopted to interpret the failure damage process in BMGs. Cameron [14] investigated the atomic processes underlying cyclic fatigue in BMGs using molecular dynamics (MD) simulations. Simulation indicated that free volume levels were increased and localized during deformation. Lo et al. [15] also utilized the MD method to analyze the cyclic loading response of Zr50Cu50 BMGs under the stress-control mode. Their simulations suggest that BMG at the small size scale can be quite fatigue resistant. As BMG is in a small size scale, it can deform under cyclic loading in a semi-homogeneous manner without the pronounced mature shear-bands. Sha et al. [16] performed MD simulations of tension-compression fatigue in Cu50Zr50 BMGs under strain-controlled cyclic loading, and confirmed that the accumulation of shear transformation zone follows a power law with rate depending on the applied strain. Unfortunately, to the author’s knowledge, there is no numerical modeling that has yet been conducted based on the finite element method (FEM). It is expected that FEM simulation would be better to elucidate the fatigue damage process at the mesoscopic scale, and is better able to compare with the experiments.
In this work, FEM modeling was conducted to explore the fatigue damage mechanism in BMGs under the tension-compression cyclic loading based on the free volume theory, which is incorporated into the ABAQUS code by a user material subroutine UMAT. The detailed shear-band initiation and propagation was monitored during the computation, and then parametric analyses are focused on the impact of strain amplitudes and cycling frequency on the fatigue life and shear-band evolution in BMGs.
2. Constitutive Relations of BMGs
The shear-band initiation, growth, and propagation form the fundamental deformation mechanism in BMGs. At the microscopic scale, shear-band formation is believed to be associated with the evolution of the local structural order. One atomistic mechanism capturing shear-band formation and evolution in BMGs is the free volume theory developed by Spaepen [17] and further extended by Steif [18]. From a continuum mechanics point of view, the shear-band is a result of strain softening and considered to be a strain-localization phenomenon. The free volume model regards free volume as an internal state variable, which controls the structural evolution at the atomic level in BMGs.
According to the J2-type, small strain visco-plasticity framework, the free volume theory can be extended to a multi-axial stress state. The strain rates are decomposed into the elastic and plastic parts:
The above elastic part is described by the general Hooke’s law:
with a characteristic time scale t* = tf−1exp(ΔGm/kBT), where f is frequency of atomic vibration, E is elastic modulus, ν is Poisson’s ratio, ΔGm is the activation energy, kB is the Boltzmann constant, and T is the absolute temperature. After defining the normalized time t*, the equations are differentiated in terms of the normalized time scale t*. The plastic part, i.e., the flow equation can be rewritten as [19]:
where νf is the average free volume per atom, σ0 = 2kBT/Ω is the reference stress, Sij = σij − σkkδij/3 is the deviatoric stress tensor, and σe = (SijSij)1/2 is the von Mises’ stress. It is worth noting that a dot over a quantity X denotes (Ẋ) = f−1exp(ΔGm/kBT)(∂X/∂t), which should be used in the following expression. The free volume evolution equation in the multi-axial stress state is expressed as [19]:
where α is a geometric factor of order 1; σ0 = 2kBT/Ω is the reference stress, νf is the average free volume per atom, νf = νf/αν* is the normalized free volume, β = ν*/Ω, and nD is the number of atomic jumps needed to annihilate a free volume equal to ν*, and is usually taken to be 3~10.
3. FEM Modeling
The above constitutive equations are incorporated into the ABAQUS code via a user-defined material subroutine, UMAT. In this framework, the shear-band evolution is characterized by an internal state variable, i.e., the normalized free volume νf as given in Equation (3). The evolution of the free-volume greatly relies on the in situ stress state and the current free-volume field. The state-variable field and the stress field can be computed, the formation of a shear-band corresponds to a localized increase in the state variable, and the development of shear-band can be described by the free volume density, which is denoted by a state-dependent variable (SDV), i.e., free volume νf, in the ABAQUS code [20].
The initial aspect ratio of the BMG sample, i.e., the ratio of the initial height (measured along axis-x) to the initial width (measured along axis-y) is 2:1. The initially un-deformed FEM model, as shown in Figure 1, comprises 5000 CPE4R continuum plane-strain elements. Here, quadrilateral, iso-parametric elements are employed in the discretization, and reduced integration is used. Since the main features of the shear banding mechanism are better revealed in two-dimensional plane-strain calculations and, thus, two dimensional models are adopted in the entirety of the simulations. During the modeling, all of the nodes in the bottom node set are forbidden from motion along the x-axis. A negative displacement along the x-axis is applied to the single node located at the top-right corner to achieve the desired strain-rate. A multi-point constraint (MPC) equation is exerted to the rest of the nodes in the top surface in order to keep their deformation coordinate with the top-right corner node. To restrict the rigid-body motions of the sample, the node located at the bottom-left corner is also prevented from moving along the y-axis. The remaining nodes in the bottom and top nodes are free to move along the y-axis.
Experimental results (see [21]) already concluded that pure BMGs essentially consist of hard—and soft regions, and such structural heterogeneity will result in the nucleation of a shear transition zone and the subsequent shear-band progression in BMGs. In order to better capture the shear localization, some elements are assigned a slightly lower value of initial free volume, and act as nucleation sites for the initiation of shear bands. As shown in Figure 1b, the contour plot for the distribution of the initial free volume ν0, which was assumed to be statistically varied over the elements, obeying a Gaussian distribution function with a mean value of 0.05, and the standard deviation may be varied.
4. Results and Discussion
4.1. Influence of Microstructure Heterogeneity in BMGs
Figure 2 shows the stress-strain relation of BMG sample under uniaxial tension, here a mesh density of N = 5000 was used. The material properties for the BMG are [22]: E = 96 GPa, ν = 0.36, nD = 3, α = 0.35, β = 0.85, and νf/αν* = 0.085. Once the shear-band initiates at εxx = 2.5%, some shear-bands will rapidly develop into thicker ones at εxx = 5.0%, and propagate speedily without any impeding effect, growing into a saturated state at which the macroscopic stress is at a stable level as shown in the stress-strain plot. The stress-strain curve qualitatively shows the compressive stress-strain response of a BMG undergoing homogeneous deformation, i.e., linear elastic deformation until the yield/peak point is reached and strain-softening behavior for the application of deformation beyond the yield point until a steady-state stress level is attained, in which no further shear-band growth occurs, as the shear-band becomes fully developed. In Figure 2, the dashed line represents the initial linear elastic stage. The marked open symbols indicate the applied strains amplitude of εxx = 0.5%, 1.0%, 1.5%, 1.85%, 2.0%, 2.2%, and 2.5%, which will be used in the following strain-controlled cyclic loading simulations. The first two strains are in the range of the elastic stage, while the remaining strains are at the non-linear stage. The subsequent comparisons among these strains will be used to understand the effect of applied strain and corresponding fatigue mechanisms.
In order to understand the shear-band evolution in BMGs, the deformation of the BMG under uniaxial tension is shown in Figure 3, which shows the stress-strain curve and the corresponding volume fraction of the zone with relatively higher free volume value (νf ≥ 10%) during the deformation. The free volume evolution can be fitted by a power law function in the form of f(x) = axn and plotted with a blue line, as shown in Figure 3. This rule is just identical to that given in Sha’s work [16]. A sequence of snapshots monitoring the shear-band evolution was also associated. At the very beginning of deformation, the shear-bands are very thin, and dispersed randomly over the BMG sample, which means that the micro-deformation energy would be dissipated during the plastic deformation after introducing the perturbation of hard and soft zones in the BMG sample. After the stress drop in the stress-strain curve, the distribution of the free volume within the specimen has reached a steady-state level, i.e., further deformation beyond stress drop point will result in only negligible changes in the specimen’s free volume. Hence, deformation during the steady state will cause no further shear-band growth as the shear-band becomes fully developed. From the associated contour plots at various applied strains, it is clearly seen that shear offsets are created on both of the lateral surfaces of the BMG sample.
Figure 4 shows the dependence of the stress-strain curves on the standard deviation of inhomogeneous BMG microstructures; here, the initial mean free volume ν0 = 0.05 was used. The predicted stress-strain curves nearly overlap each other for the models with various standard deviations of Sd. The comparison among these computations also shows that the statistical distribution of the initial defect has no effect on the predicted stress-strain relations of the BMG samples. Therefore, the heterogeneous distribution of initial defects will be not a key factor in dominating the predictions.
4.2. Failure Mechanism in BMG under Cyclic Loading
For the fatigue simulations with various strain amplitudes, the loading rate remains constant and, therefore, Figure 5 lists the typical strain-time plots for tension-compression fatigue simulations with applied strain of 0.5%, 1.5%, and 2.5%. In addition to the listed strains, the other strain-time relations also obey the same rule as shown here. It should be noted that a positive strain value denotes tensile loading, while a negative strain value corresponds to compressive loading.
Figure 6 gives the evolution of the shear-band under cyclic loading with an applied strain of 2.2%, where the maximum stress is 90% of the highest tensile stress under monotonic loading. After several loading cycles, the current stress amplitude will decrease gradually as compared with that in the last cycle. Such a remarkable reduction in stress is mainly induced by the accumulation of the free volume in BMGs, and the whole materials are, consequently, weakened. In the present work, the load drop cycle number should be determined as follows. It is seen from the stress-loops relation that the stress value will reduce to a stable state after a certain number of loops. By combining with the corresponding snapshot of shear banding evolution, a dominate shear band runs through the whole BMG sample. The transition point from high stress to the lower saturation value is selected to be the fatigue cycle life of the BMG sample. As seen from the stress-cycle number curve, a stress drop indicated by an arrow is observed. A drop in stress just correponds to a dominant shear-band formation. Figure 6 also illustrates a sequence of snapshots capturing the shear-band formation under cyclic loading. Shear banding is found to be the main fatigue mechanism for BMG under low-cycle fatigue. Similar to Sha’s MD simulations [16], the shear banding evolution is mainly comprised of shear-band initiation and propagation processes.
Wang et al. [23] investigated the evolution processes from shear banding to fatigue cracking and fracture in Zr52.5Cu17.9Ni14.6Al10Ti5 BMGs by a quasi-in situ cyclic compression-compression experiment. They concluded that the formation of a shear band and fatigue crack seems to be easier under cyclic loading than that under monotonic compression. Their results showed that the crack propagation, rather than the crack initiation, dominates the fatigue life at high stress levels. On the other hand, Sha et al [16] pointed out that the fatigue life mainly comprises of the shear band formation stage, not their propagation.
4.3. Effect of Free Volume Fluctuation under Cyclic Loading
In order to make known the influence of free volume fluctuation, the cyclic deformation on a single element will be simulated. Figure 7 gives the stress as a function of cycle number for a tension-compression cyclic loading with an applied strain of 1.8% on a single element, and the evolution of the free volume with cycle loops is also listed. Numerical results clearly show that the free volume accumulates gradually with an increase of the cyclic loops, and the evolution of the free volume also follows a power function, which is similar to those obtained in Sha’s MD computation [16].
4.4. Effect of Applied Strain Amplitude
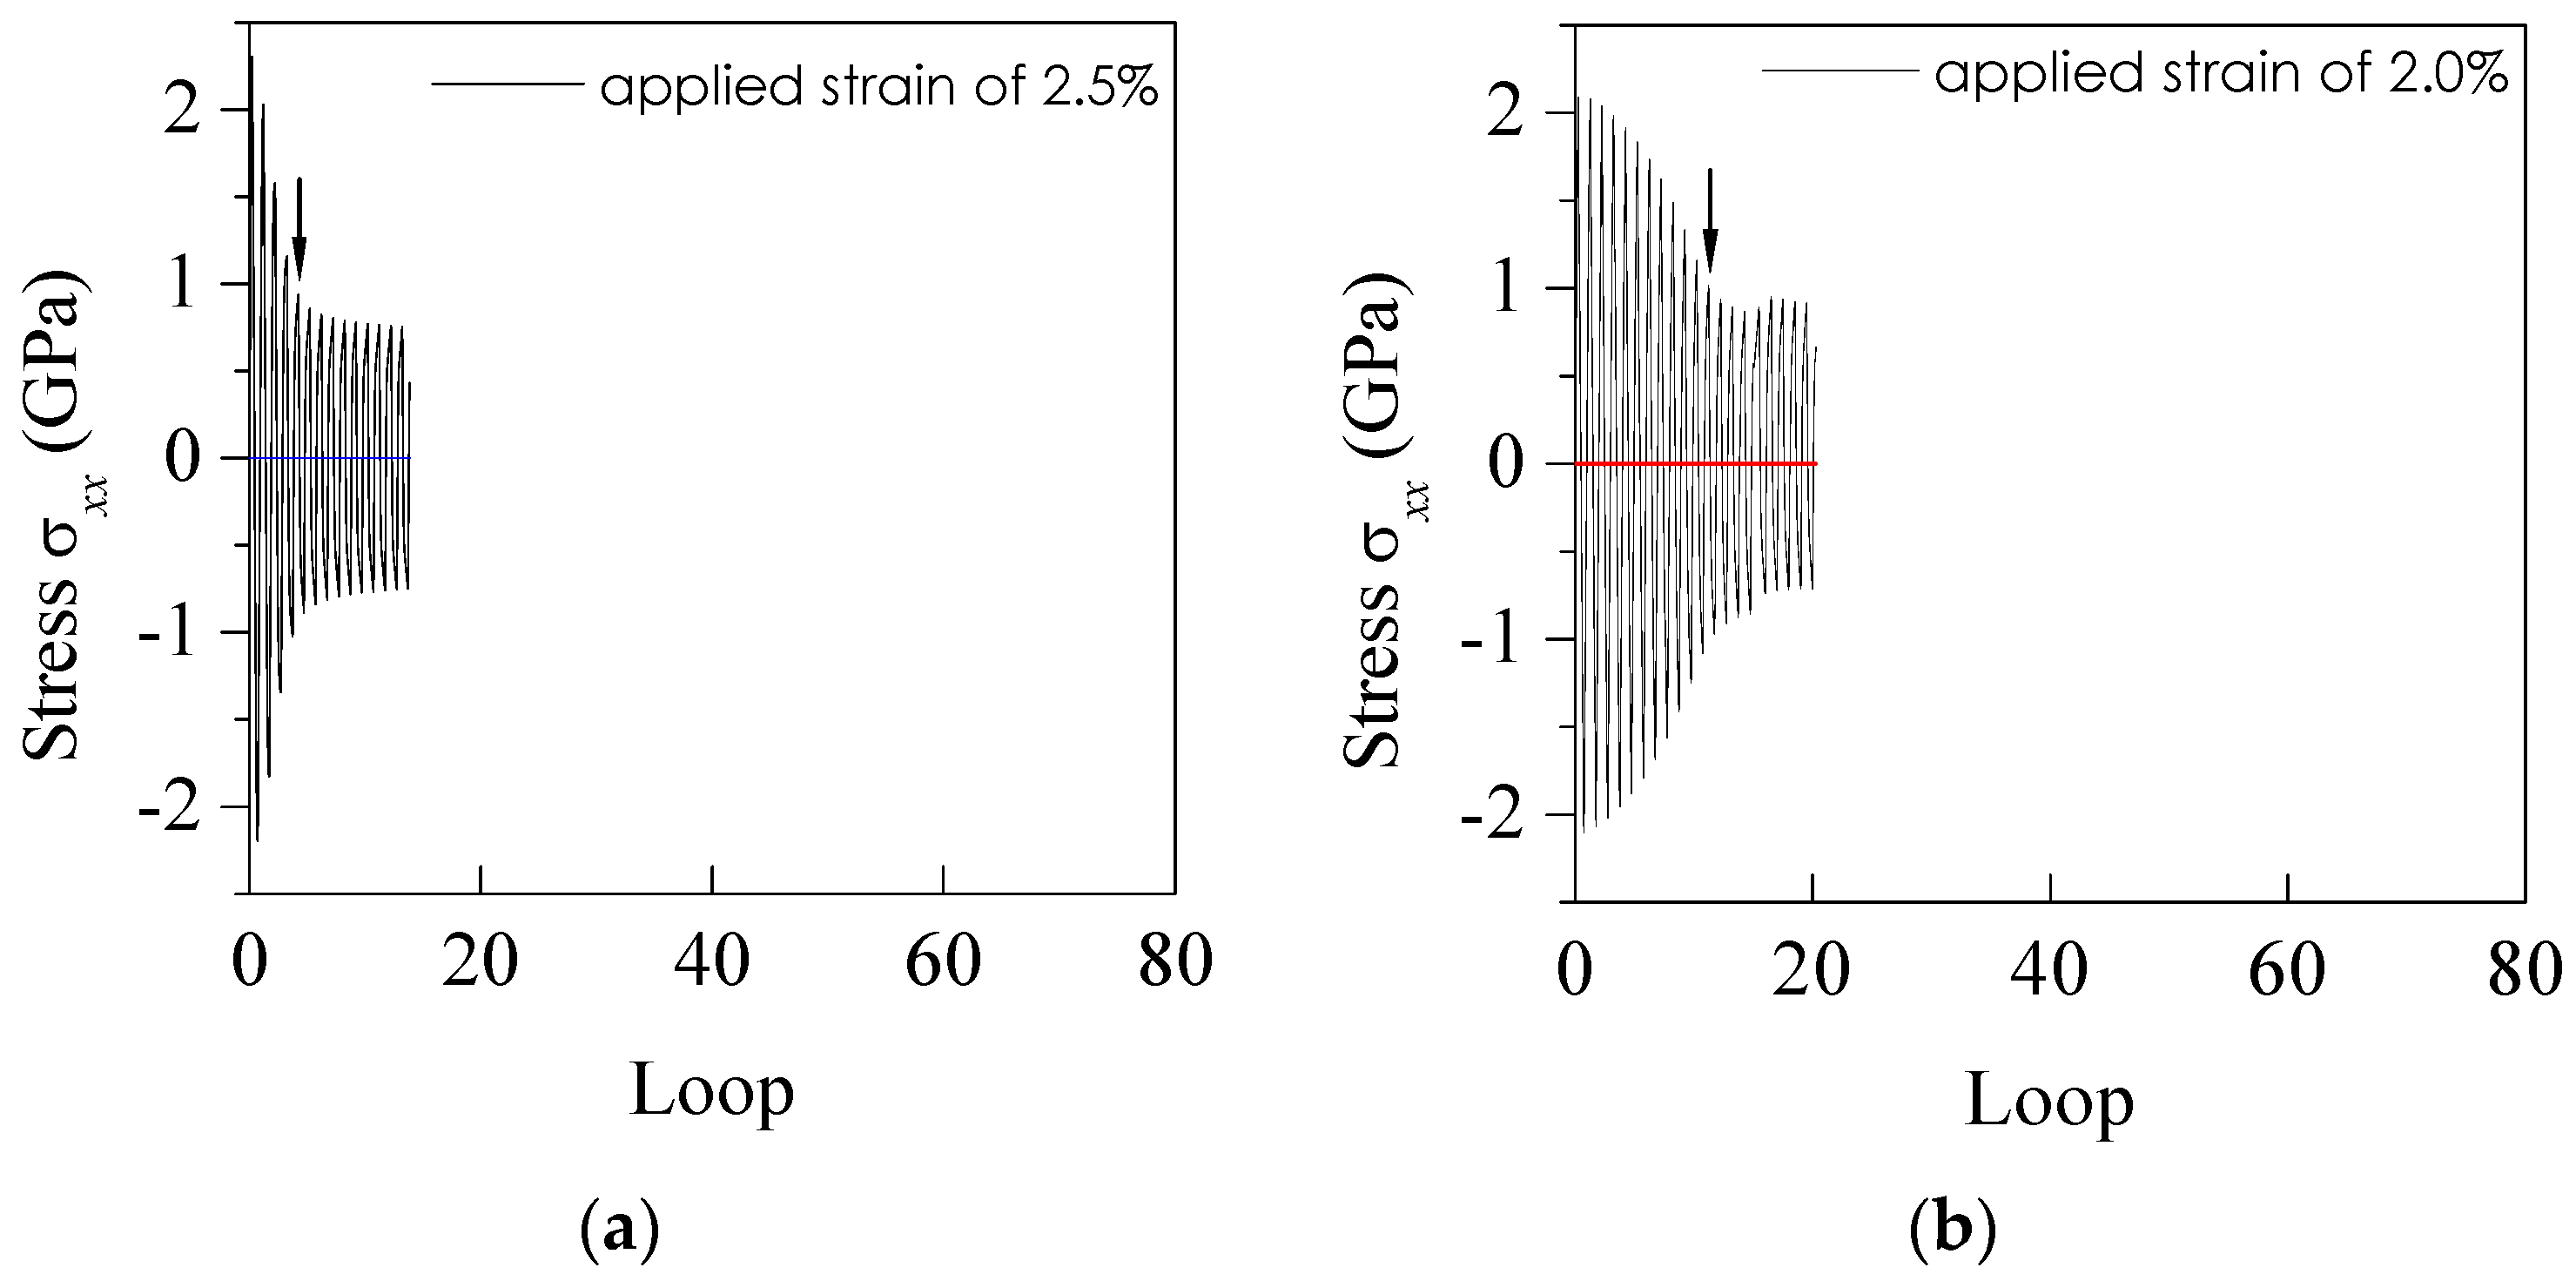
Figure 8 shows the detailed stress versus cycle number curves at various strain amplitudes. As mentioned before, the strains that are less than 1.5% are located in the linear elastic line, as shown in Figure 2 (blue dashed line), there is no shear-band observed in the BMG and, consequently, the material remains intact. Therefore, the stress-cycle number curves should keep constant without any reduction in stress amplitude. However, for the other cases with applied strains greater than 1.5%, a significant reduction in stress amplitude was observed with increasing the cycle loops. Generally, a distinct stress drop was found after a certain number of loading cycles and, concurrently, the BMGs collapse with a dominant shear-band formation running across the whole sample.
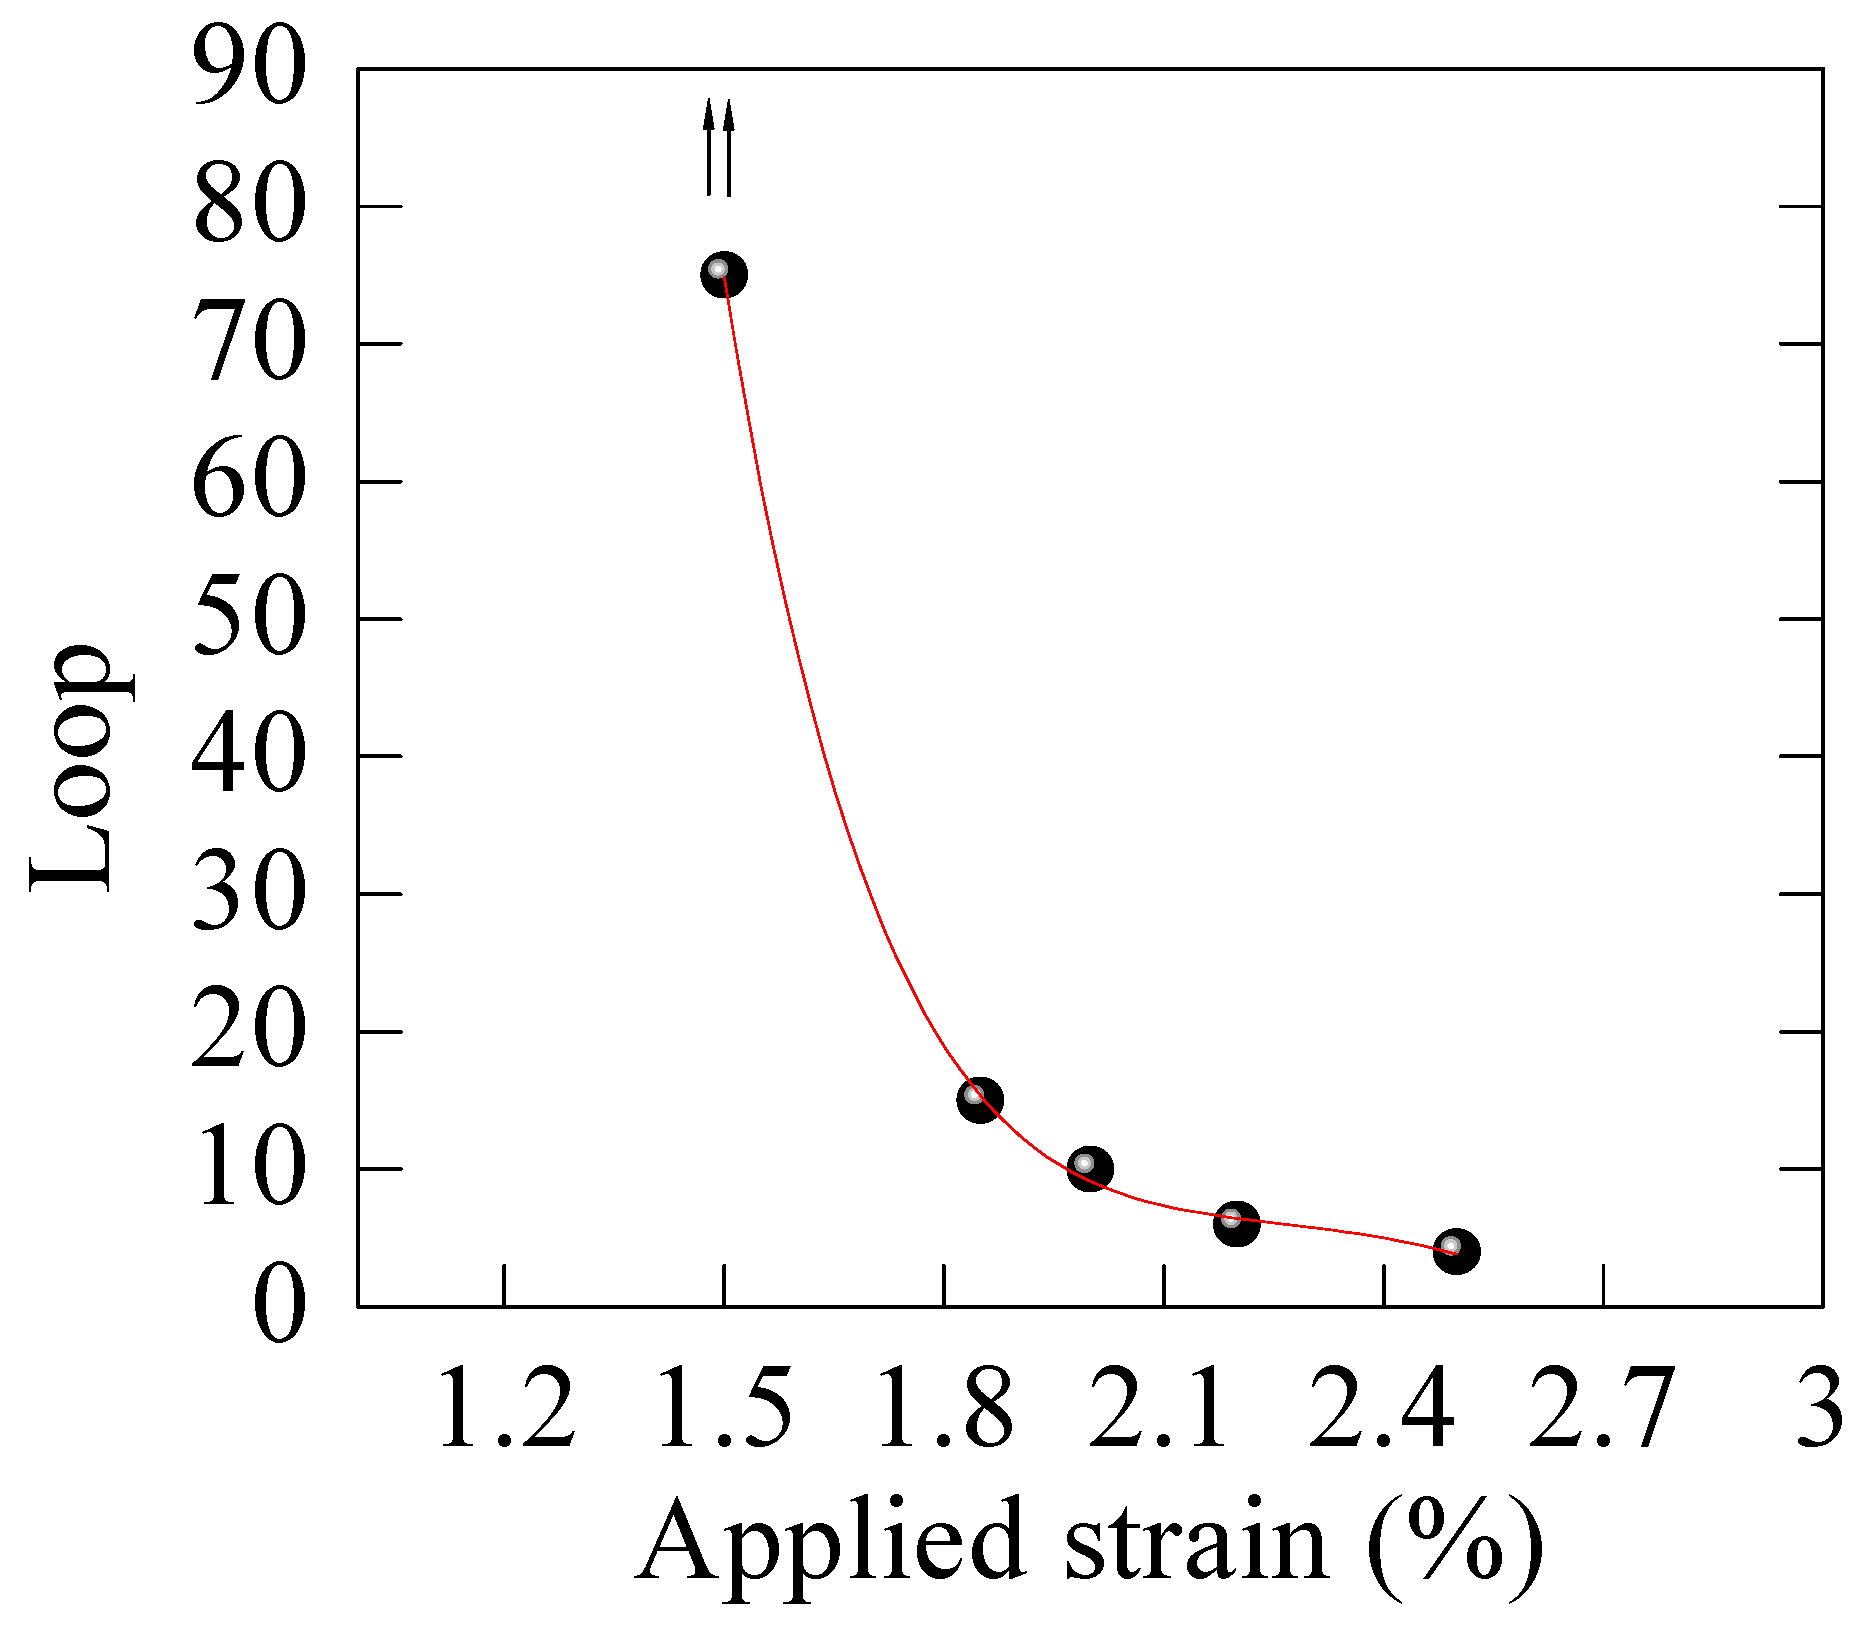
The loading drop cycle times is expressed as a function of applied strain amplitude in Figure 9. It is found that the fatigue life is very sensitive to the applied strain amplitude. With the increasing applied strain value, the loop number decreases sharply. As the applied strain approaches the yielding point, a complete cycle could not finish, and the whole mechanical response is just identical to that of the monotonic loading.
4.5. Effect of Loading Frequency
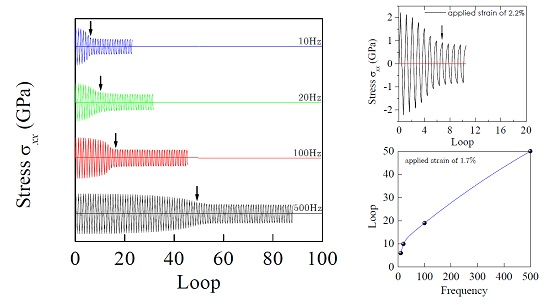
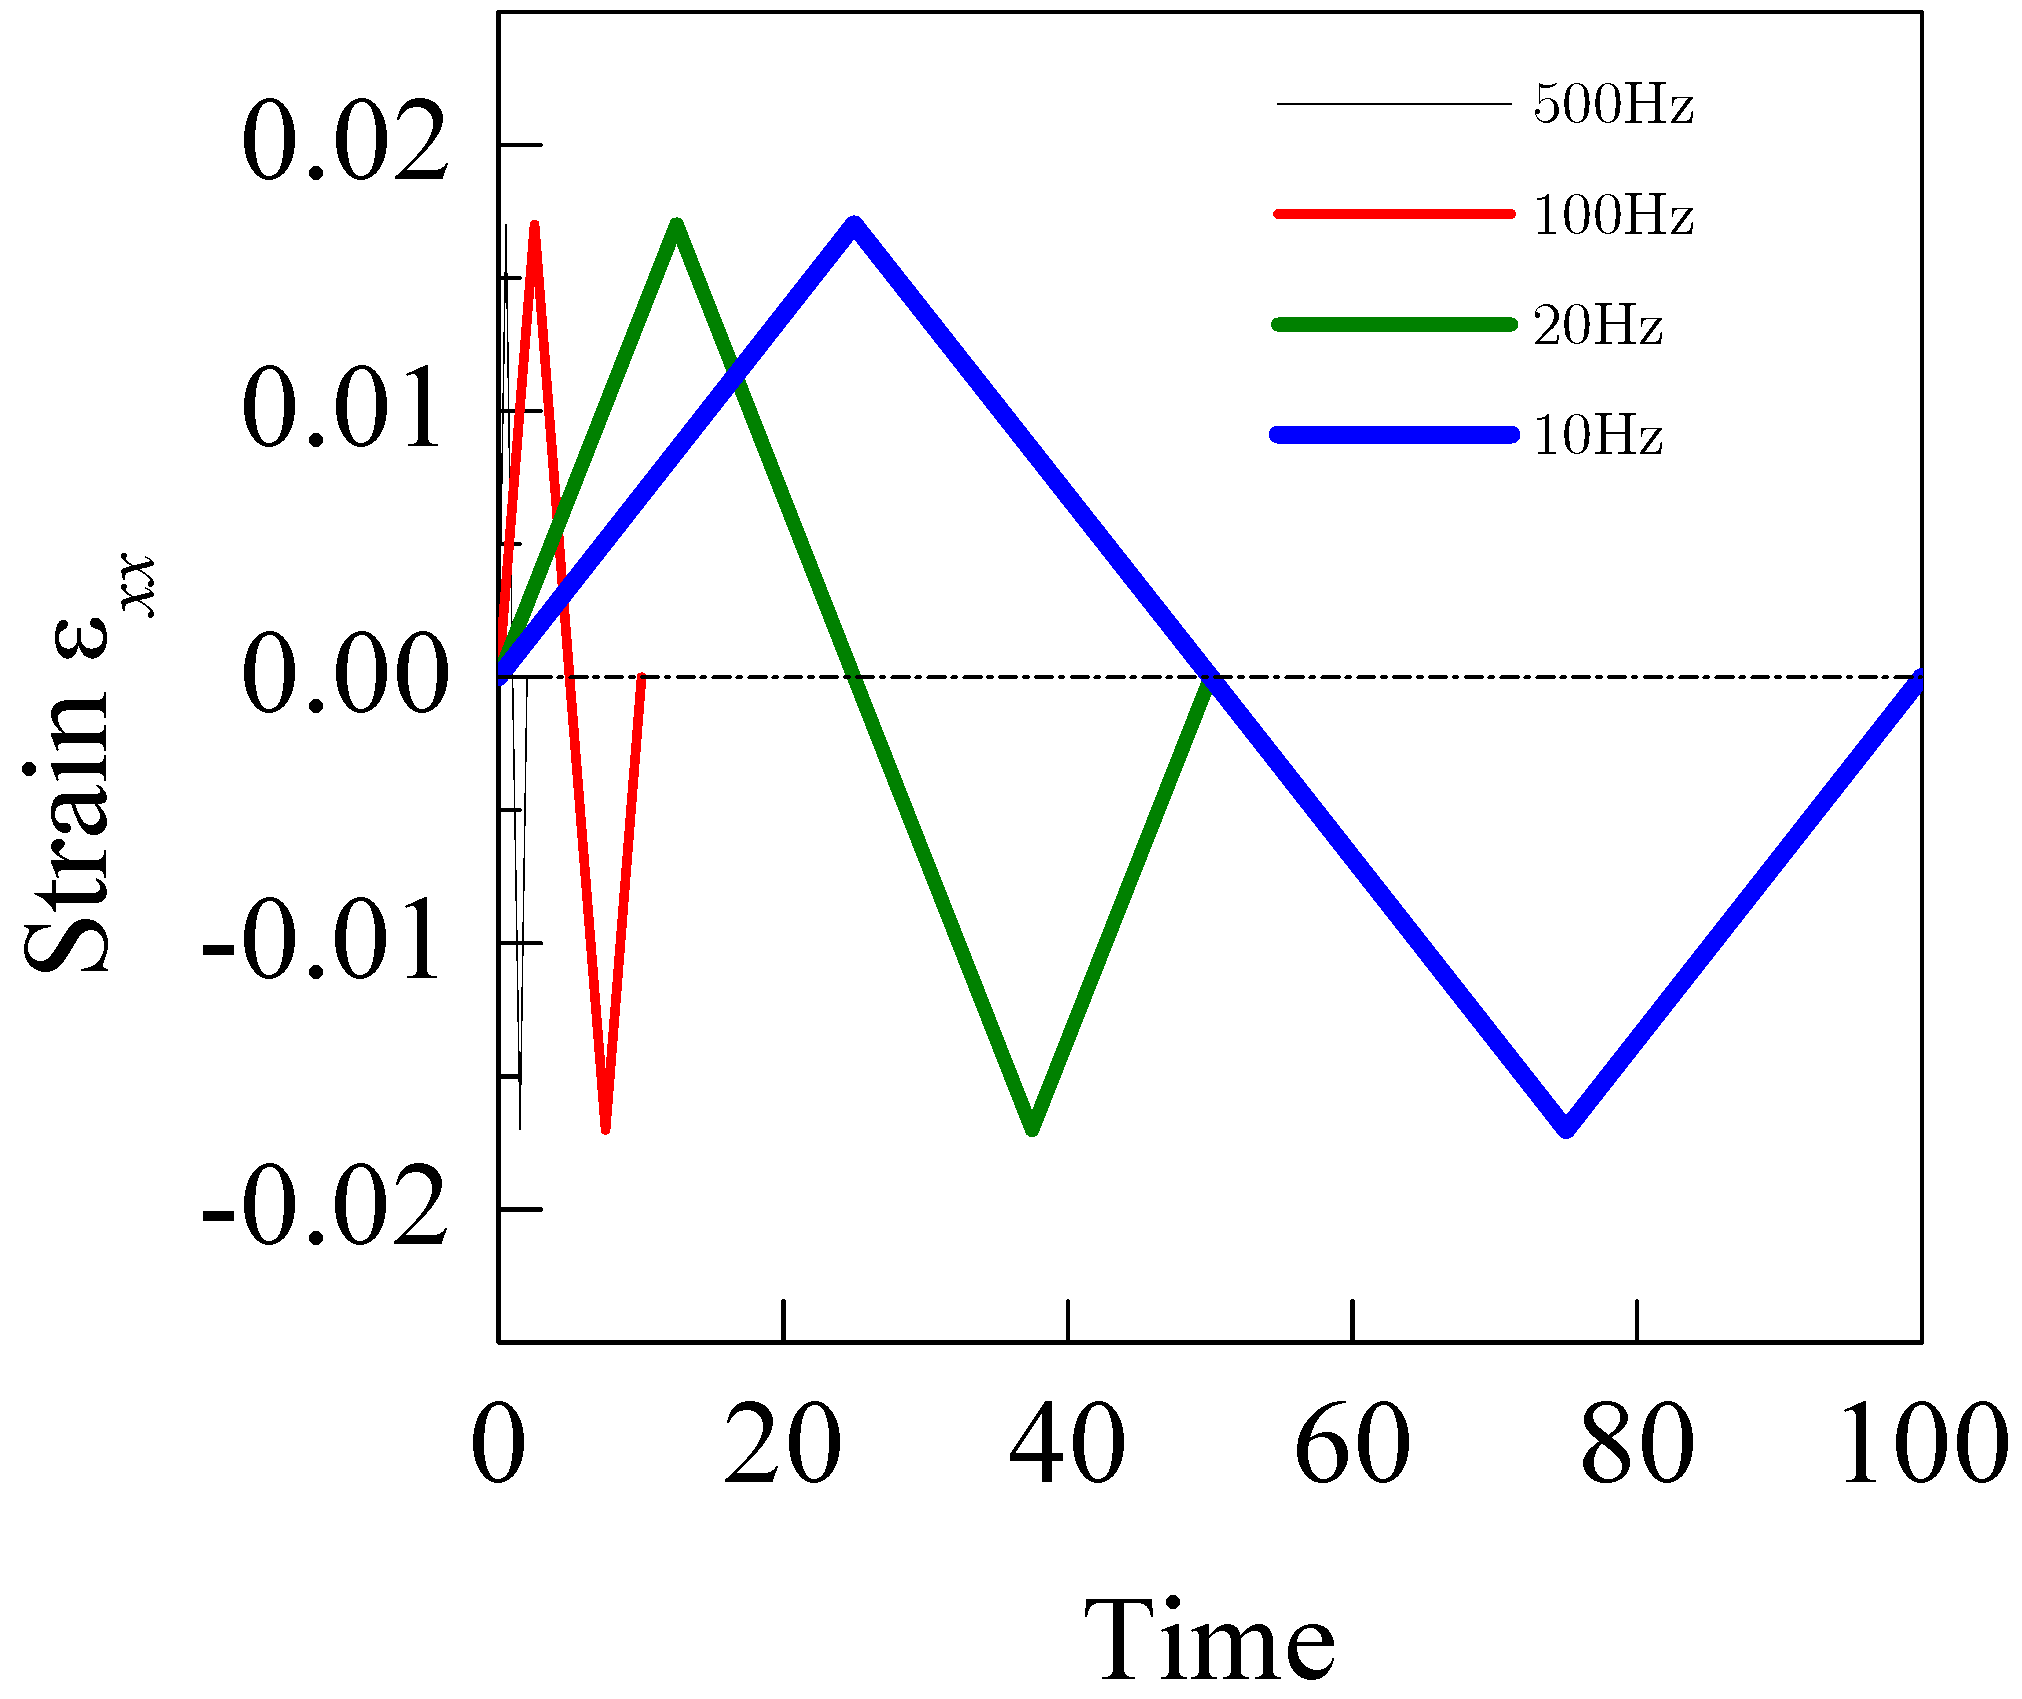
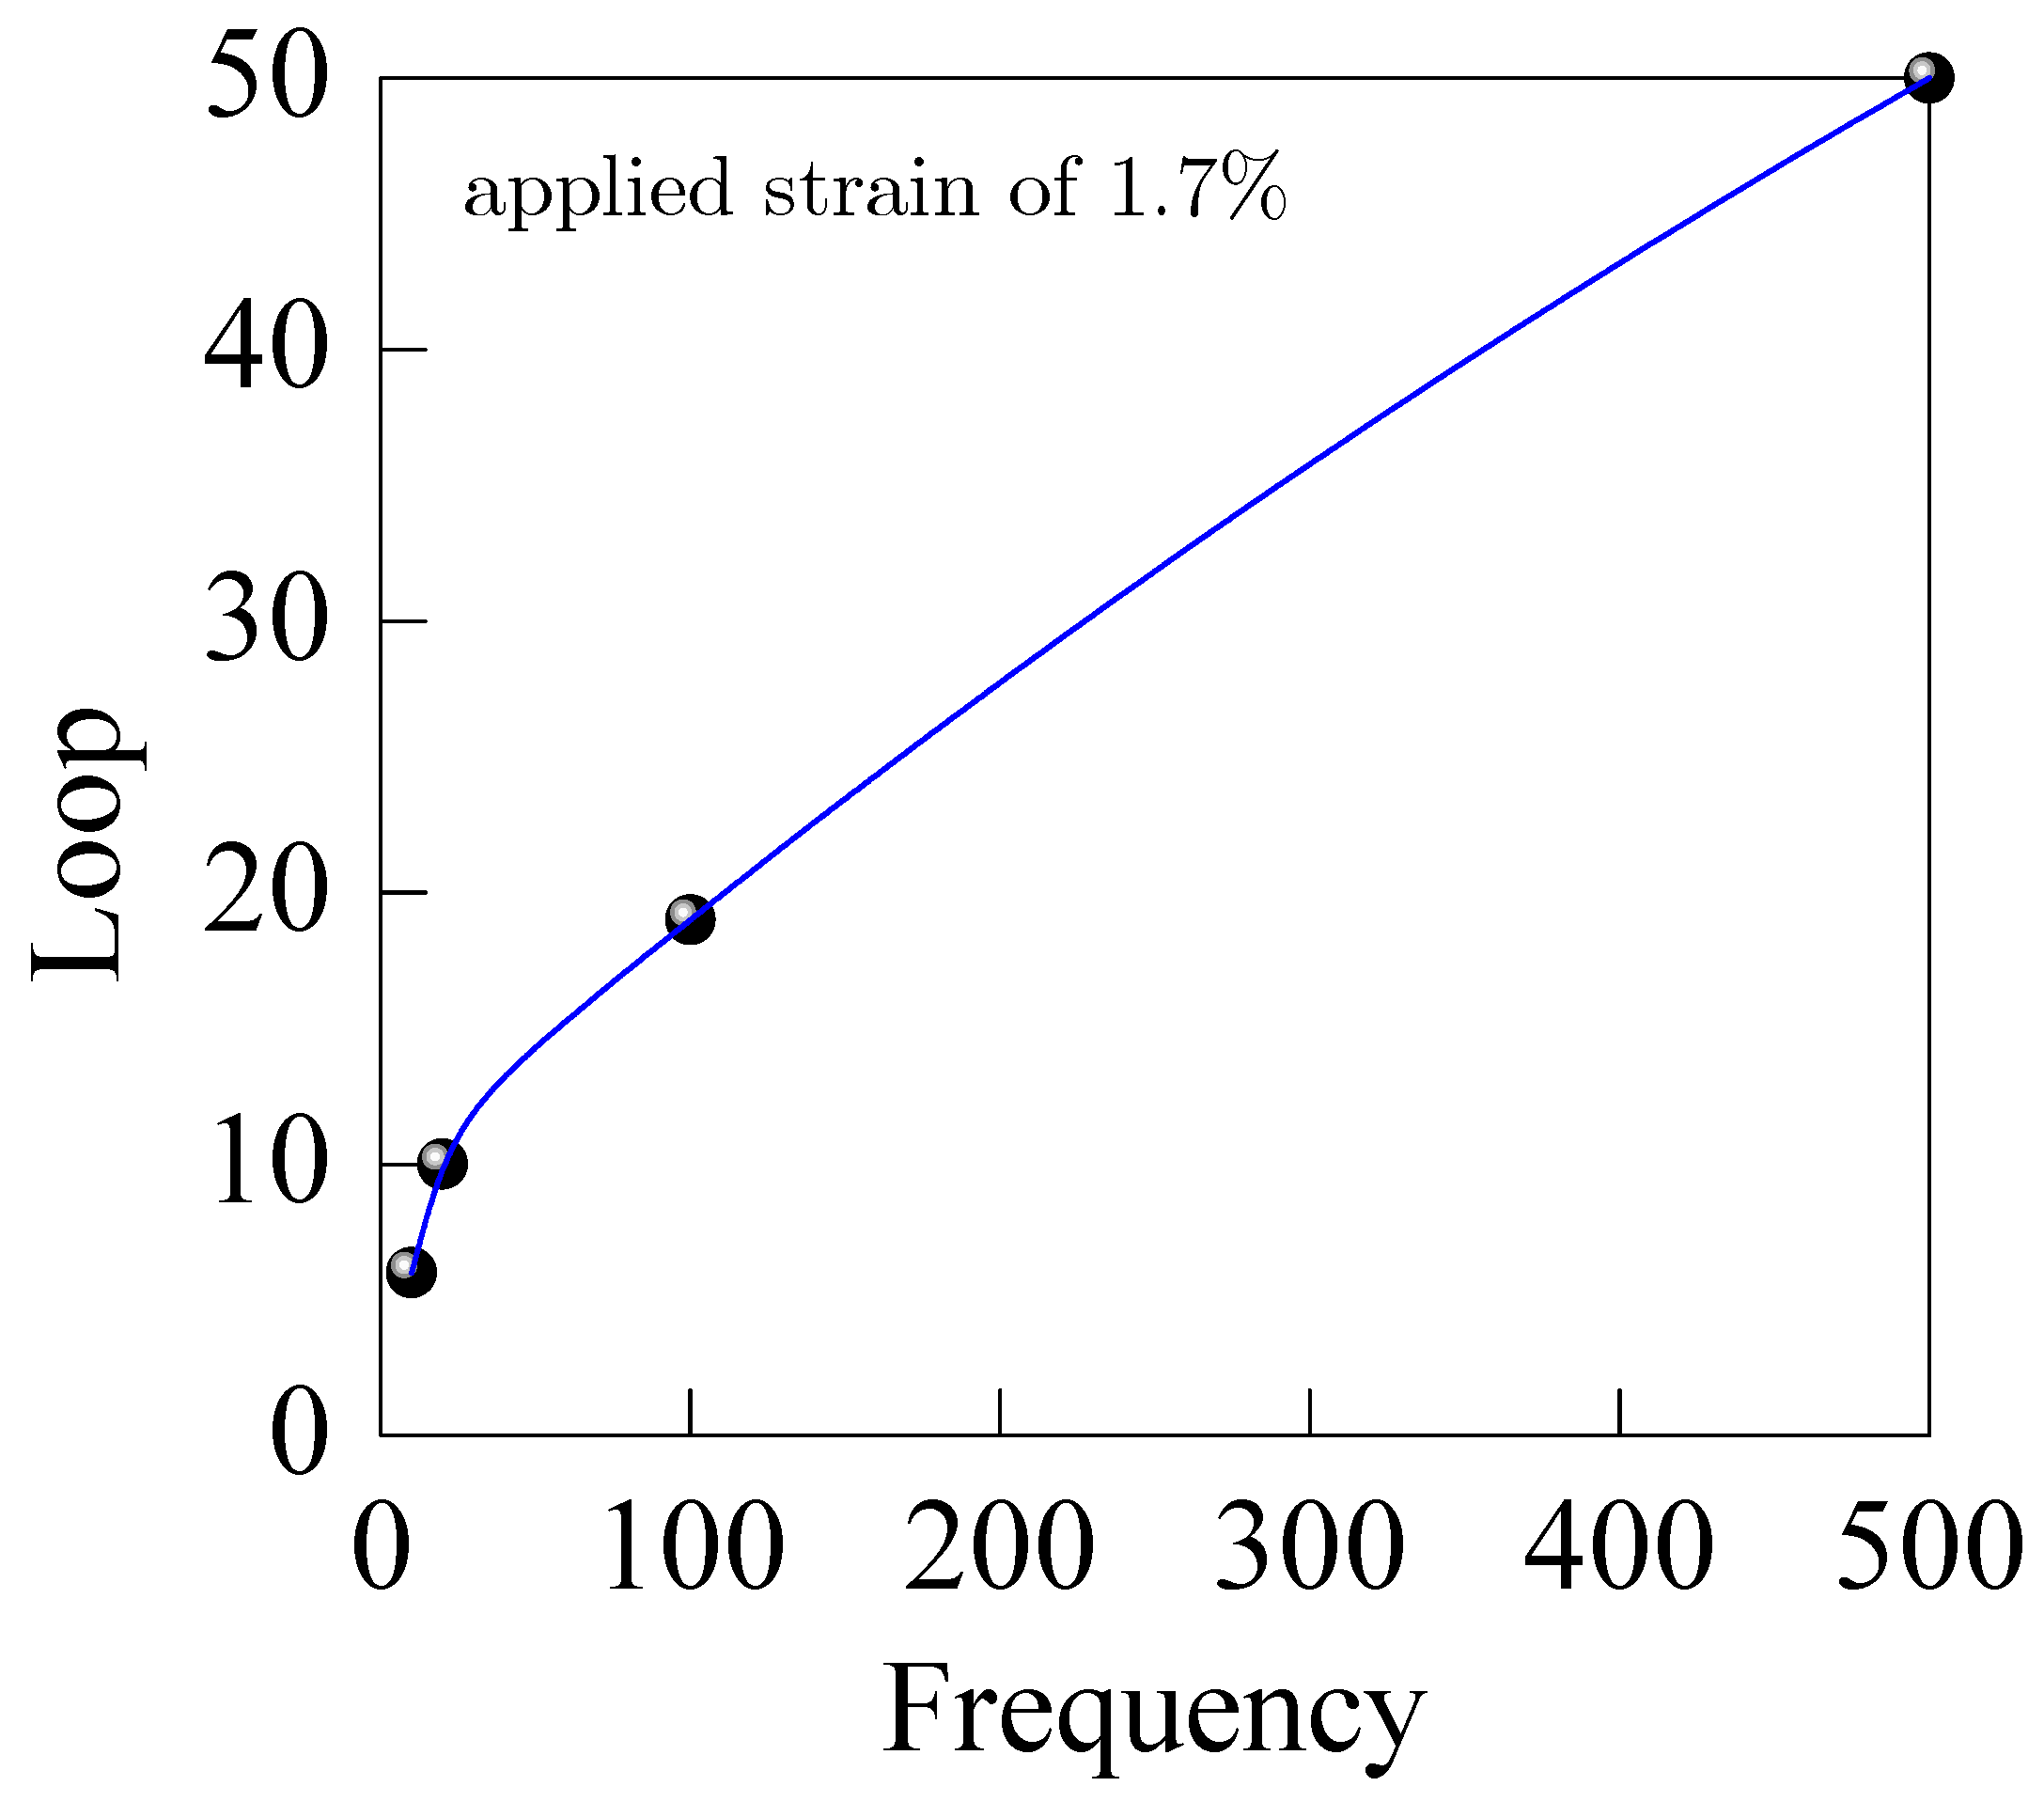
The time period in the ABAQUS code is expressed in terms of time units, which corresponds to seconds, minutes, or hours in the international system of units. For the sake of convenience, the frequency in this work is simply defined as the number of occurrences of a repeating event per 103 time units. Figure 10 shows the typical strain-time plots for various cycle frequencies at an applied strain of 1.7%, and here 10 Hz, 20 Hz, 100 Hz, and 500 Hz are adopted. Figure 11 plots the stress versus cycle number curves for different cycling frequencies. The marked arrows denote the stress drop during the cyclic loading and, therefore, the fatigue life could be approximately estimated. Numerical predictions clearly confirmed that the fatigue loops increase with increasing cycling frequency, and the cycle number versus cycling frequency curve is plotted in Figure 12.
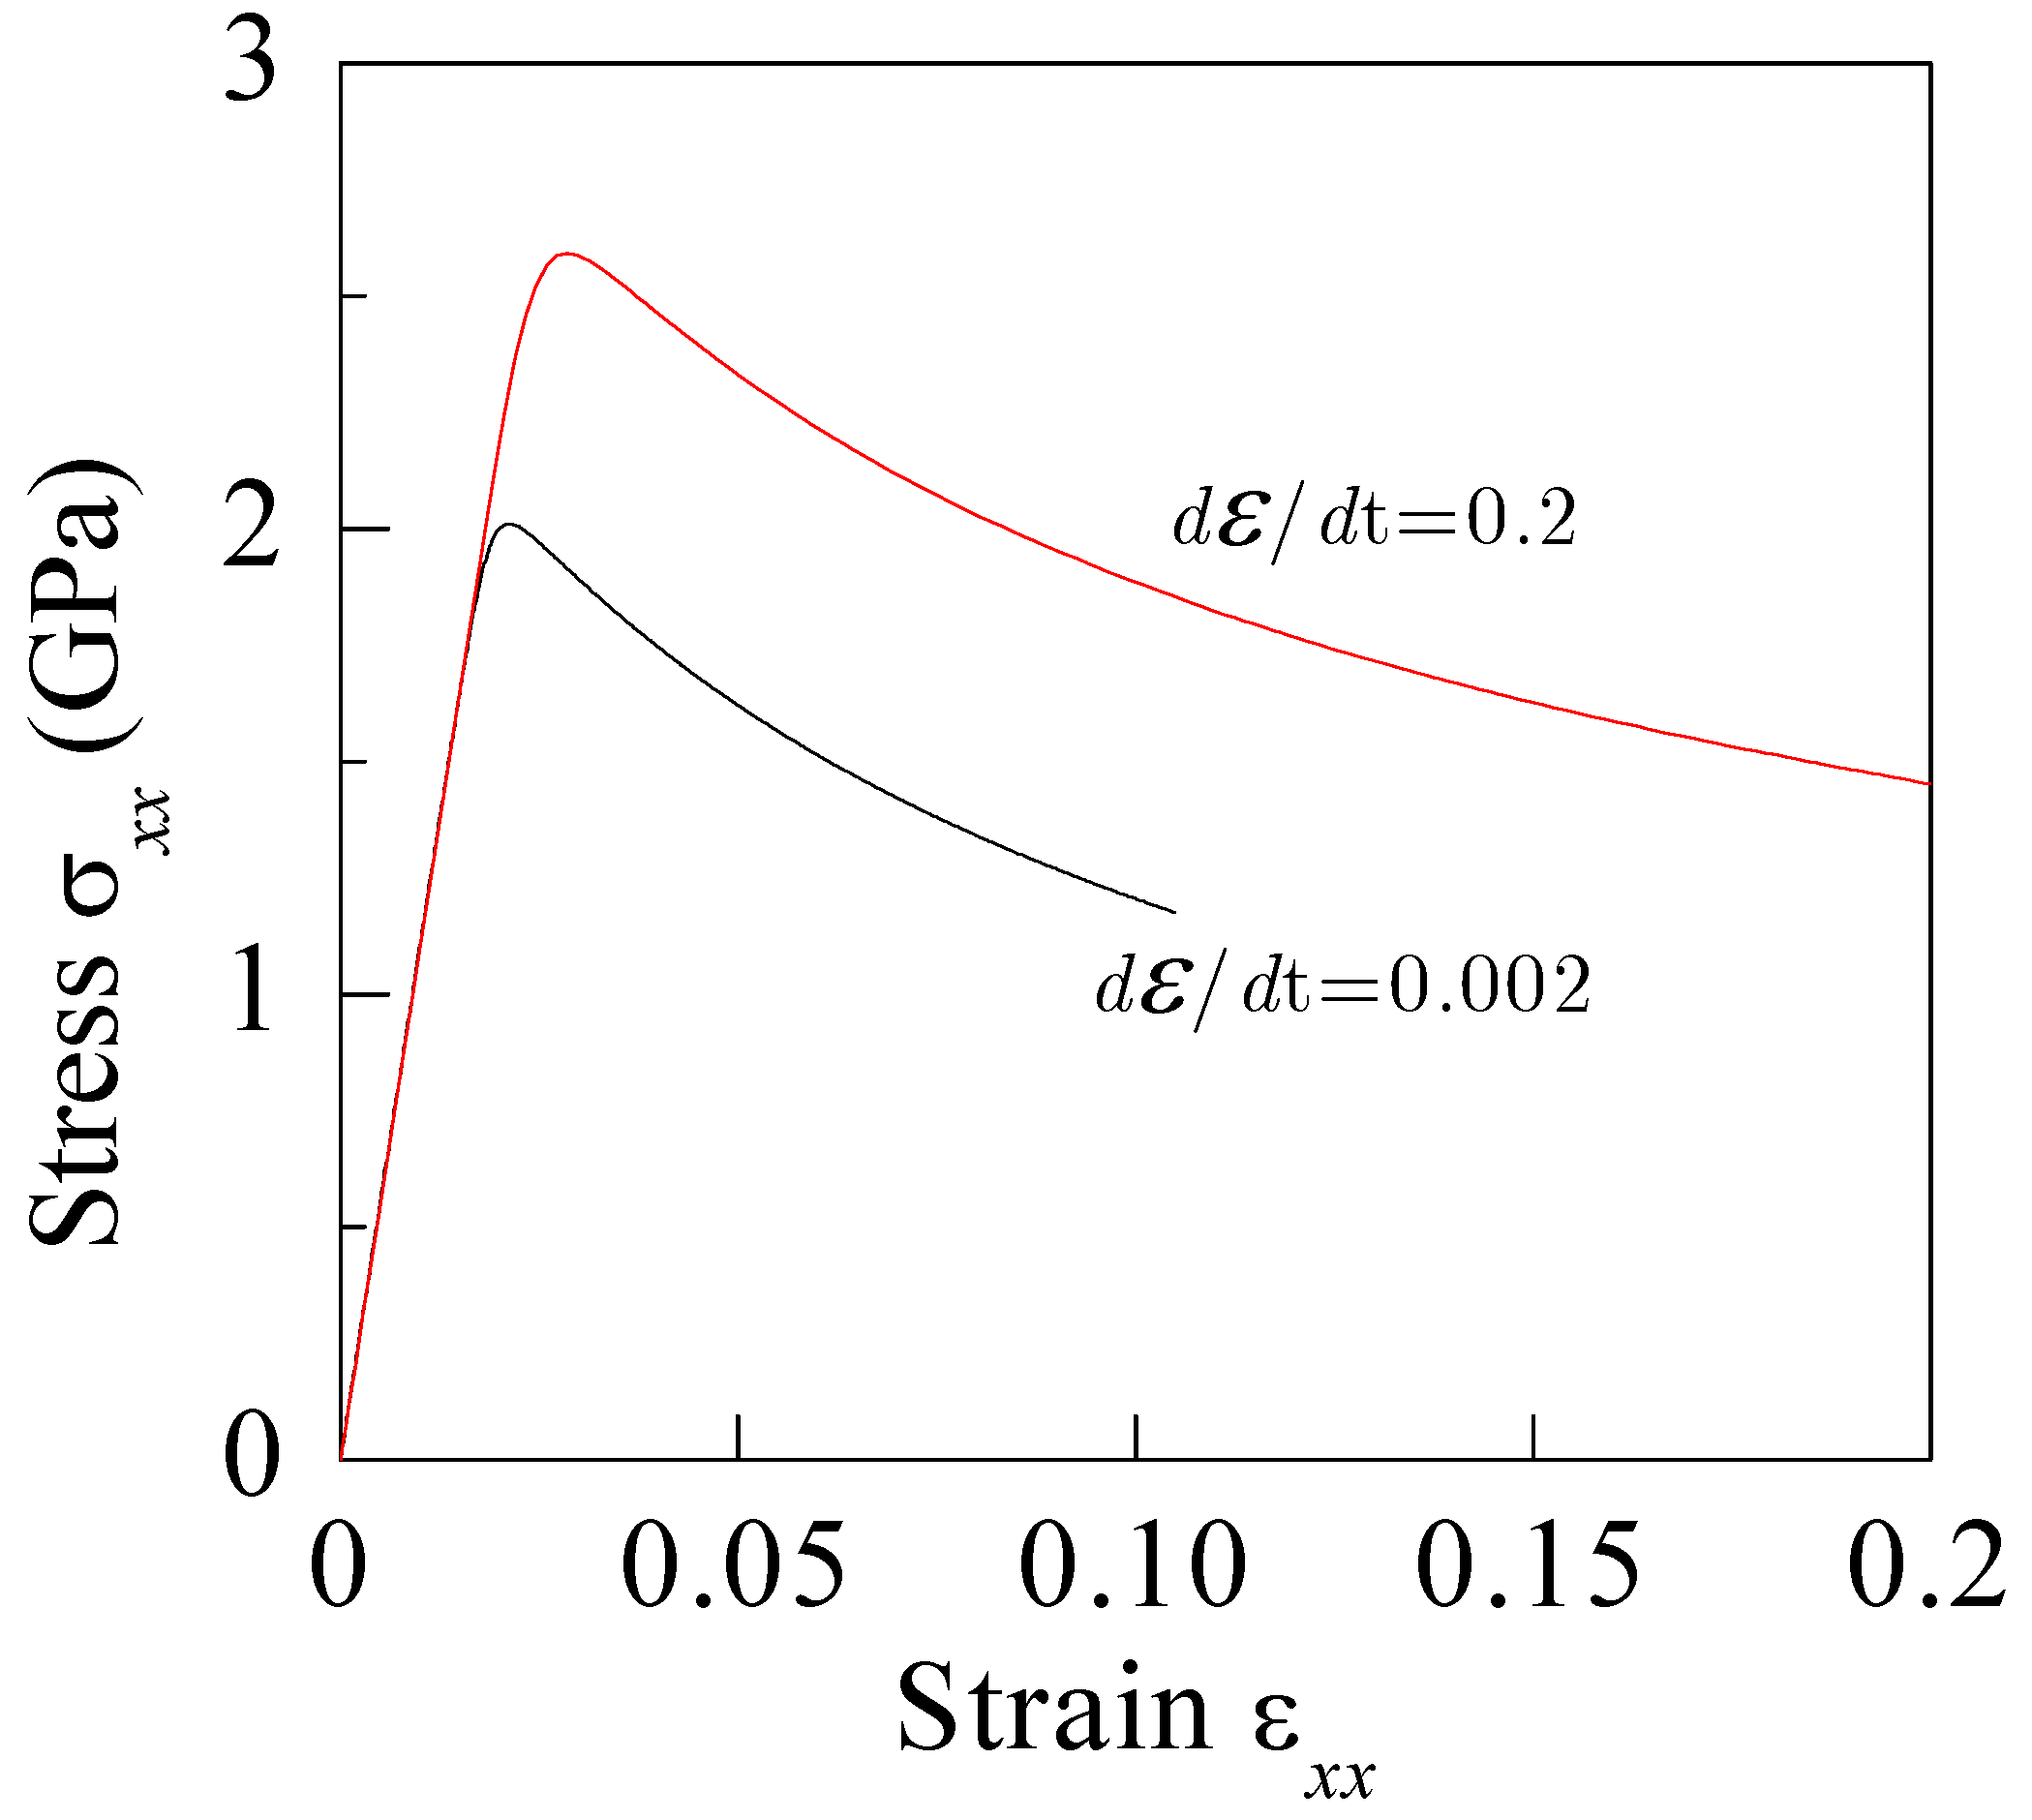
Based on the free volume model, the effect of the loading rate on the stress-strain curves is reflected in Figure 13. As seen from the comparison between the strain rates of 0.2% and 0.002%, the stress value is much higher with the increase in the loading rate at a certain strain. According to the conclusions available in Section 4.3, the fatigue life decreases with an increase in the applied strain. For a given applied strain, the positions of strain at the stress-strain curves of various strain rates are very different. For example, the strain εxx = 2.0% is in the range of elastic stage for the strain rate dε/dt = 0.2, but it belongs to the non-linear stage for the strain rate dε/dt = 0.002. Therefore, the higher the loading rate, the longer the fatigue life. In addition, the low- and high-frequency compression-compression fatigue experiments by Petrusenko et al. [24] showed that the fatigue-endurance limit and mode of the fatigue fracture of this BMG essentially depend on the cycling frequency. However, the direct comparison between the present simulation and their experiment could not be conducted due to the different applied loading mode between them.
5. Conclusions
For the first time, FEM modeling was employed to explain the fatigue damage mechanism in BMGs under tension-compression cyclic loading, and whereby the effect of the applied strain amplitude and cycling frequency was clearly elucidated. Free volume theory was incorporated into ABAQUS code through a user material subroutine UMAT. The shear-band evolution in BMGs under the uniaxial and cyclic loading were analyzed and compared directly. Based on the present work, some typical failure mechanisms were clearly demonstrated. Several main conclusions are reached:
- (1)
- The heterogeneous distribution of initial defects has nearly no effect on the stress-strain relations of BMGs under uniaixal loading;
- (2)
- The applied strain amplitude significantly affects the fatigue life of BMGs, and the load drop cycle number markedly decreases with the increase in the strain amplitude;
- (3)
- For the applied strains in the range of the elastic stage, there is no further free volume accumulated in the BMG samples, and consequently no failure could be reached; and
- (4)
- For the BMG sample under cyclic loading, a stress drop in the stress–loops curves just corresponds to a main shear-band running across the sample. The fatigue life increases with increasing cycling frequency.
Acknowledgments
This work was supported by the Fundamental Research Funds for the Central Universities (No. B11020079), Jiangsu Provincial Natural Science Foundation (No. BK2012407), National Natural Science Foundation of China (11202064) and Program for New Century Excellent Talents in University.
Conflicts of interest
The author declares no conflict of interest.
References
- Jia, H.L.; Liu, F.X.; An, Z.N.; Li, W.D.; Wang, G.Y.; Chu, J.P.; Jang, J.S.C.; Gao, Y.F.; Liaw, P.K. Thin-film metallic glasses for substrate fatigue-property improvements. Thin Solid Films 2014, 561, 2–27. [Google Scholar] [CrossRef]
- Peter, W.H.; Liaw, P.K.; Buchanan, R.A.; Liu, C.T.; Brooks, C.R.; Horton, J.A.J.; Carmichael, C.A.J.; Wright, J.L. Fatigue behavior of Zr52.5Al10Ti5Cu17.9Ni14.6 bulk metallic glass. Intermetallics 2002, 10, 1125–1129. [Google Scholar] [CrossRef]
- Wang, G.Y.; Liaw, P.K.; Peker, A.; Yang, B.; Benson, M.L.; Yuan, W.; Peter, W.H.; Huang, L.; Freels, M.; Buchanan, R.A.; et al. Fatigue behavior of Zr-Ti-Ni-Cu-Be bulk-metallic glasses. Intermetallics 2005, 13, 429–435. [Google Scholar] [CrossRef]
- Wang, G.Y.; Liaw, P.K.; Yokoyama, Y.; Inoue, A.; Liu, C.T. Fatigue behavior of Zr-based bulk-metallic glasses. Mater. Sci. Eng. A 2008, 494, 314–323. [Google Scholar] [CrossRef]
- Menzel, B.C.; Dauskardt, R.H. Stress-life fatigue behavior of a Zr-based bulk metallic glass. Acta Mater. 2006, 54, 935–943. [Google Scholar] [CrossRef]
- Freels, M.; Wang, G.Y.; Zhang, W.; Liaw, P.K.; Inoue, A. Cyclic compression behavior of a Cu-Zr-Al-Ag bulk metallic glass. Intermetallics 2011, 19, 1174–1183. [Google Scholar] [CrossRef]
- Wang, G.Y.; Liaw, P.K.; Yokoyama, Y.; Freels, M.; Inoue, A. The influence of Pd on tension-tension fatigue behavior of Zr-based bulk-metallic glasses. Int. J. Fatigue 2010, 32, 599–604. [Google Scholar] [CrossRef]
- Launey, M.E.; Busch, R.; Kruzic, J.J. Effects of free volume changes and residual stresses on the fatigue and fracture behavior of a Zr-Ti-Ni-Cu-Be bulk metallic glass. Acta Mater. 2008, 56, 500–510. [Google Scholar] [CrossRef]
- Fujita, K.; Zhang, W.; Shen, B.L.; Amiya, K.; Ma, C.L.; Nishiyama, N. Fatigue properties in high strength bulk metallic glasses. Intermetallics 2012, 30, 12–18. [Google Scholar] [CrossRef]
- Qiao, D.C.; Fan, G.J.; Liaw, P.K.; Choo, H. Fatigue behaviors of the Cu47.5Zr47.5Al5 bulk-metallic glass (BMG) and Cu47.5Zr38Hf9.5Al5 BMG composite. Int. J. Fatigue 2007, 29, 2149–2154. [Google Scholar] [CrossRef]
- Yue, Y.; Wang, R.; Ma, D.Q.; Tian, J.F.; Zhang, X.Y.; Jing, Q.; Ma, M.Z.; Liu, R.P. Fatigue behavior of a Zr-based bulk metallic glass under uniaxial tension–tension and three-point bending loading mode. Intermetallics 2015, 60, 86–91. [Google Scholar] [CrossRef]
- Morrison, M.L.; Buchanan, R.A.; Liaw, P.K.; Green, B.A.; Wang, G.Y.; Liu, C.T.; Horton, J.A. Four-point-bending-fatigue behavior of the Zr-based Vitreloy 105 bulk metallic glass. Mater. Sci. Eng. A 2007, 467, 190–197. [Google Scholar] [CrossRef]
- Jang, D.C.; Maaß, R.; Wang, G.Y.; Liaw, P.K.; Greer, J.R. Fatigue deformation of microsized metallic glasses. Scr. Mater. 2013, 68, 773–776. [Google Scholar] [CrossRef]
- Cameron, K.K.; Dauskardt, R.H. Fatigue damage in bulk metallic glass I: Simulation. Scr. Mater. 2006, 54, 349–353. [Google Scholar] [CrossRef]
- Lo, Y.C.; Chou, H.S.; Cheng, Y.T.; Huang, J.C.; Morris, J.R.; Liaw, P.K. Structural relaxation and self-repair behavior in nano-scaled Zr-Cu metallic glass under cyclic loading: Molecular dynamics simulations. Intermetallics 2010, 18, 954–960. [Google Scholar] [CrossRef]
- Sha, Z.D.; Qu, S.X.; Liu, Z.S.; Wang, T.J.; Gao, H. Cyclic deformation in metallic glasses. Nano Lett. 2015, 15, 7010–7015. [Google Scholar] [CrossRef] [PubMed]
- Spaepen, F. A microscopic mechanism for steady state inhomogeneous flow in metallic glasses. Acta Metall. 1976, 25, 407–415. [Google Scholar] [CrossRef]
- Steif, P.S.; Spaepen, F.; Hutchinson, J.W. Strain localization in amorphous metals. Acta Metall. 1982, 30, 447–455. [Google Scholar] [CrossRef]
- Gao, Y.F. An implicit finite element method for simulating inhomogeneous deformation and shear bands of amorphous alloys based on the free-volume model. Model. Simul. Mater. Sci. Eng. 2006, 14, 1329–1345. [Google Scholar] [CrossRef]
- Hibbit, Karlsson, Sorenson. ABAQUS Theory Manual; HKS inc.: Pawtucket, RI, USA, 2010. [Google Scholar]
- Huo, L.S.; Zeng, J.F.; Wang, W.H.; Liu, C.T.; Yang, Y. The dependence of shear modulus on dynamic relaxation and evolution of local structural heterogeneity in a metallic glass. Acta Mater. 2013, 61, 4329–4338. [Google Scholar] [CrossRef]
- Jiang, Y.P. Numerical study of the notch effect on the ductility of bulk metallic glasses (BMGs) based on the free-volume theory. J. Mater. Res. 2016, 31, 765–774. [Google Scholar] [CrossRef]
- Wang, X.D.; Qun, R.T.; Liu, Z.Q.; Zhang, Z.F. Shear band-mediated fatigue cracking mechanism of metallic glass at high stress level. Mater. Sci. Eng. A 2015, 627, 336–339. [Google Scholar] [CrossRef]
- Petrusenko, Yu.; Bakai, A.; Neklyudov, I.; Bakai, S.; Borysenko, V.; Wang, G.; Liaw, P.K.; Huang, L.; Zhang, T. Low- and high-frequency fatigue of bulk metallic glasses. J. Alloy. Compd. 2011, 509, S123–S127. [Google Scholar] [CrossRef]
Figure 1.
(a) Finite element model consisting of 5000 CPE4R elements in ABAQUS package for two-dimensional modeling of plane-strain compression and the corresponding boundary conditions exerted during the computation; and (b) initial free volume distribution.
Figure 1.
(a) Finite element model consisting of 5000 CPE4R elements in ABAQUS package for two-dimensional modeling of plane-strain compression and the corresponding boundary conditions exerted during the computation; and (b) initial free volume distribution.
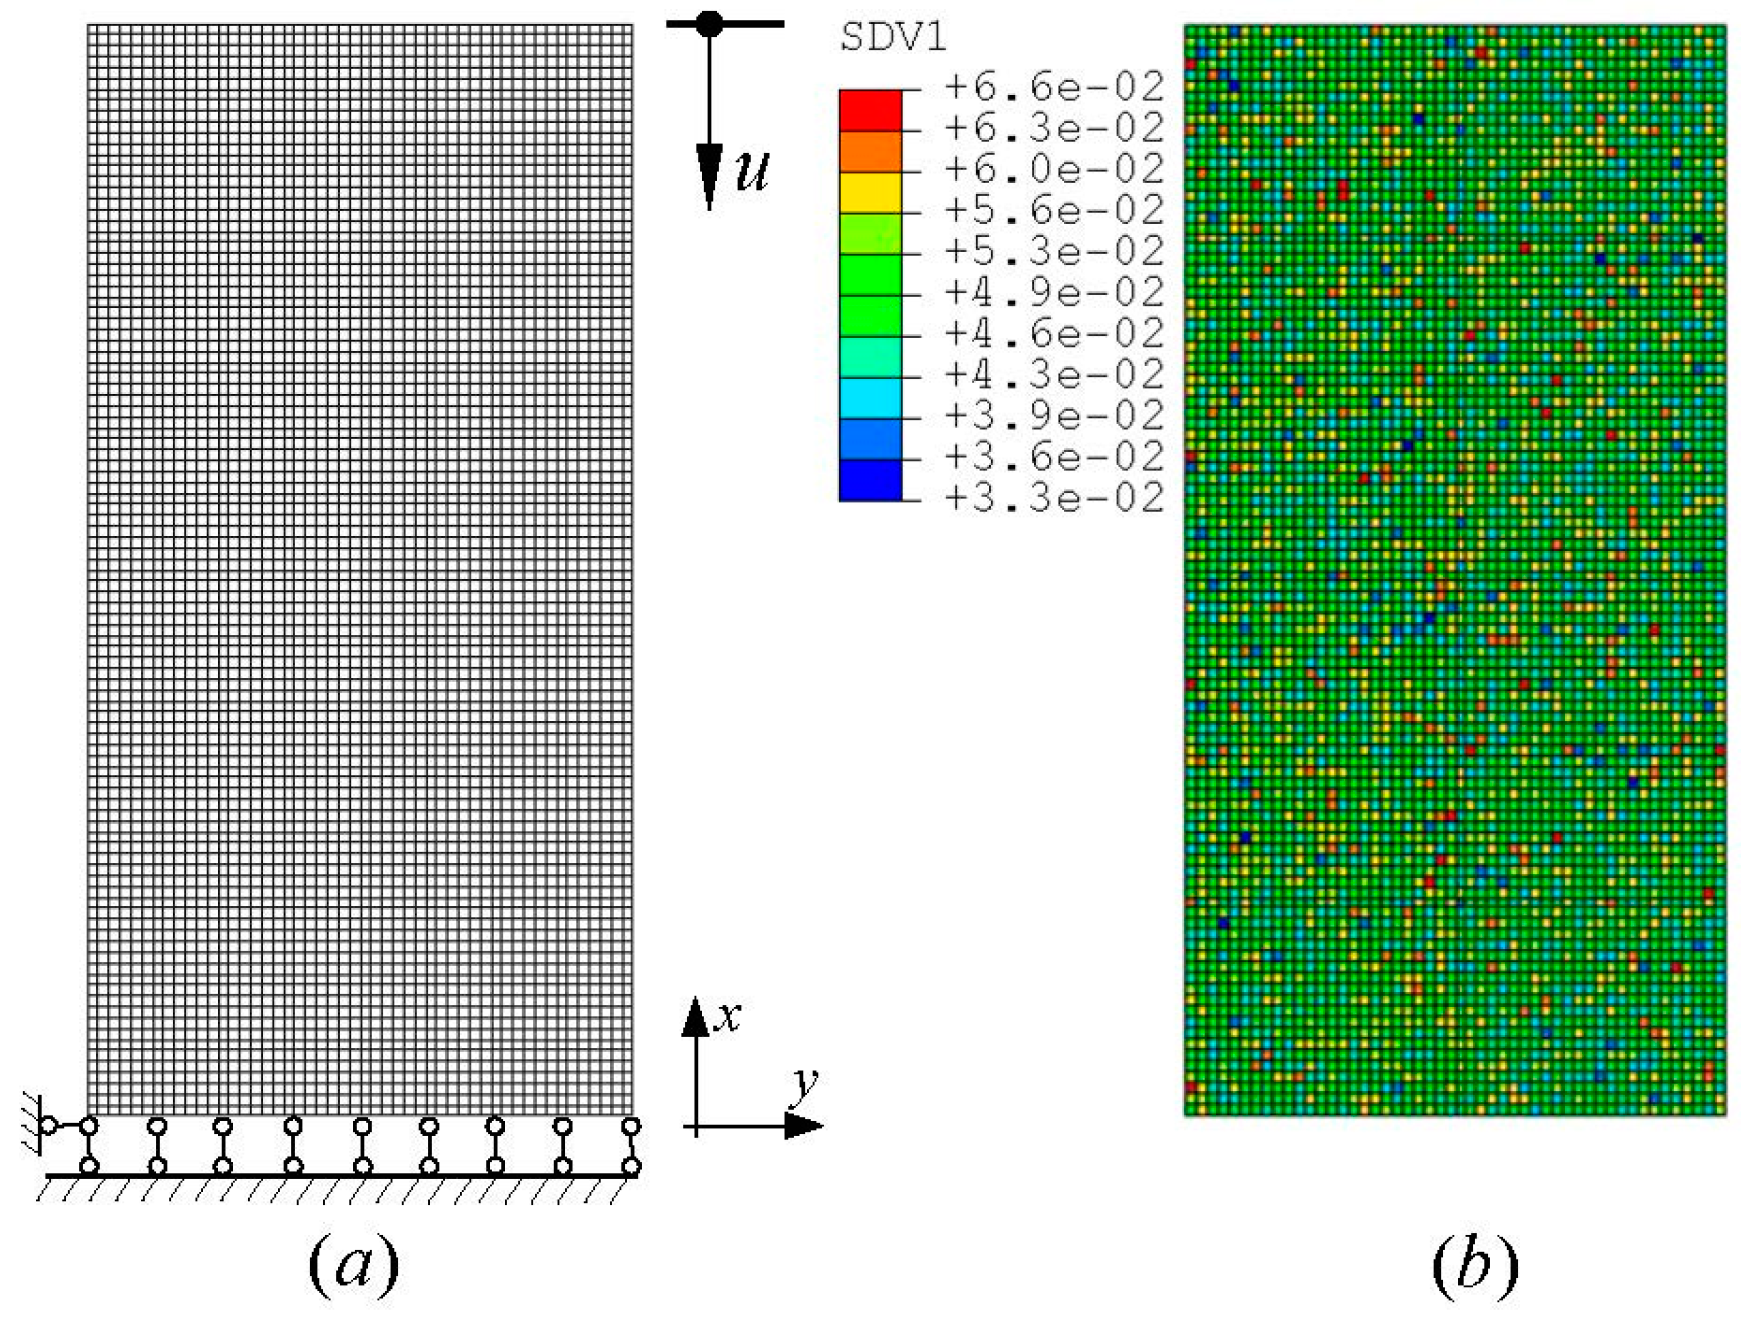
Figure 2.
The uniaxial stress-strain curve of BMGs and the dashed blue line denotes the initial linear elastic stage. The open symbols indicate the applied strains of ε = 0.5%, 1.0%, 1.5%, 1.85%, 2.0%, 2.2%, and 2.5% that will be adopted in the strain-controlled cyclic loading.
Figure 2.
The uniaxial stress-strain curve of BMGs and the dashed blue line denotes the initial linear elastic stage. The open symbols indicate the applied strains of ε = 0.5%, 1.0%, 1.5%, 1.85%, 2.0%, 2.2%, and 2.5% that will be adopted in the strain-controlled cyclic loading.
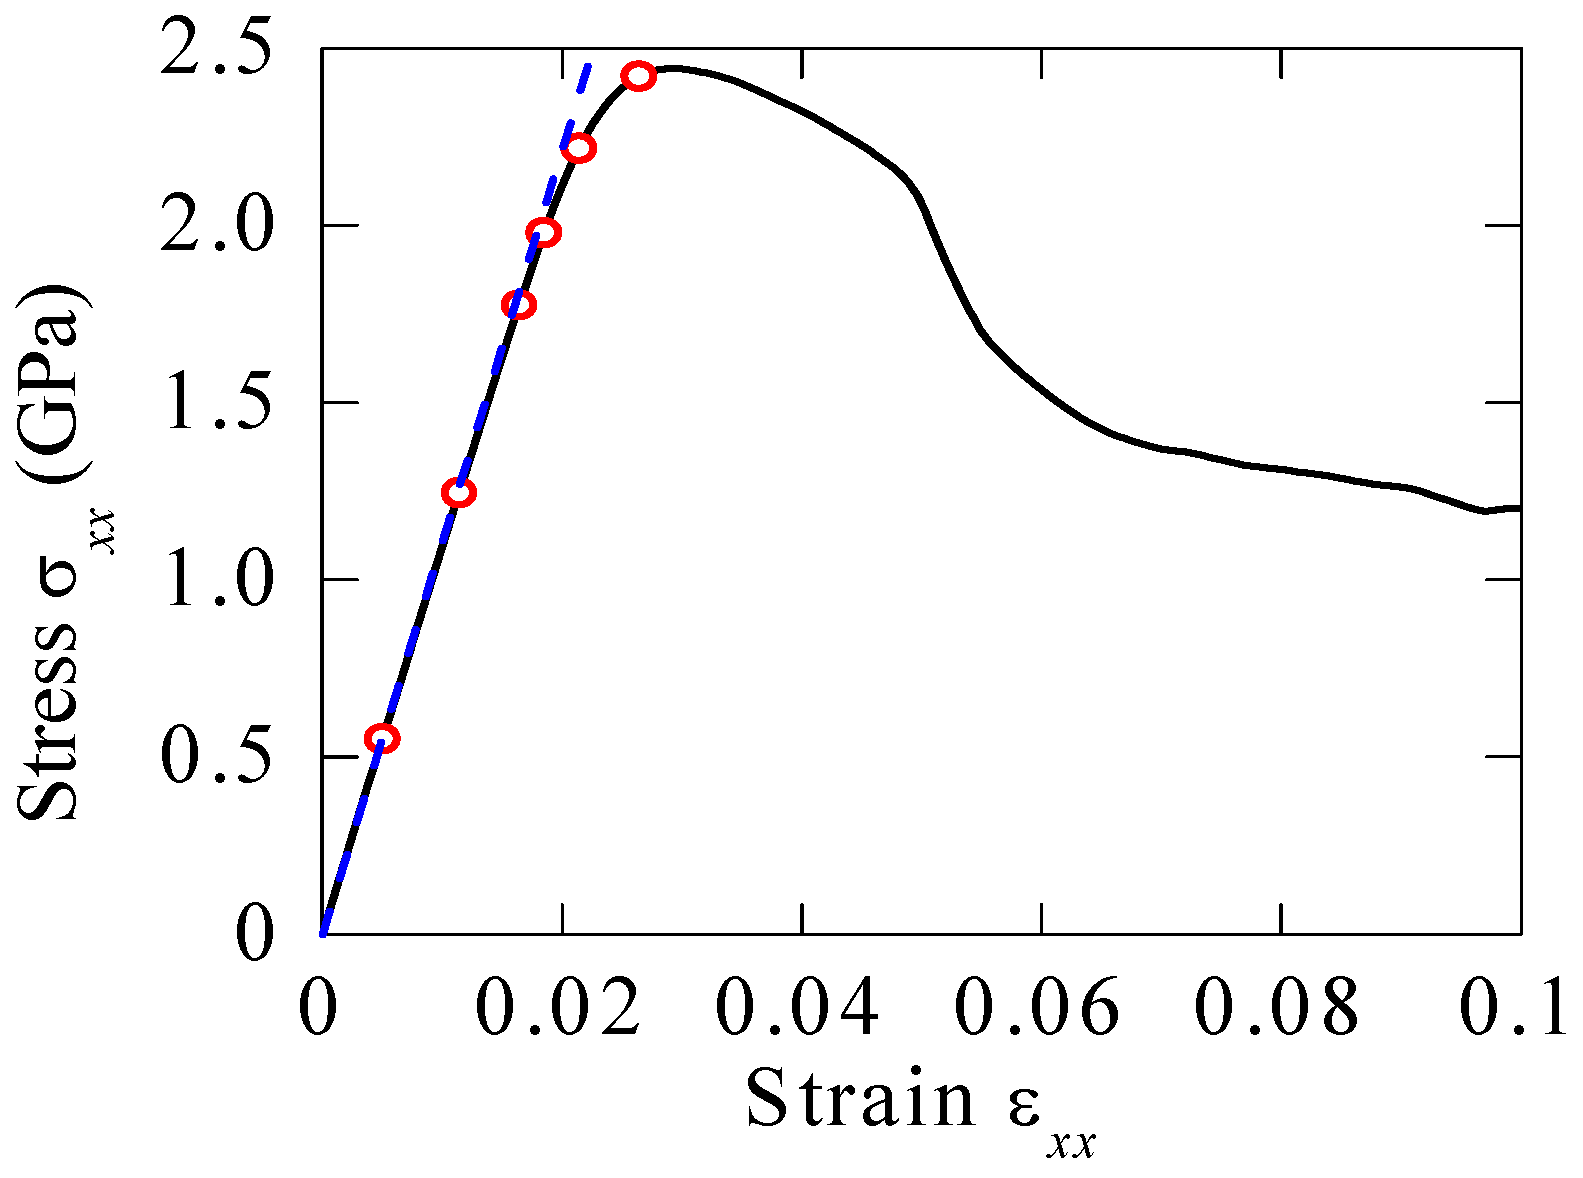
Figure 3.
The stress-strain curve of BMG under uniaxial tension, and the corresponding evolution of the material volume fraction with relatively higher free volume value during the deformation. The blue line denotes a fitting curve in the form of f(x) = axn, and a sequence of snapshots monitoring the shear-band evolution.
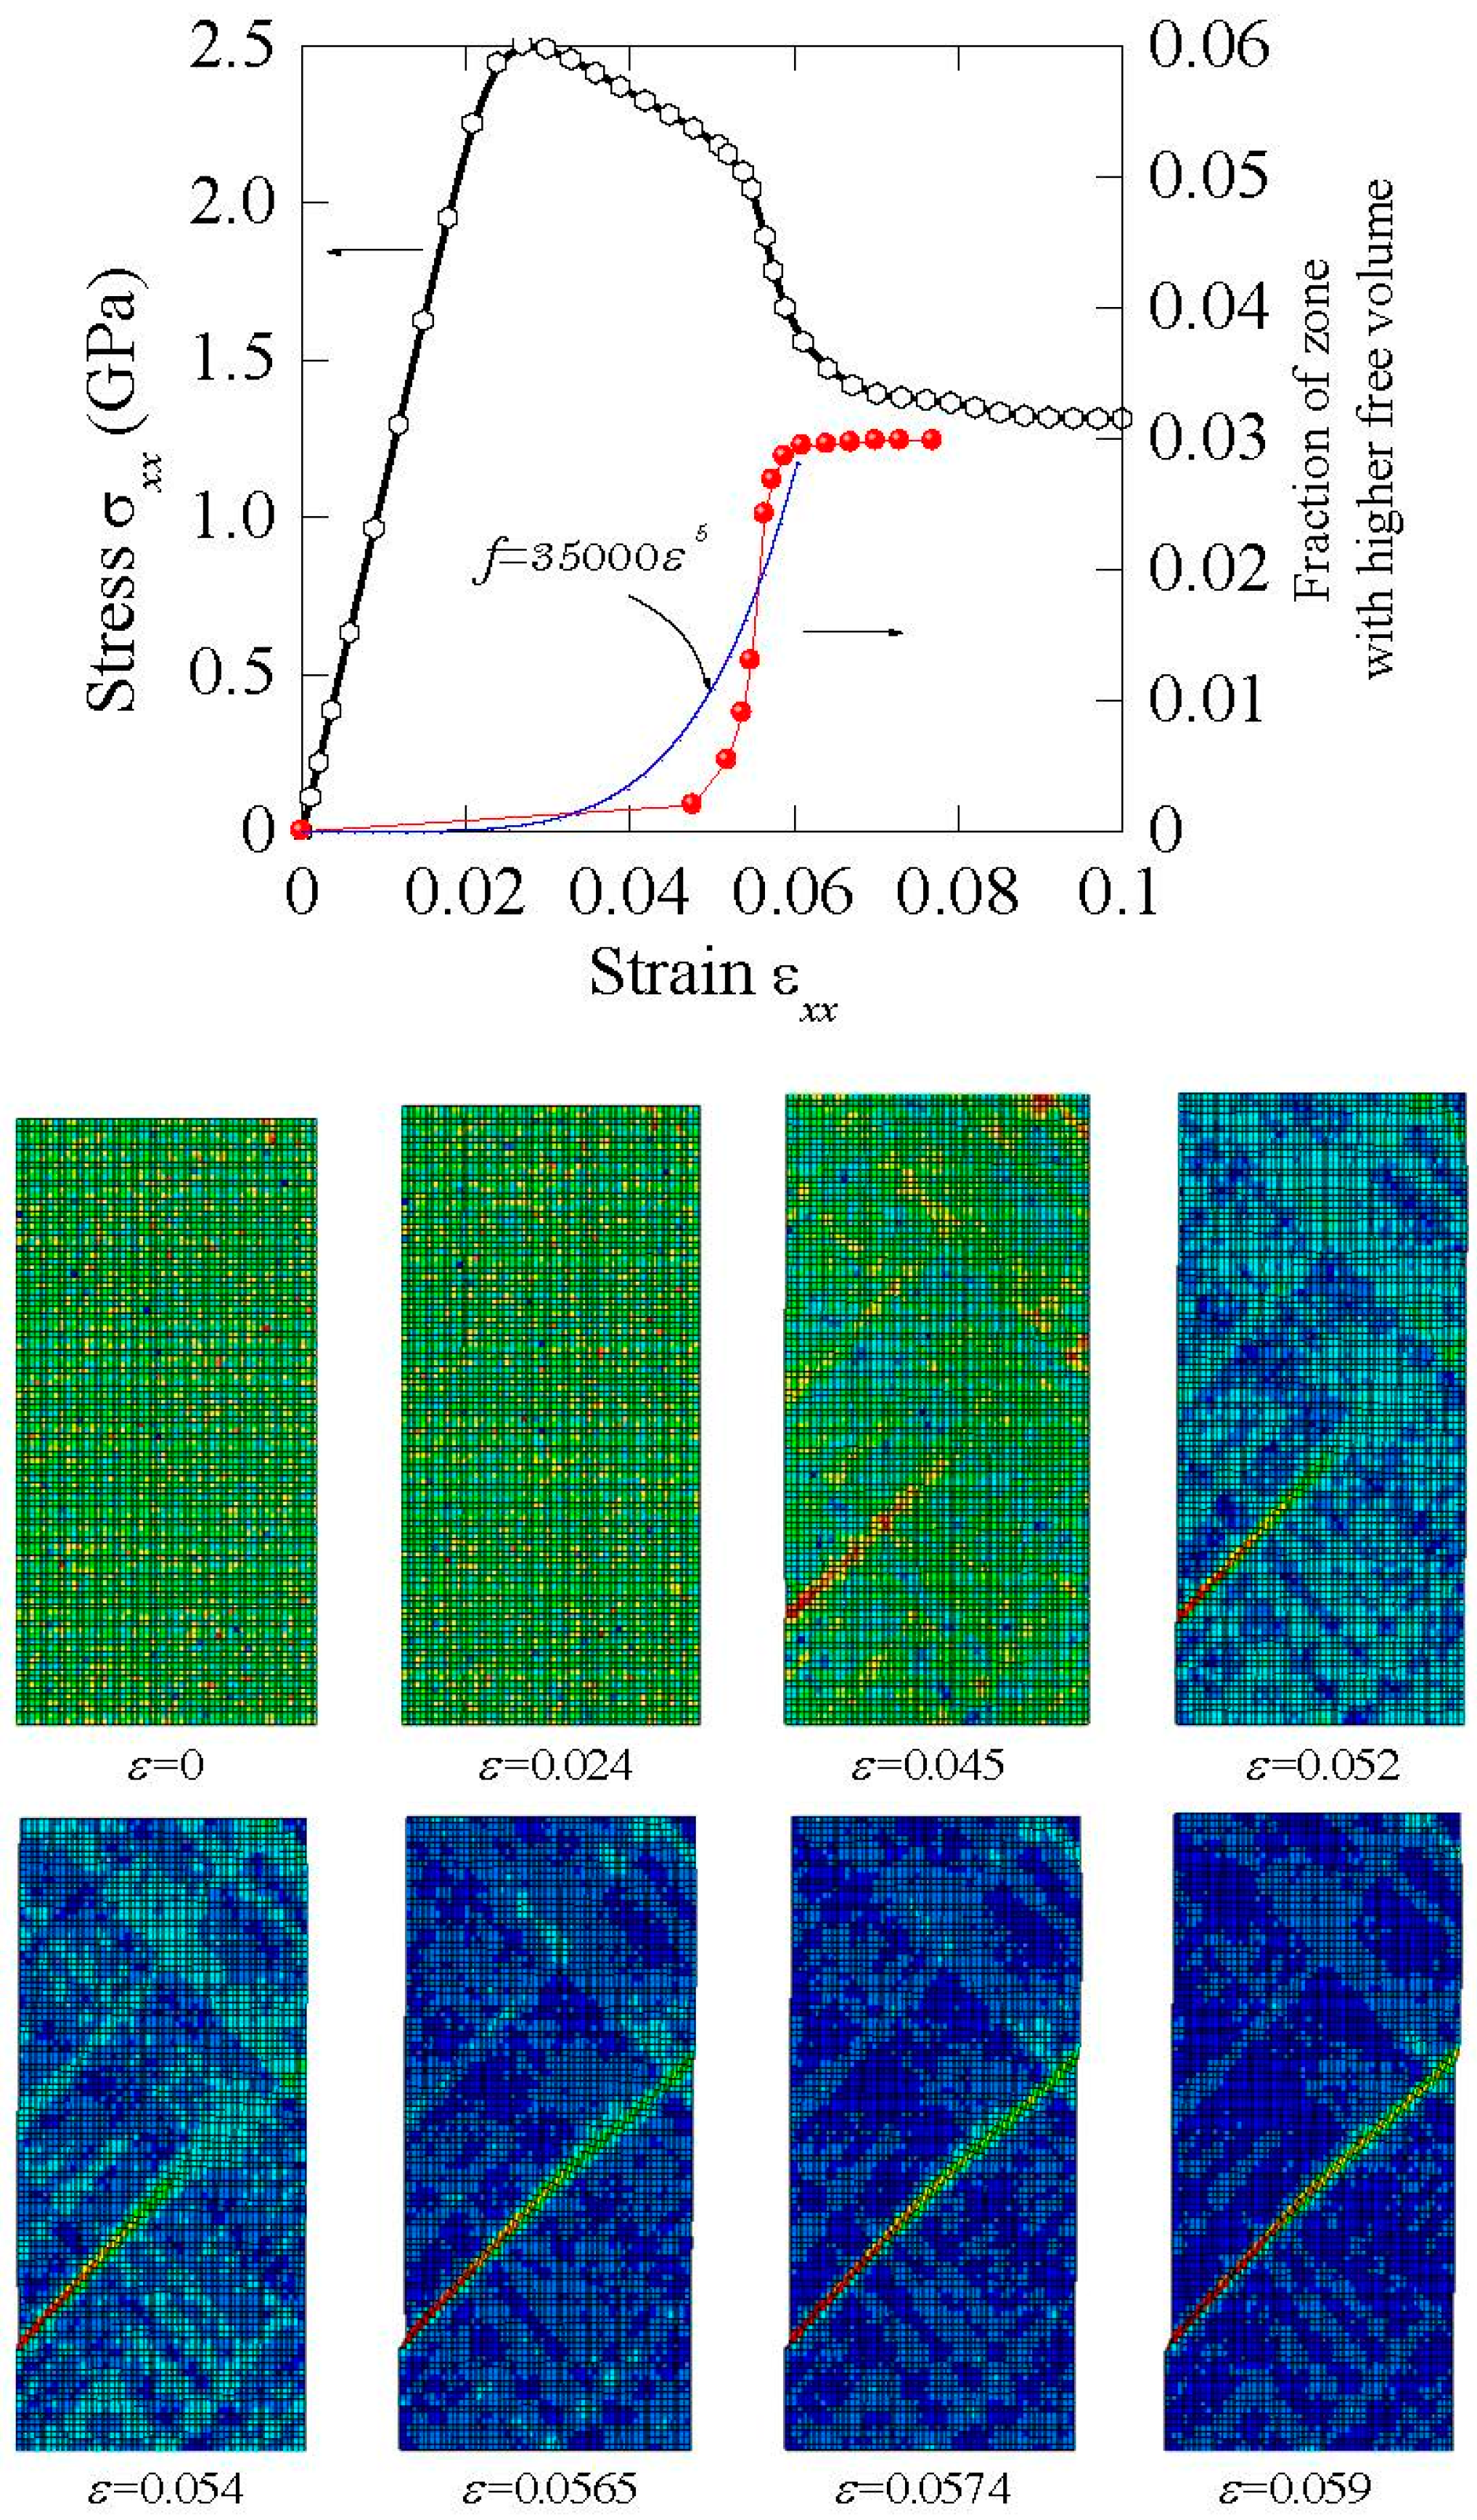
Figure 4.
Dependence of the compressive stress-strain relations on the standard deviation Sd of heterogeneous BMG microstructures. Here, the mean free volume ν0 = 0.05 was used.
Figure 4.
Dependence of the compressive stress-strain relations on the standard deviation Sd of heterogeneous BMG microstructures. Here, the mean free volume ν0 = 0.05 was used.
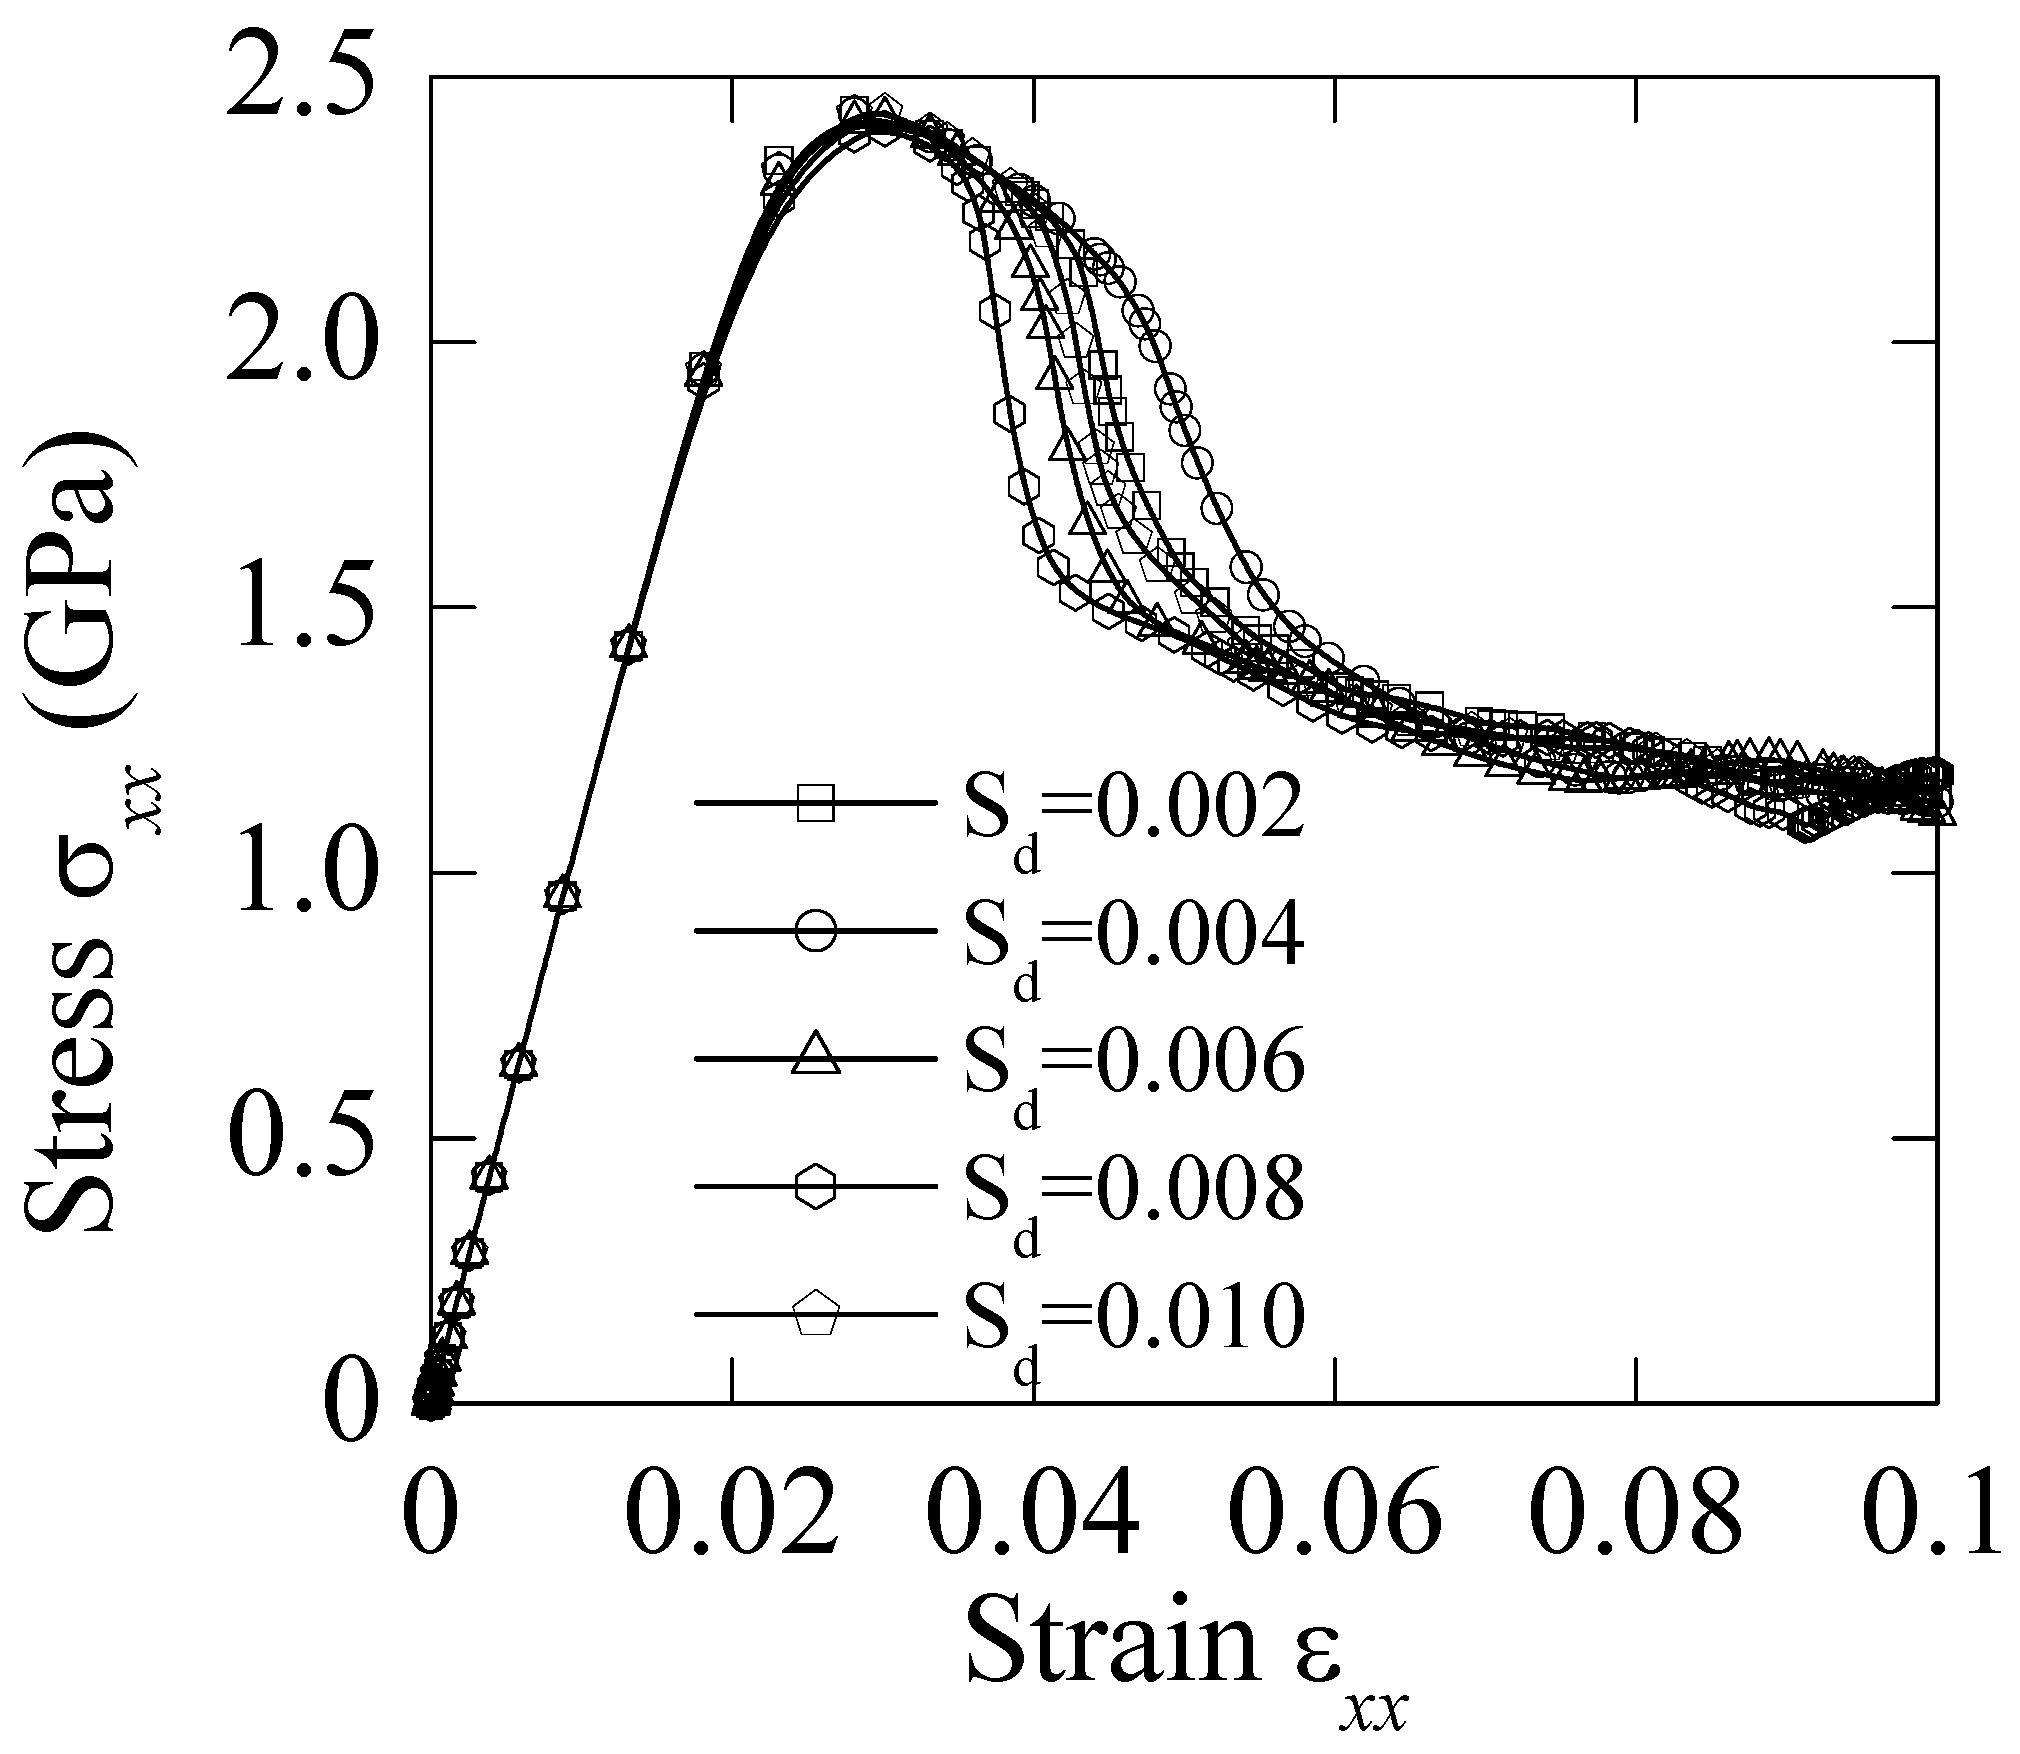
Figure 5.
Typical strain-time plots for tension–compression fatigue simulations with applied strain amplitudes of 0.5%, 1.5%, and 2.5%.
Figure 5.
Typical strain-time plots for tension–compression fatigue simulations with applied strain amplitudes of 0.5%, 1.5%, and 2.5%.
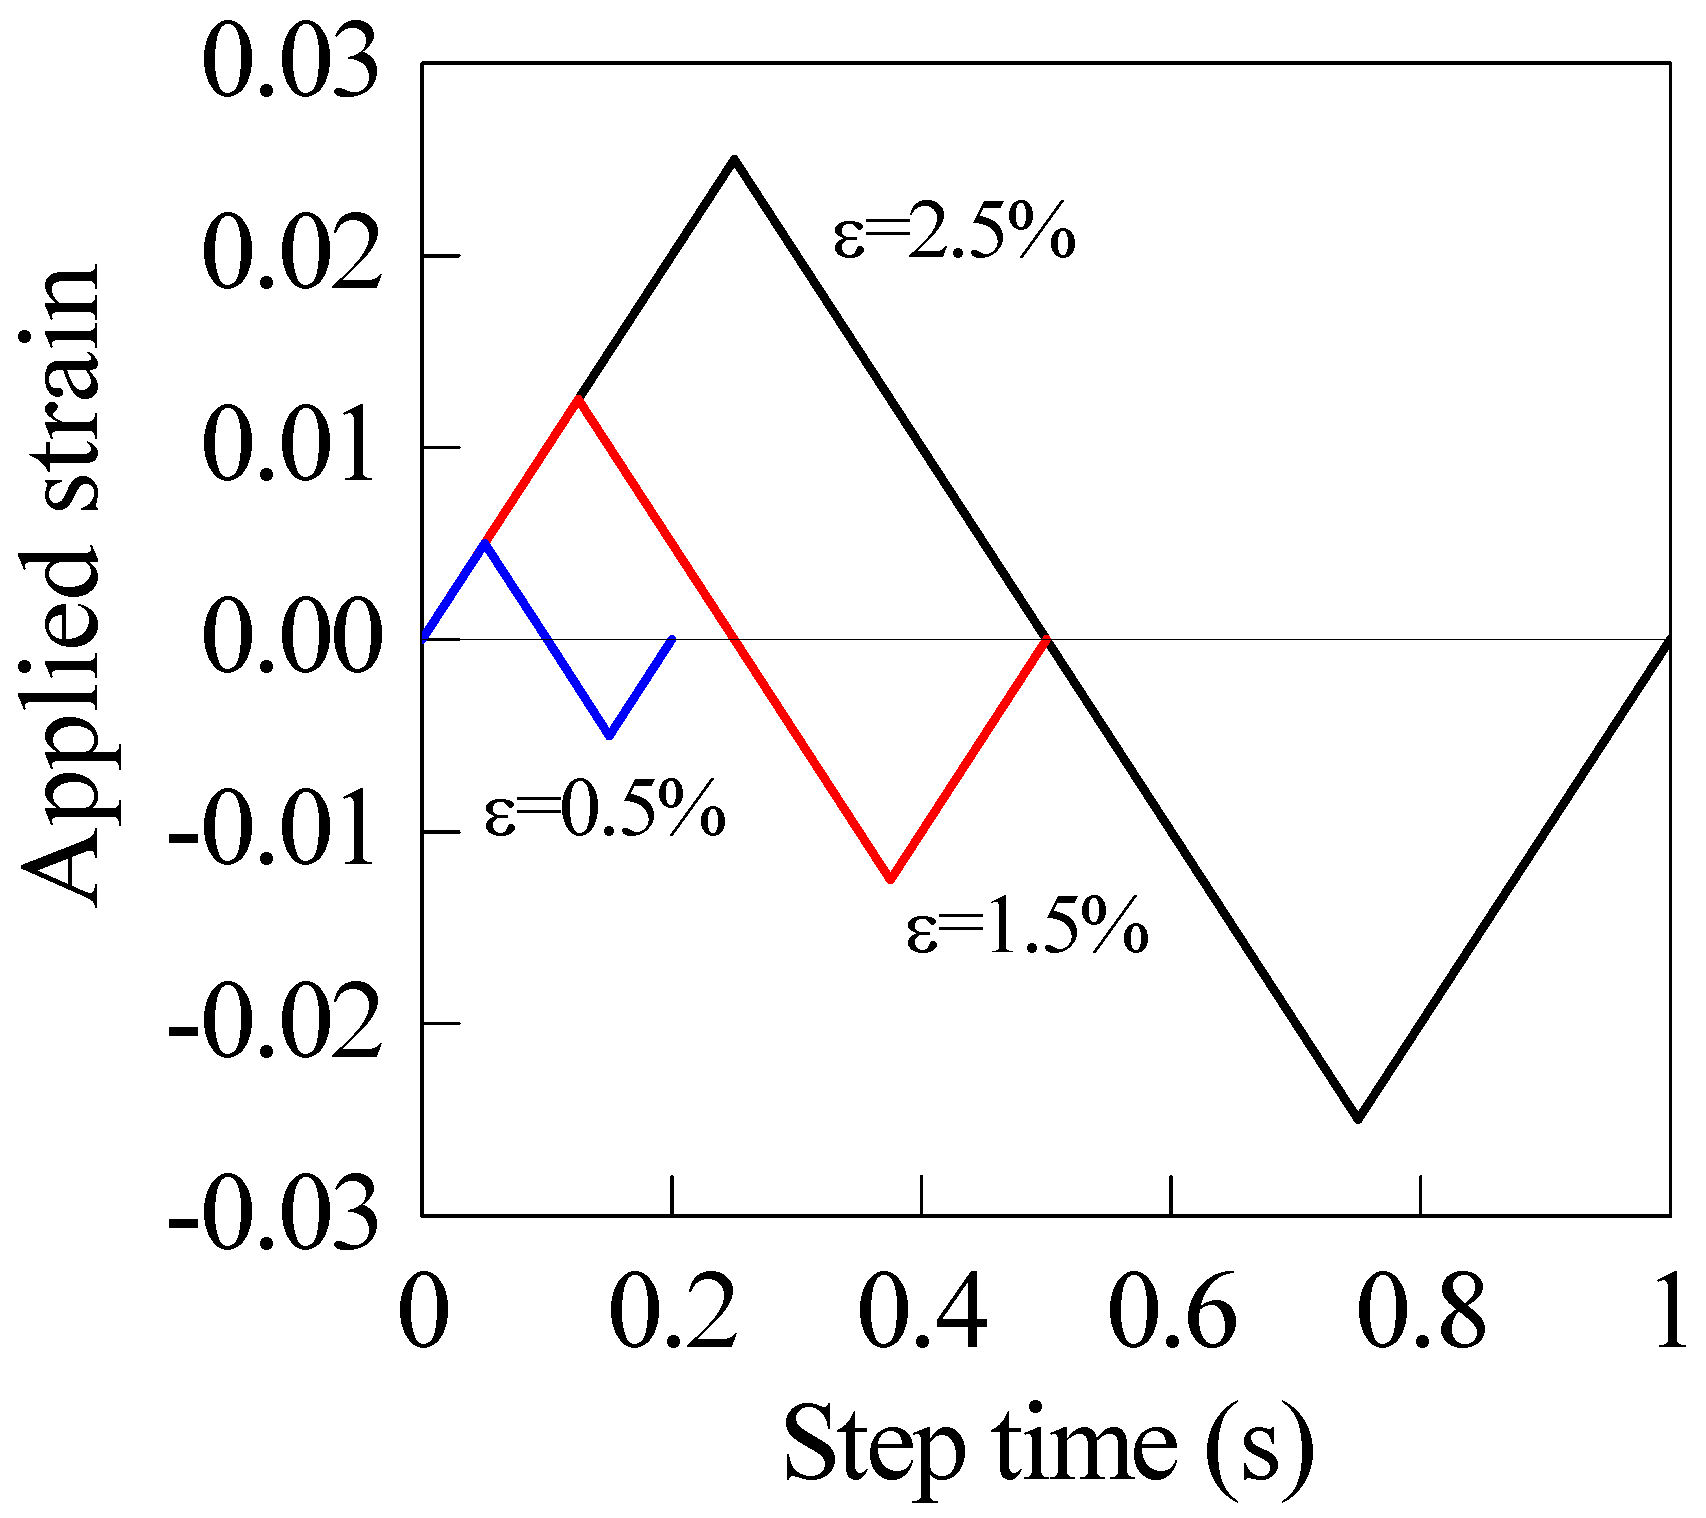
Figure 6.
Evolution of shear-band under cyclic loading. Stress as a function of cycle number for tension-compression cyclic loading with applied strain of 2.2%, with the stress drop indicated by an arrow correponding to a main shear-band formation; snapshots of shear-band evolution with cyclic numbers.
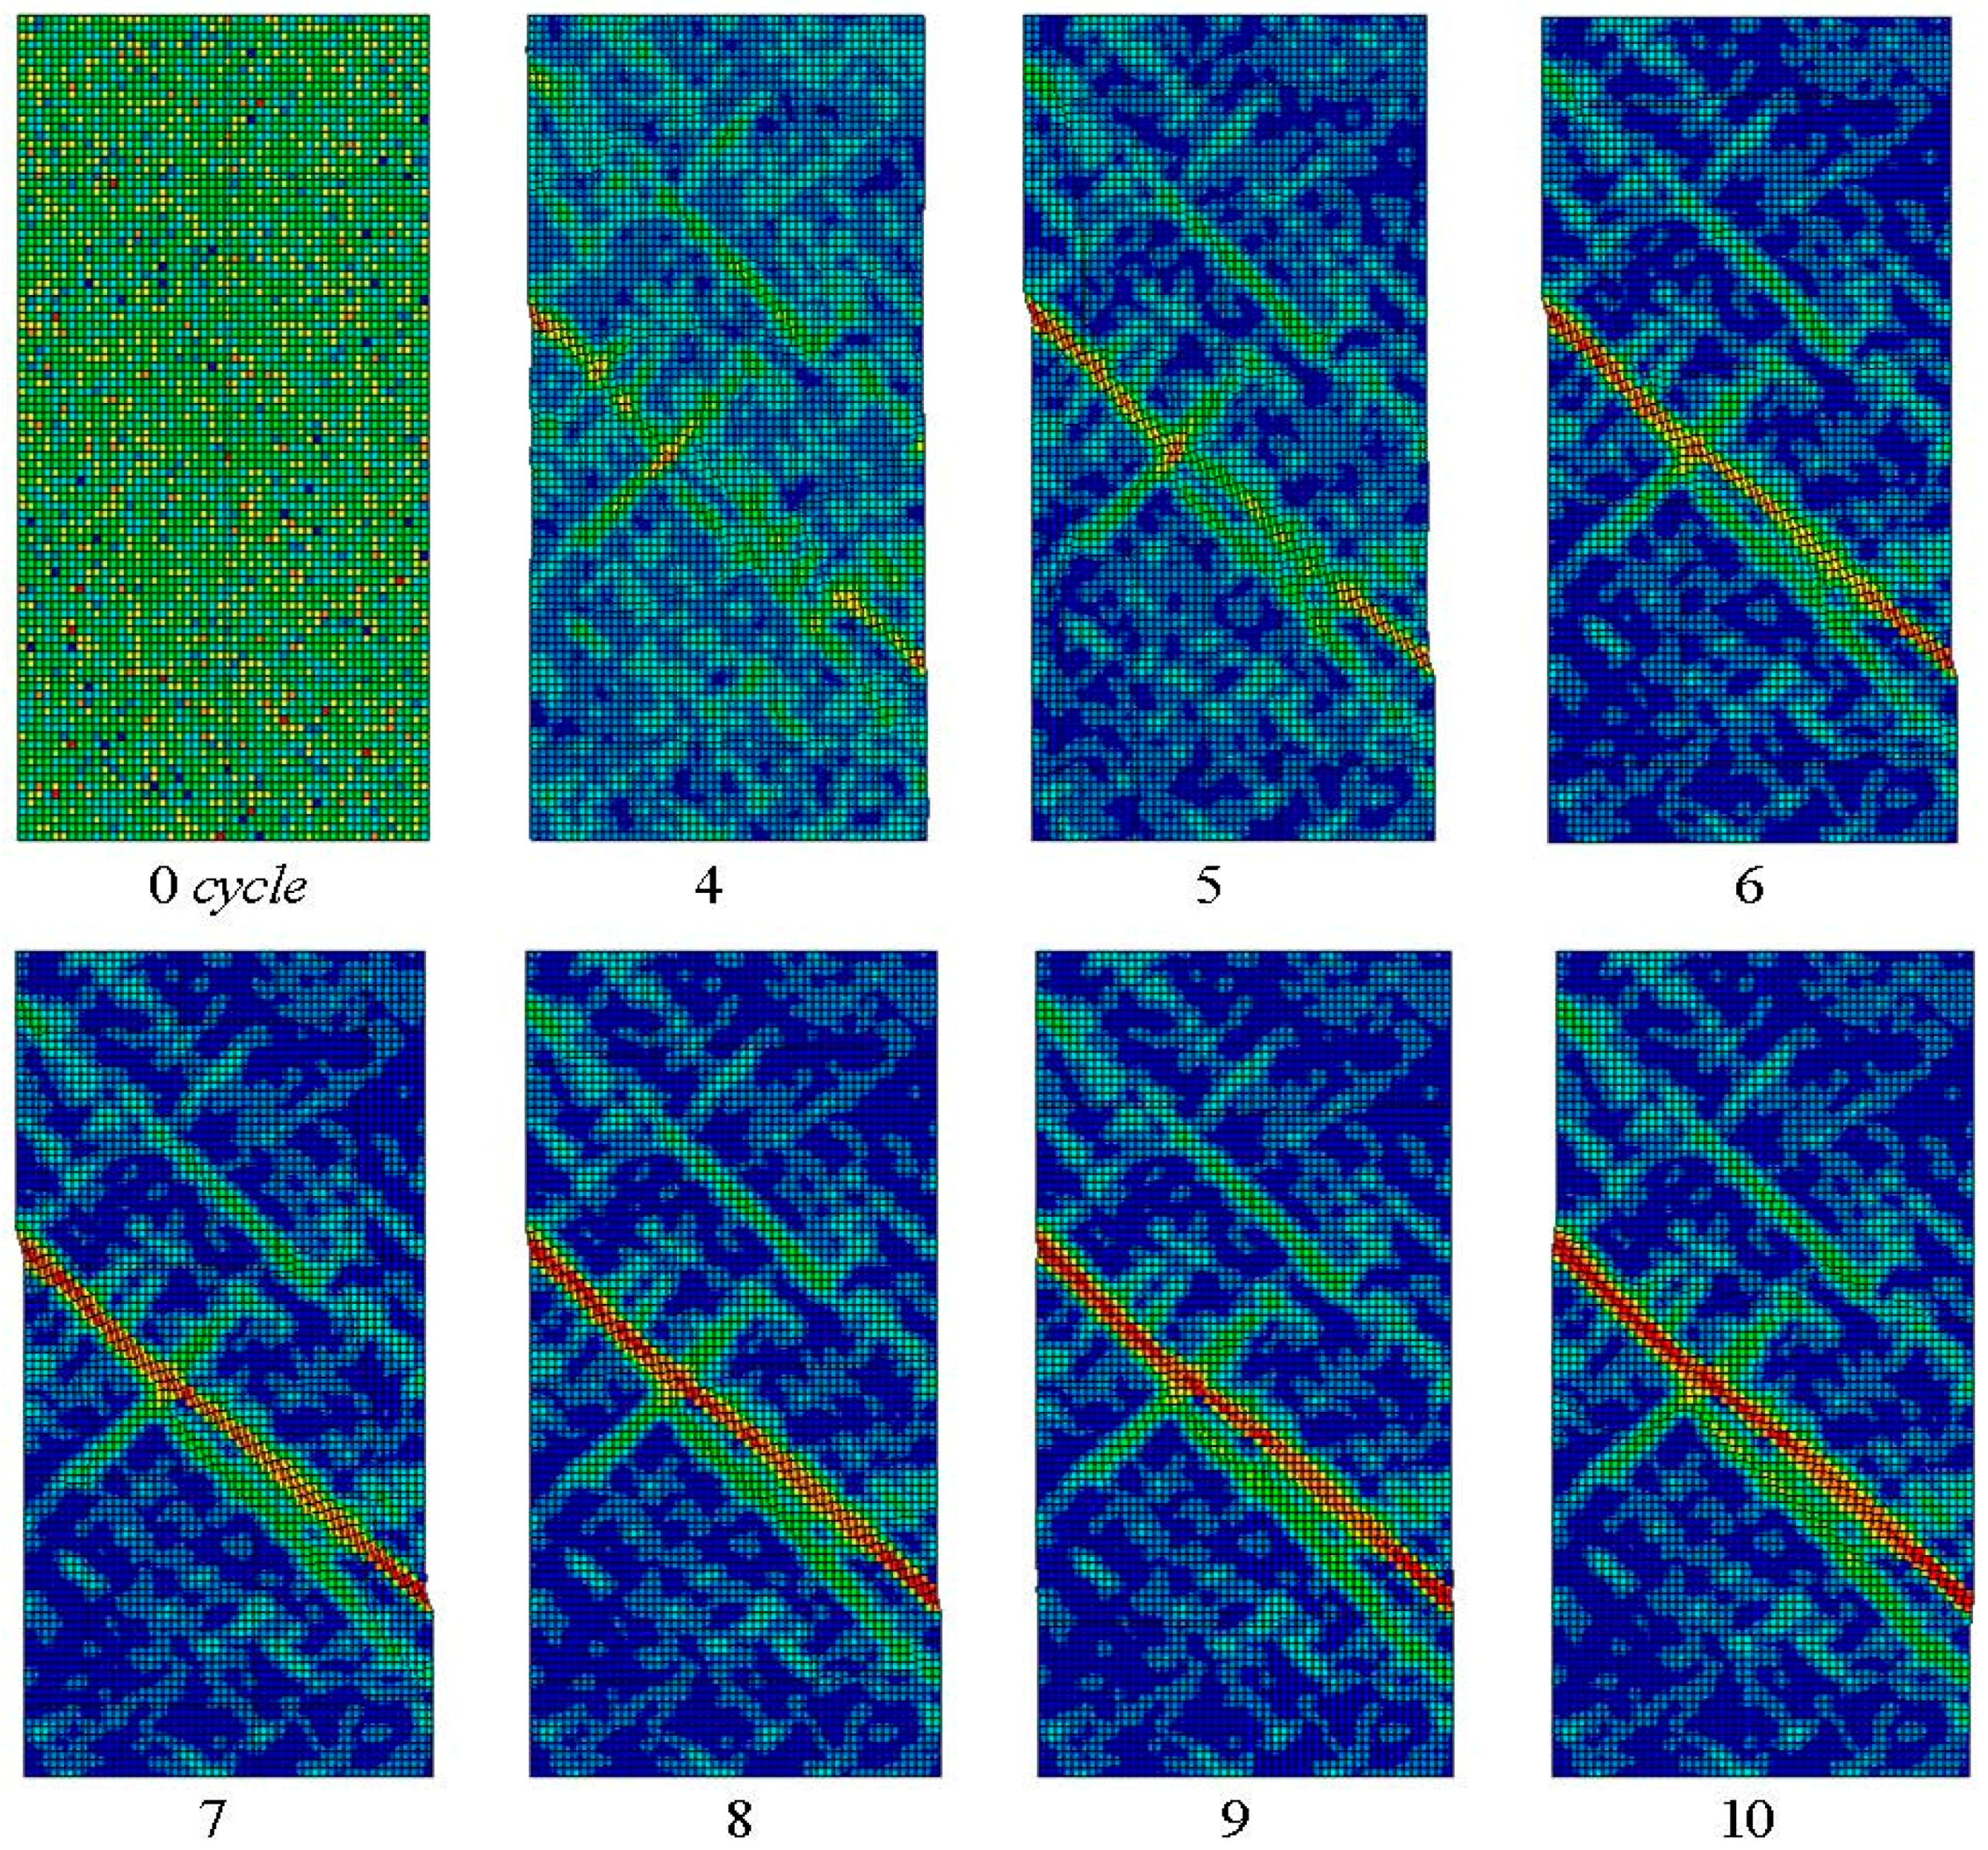
Figure 7.
Stress as a function of cycle number for a tesnion-compression cyclic loading with applied strain of 1.8% on a single element, and the evolution of free volume with cycle loops is also listed. The inset picture shows the tensile stress-strain curve for a single element model.
Figure 7.
Stress as a function of cycle number for a tesnion-compression cyclic loading with applied strain of 1.8% on a single element, and the evolution of free volume with cycle loops is also listed. The inset picture shows the tensile stress-strain curve for a single element model.
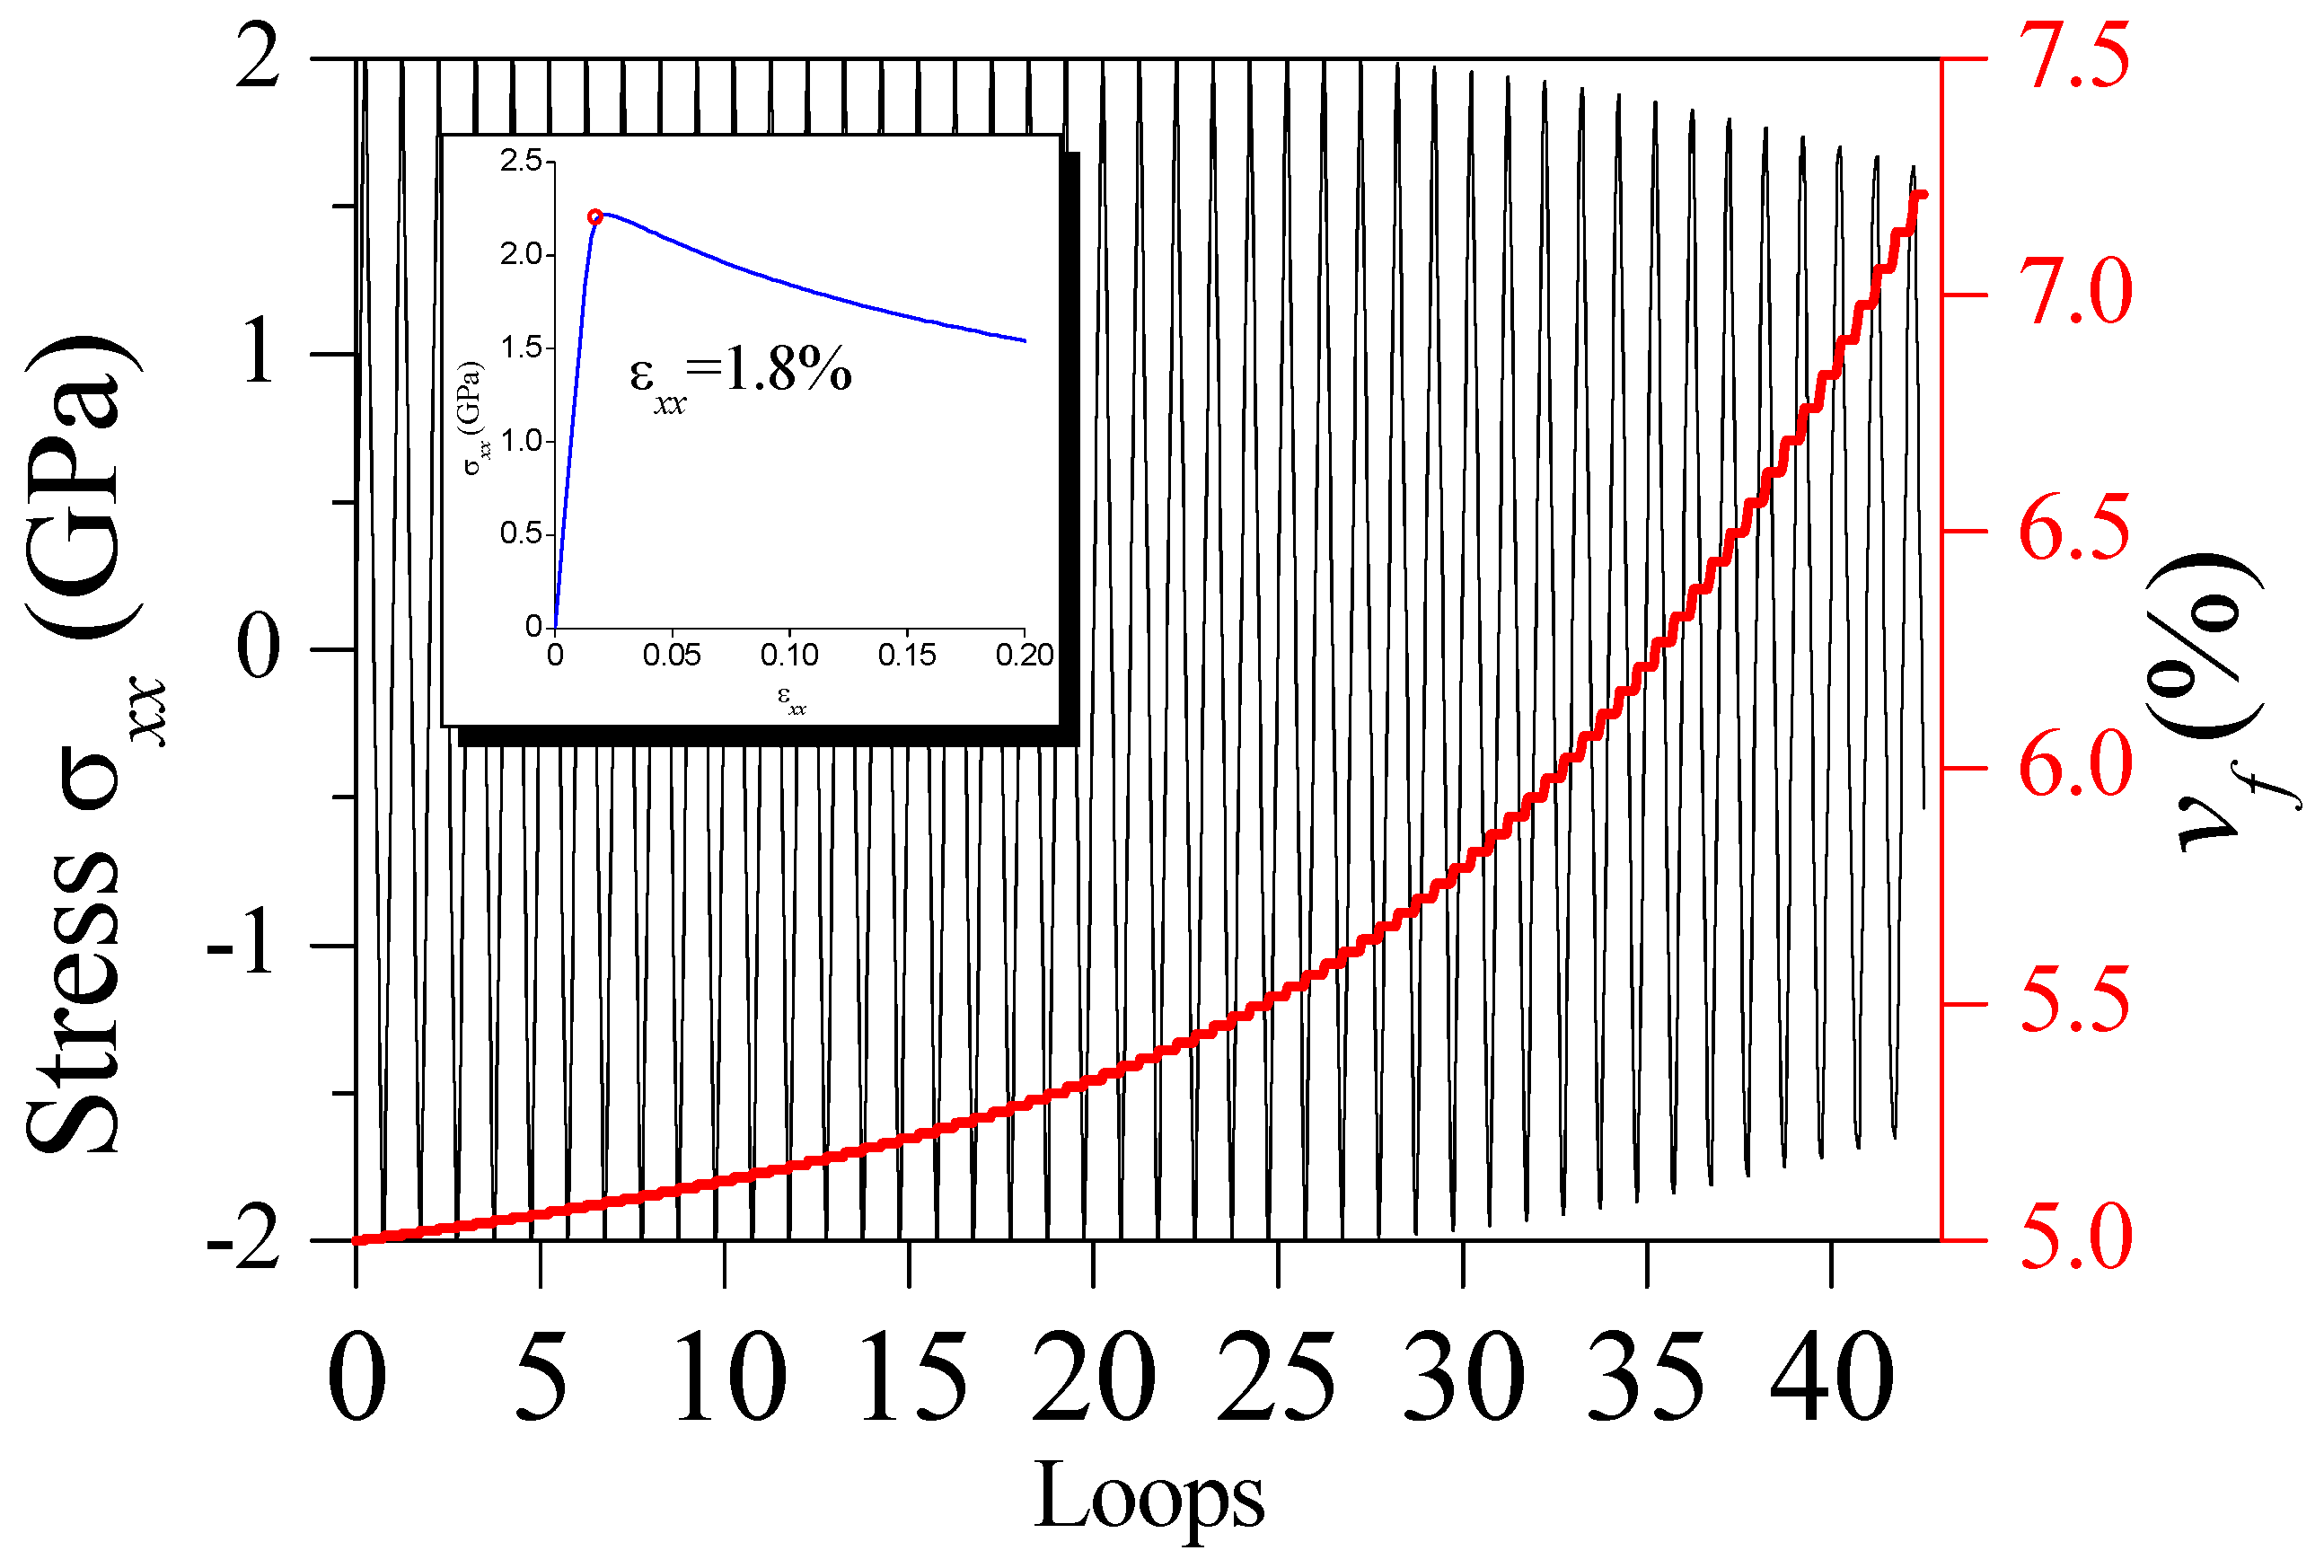
Figure 8.
Stress versus loop number curves at different strain amplitudes in (a–f).

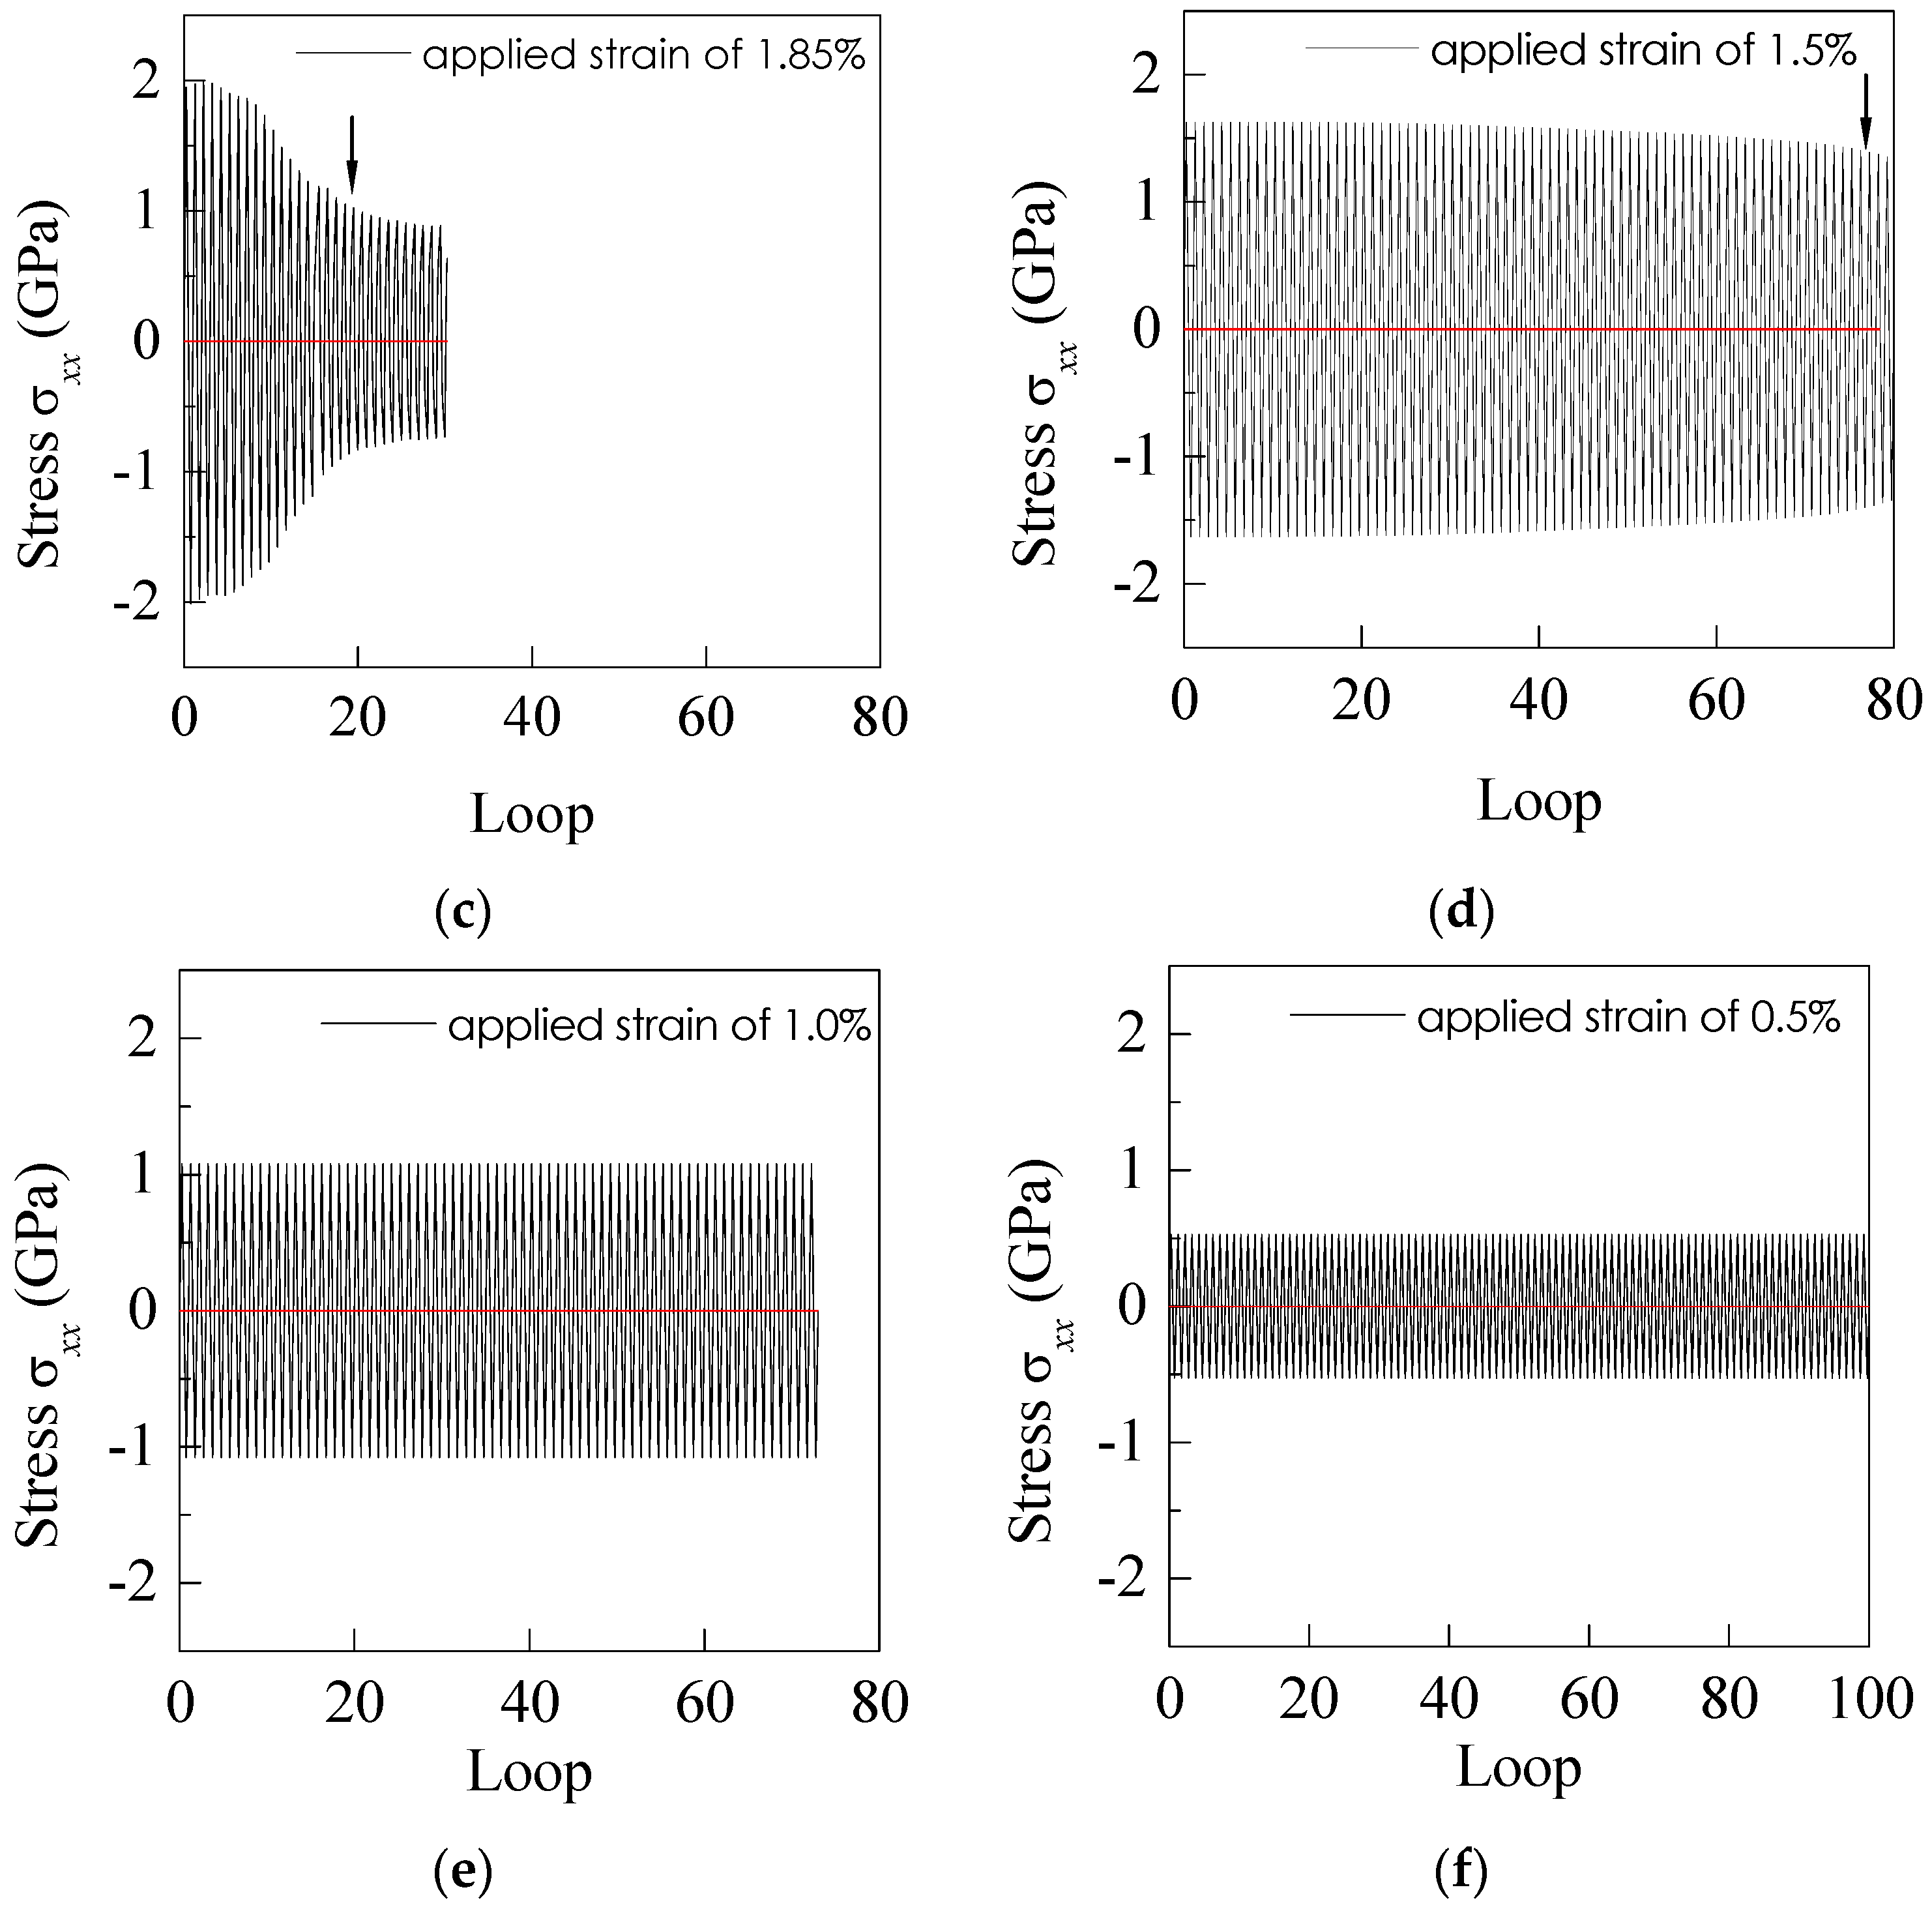
Figure 9.
Load drop cycle number as a function of applied strain amplitude.

Figure 10.
Typical strain-time plots for various cycle frequencies at the applied strain amplitude of 1.7%.
Figure 10.
Typical strain-time plots for various cycle frequencies at the applied strain amplitude of 1.7%.

Figure 11.
Stress versus cycle number curves at different cycling frequencies at the applied strain amplitude of 1.7%.
Figure 11.
Stress versus cycle number curves at different cycling frequencies at the applied strain amplitude of 1.7%.
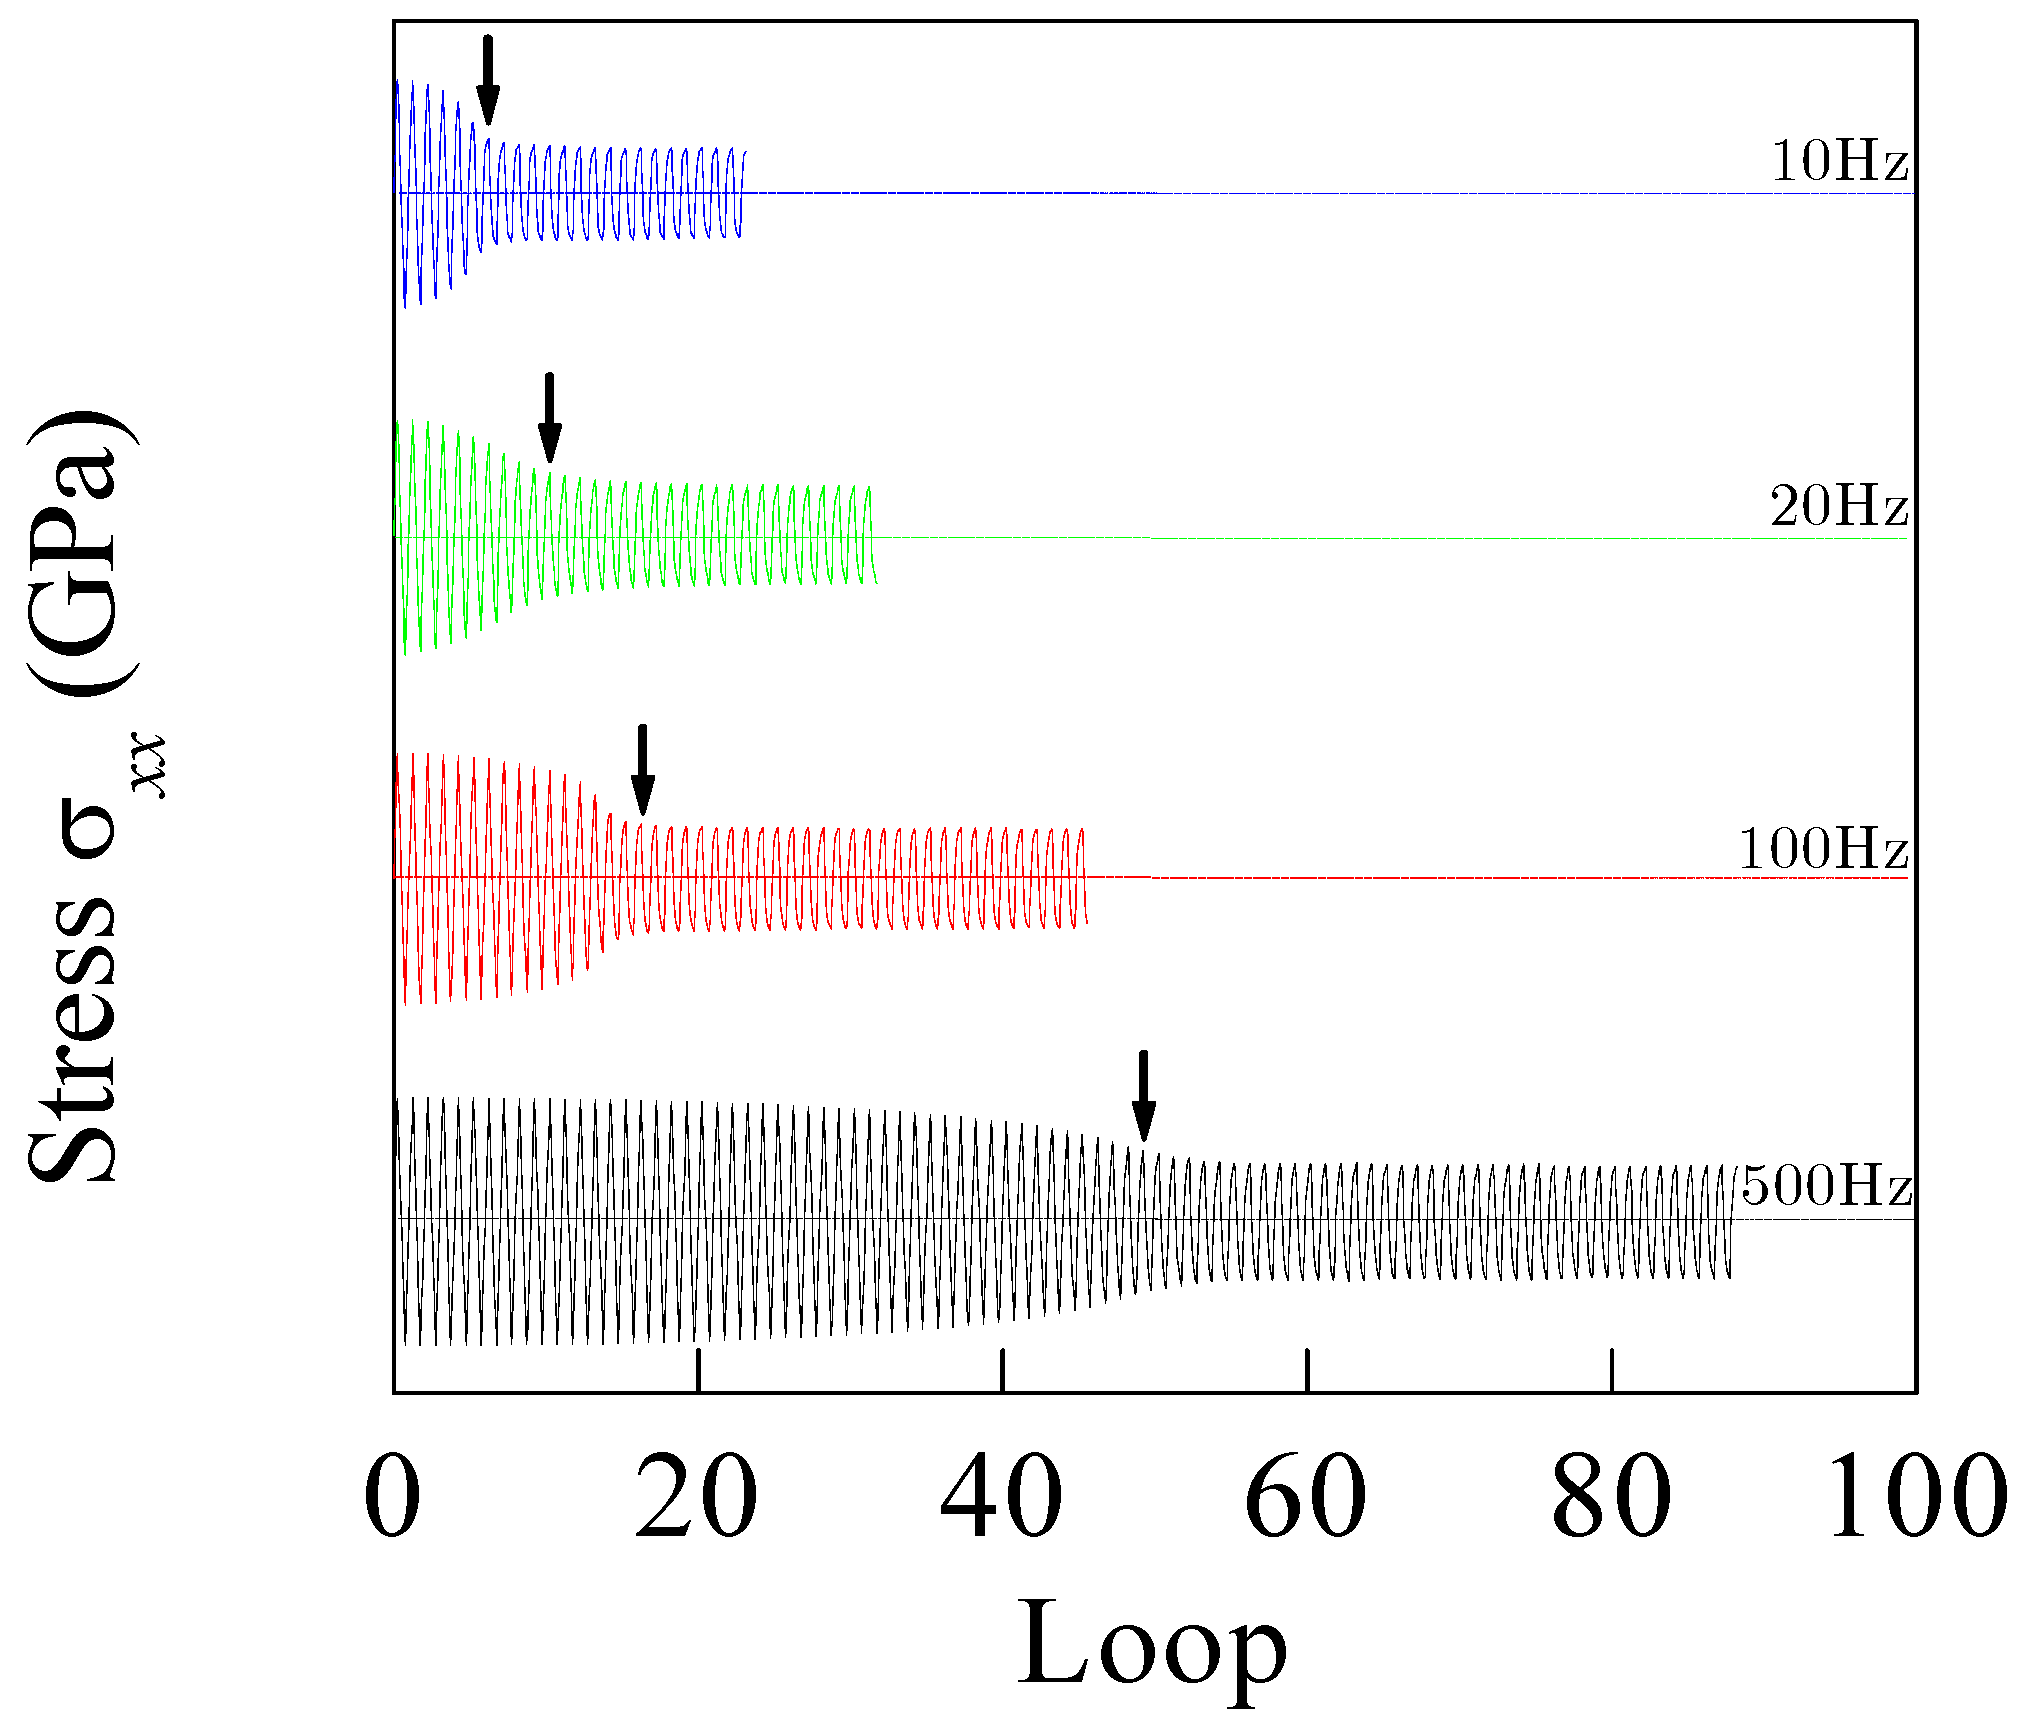
Figure 12.
Load drop cycle number versus cycling frequency curves at the applied strain of 1.7%.

Figure 13.
Stress-strain relations of BMG under various strain rates based on the free volume model.
Figure 13.
Stress-strain relations of BMG under various strain rates based on the free volume model.

© 2016 by the author; licensee MDPI, Basel, Switzerland. This article is an open access article distributed under the terms and conditions of the Creative Commons Attribution (CC-BY) license (http://creativecommons.org/licenses/by/4.0/).
Share and Cite
MDPI and ACS Style
Jiang, Y. Numerical Modeling of Cyclic Deformation in Bulk Metallic Glasses. Metals 2016, 6, 217. https://doi.org/10.3390/met6090217
AMA Style
Jiang Y. Numerical Modeling of Cyclic Deformation in Bulk Metallic Glasses. Metals. 2016; 6(9):217. https://doi.org/10.3390/met6090217
Chicago/Turabian StyleJiang, Yunpeng. 2016. "Numerical Modeling of Cyclic Deformation in Bulk Metallic Glasses" Metals 6, no. 9: 217. https://doi.org/10.3390/met6090217
Note that from the first issue of 2016, this journal uses article numbers instead of page numbers. See further details here.