Does Patriline Composition Change over a Honey Bee Queen’s Lifetime?

Abstract
:1. Introduction
2. Experimental Section
2.1. Origin of Bees
2.2. DNA Amplification and Genetic Analysis
2.3. Statistical Analysis
3. Results


 ) was calculated according to Pamilo [46]
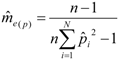
 decreases as sample size n increases. The ratio of
  can be used as a standard measure for the magnitude of the error. Tarpy and Nielsen [22] defined a threshold at which the upper 95% confidence level is £ one effective drone father. The ratio of in the three investigated years is 15.51, 45.26 and 18.29, respectively, and always exceeds the threshold with the particular (Table 1), calculated from the logarithmic function:
 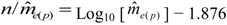 can be calculated from [22]:
 decreased from the first to the third year: intracolonial relatedness between workers Ĝ was calculated from Laidlaw and Page [47] using
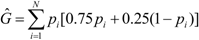

 , threshold and 95% CI calculated according to [22], and intracolonial relationship [47].
| Year | |||
|---|---|---|---|
| 1998 | 1999 | 2000 | |
| Patriline A | 35 | 71 | 22 |
| Patriline B | 21 | 59 | 20 |
| Patriline C | 14 | 50 | 18 |
| Patriline D | 14 | 72 | 24 |
| Patriline E | 12 | 26 | 15 |
| Patriline F | 10 | 36 | 17 |
| Patriline G | 10 | 39 | 25 |
| Patriline H | 9 | 18 | 19 |
| Patriline I | 8 | 25 | 19 |
| Patriline J | 7 | 26 | 9 |
| Patriline K | 7 | 35 | 19 |
| Patriline L | 5 | 20 | 8 |
| Patriline M | 4 | 49 | 23 |
| Patriline N | 3 | 14 | 18 |
| Patriline O | 3 | 8 | 3 |
| Patriline P | 2 | 0 | 0 |
| Patriline Q | 1 | 8 | 2 |
| Number of workers | 165 | 556 | 261 |
| Variance | 0.0025 | 0.0015 | 0.0009 |
| Effective matings | 10.64 | 12.29 | 14.27 |
| | 15.51 | 45.26 | 18.29 |
| Threshold | 7.45 | 8.02 | 8.61 |
| 95% CI | 0.52 | 0.19 | 0.53 |
| Intracolonial relationship | 0.300 | 0.292 | 0.285 |
4. Discussion
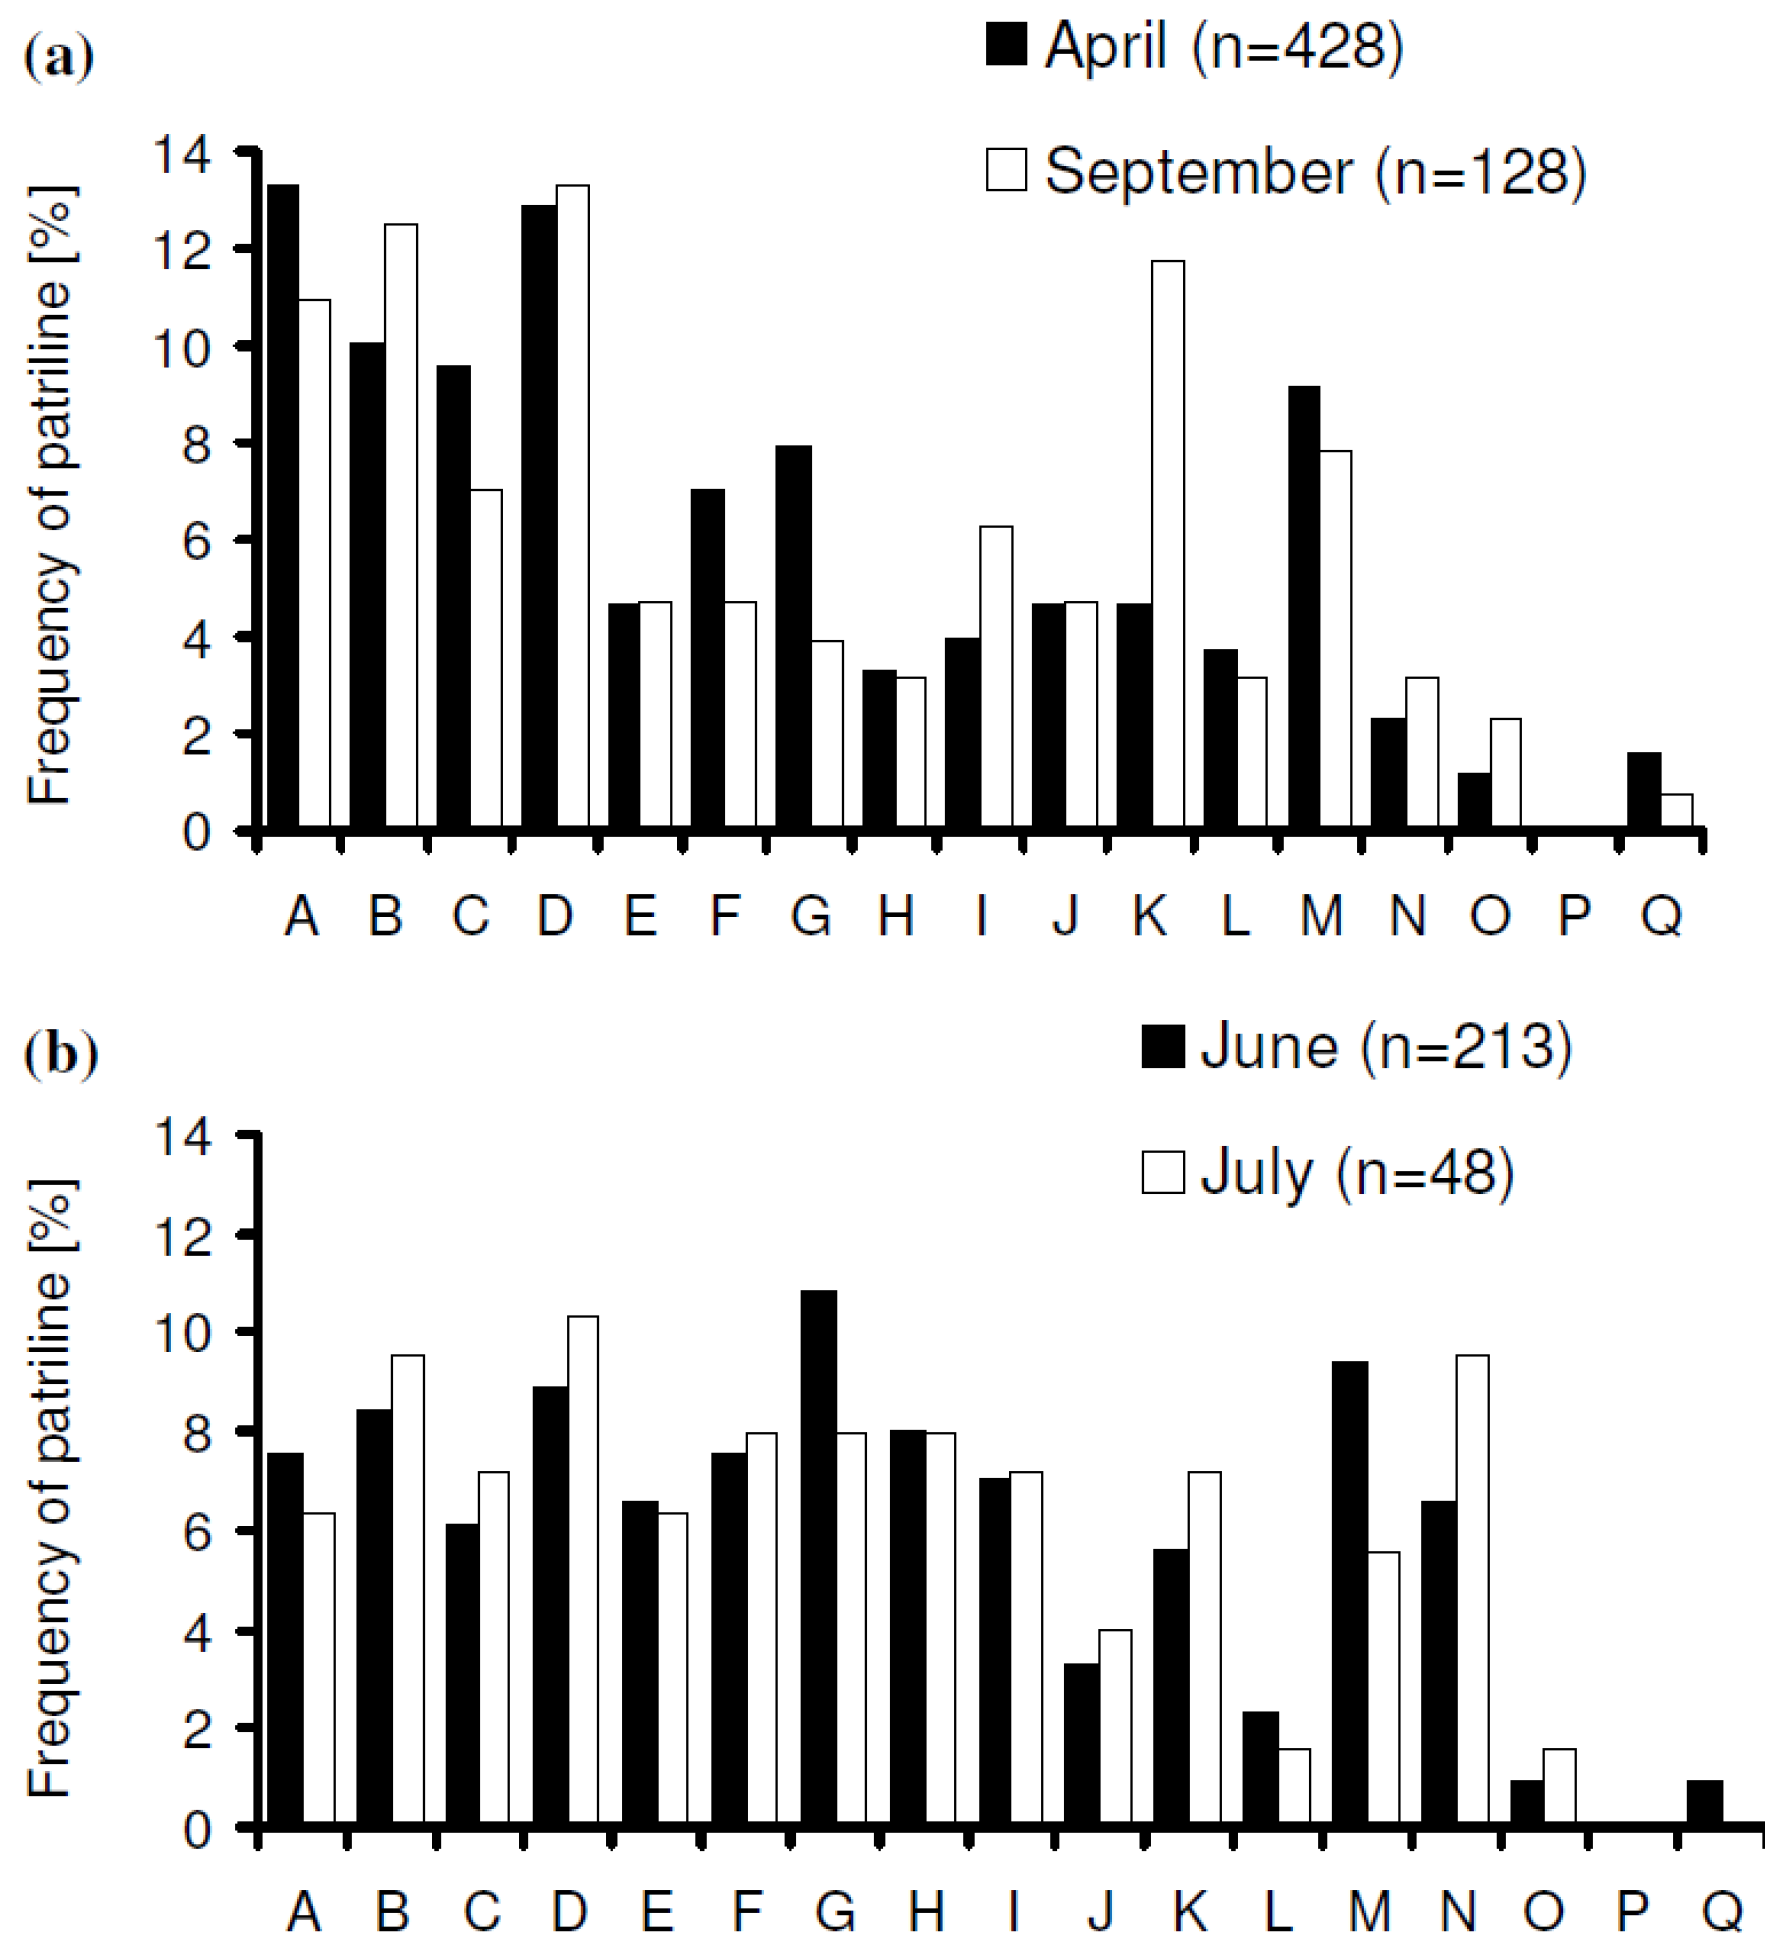
 increased with time, and the variance of patriline ratios decreased with time. The latter finding is supported by the data of Franck et al. [39], who concluded that the patriline composition “evolves in a progressive way” in the first three months of a queen’s life. Franck et al. [48] also found decreasing variance for some colonies over a period of twelve months, which they attributed to the spermatozoa of different drones not being completely mixed. Intracolonial relatedness between workers, which depends on the number of matings, decreased with time. When we recalculated the data of Franck et al. [39] we found the same tendency. These trends, especially the decrease of variance, are due to a more equal representation of patrilines with time, which could be caused by mixing processes in the queen’s spermatheca.
5. Conclusions
Acknowledgments
References and Notes
- Page, R.E.; Metcalf, R.A. Multiple mating, sperm utilization, and social evolution. Am. Nat. 1982, 119, 263–281. [Google Scholar]
- Hamilton, W.D. The genetical evolution of social behaviour I and II. J. Theor. Biol. 1964, 7, 1–16. [Google Scholar] [CrossRef]
- Hughes, W.O.H.; Oldroyd, B.P.; Beekman, M.; Ratnieks, F.L.W. Ancestral monogamy shows kin selection is key to the evolution of eusociality. Science 2008, 320, 1213–1216. [Google Scholar] [CrossRef]
- Crozier, R.H.; Page, R.E. On being the right size: Male contributions and multiple mating in social Hymenoptera. Behav. Ecol. Sociobiol. 1985, 18, 105–115. [Google Scholar] [CrossRef]
- Keller, L.; Reeve, H.K. Genetic variability, queen number, and polyandry in social Hymenoptera. Evolution 1994, 48, 694–704. [Google Scholar] [CrossRef]
- Crozier, R.H.; Fjerdingstad, E.J. Polyandry in social Hymenoptera—Disunity in diversity? Ann. Zool. Fenn. 2001, 38, 267–285. [Google Scholar]
- Sherman, P.W.; Seeley, T.D.; Reeve, H.K. Parasites, pathogens, and polyandry in social Hymenoptera. Am. Nat. 1988, 131, 602–610. [Google Scholar]
- Baer, B.; Schmid-Hempel, P. Experimental variation in polyandry affects parasite loads and fitness in a bumblebee. Nature 1999, 397, 151–154. [Google Scholar] [CrossRef]
- Fuchs, S.; Schade, V. Lower performance in honeybee colonies of uniform paternity. Apidologie 1994, 25, 155–168. [Google Scholar] [CrossRef]
- Mattila, H.R.; Seeley, T.D. Genetic diversity in honey bee colonies enhances productivity and fitness. Science 2007, 317, 362–364. [Google Scholar] [CrossRef]
- Mattila, H.R.; Burke, K.M.; Seeley, T.D. Genetic diversity within honeybee colonies increases signal production by waggle-dancing foragers. Proc. R. Soc. B 2008, 275, 809–816. [Google Scholar] [CrossRef]
- Page, R.E. Sperm utilization in social insects. Annu. Rev. Entomol. 1986, 31, 297–320. [Google Scholar] [CrossRef]
- Page, R.E. The evolution of multiple mating behavior by honey bee queens (Apis mellifera L.). Genetics 1980, 96, 263–273. [Google Scholar]
- Ratnieks, F.L.W. The evolution of polyandry by queens in social Hymenoptera: The significance of the timing of removal of diploid males. Behav. Ecol. Sociobiol. 1990, 26, 343–348. [Google Scholar]
- Taber, S. The frequency of multiple mating of queen honey bees. J. Econ. Entomol. 1954, 47, 995–998. [Google Scholar]
- Woyke, J. Multiple mating of the honeybee queen (Apis mellifica L.) in one nuptial flight. Bull. Acad. Polon. Sci. Cl. 1955, 3, 175–180. [Google Scholar]
- Adams, J.; Rothman, E.D.; Kerr, W.E.; Paulino, Z.L. Estimation of the number of sex alleles and queen matings from diploid male frequencies in a population of Apis mellifera. Genetics 1977, 86, 583–596. [Google Scholar]
- Estoup, A.; Solignac, M.; Cornuet, J.M. Precise assessment of the number of patrilines and of genetic relatedness in Honeybee colonies. Proc. R. Soc. B 1994, 258, 1–7. [Google Scholar] [CrossRef]
- Moritz, R.F.A.; Kryger, P.; Koeniger, G.; Koeniger, N.; Estoup, A.; Tingek, S. High degree of polyandry in Apis dorsata queens detected by DNA microsatellite variability. Behav. Ecol. Sociobiol. 1995, 37, 357–363. [Google Scholar] [CrossRef]
- Moritz, R.F.A.; Kryger, P.; Allsopp, M. Competition for royalty in bees. Nature 1996, 384, 31. [Google Scholar] [CrossRef]
- Oldroyd, B.P.; Clifton, M.J.; Wongsiri, S.; Rinderer, T.E.; Crozier, R.H. Polyandry in the genus Apis, particularly Apis andreniformis. Behav. Ecol. Sociobiol. 1997, 40, 17–26. [Google Scholar] [CrossRef]
- Tarpy, D.R.; Nielsen, D.I. Sampling error, effective paternity, and estimating the genetic structure of honey bee colonies (Hymenoptera: Apidae). Ann. Entomol. Soc. Am. 2002, 95, 513–528. [Google Scholar] [CrossRef]
- Seeley, T.D. Honeybee Ecology. In A Study of Adaption in Social Life; Princeton University Press: Princeton, NJ, USA, 1985; p. 201. [Google Scholar]
- Pfeiffer, K.J.; Crailsheim, K. The behavior of drifted nurse honey bees. Insecte. Soc. 1999, 46, 34–40. [Google Scholar] [CrossRef]
- Page, R.E.; Laidlaw, H.H. Full sisters and supersisters: A terminological paradigm. Anim. Behav. 1988, 36, 944–945. [Google Scholar] [CrossRef]
- Roberts, W.C. Multiple mating of queen bees proved by progeny and flight tests. Glean. Bee Cult 1944, 72, 281–283. [Google Scholar]
- Woyke, J. Dynamics of enter of spermatozoa into the spermatheca of instrumentally inseminated queen. J. Apic. Res. 1983, 22, 150–154. [Google Scholar]
- Koeniger, N.; Koeniger, G. An evolutionary approach to mating behavior and drone copulatory organs in Apis. Apidologie 1991, 23, 581–590. [Google Scholar] [CrossRef]
- Dade, H.A. Anatomy and Dissection of the Honeybee; International Bee Research Association: London, UK, 1977; p. 158. [Google Scholar]
- Harbo, J. The rate of depletion of spermatozoa in the queen honey bee spermatheca. J. Apic. Res. 1979, 18, 204–207. [Google Scholar]
- Kerr, W.E.; Martinho, M.R.; Goncalves, L.S. Kinship selection in bees. Rev. Bras. Genet. 1980, 3, 339–344. [Google Scholar]
- Haberl, M.; Tautz, D. Sperm usage in honey bees. Behav. Ecol. Sociobiol. 1998, 42, 247–255. [Google Scholar] [CrossRef]
- Arnold, G.; Quenet, B.; Cornuet, J.M.; Masson, C.; de Schepper, B.; Estoup, A.; Gasqui, P. Kin recognition in honeybees. Nature 1996, 379, 498. [Google Scholar]
- Arnold, G.; Quenet, B.; Masson, C. Influence of the social environment on the genetically-based subfamily signature in the honeybee. J. Chem. Ecol. 2000, 26, 2321–2333. [Google Scholar] [CrossRef]
- Kryger, P.; Kryger, U.; Moritz, R.F.A. Genotypical variability for the tasks of water collecting and scenting in a honey bee colony. Ethology 2000, 106, 769–779. [Google Scholar] [CrossRef]
- Kirchner, W.H.; Arnold, G. Kin discrimination in honey bees: Do bees dance with their super sisters? Anim. Behav. 2001, 61, 597–600. [Google Scholar] [CrossRef]
- Arnold, G.; Quenet, B.; Papin, C.; Masson, C.; Kirchner, W.H. Intra-colonial variability in the dance communication in honeybees (Apis mellifera). Ethology 2002, 108, 751–761. [Google Scholar] [CrossRef]
- Scheiner, R.; Arnold, G. Effects of patriline on gustatory responsiveness and olfactory learning in honey bees. Apidologie 2010, 41, 29–37. [Google Scholar] [CrossRef]
- Franck, P.; Coussy, H.; Le Conte, Y.; Solignac, M.; Garnery, L.; Cornuet, J.M. Microsatellite analysis of sperm admixture in honey bee. Insect Mol. Biol. 1999, 8, 419–421. [Google Scholar]
- Schlüns, H.; Koeniger, G.; Koeniger, N.; Moritz, R.F.A. Sperm utilization pattern in the honeybee (Apis mellifera). Behav. Ecol. Sociobiol. 2004, 56, 458–463. [Google Scholar] [CrossRef]
- Parker, G.A. Sperm competition and its evolutionary consequences in the insects. Biol. Rev. 1970, 45, 525–567. [Google Scholar] [CrossRef]
- Taber, S. Sperm distribution in the spermathecae of multiple-mated queen honey bees. J. Econ. Entomol. 1955, 48, 522–525. [Google Scholar]
- Garnery, L.; Vautrin, D.; Cornuet, J.M.; Solignac, M. Phylogenetic relationships in the genus Apis inferred from mitochondrial DNA sequence data. Apidologie 1990, 22, 87–92. [Google Scholar]
- Permutation Statistics (c) Bill Engels 1993-1997. Available online: http://engels.genetics.wisc.edu/pstat/ (accessed on 11 September 2012).
- Haberl, M.; Moritz, R.F.A. Estimation of intracolonial worker relationship in a honey bee colony (Apis mellifera L.) using DNA fingerprinting. Insecte. Soc. 1994, 41, 263–272. [Google Scholar] [CrossRef]
- Pamilo, P. Polyandry and allele frequency differences between the sexes in the ant Formica aquilonia. Heredity 1993, 70, 472–480. [Google Scholar] [CrossRef]
- Laidlaw, H.H.; Page, R.E. Polyandry in honey bees (Apis mellifera L.): Sperm utilization and intracolony genetic relationships. Genetics 1984, 108, 985–997. [Google Scholar]
- Franck, P.; Solignac, M.; Vautrin, D.; Cornuet, J.M.; Koeniger, G.; Koeniger, N. Sperm competition and last-male precedence in the honeybee. Anim. Behav. 2002, 64, 503–509. [Google Scholar] [CrossRef]
- den Boer, S.P.A.; Baer, B.; Boomsma, J.J. Seminal fluid mediates ejaculate competition in social insects. Science 2010, 327, 1506–1509. [Google Scholar] [CrossRef]
- den Boer, S.P.A.; Boomsma, J.J.; Baer, B. Honey bee males and queens use glandular secretions to enhance sperm viability before and after storage. J. Insect Physiol. 2009, 55, 538–543. [Google Scholar] [CrossRef]
- Moritz, R.F.A. Intracolonial worker relationship and sperm competition in the honeybee (Apis mellifera). Experientia 1986, 42, 445–448. [Google Scholar] [CrossRef]
- Al-Lawati, H.; Kamp, G.; Bienefeld, K. Characteristics of the spermathecal contents of old and young honeybee queens. J. Insect Physiol. 2009, 55, 117–122. [Google Scholar] [CrossRef]
- Lodesani, M.; Balduzzi, D.; Galli, A. A study on spermatozoa viability over time in honey bee (Apis mellifera ligustica) queen spermathecae. J. Apic. Res. 2004, 43, 27–28. [Google Scholar]
- Page, R.E.; Kimsey, R.B.; Laidlaw, H.H. Migration and dispersal of spermatozoa in spermathecae of queen honeybees (Apis mellifera L.). Experientia 1984, 40, 182–184. [Google Scholar] [CrossRef]
- den Boer, S.P.A.; Baer, B.; Dreier, S.; Aron, S.; Nash, D.R.; Boomsma, J.J. Prudent sperm use by leaf-cutter ant queens. Proc. R. Soc. B 2009, 276, 3945–3953. [Google Scholar] [CrossRef]
© 2012 by the authors; licensee MDPI, Basel, Switzerland. This article is an open access article distributed under the terms and conditions of the Creative Commons Attribution license (http://creativecommons.org/licenses/by/3.0/).
Share and Cite
Brodschneider, R.; Arnold, G.; Hrassnigg, N.; Crailsheim, K. Does Patriline Composition Change over a Honey Bee Queen’s Lifetime? Insects 2012, 3, 857-869. https://doi.org/10.3390/insects3030857
Brodschneider R, Arnold G, Hrassnigg N, Crailsheim K. Does Patriline Composition Change over a Honey Bee Queen’s Lifetime? Insects. 2012; 3(3):857-869. https://doi.org/10.3390/insects3030857
Chicago/Turabian StyleBrodschneider, Robert, Gérard Arnold, Norbert Hrassnigg, and Karl Crailsheim. 2012. "Does Patriline Composition Change over a Honey Bee Queen’s Lifetime?" Insects 3, no. 3: 857-869. https://doi.org/10.3390/insects3030857