1. Introduction
It is widely accepted that the nutritional and immunological responses of animals to parasitization are not independent [
1,
2]. Both responses are demanding on nutritional reserves, such that an animal’s capacity to mount an immunological response can be critically dependent on its nutritional status [
3,
4], and parasite-mediated immunosuppression can have complex effects on the nutritional condition of its host [
5]. Some effects appear to be mediated by a trade-off between the allocation of resources to immune function and nutritional reserves, or via changes to the animal’s regulatory network, especially the insulin/TOR signaling cascade, which links food intake to growth and metabolism and various aspects of immune function [
6]. The detail of the “trialogue” between host nutrition and immune function and a parasitic infection, including the significance of the interaction between nutritional and immunological effects, is likely to vary widely among different host-parasite interactions.
The focus of this study is the interaction between the honey bee,
Apis mellifera, and the mite
Varroa destructor [
7], an ectoparasite that feeds on the hemolymph of larvae, pupae and adult bees [
8,
9].
Varroa infestation is recognized as one of the most urgent problems facing the beekeeping industry [
10,
11,
12]. There is evidence that
Varroa mites depress both the nutritional condition and immunological capacity of honey bees [
13,
14]. Specifically,
Varroa-infested bees have reduced weight and lifespan, elevated incidence of deformed wings and related phenotypes (shortened abdomen, miscoloration and paralysis) caused by high titers of the Deformed Wing Virus (DWV), and reduced immunological response to bacterial infection as quantified by expression levels of several antimicrobial peptides and immunity-related enzymes [
15,
16,
17,
18,
19]. Nonetheless, the data are fragmentary and not entirely consistent. It is becoming increasingly apparent that an integrated understanding of
Varroa effects requires analysis of the various indices in the same study populations of honey bees.
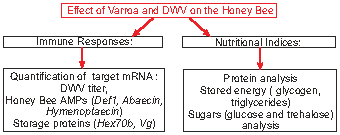
The purpose of this study was to quantify the impact of experimental Varroa infestation on the immune response and nutritional status of honey bee colonies. The investigation was conducted on managed bee colonies in a nutritionally challenging habitat representative of commercial honey bee populations used in low intensity agricultural settings of southern Texas, USA. In this habitat, honey bee colonies are supported by the diverse flora with strong nectar flow in the spring, but they are vulnerable under the hot and dry conditions during summer and fall months that provide scarce nutritional resources. Focusing on colonies under the environmentally stressful conditions in August and September, we tested four hypotheses. (1) Varroa-infested bees have altered immunological status, as assessed by the expression of key immune-related genes, and DWV titer; (2) Varroa-infested bees are in poor nutritional condition, as indicated by reduced protein and amino acid content, and depressed reserves of lipid and glycogen; (3) The nutritional and immunological condition of the insects is correlated, such that the most nutritionally-deficient Varroa-infested insects are also the most immunologically-deficient; (4) Uninfested insects in colonies with high levels of Varroa infestation have depressed immunological and nutritional indices relative to colonies with low or no Varroa infestation, as a consequence of the poor overall condition of the colony.
Our sampling strategy to test these hypotheses was dictated by the biology of the
Varroa mites. Themites enter a brood cell (prior to capping of the cell), they attach to the larva and feed on the hemolymph continuously as the larva develops and pupates. The mites remain attached to their host as the newly emerged bee leaves the brood cell, and then they move among the worker bees in the hive, continuing to feed [
8,
9]. Our analysis focused principally on pupae and newly-emerged bees, to ensure that the scoring of insects as
Varroa-infested or uninfested accurately reflected the infestation history of that insect. Insects that have borne
Varroa since larvae and display clinical signs of DWV die or are removed from the colony as young adults. Foraging bees, in general, have lower levels of
Varroa incomparison to brood and nurse bees [
8,
9].
Supplementary analyses of foraging bees were conducted to assess how the nutritional condition of these bees varies with the level of
Varroa in the colony.
2. Experimental Section
2.1. The Insects and Sampling Procedure
The experimental colonies were derived from source colonies in TX apiaries that had been treated with Apiguard (thymol gel) to reduce Varroa population one year (2009) prior to this study. The experimental colonies were established in March 2010, using 10 three-pound packages of bees from source colonies along with a caged Kona Italian queens in each package. Packages were installed into new bee equipment (10 frame hive body, bottom board and migratory cover, 10 frames with the new wax coated plastic foundations). New colonies were placed in a new apiary and fed high-fructose corn syrup and MegaBee protein patties on ad lib basis. Kona queens were replaced by Koehnen Italian queens in April, 2010. Five experimental colonies were selected at random for Varroa infestation; a half frame of sealed brood comb infested with Varroa mites (14.5 mites per 100 bees) was introduced in May 2010.
Samples were collected from the colonies on 13 July, 17 August and 8 September 2010: pink/purple-eyed pupae (n = 60), newly emerged adults (n = 72), and foragers (n = 72) as they entered the colony. With the exception of foragers, each insect was scored for the presence of
Varroa mites and then transferred individually to a 1.5 mL vial and the fresh weight recorded ±1 μg accuracy. Samples were frozen and stored at −80 °C. In parallel, the level of
Varroa infestation was determined using the alcohol shake method in samples of 280 bees per colony [
20,
21] and estimated as a number of mites per 100 adult bees.
The indices of immunological nutritional status were conducted on bees collected on 17 August and 8 September. By this date in the season, three of the 10 colonies had died out, and sufficient bees for analysis were available from 6 of the remaining colonies for all assays except for the gene expression study, which was conducted on 5 colonies.
2.2. Molecular Analysis
Total RNA was isolated from each bee sample using TRIzol® (Life Technologies, Carlsbad, CA, USA) following the manufacturer’s protocol. To test for residual DNA contamination, 1 μL RNA was used as template in PCR, using primers that amplify a defensin 1 gene fragment that includes a 286 bp intron. Samples that tested positive for the presence of the intron were treated with DNA-free™ Kit (Ambion-Life Technologies, Carlsbad, CA, USA) until DNA was not detectable. Poly-A RNA was purified from the total RNA samples using MicroPoly(A)Purist™ (Ambion-Life Technologies, Carlsbad, CA, USA) following manufacturer’s protocol, and its purity was checked on a 1.0% denaturing agarose/formaldehyde gel before quantification using an Eppendorf BioPhotometer. Double-stranded cDNA was synthesized with 500 ng poly-A RNA template, SuperScript™ Double-Stranded cDNA Synthesis Kit (Invitrogen-Life Technologies, Carlsbad, CA, USA), and oligo-dT primers according to the manufacturer’s protocol.
The expression levels of
defensin1,
abaecin,
hymenoptaecin, vitellogenin and
hexamerin 70b, and the abundance of DWV [
13] were determined by qRT-PCR normalized to
ß-actin using CFX96™ Real-Time PCR Detection System (BioRad, Inc.), following evidence that this gene is stably expressed and the reference gene of choice [
22,
23]. Amplification was performed in 10 μL reaction volumes, containing 0.5 U of GoTaqR Flexi DNA polymerase (Promega Co., Madison, WI, USA) with the colorless 5× GoTaqR Flexi buffer, 0.38 mM dNTP mix, 5.0 mM MgCl
2, 0.35 μM of each primer (
Table 1), 0.33 μL SYBR-Green (Invitrogen., 1/1,000 stock dilution), and 1 μL cDNA. Reactions were run for 40 cycles at 95 °C (5 s) and 60 °C (30 s) after initial denaturing at 95 °C for 3 minutes, and with a final extension of 72 °C (2 min) followed by a melt curve analysis. All experiments included two technical replicates of three biological replicates (for each developmental stage, colony and
Varroa-category) andtemplate-free controls.The qRT-PCR data was analyzed using the comparative delta delta C
t method, with C
t values normalized to ß-actin. Fold change in expression of the target genes was quantified as by Pfaffl [
24], using the equations for relative standard curves and relative efficiency plots calculated by GraphPad Prism software (GraphPad Software, Inc., La Jolla, CA, USA).
Table 1.
List of PCR primers.
Table 1.
List of PCR primers.
| Primer names and GenBank Accession [#] | Primers 5′→3′ |
|---|
| Deformed wing virus [AB605386] DWV_F DWV_R | GACAAAATGACGAGGAGATTGTT ACTACCTGTAATGTCGTCGTGTT |
| Defensin 1 [U15955] Def1_F Def1_R | GTTGAGGATGAATTCGAGCC TTAACCGAAACGTTTGTCCC |
| Abaecin [U159554] Abaecin_F Abaecin_R | GGTAGTGATATTTATCTTCGC TTGAGGCCATTTAATTTTCGG |
| Hymenoptaecin [U15956] Hymenoptaecin_F Hymenoptaecin_R | ATGGATTATATCCCGACTCG TCTAAATCCACCATTTATTCC |
| Hexamerin70b [NM_001011600] Hex70b_F Hex70b_R | CCGCTCTTCAAATGTGGTCTAC GATAGGTAAAAGGTTTGTGGTTC |
| Vitellogenin [NM_001011578] Vg_FVg_R | TGGCTCTGGACGGTGAAC CCCTCGCATTGGTTACTGAT |
| Actin [AB023025] Actin_F Actin_R | TGAAGTGCGATGTCGATATC GAGATCCACATCTGTTGGAA |
2.3. Nutritional Indices
Each pupa or bee was thawed on ice, and then homogenized in 1 mL ice-cold buffer comprising 10 mM Tris, 1 mM EDTA pH 8.0 and 0.1% (v/v) Triton-X-100 with hand-held homogenizer, and centrifuged at 7,000 g at 4 °C for 10 min. The supernatant was used for analysis of protein, triglyceride and carbohydrates using coupled colorimetric assays with an xMarkTM microplate spectrophotometer, following manufacturer’s instructions (5 replicates per assay). The assay kits were the triglyceride assay kit of Sigma (catalogue number TG-5-RB); the Coomassie Brilliant Blue microassay method of BioRad (catalogue number 500-0201), with bovine serum albumin as standard (1.25–25 mg protein mL−1)for protein; and the glucose assay kit of Sigma (catalogue number GAGO20) for glucose and, following trehalase (3.7 U mL−1) and amyloglucosidase (2 U mL−1) treatment, for trehalose and glycogen, respectively. The sugar analyses (glucose and trehalose) were restricted to pupae because datasets for adult bees were confounded by endogenous trehalase activity and sugars in the gut contents of some individuals.
For the amino acid analysis, 1 μL supernatant was brought to 20 μL in PBS, incubated on ice for 30 min with 20 μL 40 mM HCl, and centrifuged at 18,000 g for 15 min at 4 °C. The supernatant was filtered through a 0.45 μm filter plate (Millipore) by centrifugation at 1,500 g for 10 min, and 5 μL filtrate was derivatized with AccQ Tag (Waters), following manufacturer’s protocol, and injected into Waters Acquity UPLC with PDA detector and AccQ-Tag Ultra 2.1 × 100 mm column. The gradient was: 0–10 min, 99% A; 10–35 min, linear gradient to 65% A; 35–40 min, 65% A; 40–42 min, linear gradient to 100% B, where A is 90% AccQ-Taq Ultra Eluent in water, and B is Accq-Taq Ultra Eluent B. Amino acids were determined by comparison to standards, 1–100 pmol protein-amino acids μL−1 (Waters amino acid hydrolysate standard #088122, supplemented with asparagine, tryptophan and glutamine).
2.4. Statistical Analysis
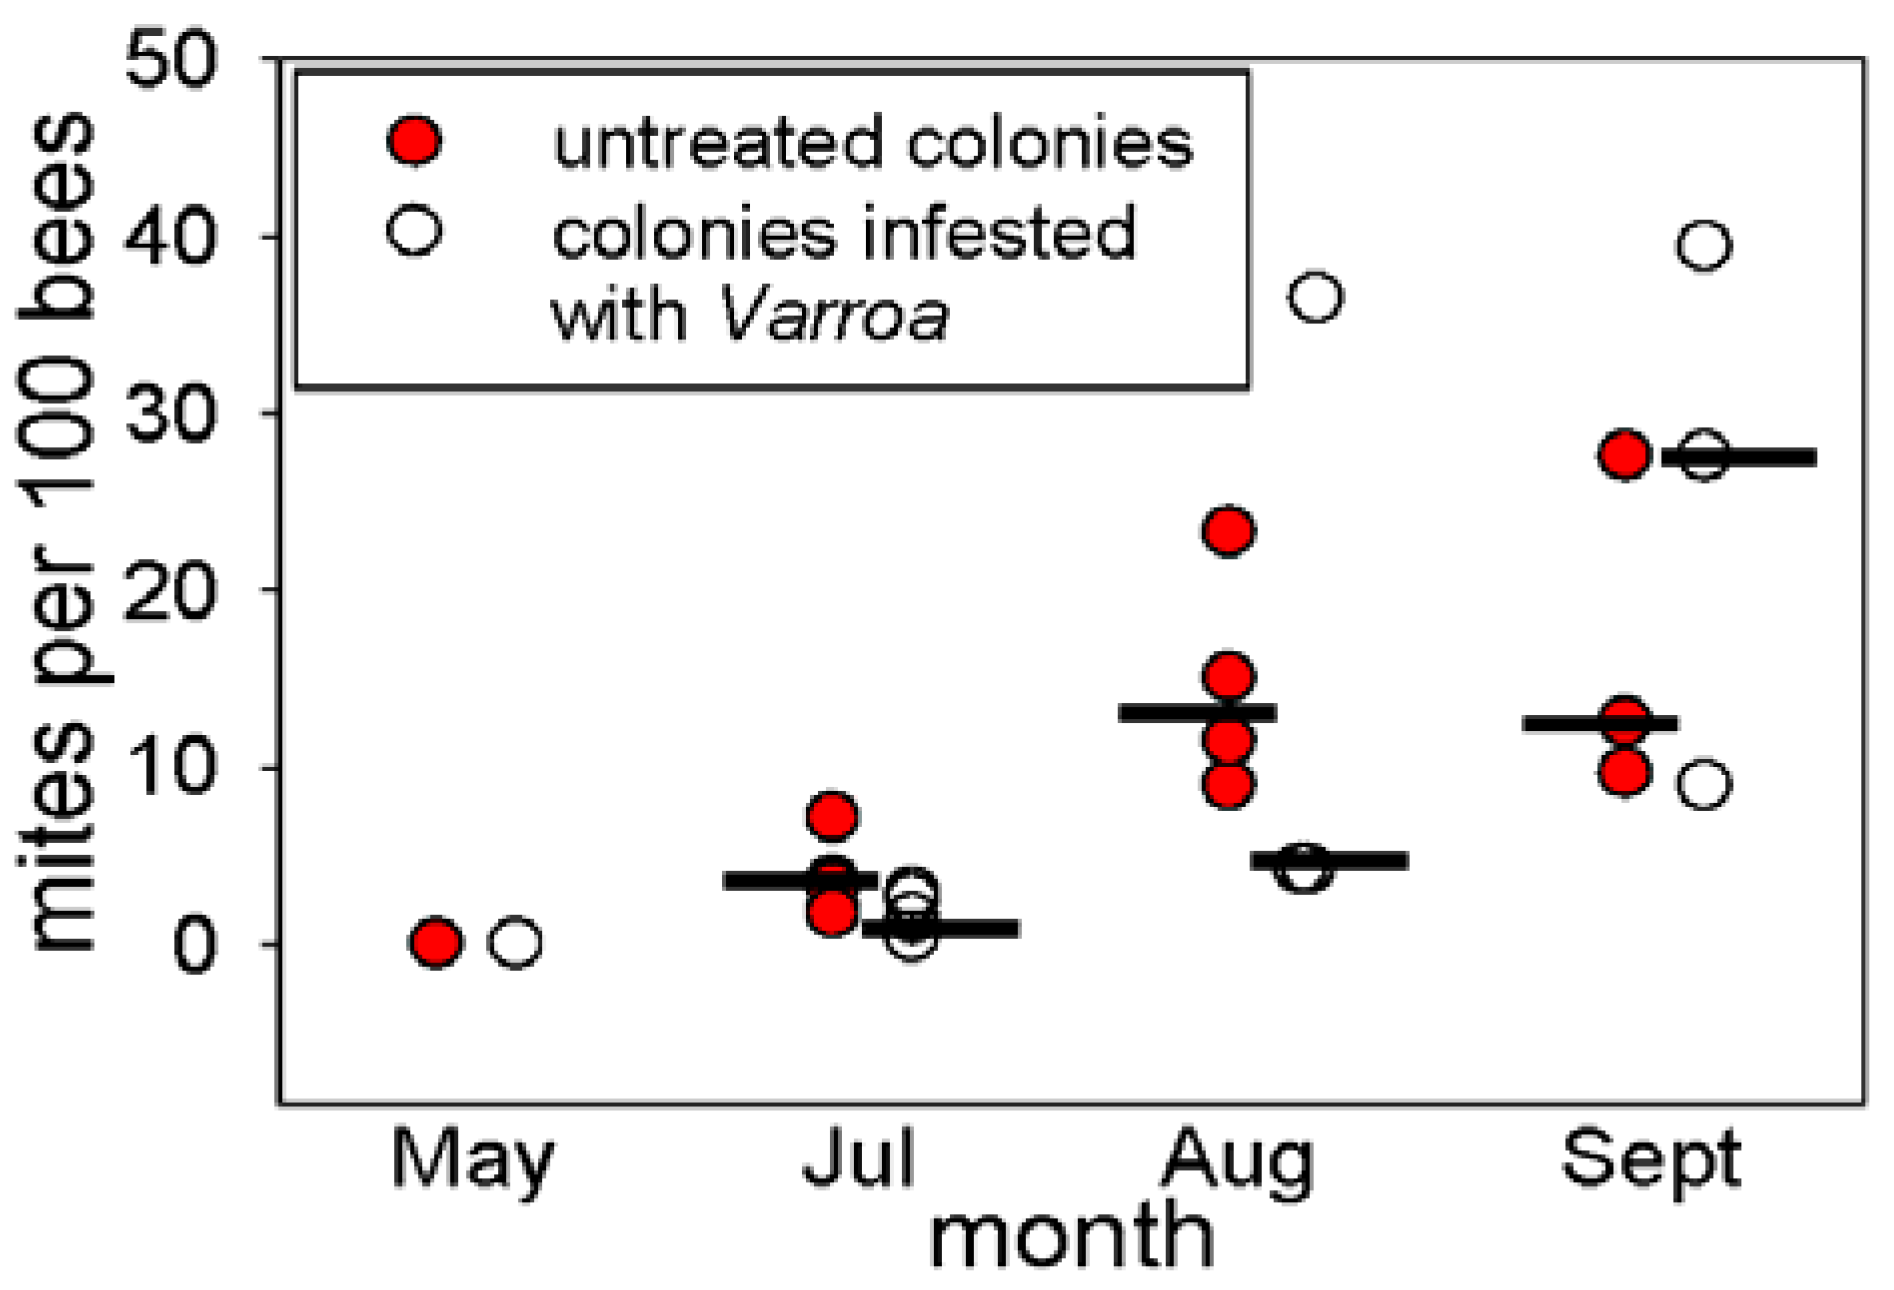
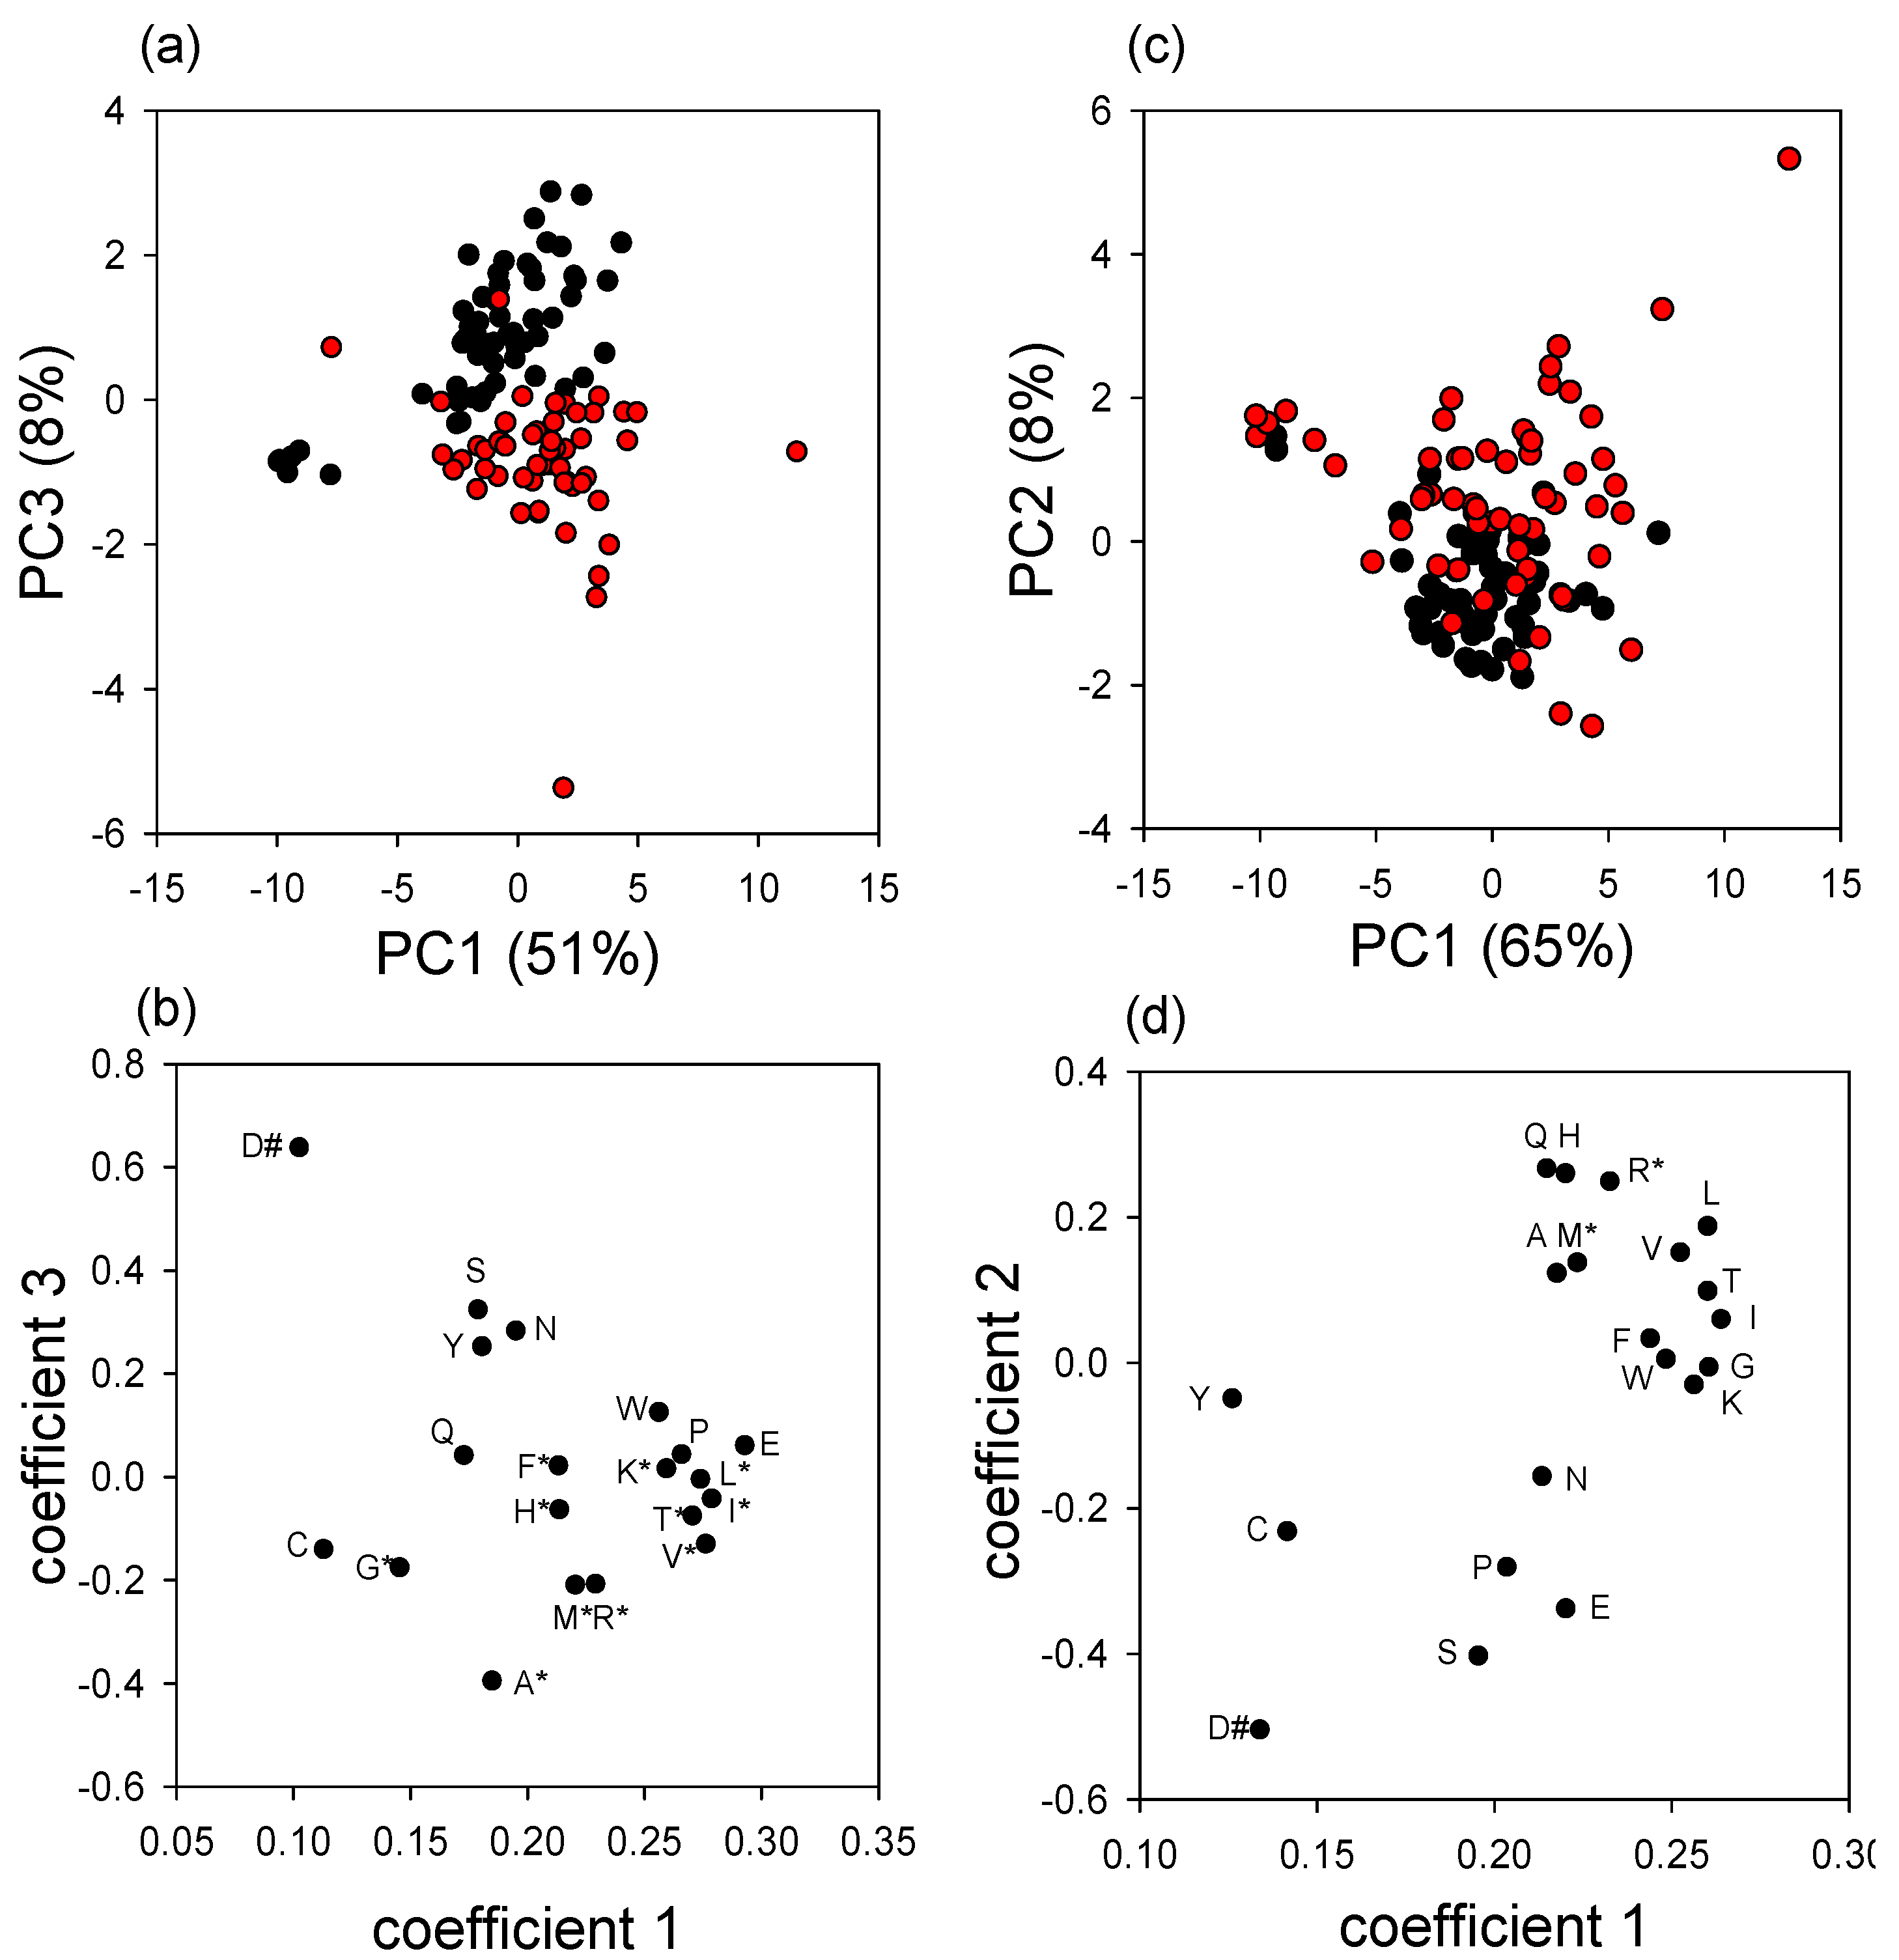
All data were checked for normality by the Anderson-Darling test and homogeneity of variance by Levene’s test, and data that did not meet these criteria were analyzed by non-parametric methods. The abundance of Varroa in uninfested colonies and colonies experimentally infested with Varroa was compared by the MannWhitney U test for each of the four test months (July-September). The fold-change of gene expression in Varroa-infested bees relative to uninfested bees was compared to the null hypothesis of no change by t-tests, with Bonferroni correction for multiple tests.Preliminary analysis revealed no significant correlations between nutritional indices obtained for either pupae or hive bees in September (Pearson’s correlation analysis). Therefore, the insect weight and nutritional density data were analyzed by individual ANOVA tests, with three main factors: Vbee (whether the insect bore Varroa); Vcolony (whether the Varroa abundance was above the recommended treatment threshold of 15 mites per 100 bees); and individual Colony nested within Vcolony. The principal components analysis of free amino acids in the pupae and hive bees used a correlation matrix to standardize variables, with axes selected to display separation of Varroa-infested and uninfested bees. Linear regression analysis was used to investigate the relationship between nutritional indices of uninfested bees and Varroa abundance in the same colony, and the relationship between immune-related indices and nutritional indices.
4. Discussion and Conclusions
An important factor contributing to the threat posed by
Varroa to honey bee populations is the high incidence of among-colony transmission due to the drifting bees (
i.e., foraging bees that return to the “wrong” colony) [
25]. The capacity for rapid among-colony transmission of
Varroa is illustrated by this study, in which five initially mite-free colonies had acquired
Varroa within 8 weeks, despite no experimental introduction of
Varroa. The source(s) of the
Varroa in these colonies was not investigated, but could have included foraging bees from the nearby experimentally-infested colonies or feral bees. The incidence of
Varroa in feral honey bees is high in the area of S. Texas, USA, used in this study. In other studies in the same region, untreated honey bee colonies have collapsed within five months, apparently due to
Varroa infestation [
26]. Together with the finding here that the abundance of
Varroa in the untreated colonies was significantly higher than in the experimentally-infested colonies at the first time of assay (
Figure 1), these consideration suggest that the
Varroa in the colonies were likely predominantly of environmental origin.
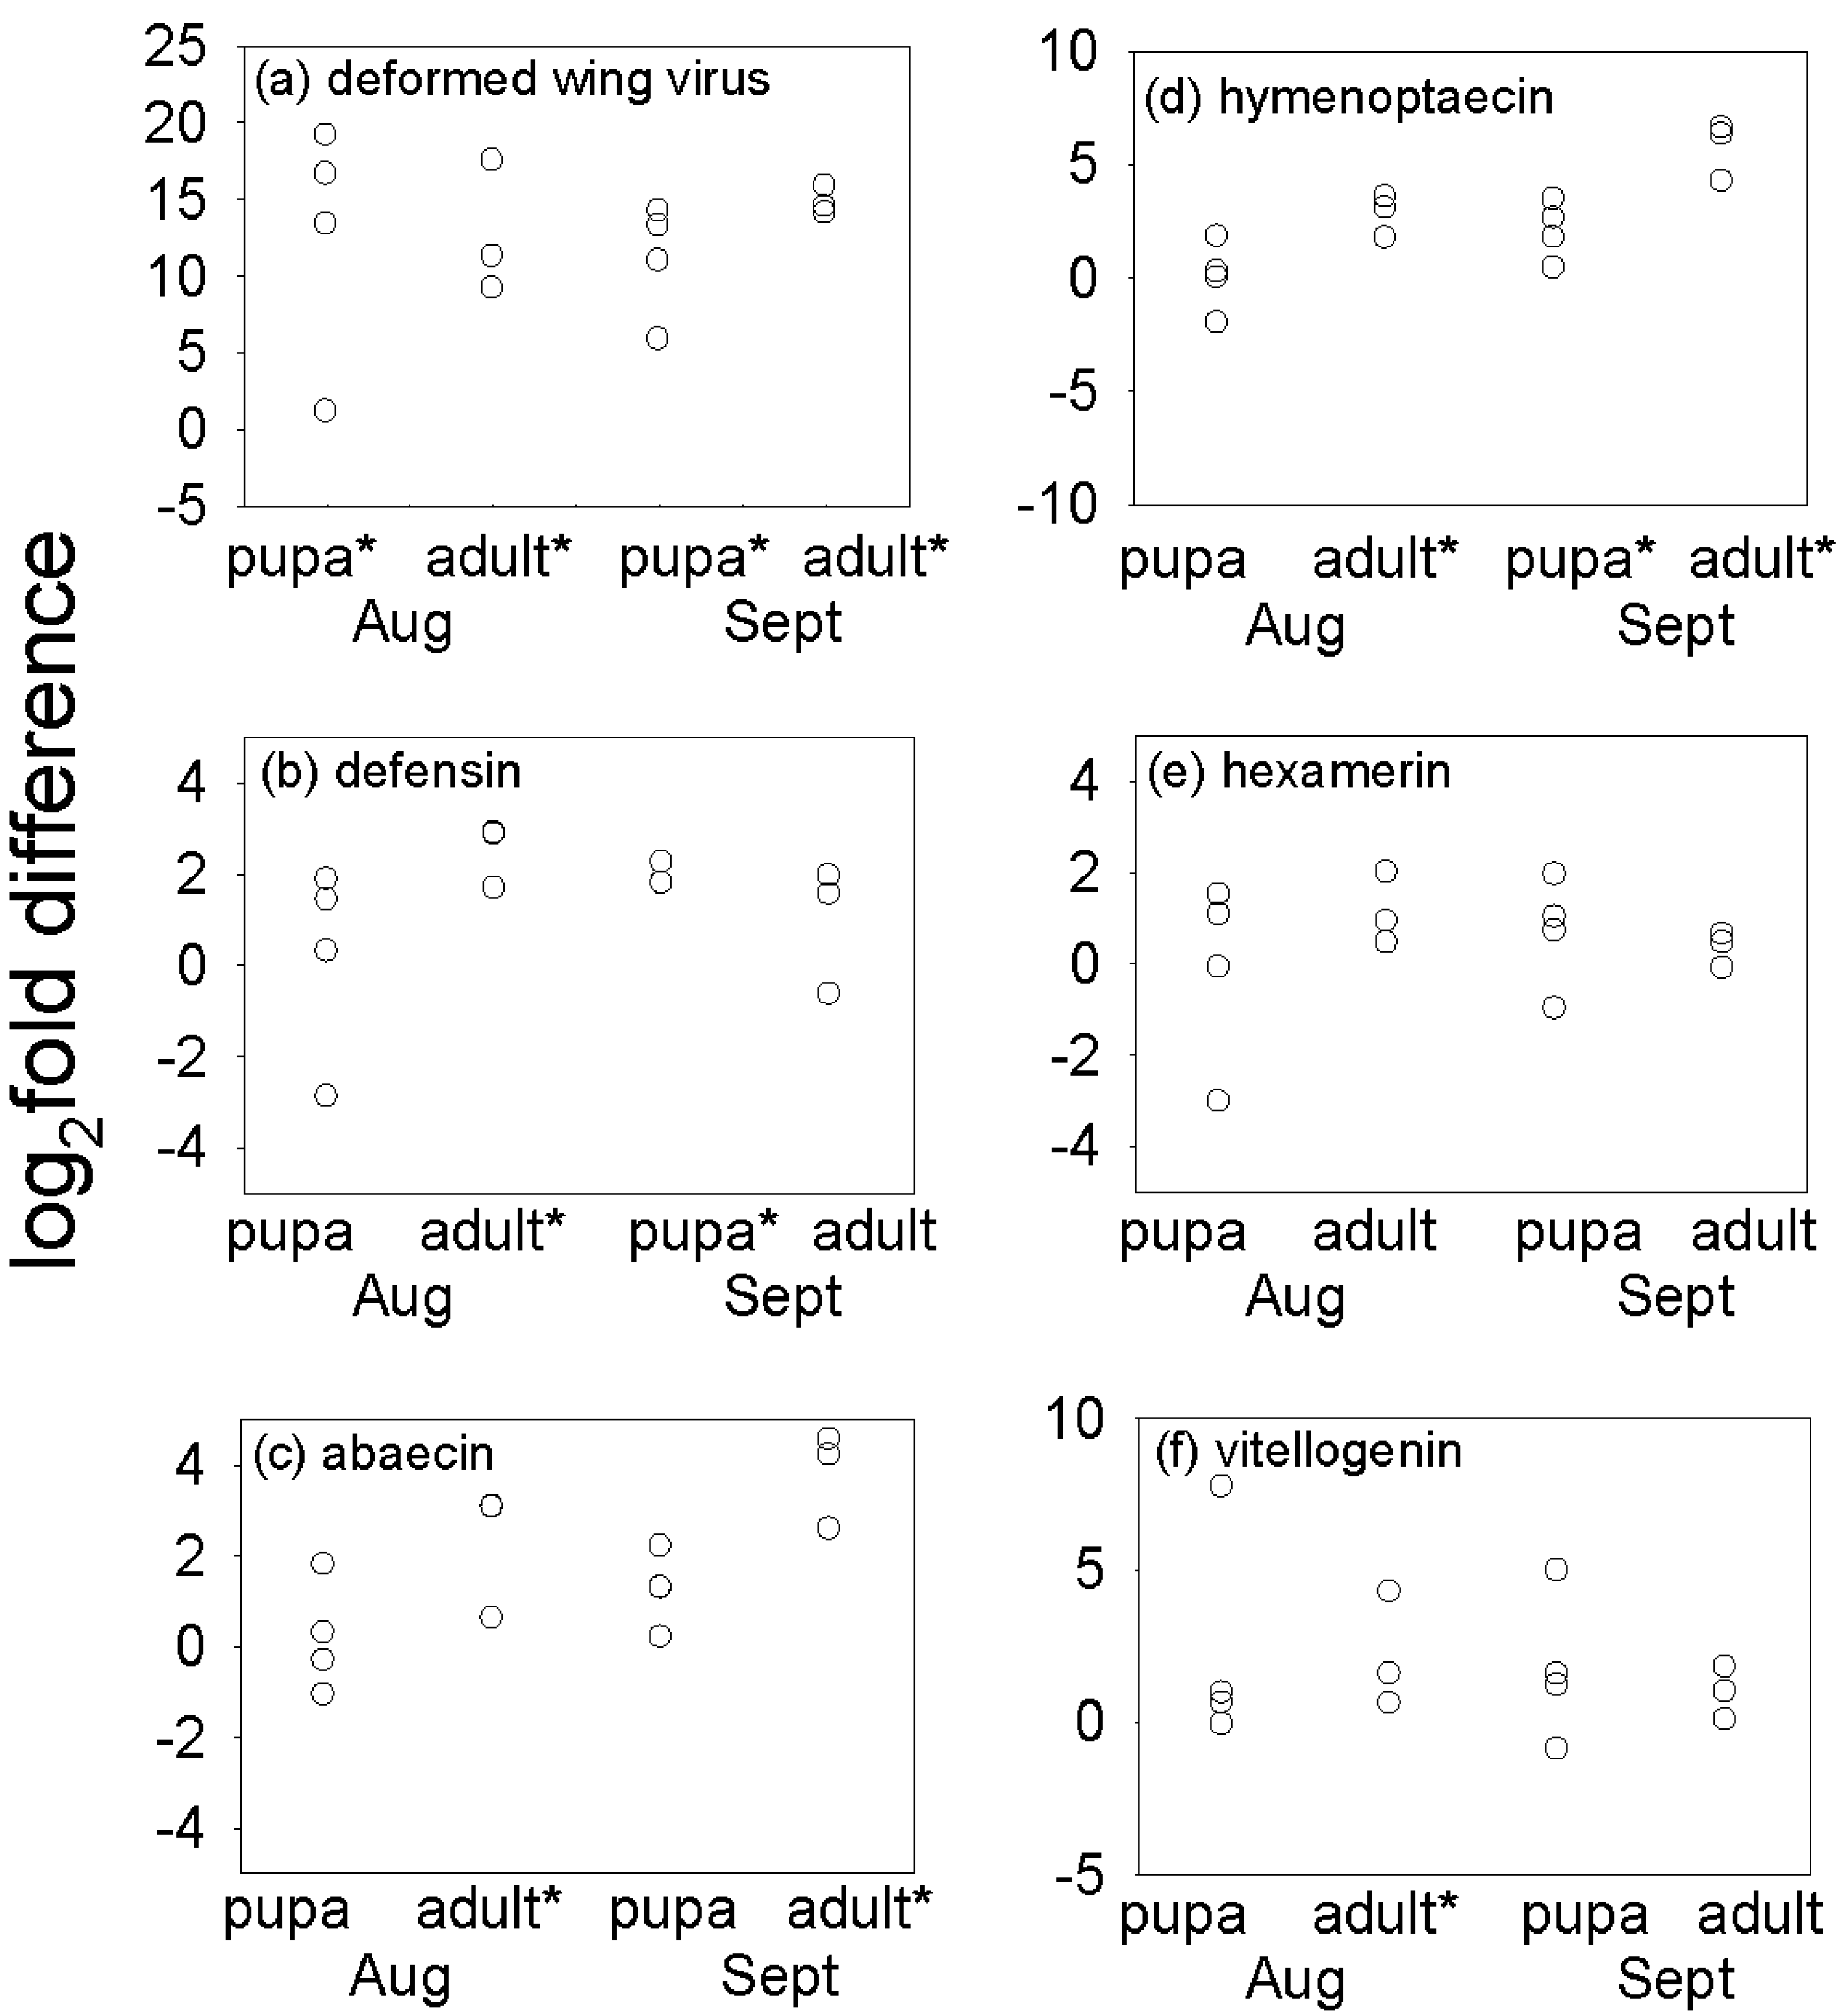
Consistent with previous reports [
13,
14,
15,
17,
27], DWV titer was significantly elevated in
Varroa-infested insects, a result that has been interpreted previously [
13] to indicate that
Varroa may reduce the immunological capacity of the honey bee to limit replication of DWV. For example, honey bee defenses based on RNAi may be impaired in
Varroa-infested bees. Intriguingly, expression of the autophagic-specific gene 18 (
Atg18) is reduced in
Varroa-infested bees [
28]. This could be indicative that elements of the defensive response against DWV are intact because the autophagic vacuole can act as a site of replication for certain RNA viruses, e.g., dengue virus, in insects [
29,
30]. Alternatively, activation of virus replication in
Varroa infested bees has been discussed by [
27,
31]. Moreover, the co-infection of DWV with another single-stranded RNA virus,
Varroa destructor-1 virus (VDV-1) and/or their recombinants were implicated in facilitating virus transmission and replication in the host [
32,
33].
We had predicted that
Varroa-infested bees would display reduced expression of the AMP genes
defensin1,
abaecin and
hymenoptaecin (see Introduction), based on published evidence that the expression of these genes in newly-emerged bees challenged with
E. coli was elevated to a greater extent in uninfested bees than
Varroa-infested bees [
13]. Contrary to our prediction, expression of these AMP genes was not reduced by
Varroa infestation in this study (
Figure 2). Our results are, however, consistent with one report of no significant changes in expression of immune-related genes in
Varroa parasitized bees [
28]. Taken together, these studies suggest that the impact of
Varroa on AMP expression may be variable, being influenced for example by honey bee genotype and environmental conditions.
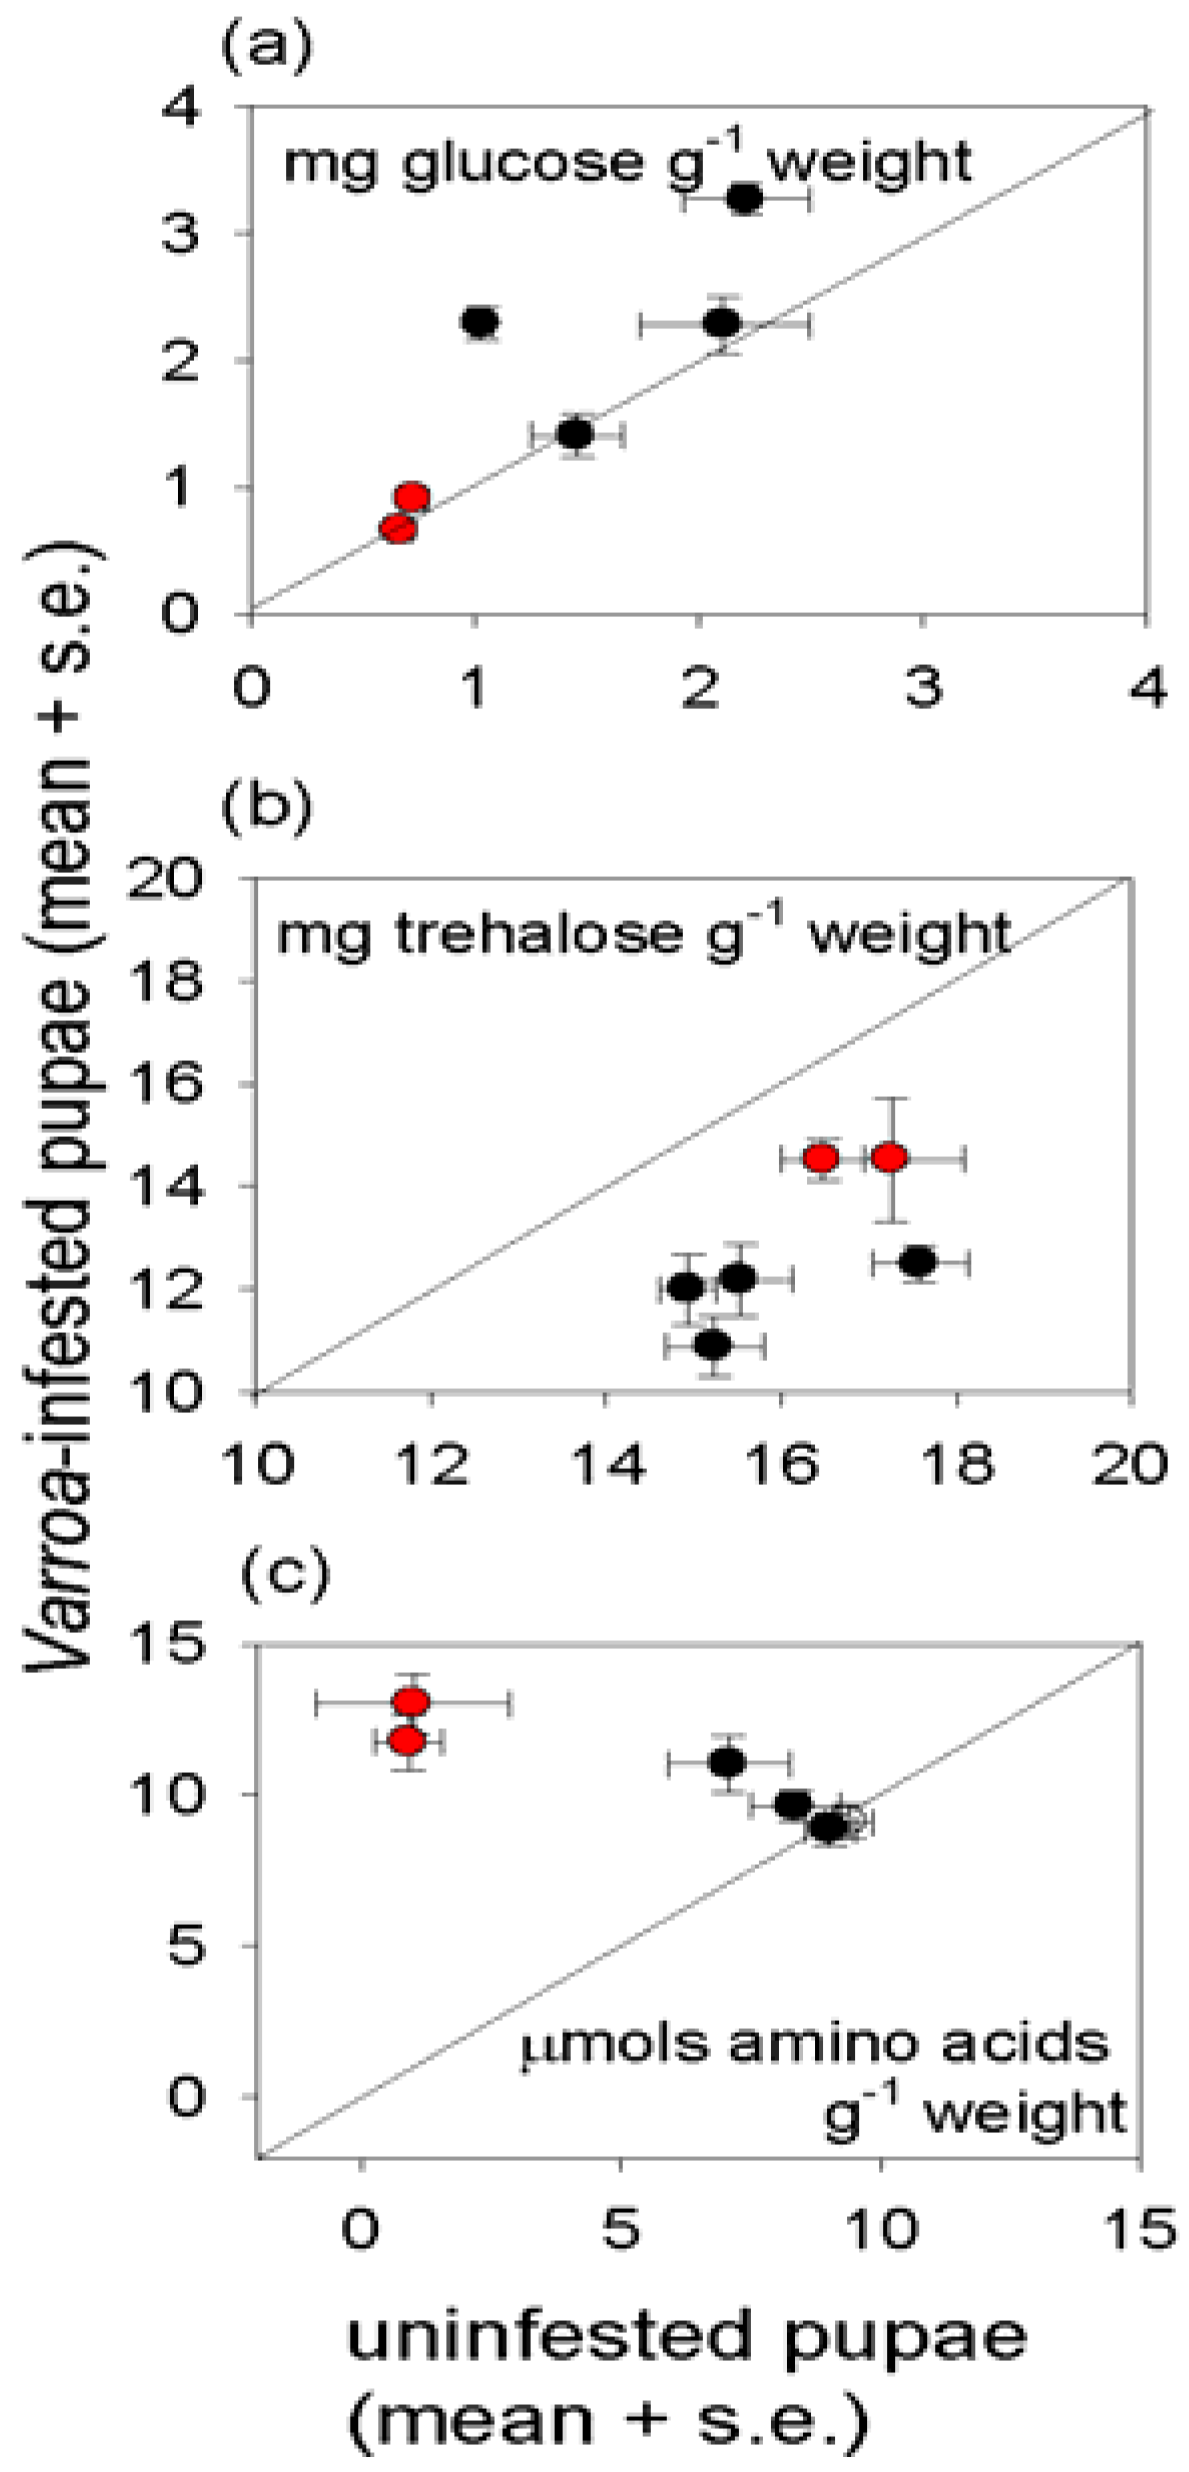
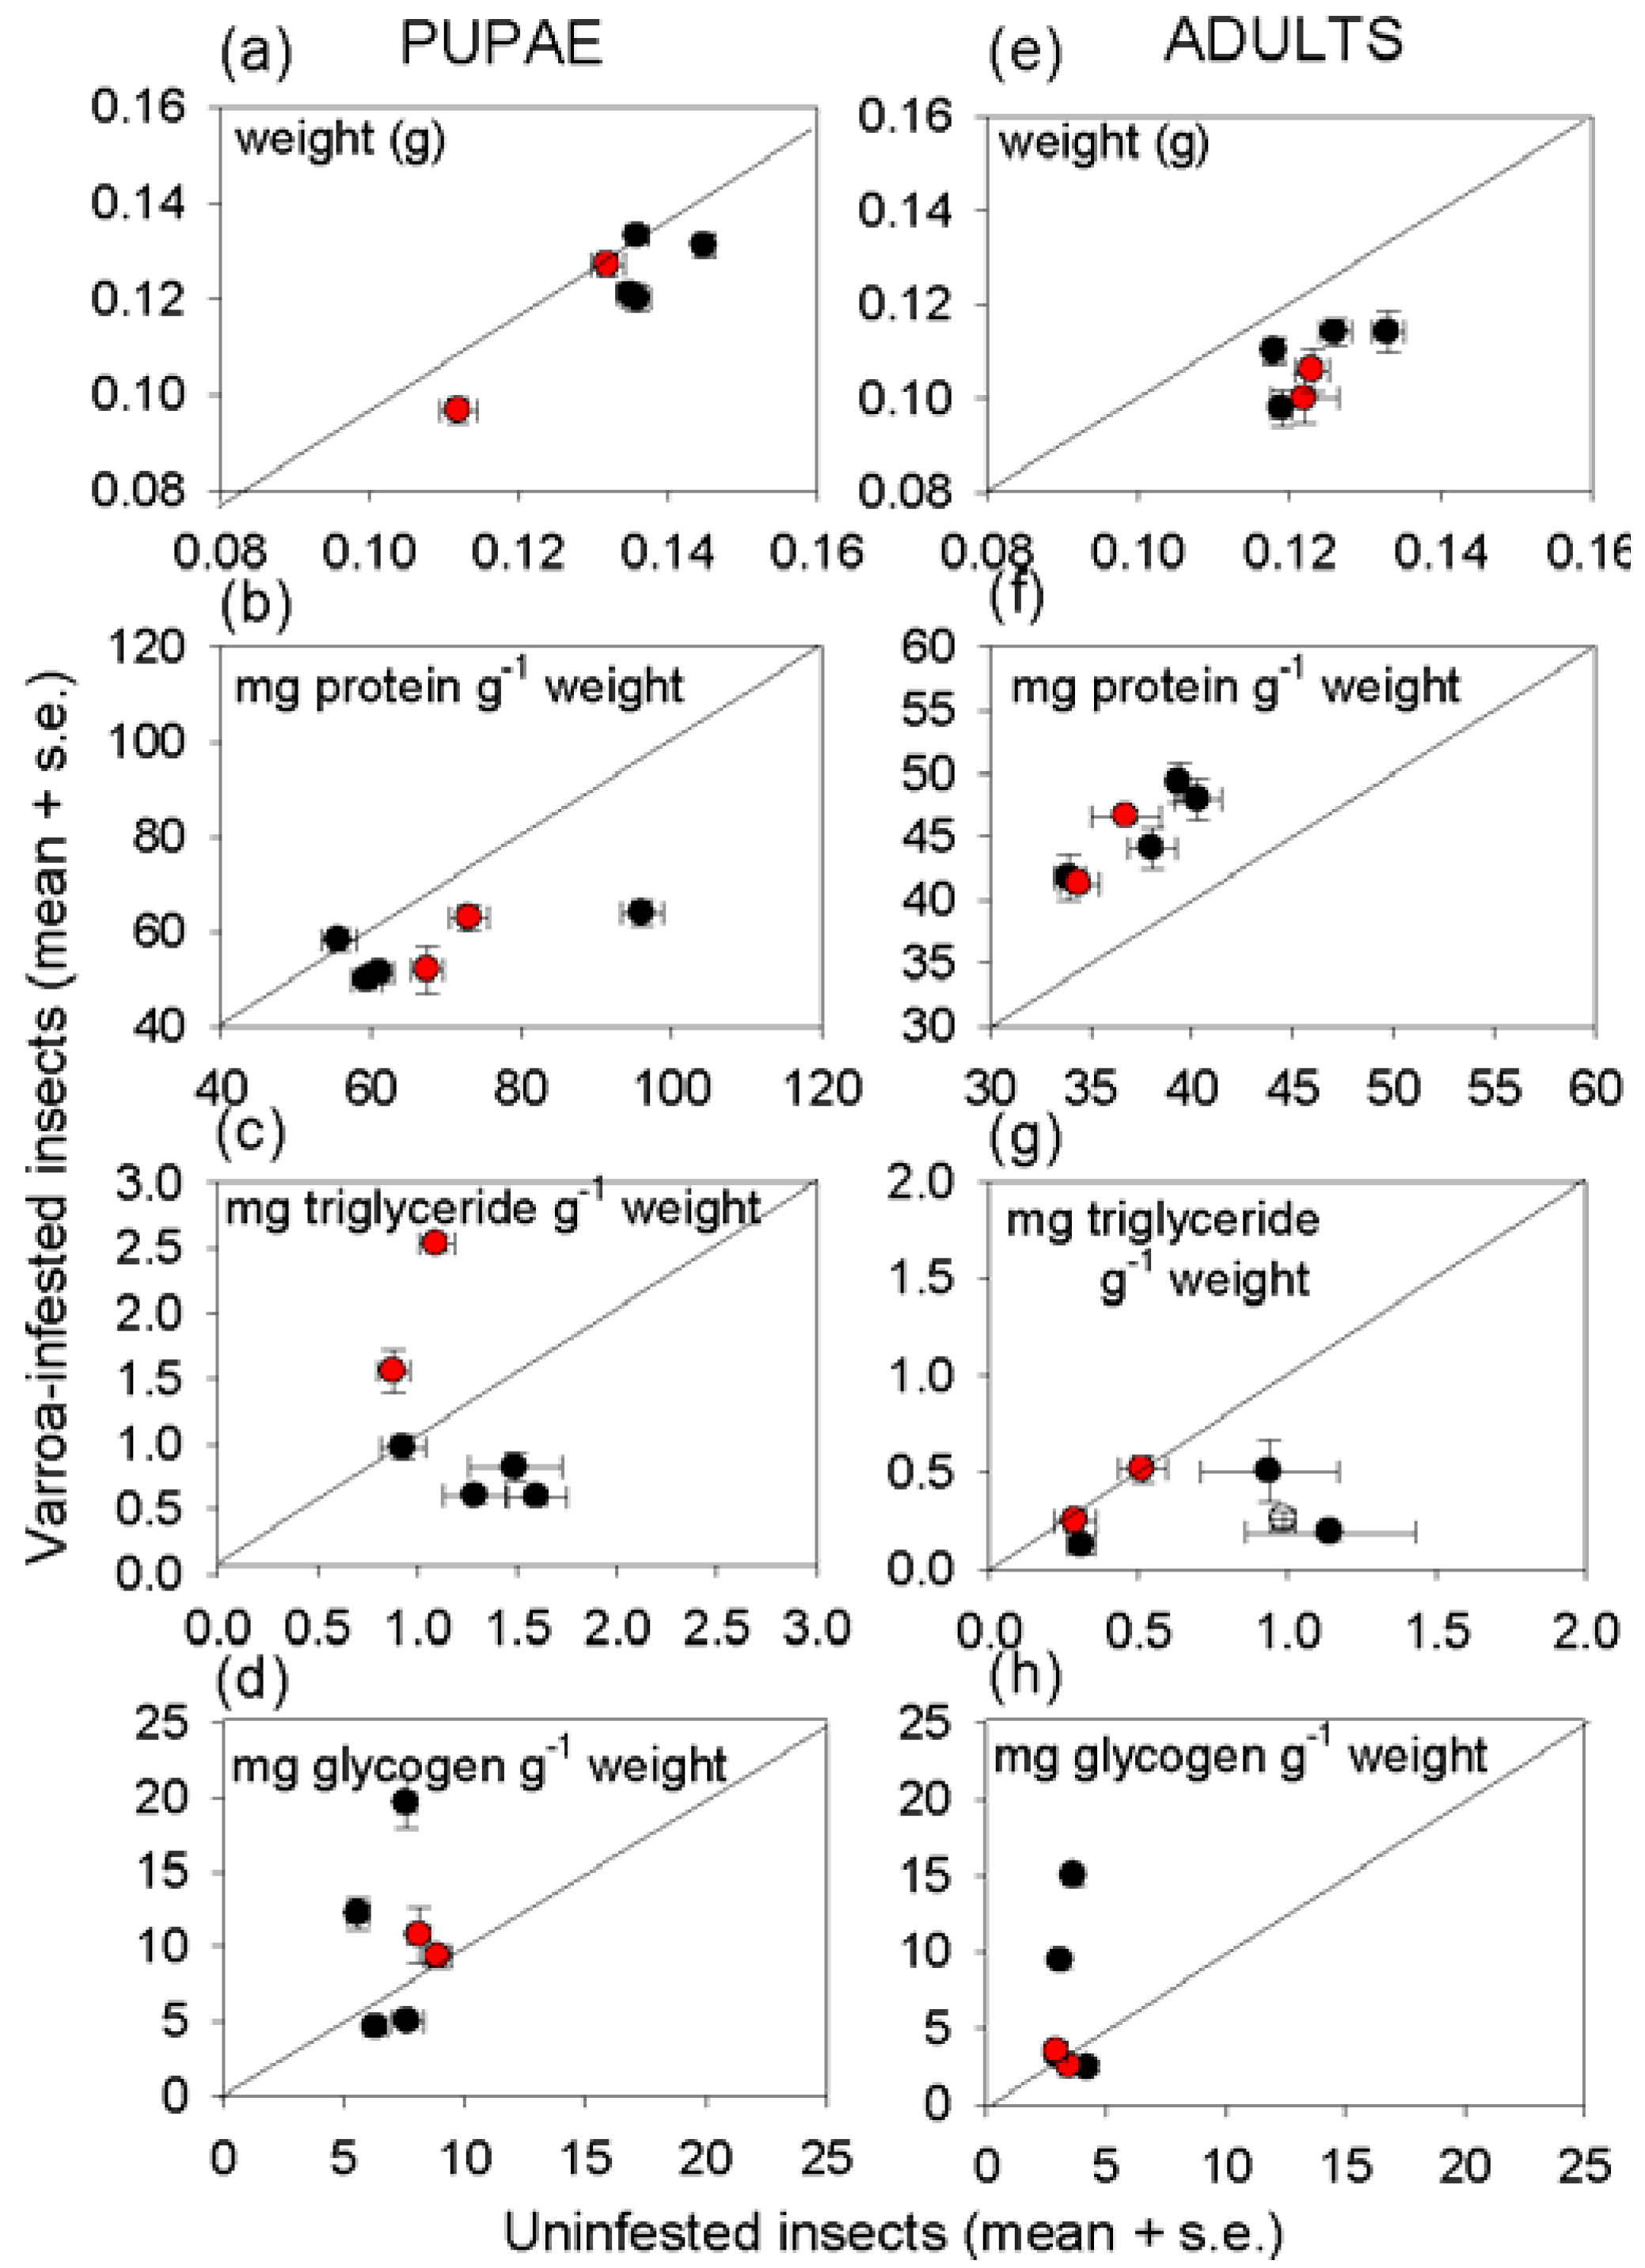
Varroa-infested honey bees are profoundly unhealthy, as indicated by their lower weight and reduced density of multiple nutrients, relative to uninfested bees of the same developmental stage (
Figure 3,
Figure 4).Nevertheless, the impact of
Varroa on honey bee nutrition is complex, and no individual index of nutritional condition could be related to any individual index of immunological condition of the honey bees tested in this study. Despite the evidence for a relationship between immune function and nutritional condition in insects and other animals (see Introduction), attempts to identify the patterns of interaction can easily be confounded by other factors, especially in field populations as studied here.
The protein content of the insects illustrates the complexity of nutritional responses to
Varroa. Reduced protein density of
Varroa-infested bees is predicted frompublished reports that
Varroa depresses the protein content of newly-emerged adult bees [
34] and the abundance of transcripts functioning in protein metabolism [
35]. This expectation was confirmed for pupae, but not newly-emerged adults in this study.
Varroa-infested pupae also had significantly elevated free amino acid content, suggesting that protein synthesis, and ultimately growth, is inhibited by factors other than the supply of amino acids. The high essential amino acid content of the free amino acids in
Varroa-infested pupae would be particularly nutritious for the mites, raising the possibility that components in the
Varroa saliva interfere with protein and amino acid nutrition of the honey bee to promote mite nutrition. The elevated protein content of infested adult bees suggests that these candidate effects of
Varroa on honey bee metabolism may be stage-dependent.
The importance of extraneous uncontrolled factors in determining the nutritional condition of honey bees is illustrated by pervasive and profound effect of colony on insect nutritional condition, especially with respect to energy and carbon allocation. For triglyceride, this effect could be linked, at least partly, to the level of
Varroa infestation of the colony. Specifically, the high triglyceride density in pupae and newly-emerged bees from colonies with above-threshold
Varroa incidence (
Figure 3) may reflect the impaired nutritional input to larvae, such that offspring with elevated triglyceride levels have preferential survival rates. Additionally or alternatively, offspring may respond to poor nutritional conditions by preferential allocation to triglyceride. Further research is required to investigate these possibilities because previous studies of larval malnourishment, reviewed in [
36], have not addressed effects of
Varroa infestation on nutritional condition of the honey bee. Glycogen and glucose densities also varied among colonies, irrespective of
Varroa incidence. The multiple contributory factors may include micro-environmental variation in abiotic conditions experienced by different colonies, proximity to different food sources, and the incidence of parasites and pathogens other than
Varroa.
The immune system function of the honey bee has evolved in the context of eusociality, which both increases the potential for rapid within-colony spread of pathogens and parasites, and provides the opportunity for colony-level defenses against infection [
37,
38]. An important element to the design of this study was the use of multiple colonies, enabling us to discriminate colony-level effects on the honey bee response to
Varroa. The low weight of pupae in colonies with high
Varroa abundance, irrespective of whether the individual pupa was infested, provides a firm indication that
Varroa can deleteriously affect larval provisioning at the colony scale. Other colony-scale effects were generally not evident. A larger number of colonies across multiple sites would provide a stronger test of hypothesized colony-level effects on individual nutritional and immune-related indices than was possible with this study. The key conclusion of this study is, consequently, the pervasive deleterious effect of
Varroa on the immunological response and nutritional condition of honey bees in an environmentally-challenging habitat.

