2.1. Results
Since recruitment targeted “essentially healthy” participants, the CHDWB cohort represents a healthy population relative to the characteristics of the general US population. Individuals were excluded if they were functionally impaired by poorly controlled chronic disease or acute illness, but included if taking medications for common ailments. Demographic and clinical characteristics of CHDWB participants at baseline are provided in
Appendix Table A1. Prevalence of obesity, hypertension and diabetes in US were reported to be 35.7%, 28.6% and 8.2% in 2010 [
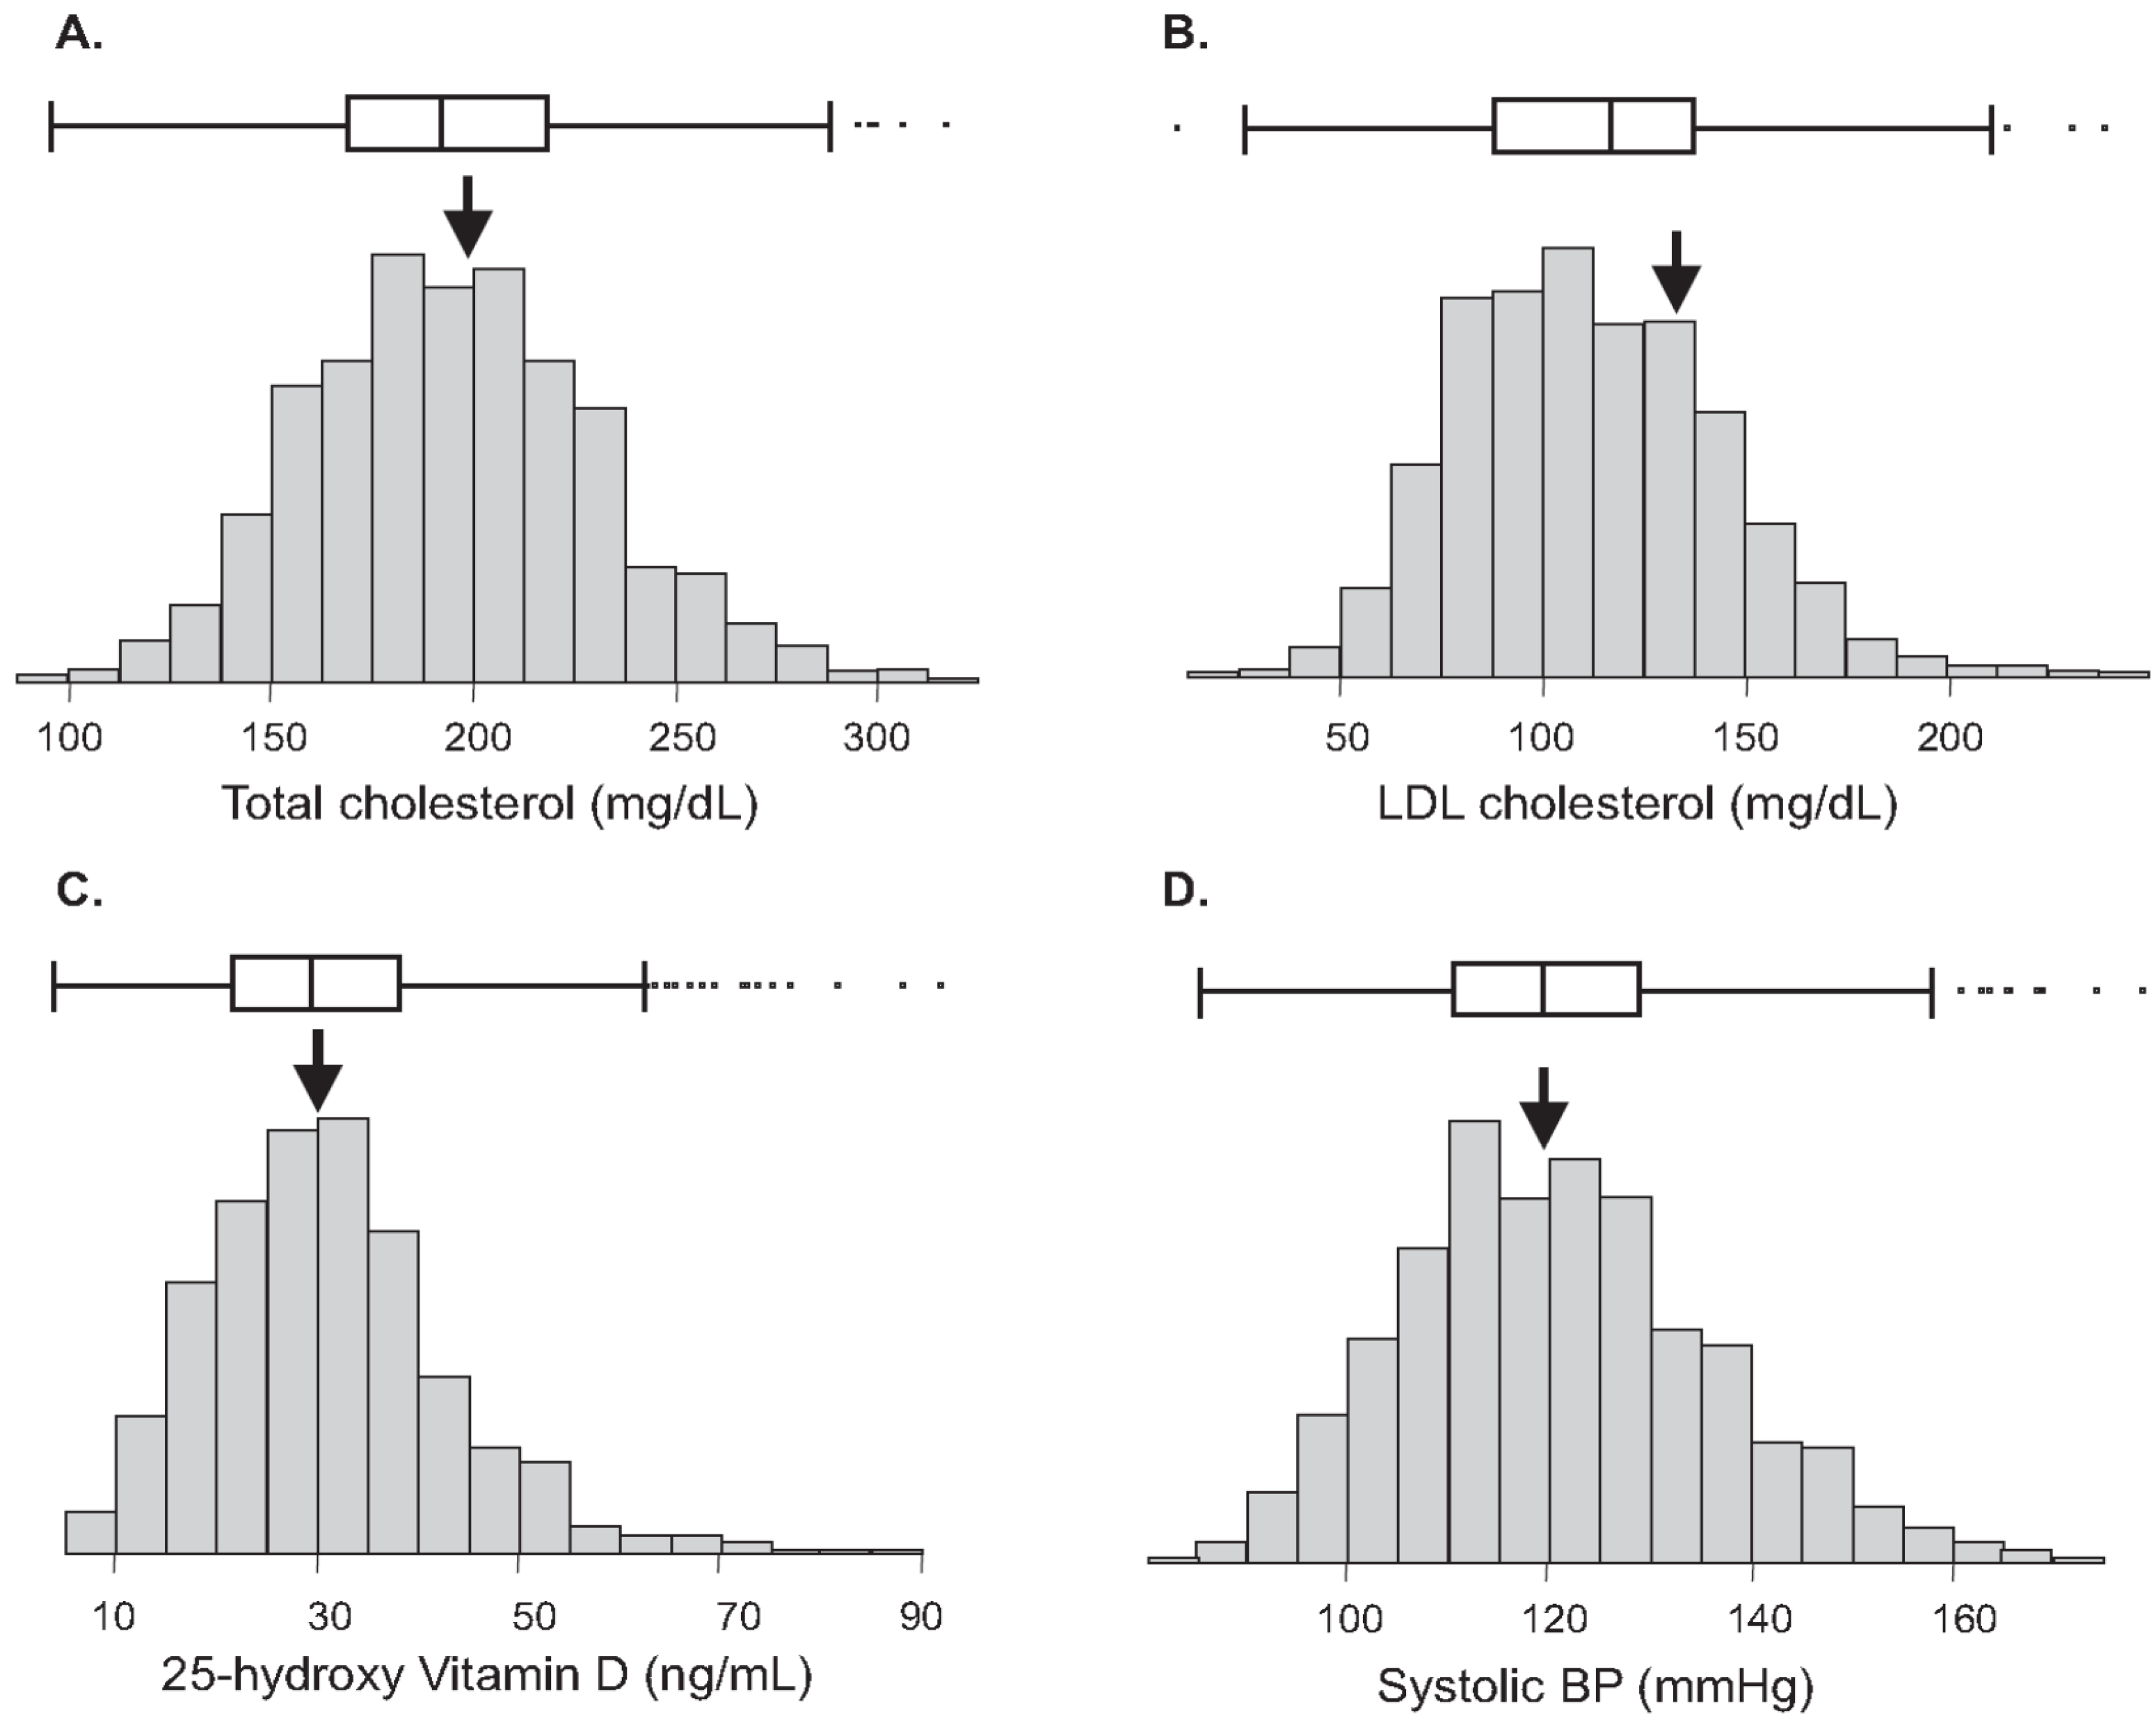
5]. The CHDWB cohort had lower prevalence of these chronic NCDs compared to the general US population. Of the total 668 participants in the CHDWB cohort, which includes 217 men and 451 women with a mean age of 48 years, 28.4% were obese subjects, 22.1% had hypertension and 3.6% had diabetes at baseline. Though the prevalence of clinical disease is relatively low, a significant proportion of individuals were nevertheless at pre-clinical risk of NCDs, particularly CVD. Almost half of the participants had abnormal systolic blood pressure (>120 mm/Hg) and total cholesterol levels >200 mg/dL (
Figure 1), both of which are central risk factors for CVD [
6]. Vitamin D level, which has already been shown to be associated with risk of CVD in the CHDWB cohort [
4], was also lower than normal (<30 ng/mL) in more than 50% of the participants. Likewise, other risk factors for NCDs including BMI, percent body fat, LDL-C, and depression were at elevated levels in the cohort.
The distribution of clinical traits and biochemical profiles in the cohort suggests that a large proportion of apparently healthy individuals are at high risk of developing CVDs and could be high priority targets for prevention and management of chronic disorders. With this goal, each participant discussed individualized health-promotion behaviors with their health partners, often targeting diet and physical activity regimes based on their clinical profile. If, for example, someone wanted a health plan that included double the normal fat intake, the health partner would have discouraged this, but if the participant really wanted that as their health plan, then that is what it was. Importantly, there were no prescribed targets commonly applied to the whole cohort. Occasionally participants were referred to an appropriate clinic if required. Participants were examined again after six months, and approximately at one year intervals.
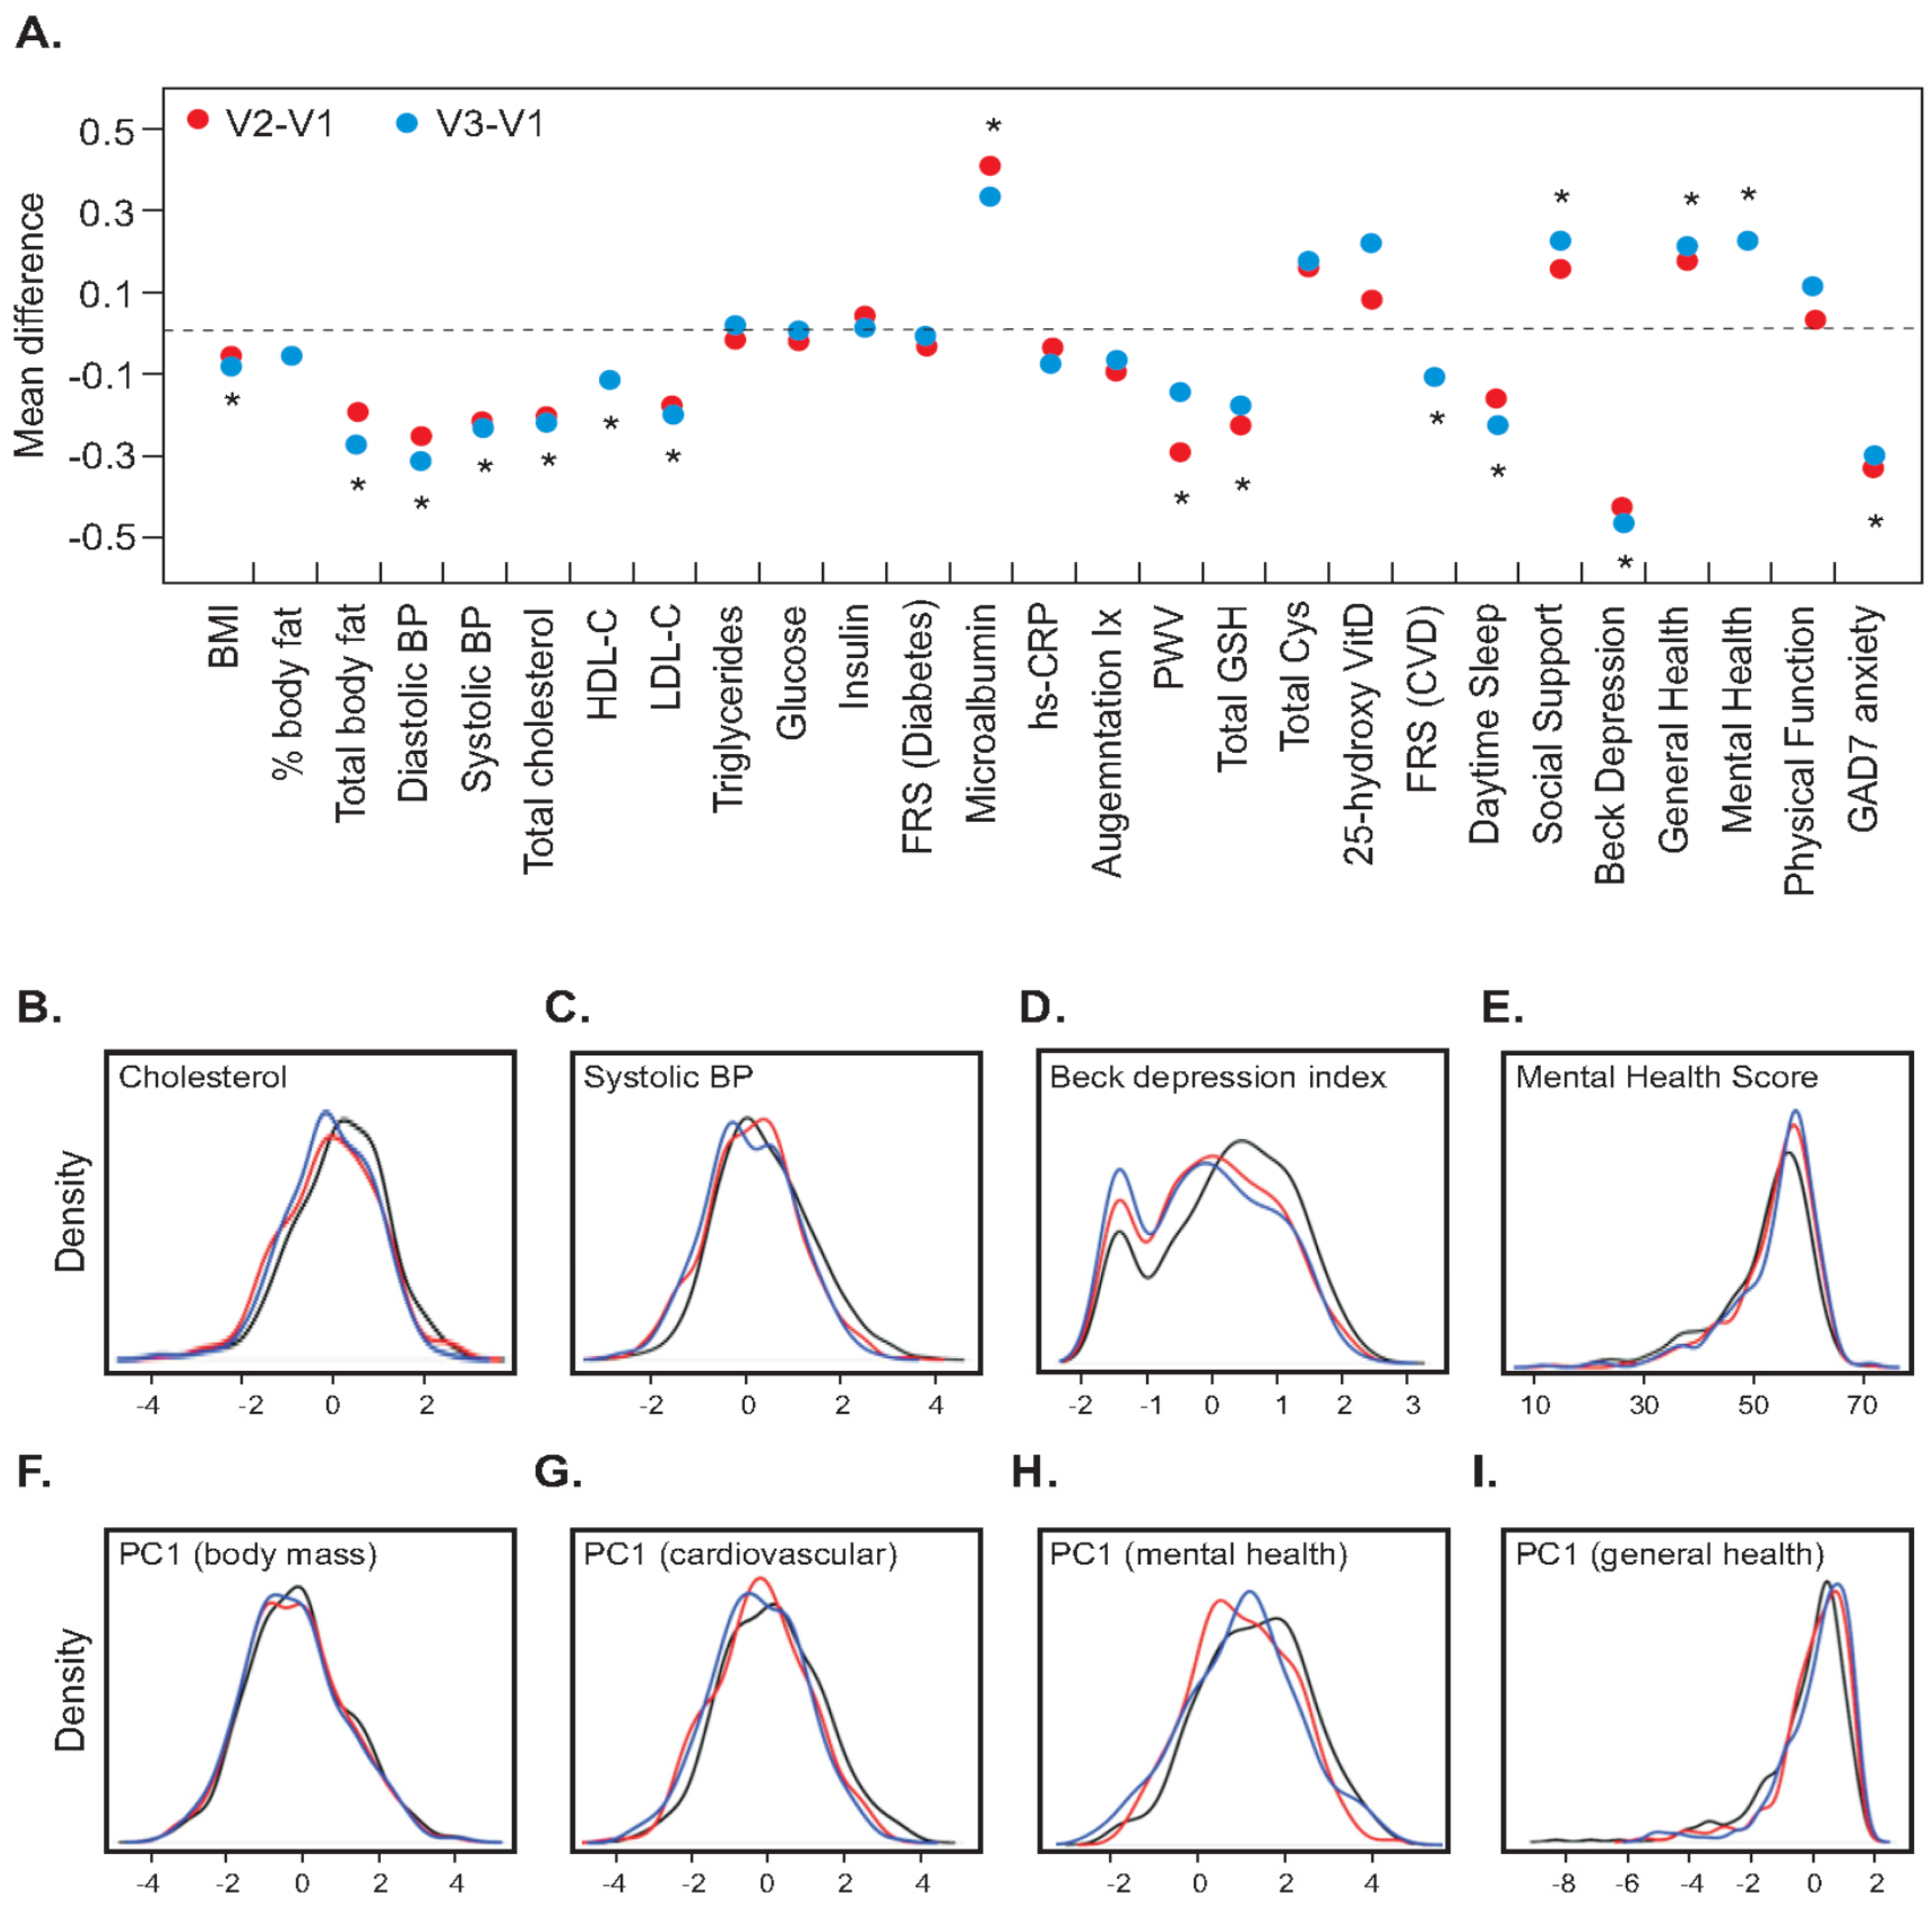
Table 1 summarizes characteristics of 382 participants, all of whom had completed three visits. The characteristics of the subjects who completed three visits were similar to those who did not attend the follow-up examinations. Significant improvement in the health of participants, particularly, cardiovascular and mental health, was observed during the first six months and this was continued or maintained for at least one year. Very similar results were observed for the full set of 502 participants for the contrast of Visit 1 and Visit 2 (not shown). As assessed by paired Wilcoxon signed rank tests, there were significant shifts in median levels of blood pressure, total cholesterol, LDL-C, 25-hydroxyvitamin D, mental health and depression, in all cases towards the optimal range from baseline to second visit and again to third visit (
p < 0.05 for all comparisons).
Figure 2B–E shows kernel density plots contrasting baseline (black), 6-month (red) and 12-month (blue) scores for four representative traits which showed significant shifts towards more optimal values over the first three visits. Overall, the cohort has shown marked improvement in the health and all shifts (with the exception of HDL-Cholesterol) were in the desirable direction.
Figure 1.
Distribution of cardiovascular risk factors in The Center for Health Discovery and Wellbeing (CHDWB) cohort at baseline. Arrows indicate reference mean for US population at large. Box and whisker show 1 and 2 standard deviations from the mean. Frequency distribution histograms are for (A) Total cholesterol, (B) LDL cholesterol, (C) Vitamin D, and (D) systolic blood pressure.
Table 1.
Characteristics at baseline and follow-up examinations, with comparison across the visits.
Table 1.
Characteristics at baseline and follow-up examinations, with comparison across the visits.
| Trait | Mean ± S.D. | p Value |
|---|
| Visit 1 | Visit 2 | Visit 3 | V1/V2 | V1/V3 | V2/V3 |
|---|
| BMI | 27.37 ± 5.89 | 27.11 ± 5.71 | 26.95 ± 5.75 | 3.1 × 10⁻⁶ | 2.5 × 10⁻⁸ | 0.12 |
| Fat % | 32.33 ± 9.5 | 31.97 ± 9.78 | 31.95 ± 9.79 | 0.02 | 0.04 | 0.57 |
| Total body fat | 27.21 ± 9.14 | 25.79 ± 8.63 | 25.42 ± 8.42 | 7.5 × 10⁻¹¹ | 2.6 × 10⁻¹³ * | 0.004 |
| Diastolic BP (mmHg) | 76.26 ± 10.46 | 73.90 ± 9.66 | 73.85 ± 10.5 | 4.7 × 10⁻⁸ * | 1.5 × 10⁻⁹ * | 0.81 |
| Systolic BP (mmHg) | 120.58 ± 15.74 | 116.72 ± 14.61 | 115.78 ± 14.06 | 3.0 × 10⁻⁹ * | 1.5 × 10⁻¹⁴ * | 0.22 |
| Total cholesterol (mg/dL) | 196.65 ± 35.91 | 189.7 ± 36.7 | 188.44 ± 32.95 | 6.3 × 10⁻⁶ * | 2.1 × 10⁻⁹ * | 0.72 |
| HDL-C (mg/dL) | 64.16 ± 17.98 | 62.00 ± 17.76 | 62.29 ± 17.86 | 1.2 × 10⁻⁴ | 4.3 × 10⁻⁵ | 0.85 |
| LDL-C (mg/dL) | 111.93 ± 31.77 | 107.00 ± 31.44 | 105.42 ± 29.58 | 2.3 × 10⁻⁴ * | 1.9 × 10⁻⁷ * | 0.36 |
| Triglycerides (mg/dL) | 103.94 ± 64.88 | 104.42 ± 58.81 | 104.03 ± 59.63 | 0.85 | 0.82 | 0.17 |
| Glucose (mg/dL) | 89.70 ± 18.29 | 90.64 ± 16.96 | 90.75 ± 31.97 | 0.97 | 0.69 | 0.09 |
| Insulin | 8.03 ± 8.35 | 7.90 ± 6.15 | 9.03 ± 17.17 | 0.64 | 0.88 | 0.82 |
| FRS (Diabetes) | 1.85 ± 3.73 | 2.39 ± 5.44 | 1.89 ± 3.94 | 0.56 | 0.66 | 0.49 |
| Microalbumin | 0.59 ± 1.4 | 0.84 ± 2.18 | 0.75 ± 1.25 | 2.0 × 10⁻¹⁰ * | 7.6 × 10⁻¹⁰ * | 0.71 |
| hs-CRP (mg/dL) | 0.37 ± 0.39 | 0.39 ± 0.41 | 0.39 ± 0.43 | 0.34 | 0.16 | 0.67 |
| AIX | 21.46 ± 9.79 | 21.30 ± 9.74 | 20.55 ± 10.02 | 0.04 | 0.08 | 0.54 |
| PWV (m/s) | 7.29 ± 1.43 | 7.01 ± 1.34 | 7.08 ± 1.19 | 5.0 × 10⁻⁶ * | 3.7 × 10⁻⁴ * | 0.17 |
| Total GSH (uM) | 4.55 ± 1.60 | 4.22 ± 1.45 | 4.17 ± 1.17 | 1.2 × 10⁻⁴ * | 0.012 * | 0.43 |
| Total Cys (uM) | 182.68 ± 37.97 | 189.03 ± 39.42 | 190.32 ± 37.40 | 0.0015 * | 0.002 * | 0.038 |
| 25-hydroxyvitamin D (ng/mL) | 31.62 ± 12.81 | 31.73 ± 11.69 | 33.84 ± 11.02 | 0.59 | 1.7 × 10⁻⁴ * | 0.16 * |
| FRS (CVD) | 6.07 ± 6.38 | 5.23 ± 4.65 | 5.21 ± 5.06 | 8.0 × 10⁻⁶ | 1.0 × 10⁻⁷ | 0.99 |
| Day-time Sleep Score | 6.77 ± 4.04 | 6.06 ± 3.8 | 5.84 ± 3.84 | 4.6 × 10⁻⁵ * | 1.4 × 10⁻⁸ * | 0.21 |
| Social Support Score | 27.91 ± 5.04 | 28.8 ± 4.73 | 29.17 ± 4.61 | 3.2 × 10⁻⁷ * | 7.7 × 10⁻¹¹ * | 0.78 |
| Depression Score | 5.3 ± 5.45 | 3.51 ± 4.54 | 3.25 ± 4.3 | 3.4 × 10⁻¹¹ * | 8.5 × 10⁻¹¹ * | 0.05 |
| General Health Score | 53.04 ± 7.85 | 54.53 ± 7.34 | 54.65 ± 7.47 | 3.7 × 10⁻⁷ * | 3.6 × 10⁻⁸ * | 0.29 |
| Mental Health Score | 52.23 ± 7.64 | 53.97 ± 6.79 | 54.41 ± 7.73 | 7.2 × 10⁻⁷ * | 5.0 × 10⁻⁷ * | 0.23 |
| Physical Function Score | 53.15 ± 5.49 | 53.41 ± 5.6 | 53.97 ± 5.46 | 0.02 | 5.0 × 10⁻⁸ * | 8.0 × 10⁻⁴ * |
| Anxiety Score | 3.38 ± 0.50 | 2.35 ± 2.75 | 2.41 ± 3.21 | 3.1 × 10⁻⁷ * | 1.0 × 10⁻⁴ | 0.44 |
Next, we calculated the average change in standardized z-scores for each trait for each individual from baseline to six months and one year. Representative traits, most of which showed significant changes, are plotted in
Figure 2A. The mean Framingham Cardiovascular Risk Score (FRS-CVD, a commonly used predictor of risk of heart attack calculated from an individual’s age, gender, total and HDL cholesterol, blood pressure and smoking status:
http://cvdrisk.nhlbi.nih.gov) shifted from 6.1% to 5.2% in one year, with a significant change of −0.11 z-score units (
p = 1.0 × 10
−7) (
Figure 2A). Pulse Wave Velocity (PWV), another measure of cardiovascular health [
7], reduced significantly at six months (change = −0.3 z-score units,
p = 5.0 × 10
−6) but then showed a non-significant increase. Reductions in CVD risk factors including BMI, lipids and blood pressure were also observed. However, traits related to glucose metabolism including plasma glucose and insulin levels, and consequently FRS-Diabetes (similar to FRS-CVD but also incorporating BMI, fasting glucose and triglyceride levels as well as family history of diabetes) remained unchanged (
Table 1 and
Figure 2). Significant changes in emotional (social support) and psychological factors (depression and anxiety) were also seen. The first principal component analysis of factors related to cardiovascular disease, obesity, depression, physical and mental health, also changed in the desired direction, as shown in the kernel density plots in
Figure 2F–I. Each indicates a reduction in the proportion of individuals with highly positive obesity, CVD, and depression scores, or negative mental health scores, reiterating our finding that there is significant improvement in physical, cardiovascular and mental health of the participants after 6 months, that either continued to improve or was at least maintained for one year.
Figure 2.
Changes in health measures in first three visits. (A) Plot of mean differences between Visit 2 (red) or Visit 3 (blue) and Baseline (Visit 1) for the indicated standardized trait measures. Asterisks indicate that the Visit 2 difference was significant at p < 0.0005 by Wilcoxon paired sample rank sign test; (B–E) Kernel density plots of the frequency of individuals with the indicated values for four clinical measures at Baseline (black), Visit 2 (red) and Visit 3 (blue), in each case showing left-ward shift of the curve (rightward for the Mental Health score) with fewer individuals with unhealthy measures; (F–I) Kernel density plots for Principal Component 1 summary measures for multiple contributing traits in each of the four domains, as described in the methods, also implying a general shift toward improved health in the cohort as a whole.
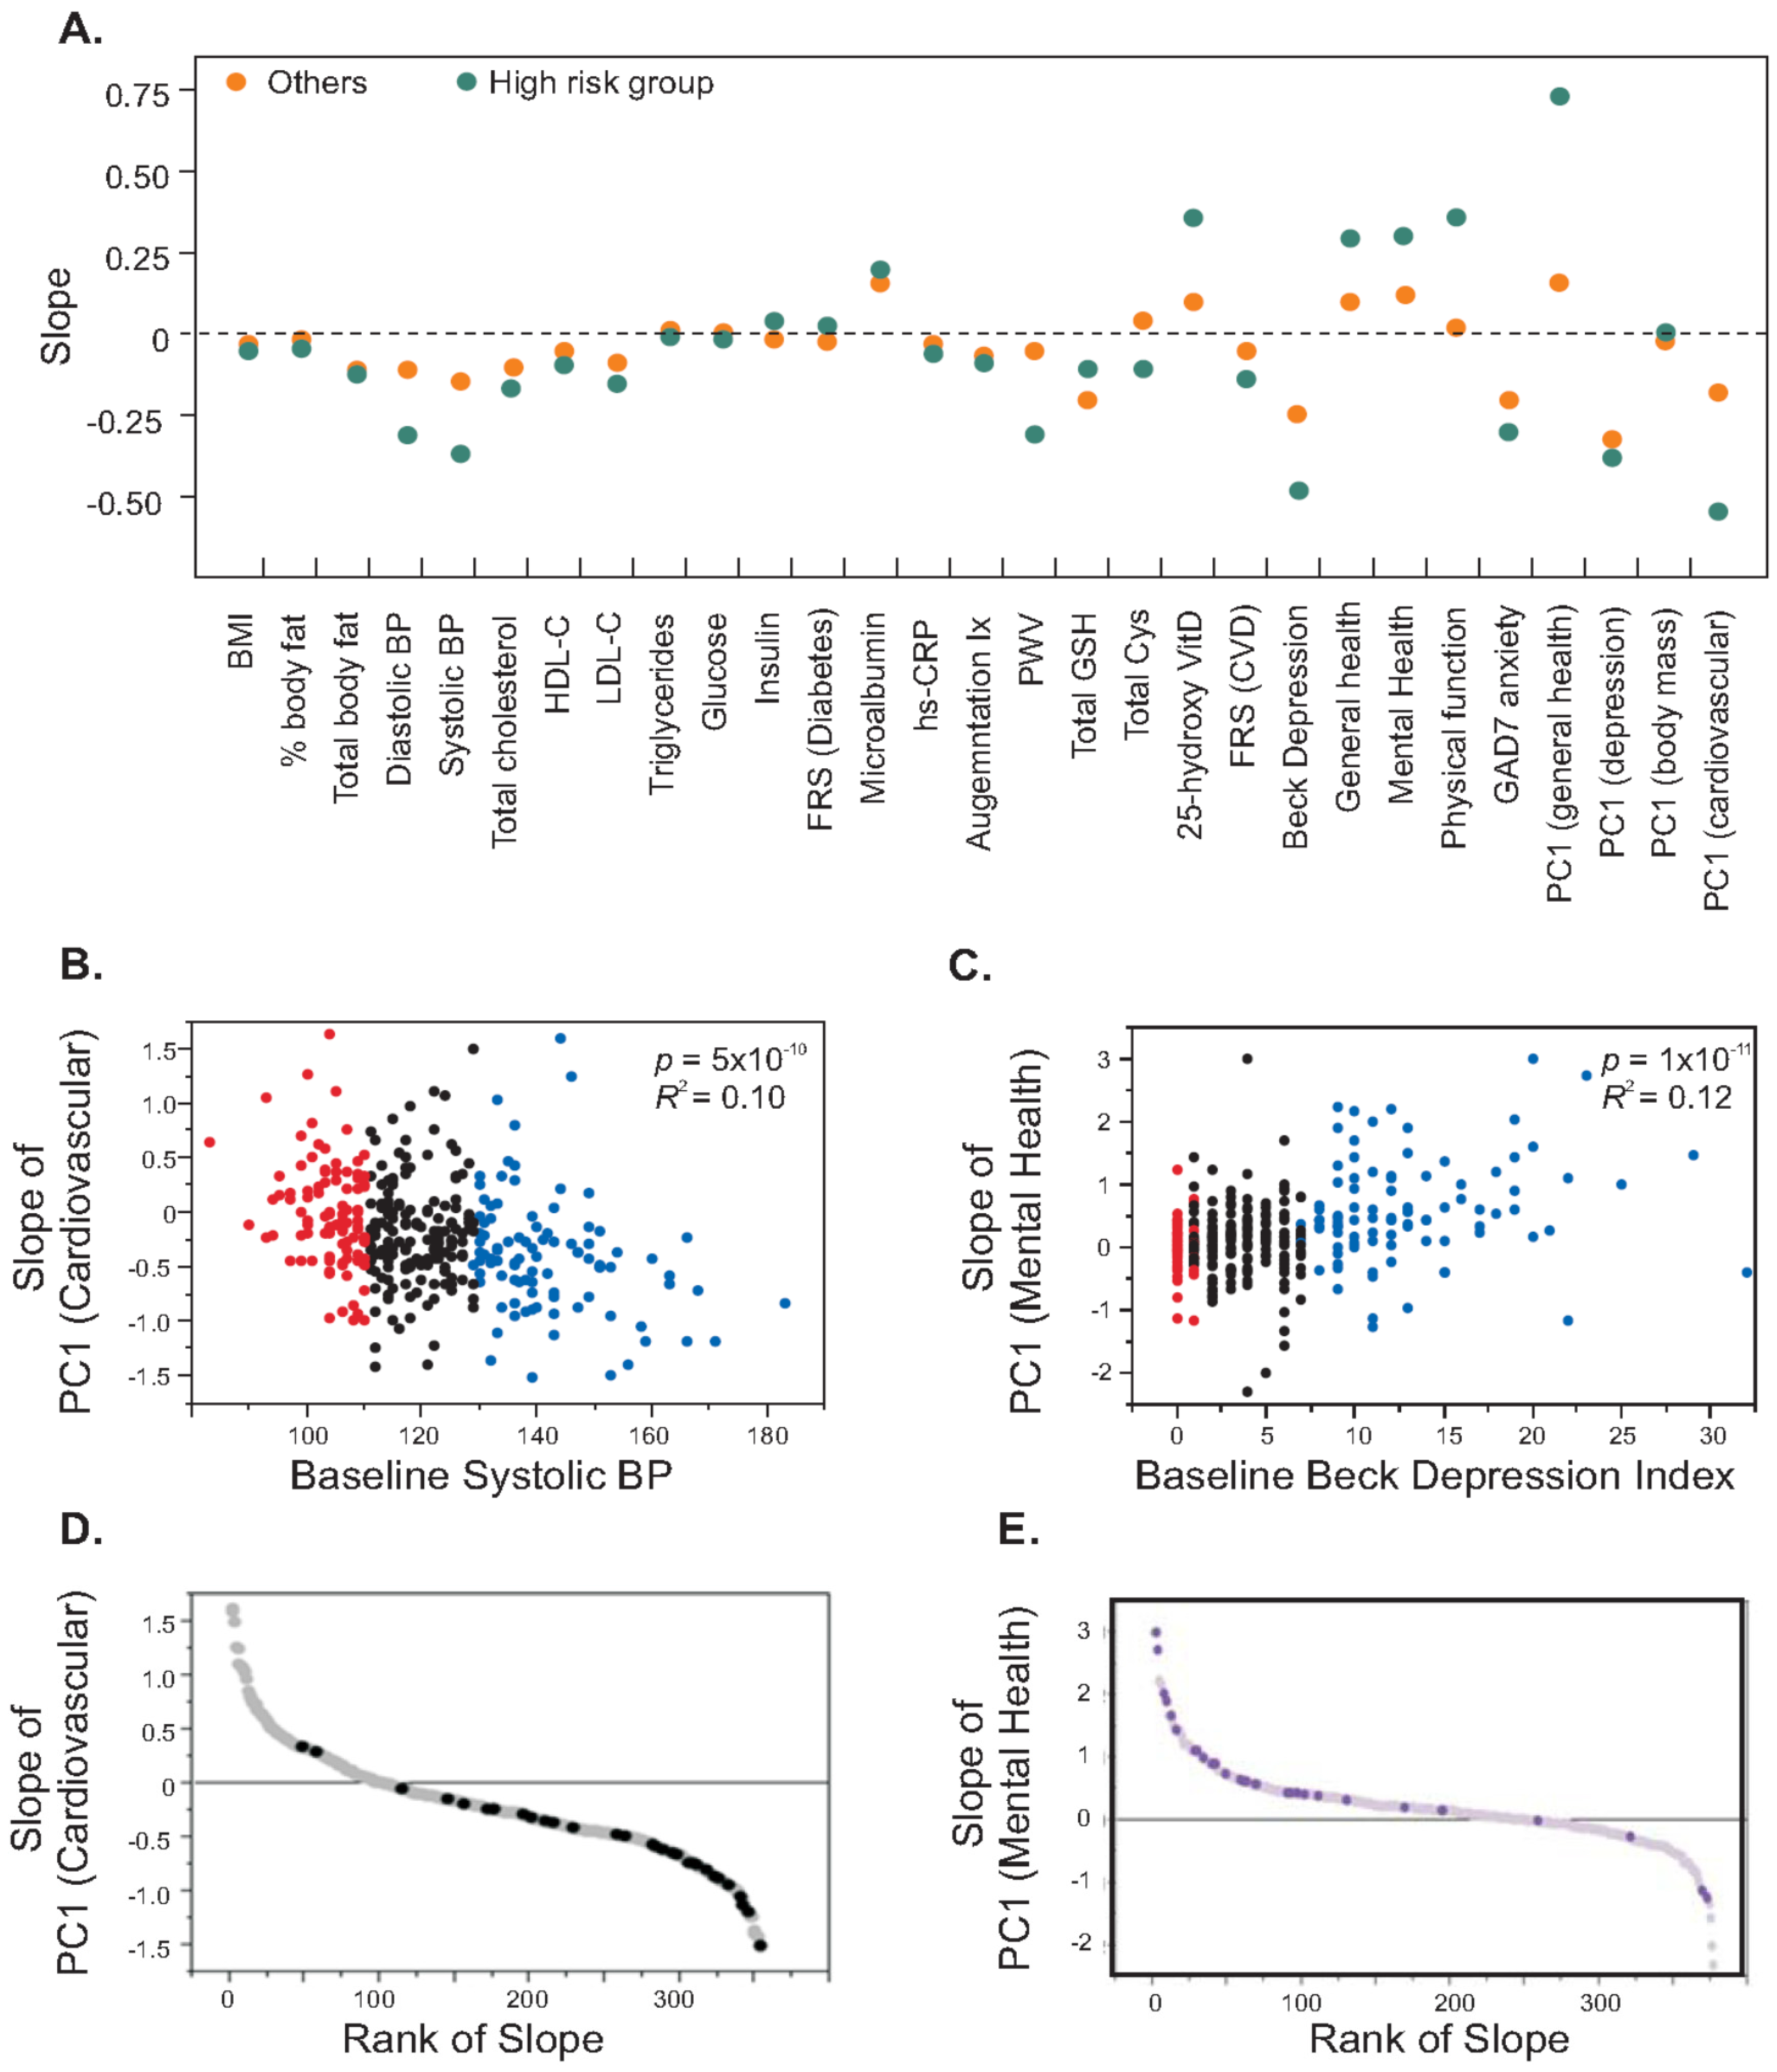
A second striking observation is that the change in risk factors was highly correlated with their baseline levels, where the participants who had higher risk factors tended to show more improvement compared to participants who were relatively healthier at the initiation visit. We illustrate the relationship between baseline levels and slope generated from three visits for each trait in
Figure 3A. These observations hold both for individual traits, and for individual traits relative to principal component (PC1) scores that summarize correlated traits. Principal components are descriptive statistics that capture the covariance of multiple traits and are often used to discover common tendencies, but here we use PC1 as a quantitative measure of traits known a priori to represent domains of health such as cardiovascular, metabolic, or mental health. For example, the left panel of
Figure 3B shows a strong negative correlation between baseline systolic blood pressure and slope of principal component for each of the FRS-CVD risk factors. Categorization of subjects based on high systolic blood pressure (≥75th percentile) and low systolic blood pressure (≤25th percentile) generated a highly significant difference in slope of the principal component for CVD risk factors (
p = 6.0 × 10
−7), since individuals having high systolic blood pressure tended to have negative slopes (average = −0.37) while the group with low initial blood pressure did not show any change in slope (average = 0.01). Similarly, individuals with higher baseline depression score showed increases in physical and mental health while those with lower depression score remained unchanged (
Figure 3C). We identified a high risk group from the cohort (N = 31) as those individuals having high CVD risk (≥75th percentile) and low mental and physical health (≤25th percentile) and
Figure 3D and
Figure 3E show that 95% of subjects in the high risk group showed a reduction in the risk of CVD and 87% of subjects showed improvement in mental and physical health. These analyses suggested that subjects having more risk factors tend to show more improvement than relatively healthier subjects.
We also investigated the relationships between health assessment scores as obtained by surveys using standard questionnaires and biochemical/clinical measures of disease risk, particularly CVD, to see how well they reflect the health status of the individual. General Health Score was correlated with HDL-C, glucose, triglycerides, FRS (Diabetes), 25-hydroxyvitamin D and cholesterol/HDL-C ratio (
p < 1.0 × 10
−4) (
Table 2). Physical Function score also correlated with measures of cardiovascular diseases including augmentation index, sub-endocardial vascular risk ratio (SEVR) and systolic blood pressure (
p < 1.0 × 10
−4). Physical Function score correlated with levels of 25-hydroxyvitamin D and triglycerides which are known to be associated with CVD (
Table 2). Thus, there is a good degree of concordance in health assessment scores and biochemical/clinical measures of cardiovascular health and risks. These scores comprise components which are easily modifiable and preventable, and thus could be used as non-invasive markers to assess health risks.
To investigate whether these scores also indicate improvement in cardiovascular function, we tested the relationship between slopes of traits to identify the factors which vary together (
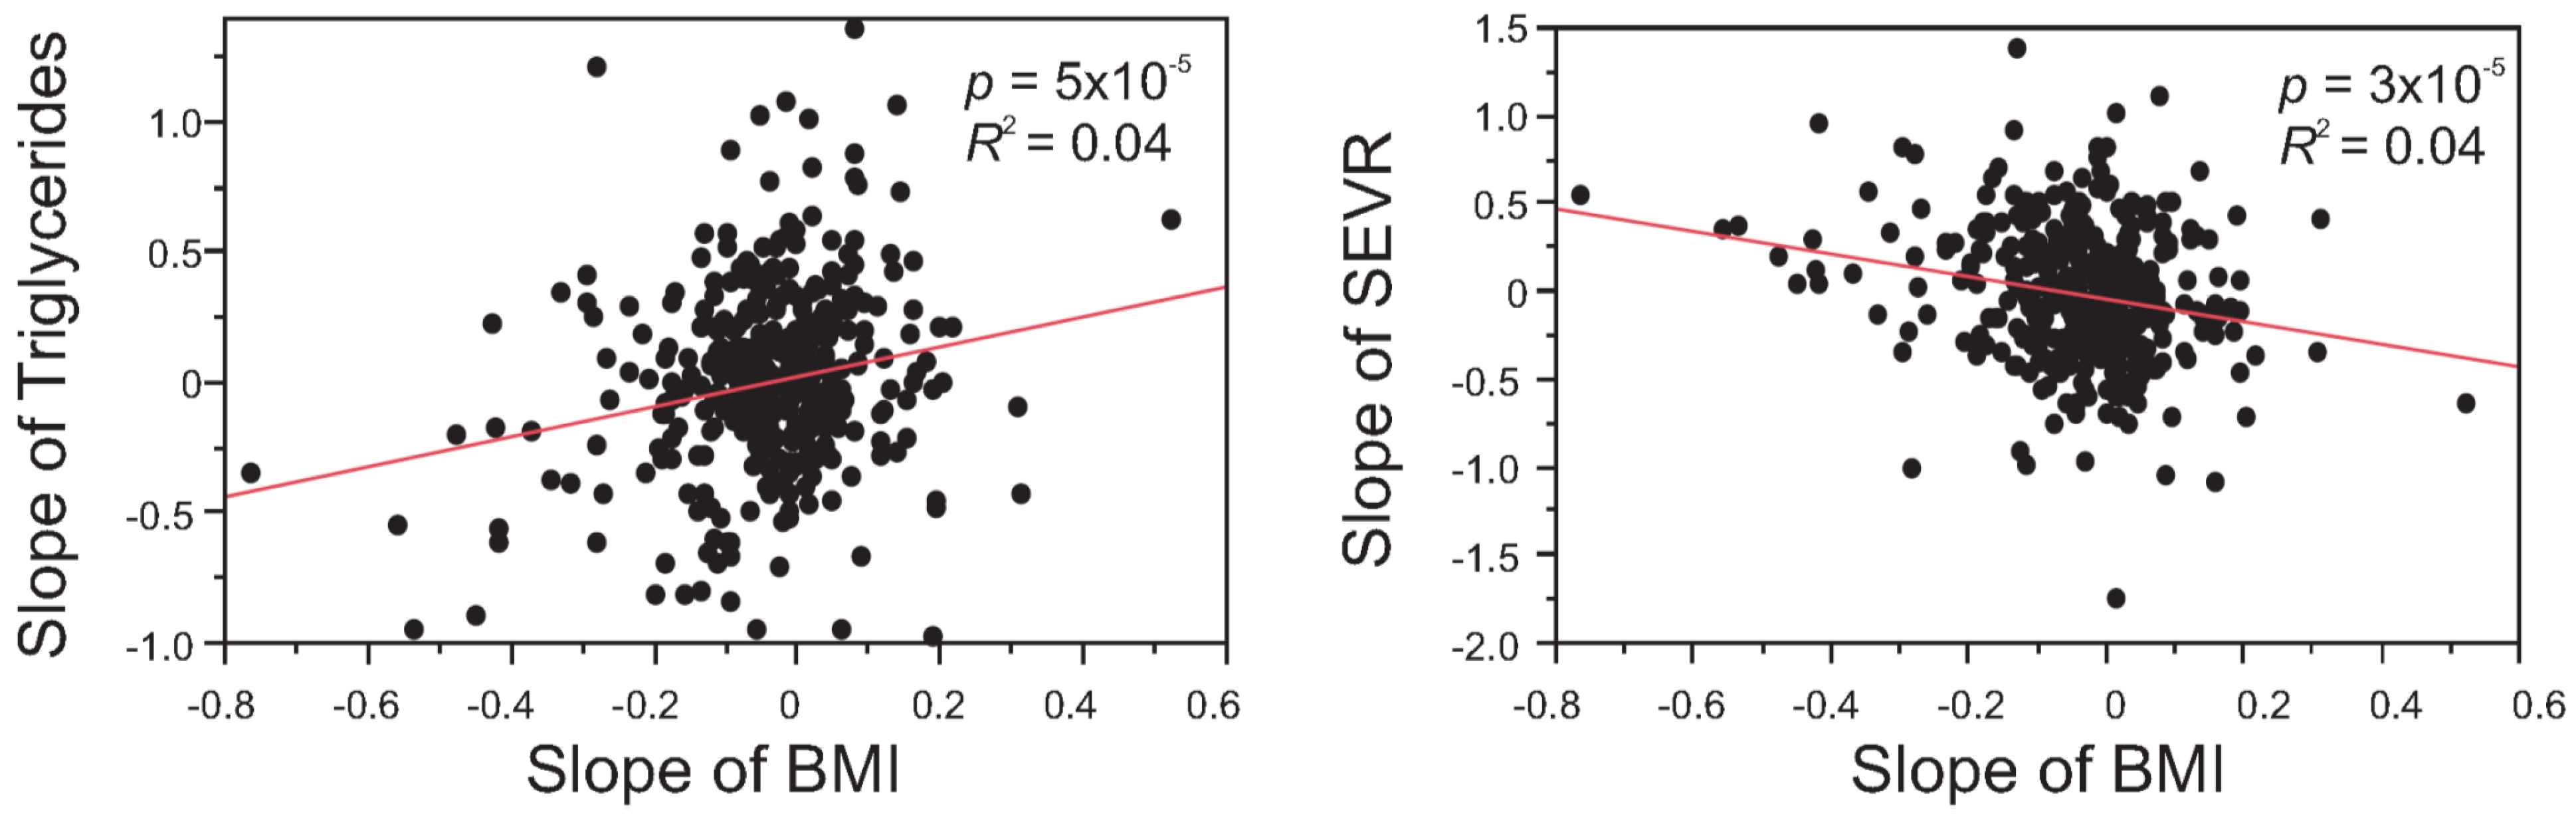
Appendix Table A2). We did not find any significant correlation between the health assessment scores and biochemical/clinical measures or risk factors for CVD. However, the slope of BMI showed the expected negative correlation with the slope of the general health score. Furthermore, the slope of BMI was also correlated with the slopes of risk factors for CVD and diabetes (
Figure 4), suggesting that decrease in BMI is associated with general improvement in health. It is apparent, though, that these correlations are strongly dependent on the most extreme individuals, and that for the majority of participants there is not a significant correlated response in health measures.
Figure 3.
Health improvement in individuals with high CVD risk and low mental and physical health. (A) The plot contrasts the slope for the indicated traits for individuals in the high risk quartile of the trait (green), and the remaining three quarters of the cohort (orange). For 14 of the traits there is a significant difference with the change in the desired direction for all but total glutathione (Total GSH); (B,C) x-y plots of the slope of PC1 for cardiovascular risk factors or mental health respectively, against baseline systolic blood pressure or Beck depression index. Red and blue colors mark individuals in the bottom and top quartiles. A negative slope for PC1 (cardiovascular) implies improving health, and is greater for individuals with high blood pressure at baseline. A positive slope for PC1 (Mental Health) implies improved health, and is greatest for individuals who were more depressed at baseline; (D,E) Plots of the respective slopes by rank, with individuals at combined highest risk of physical and mental disease (in both less healthy quartiles) highlighted, showing enrichment for strong health responses in the desired direction.
![Jpm 04 00489 g003]()
Table 2.
Relationship between health assessment scores and biochemical measures in the entire CHDWB cohort (N = 668) at baseline.
Table 2.
Relationship between health assessment scores and biochemical measures in the entire CHDWB cohort (N = 668) at baseline.
| Health Assessment Score | Biochemical Trait | Pearson Correlation Coefficient | Spearman Correlation Coefficient | Pearson
p-Value |
|---|
| General Health Score | HDL-C | 0.20 | 0.23 | 3.1 × 10⁻⁷ |
| | 25-hydroxyvitamin D | 0.15 | 0.19 | 7.8 × 10⁻⁵ |
| | FRS (Diabetes) | −0.25 | −0.27 | 2.1 × 10⁻¹⁰ |
| | Triglycerides | −0.20 | −0.22 | 1.6 × 10⁻⁷ |
| | Cholesterol/HDL-C | −0.20 | −0.23 | 1.7 × 10⁻⁷ |
| | Glucose | −0.16 | −0.13 | 5.4 × 10⁻⁵ |
| Physical Function Score | SEVR | 0.24 | 0.27 | 8.9 × 10⁻¹⁰ |
| | 25-hydroxyvitamin D | 0.19 | 0.16 | 5.2 × 10⁻⁷ |
| | FRS (Diabetes) | −0.26 | −0.27 | 2.0 × 10⁻¹¹ |
| | Cysteine | −0.26 | −0.27 | 1.5 × 10⁻¹¹ |
| | Glucose | −0.21 | −0.16 | 5.9 × 10⁻⁸ |
| | Systolic B.P. | −0.18 | −0.19 | 3.9 × 10⁻⁶ |
| | Triglycerides | −0.17 | −0.14 | 8.0 × 10⁻⁶ |
| | FRS (CVD) | −0.16 | −0.16 | 3.0 × 10⁻⁵ |
| | Microalbumin | −0.16 | −0.12 | 5.4 × 10⁻⁵ |
| | AIX | −0.16 | −0.11 | 7.3 × 10⁻⁵ |
Figure 4.
Correlation between the slopes of risk factors. (A) Significant positive correlation between change in BMI and change in Triglycerides, largely driven by individuals whose BMI drops (negative slope) also showing reduced triglycerides; (B) Significant negative correlation between slope of sub-endocardial vascular risk ratio (SEVR) and slope of BMI, again indicating improved cardiovascular health in individuals whose BMI decreases overall. p-Values for Pearson correlations are indicated on the figure, corresponding Spearman rank correlations are (A) 0.15 (p = 3.6 × 10⁻³) and (B) −0.19 (p = 2.8 × 10⁻⁴).
In order to assess whether individuals are more likely to improve in health parameters that they self-identify as of high priority, we examined data for a subset of 162 participants for whom notes on discussions with their health-partner (with identities blinded to the research team) were available along with relevant measures, for at least four visits.
Table 3 lists the most common priorities, the number of individuals for whom they were a concern, as well proportion of those individuals for whom the slope of change was in the desired direction, the opposite direction, or unchanged (adopting an arbitrary one quarter of a standard deviation unit in either direction as a threshold for non-neutral slopes). The last two columns compare the percentage of these participants in the self-prioritizing category and the remainder of the subjects in the sample. With the exception of BMI, the trends are all in the direction of a greater response when individuals self-prioritize the trait, but either the difference in proportions or the total sample size is too small to achieve statistical significance in each case. Most notably, body weight (
p = 0.01, Fisher’s exact test, not corrected for multiple comparisons), stress and sleep quality may all improve when targeted by the participant.
Table 3.
Targeted Health Responses in 162 Participants.
Table 3.
Targeted Health Responses in 162 Participants.
| Prioritized Trait | Number | Threshold | Desired | Opposite | Neutral | Proportion | Remainder |
|---|
| Weight | 73 | −0.025 | 31 | 23 | 19 | 42% | 35% * |
| BMI or % body fat | 37 | −0.023 | 16 | 12 | 9 | 43% | 47% |
| Cholesterol | 30 | −0.079 | 15 | 4 | 11 | 50% | 41% |
| Exercise | 95 | | | | | | |
| Diet | 58 | | | | | | |
| Strength | 35 | | | | | | |
| Lipid profile | 10 | | | | | | |
| Vitamins | 8 | | | | | | |
| Blood pressure | 10 | −0.060 | 4 | 4 | 1 | 44% | 42% |
| Calcium | 5 | 0.090 | 3 | 1 | 1 | 60% | 34% |
| Glucose | 5 | −0.030 | 3 | 1 | 1 | 60% | 42% |
| Insulin | 3 | −0.029 | 1 | 1 | 1 | 33% | 19% |
| Bone density | 6 | | | | | | |
| Stress/anxiety (GAD7) | 14 | −0.073 | 9 | 4 | 1 | 64% | 49% |
| Sleep | 22 | −0.067 | 13 | 2 | 6 | 62% | 50% |
| Other | 23 | | | | | | |
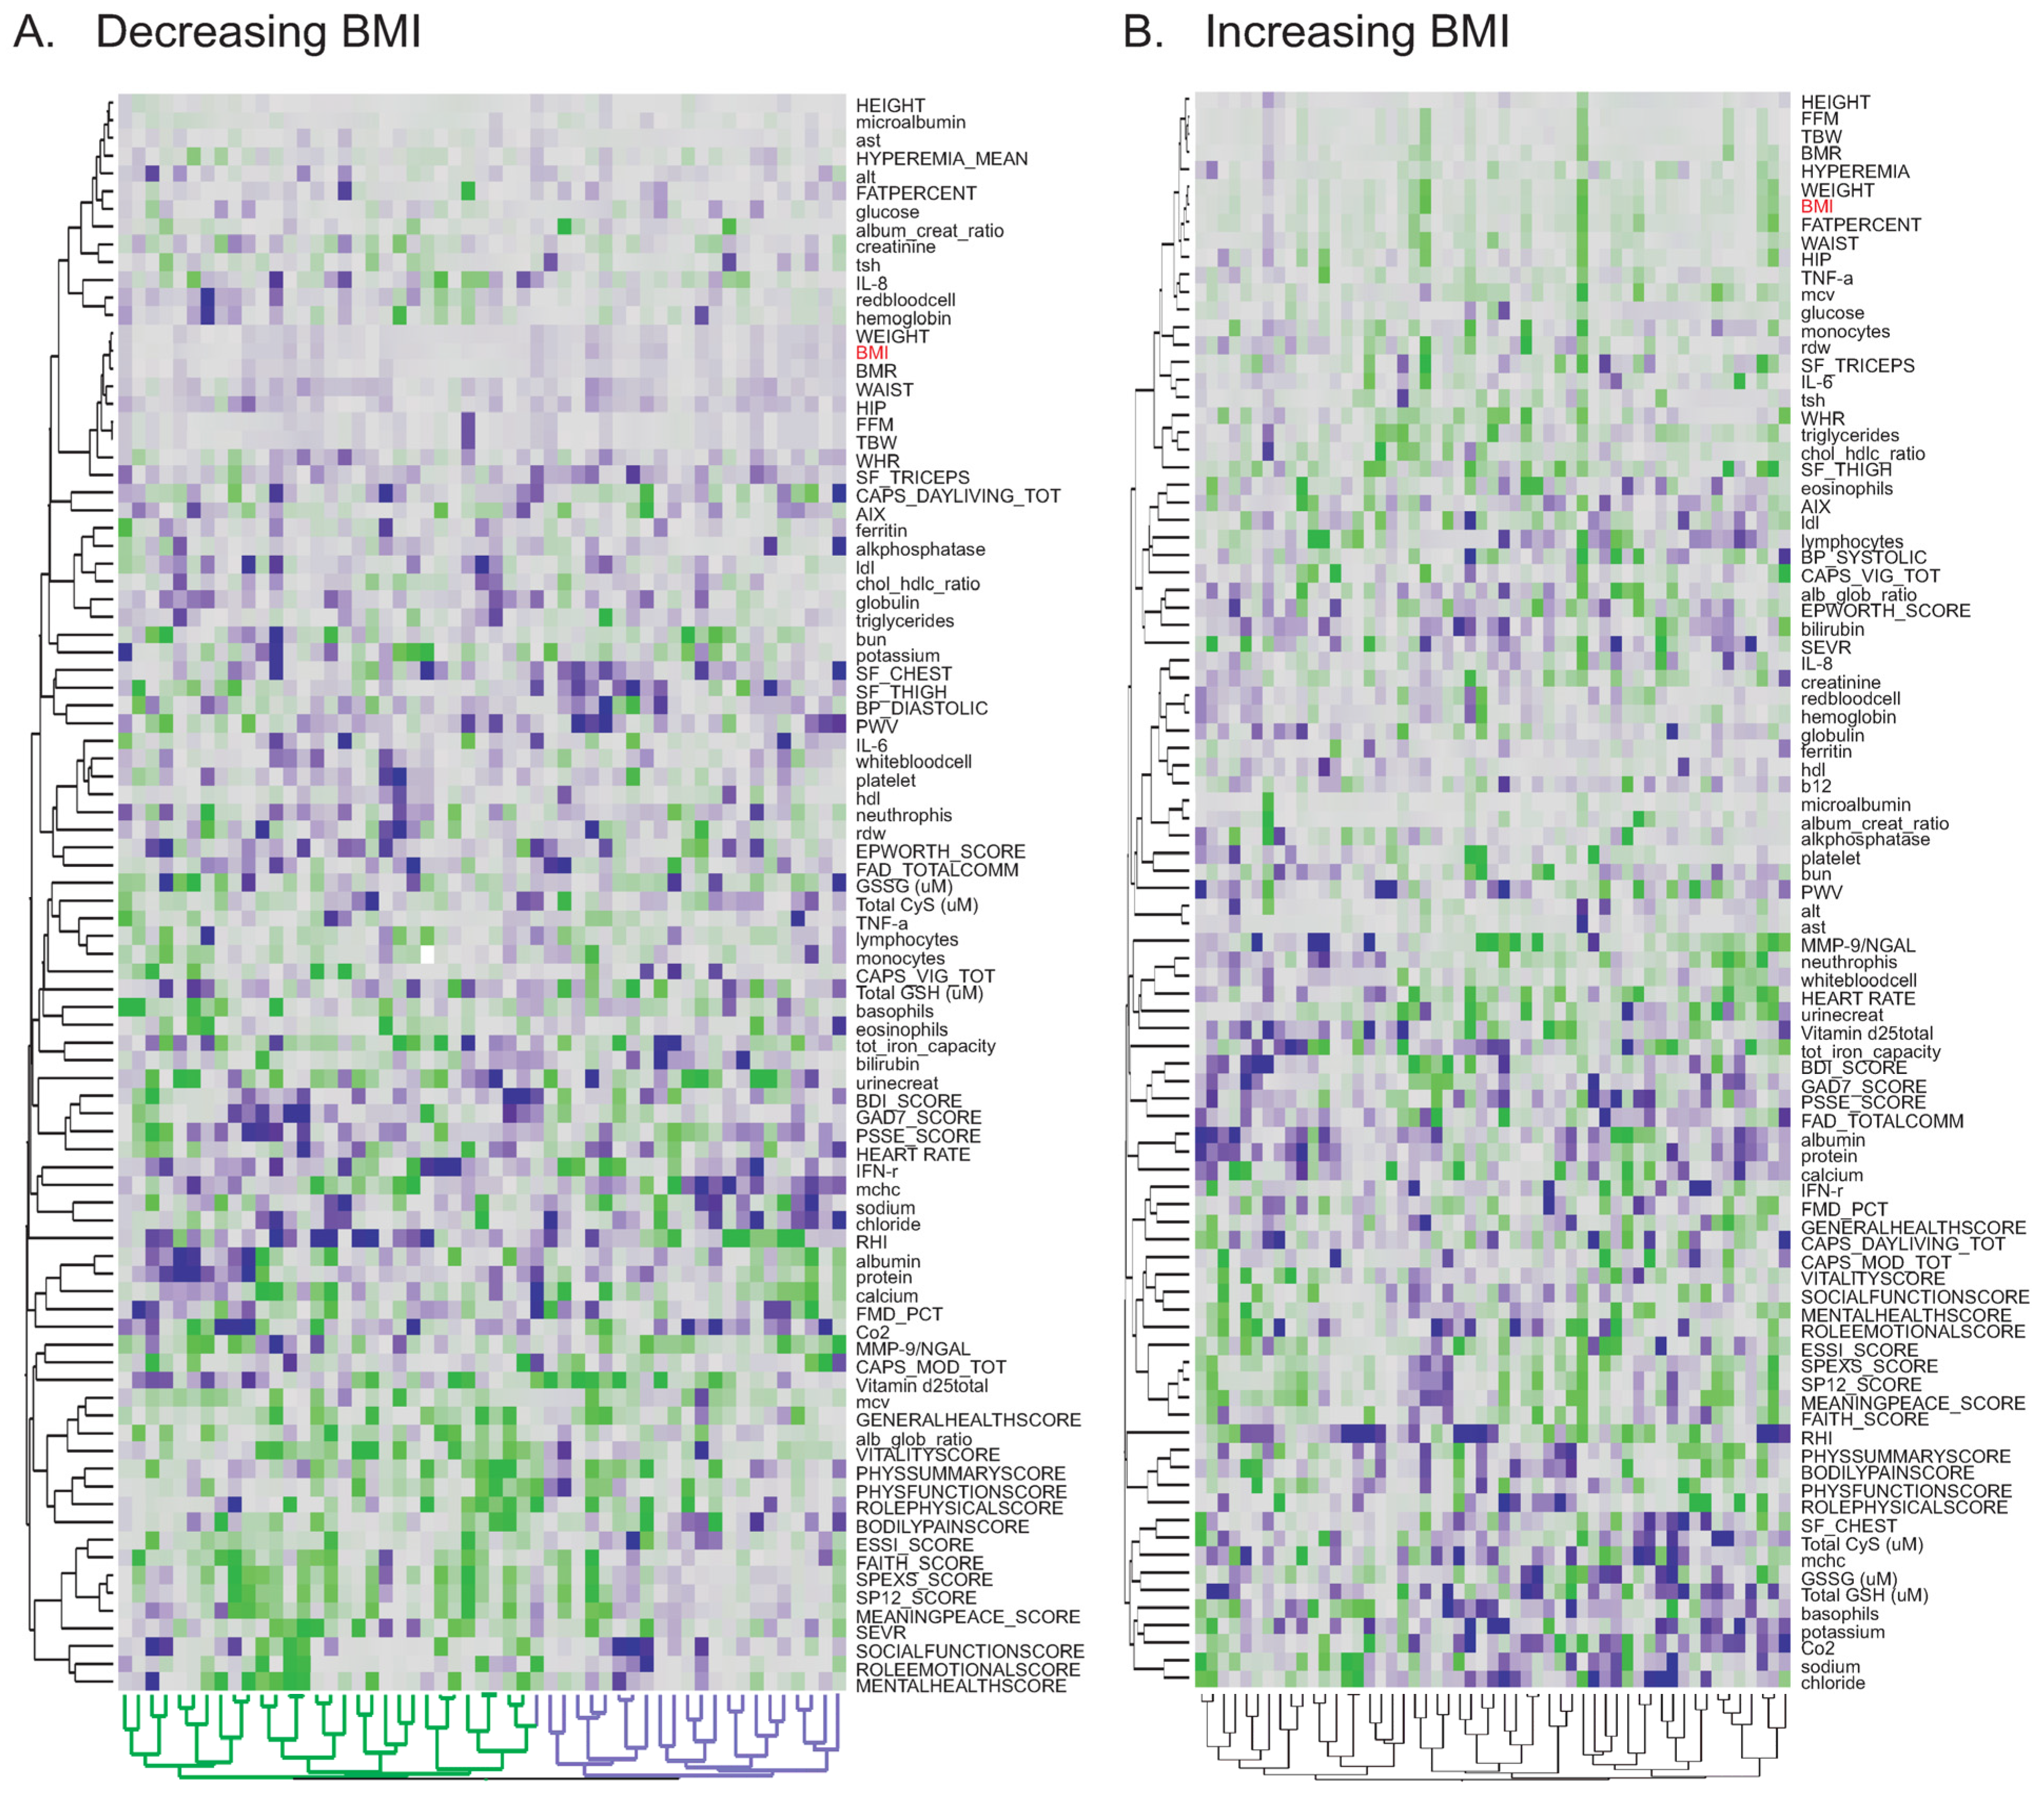
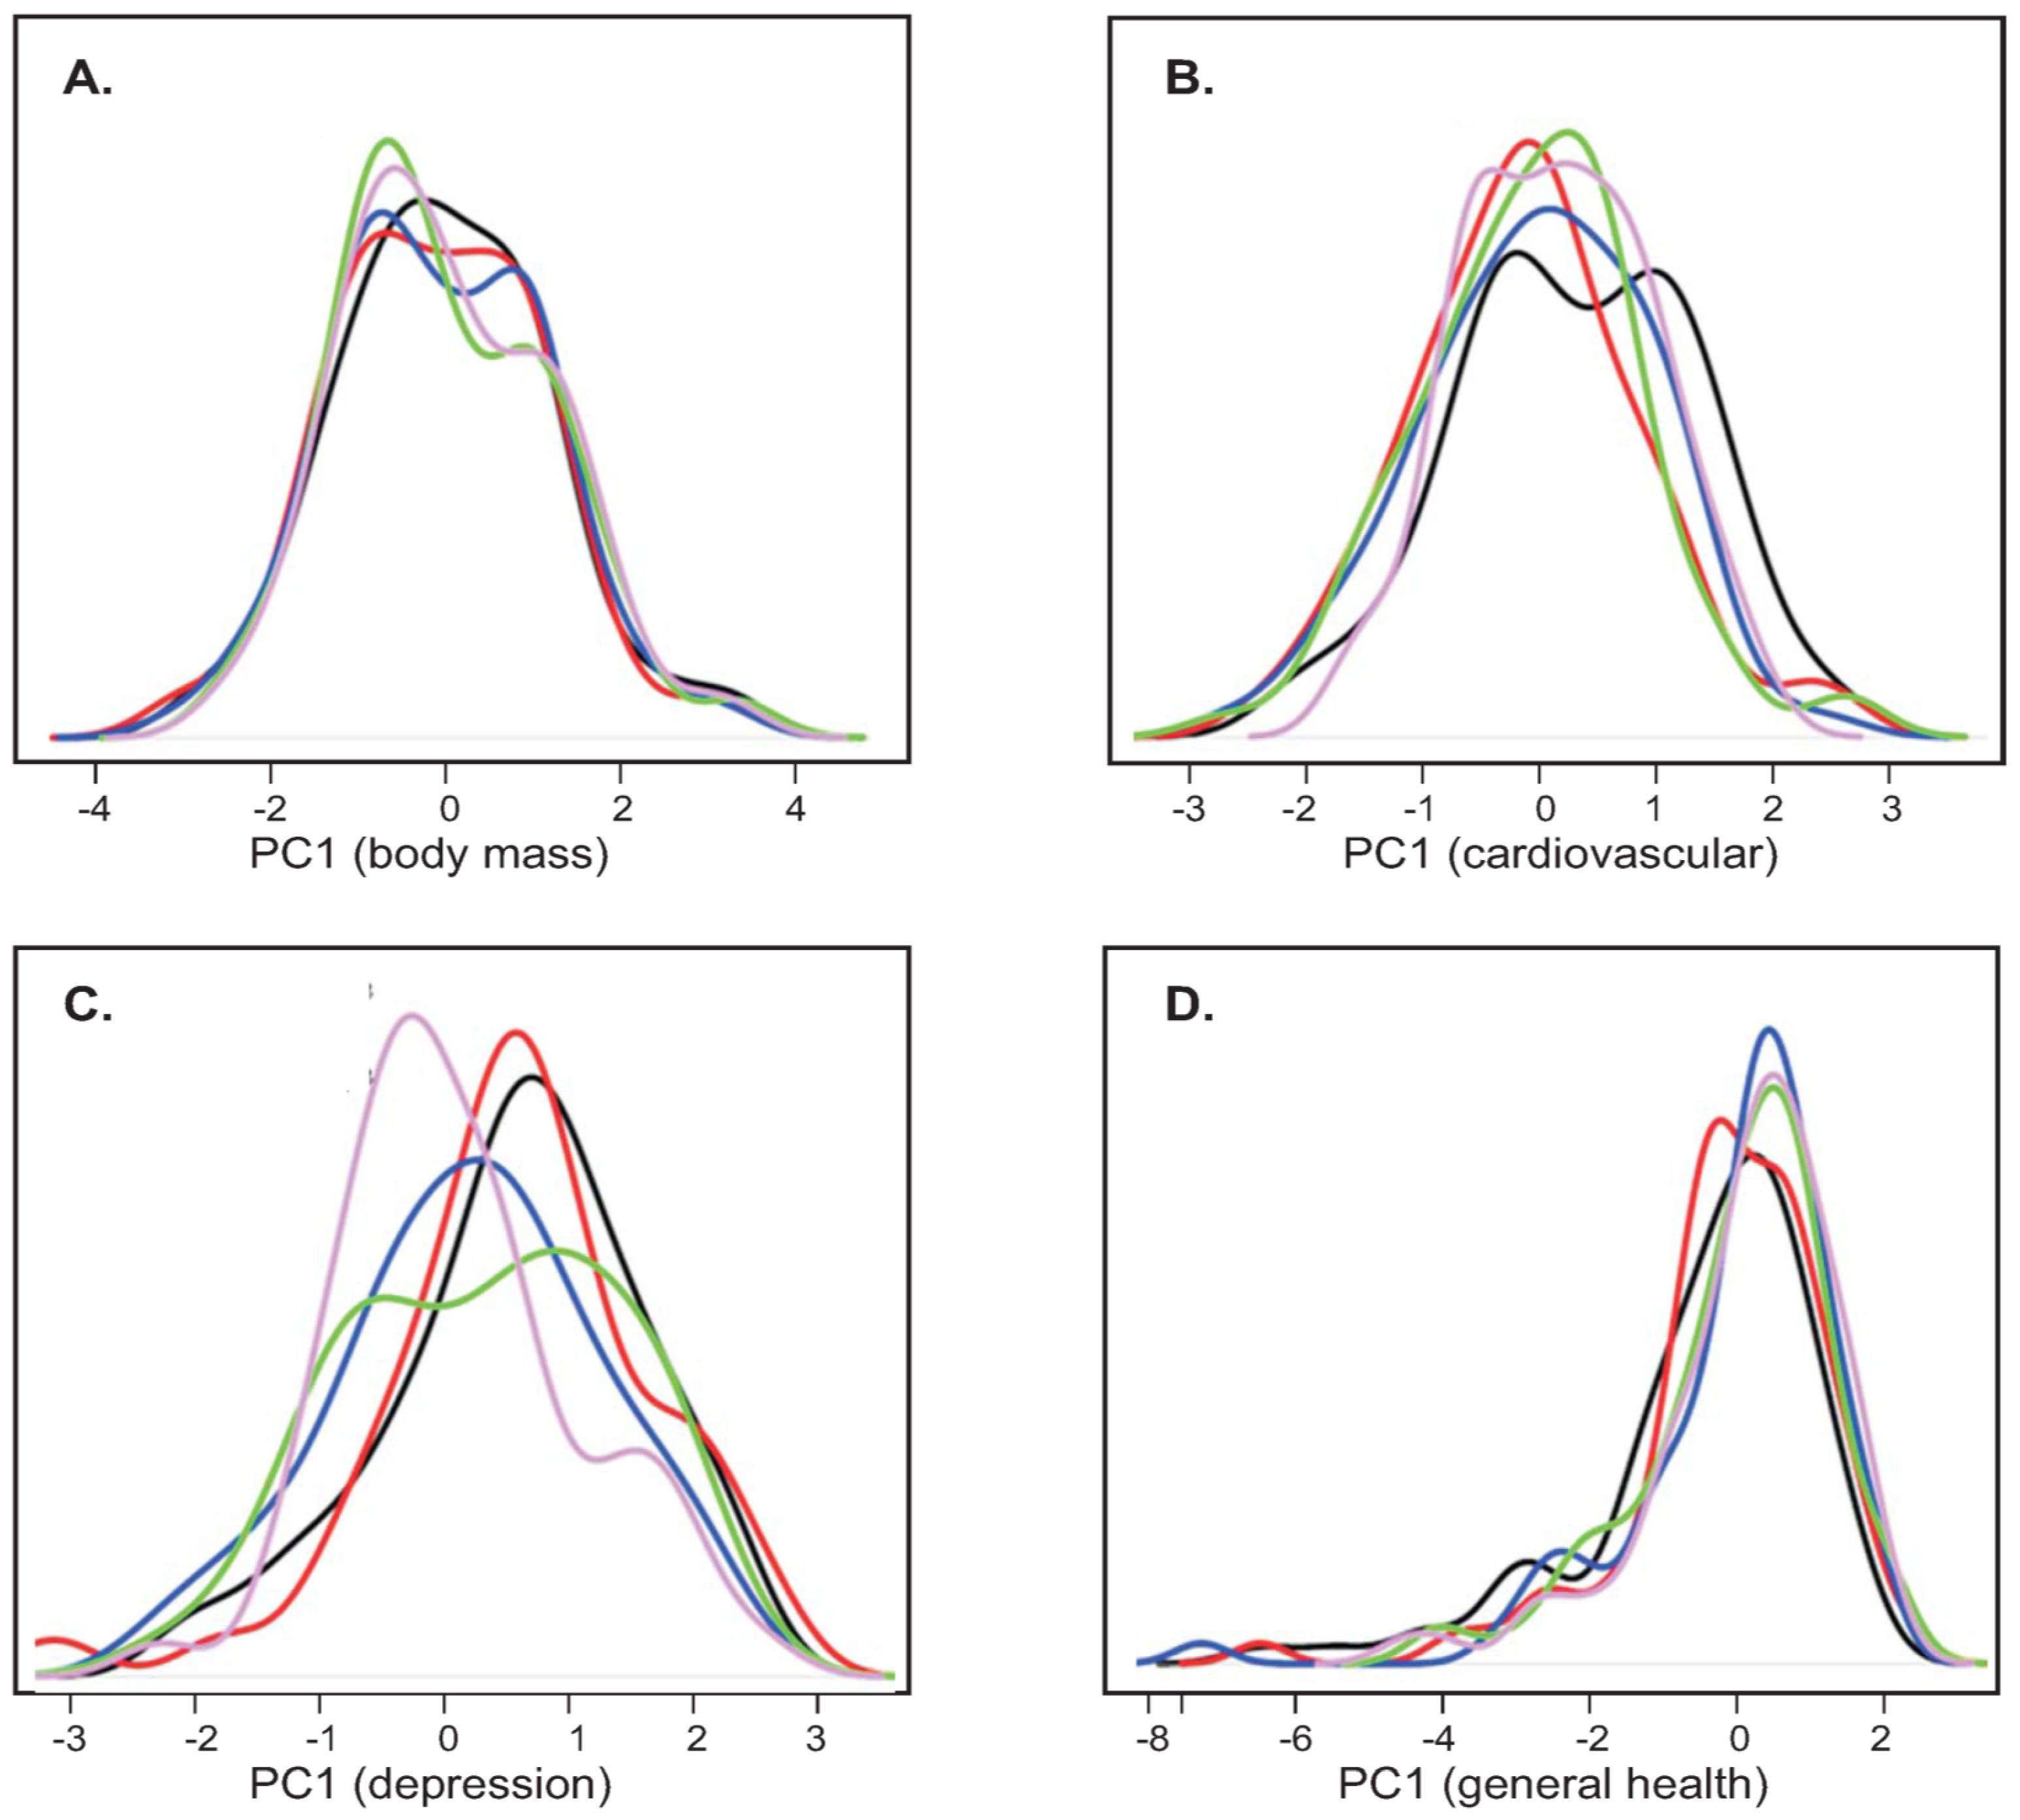
The overall trends for health improvement are encouraging; however follow-up examination of the full cohort will be required to see the long term effect of the program and to quantify the tendency of participants to maintain more healthy lifestyles. We nevertheless performed preliminary analysis of longitudinal data for 83 participants who had completed three year follow-up. As projected in kernel density plots in
Appendix Figure A1, the improvement of most of the traits was maintained for at least three years of follow-up. Notably, a continuously decreasing trend in Beck depression score and associated improvement in mental health of the participants from baseline to Year 2 (green) and Year 3 (pink) follow-up was observed. A similar trend was also seen for physical health of the participants. Though a larger dataset for three year follow-up will solidify these conclusions, the analyses reported here suggest that the findings of one year follow-up may be extrapolated for longer terms, highlighting the potential of programs such as CHDWB for the prevention of chronic disease.


